Residential electricity package model considering load difference penalty in China
 Xiuna Zhou1
  Yan Chu
- 1Shanghai Lixin University of Accounting and Finance, Shanghai, China
- 2Hefei University of Technology, Hefei, China
The increasing load difference between peak and off-peak seasons has led to the unstable operation of China’s power systems in recent years. In addition, the current electricity package structure system of China, which is gradually liberalizing its electricity market, remains imperfect. This paper establishes a model of residential electricity packages that considers load difference penalty during peak and off-peak seasons. First, consumers’ utility of different packages is established and thus the optimal is determined by maximizing the utility function. Then, a mathematical model focusing on the minimization of load difference of retail electricity packages during peak and off-peak seasons is established. We thus design a particle-swarm based algorithm to solve the problem. Through simulation results of several numerical examples, we demonstrate that the profit of retailer is increased by 37.35% and Load difference during peak and off-peak seasons is reduced by 78.01%, improving the power demand curve of users and the operation efficiency of power systems.
1 Introduction
The stability of system operation and the utilization rate of power equipment have been constantly reduced in the past few years due to the increase in load difference between peak and off-peak seasons, resulting in large-scale blackouts (Sun et al., 2017). Several blackouts have occurred in the past due to the gap between the supply and demand of electricity at peak electricity demand. These blackouts play significant negative effects in the society, including traffic and communication interruptions, social chaos, and factory closure. Power plants should typically increase their power generation capacity to meet the peak power demand. High marginal cost generators are used to provide peak load (Zakariazadeh et al., 2014). With an increase in peak demand, particularly during the period when load is close to the power supply capacity of a power system, the increased high cost risk directly leads to a rise in the power consumption cost of users, system failure, and low economic efficiency (Khodaei et al., 2011). Retailers should maintain power grid balance under ideal conditions to ensure the stable and safe operation of power grids. If power plants generate electricity strictly in accordance with market demand, then they must increase power generation during peak season and reduce it during off-peak season; this scenario leads to a considerable waste of energy and low efficiency in power production (White and Zhang, 2011; Chan et al., 2012).
The seasonal shortage of power supply aggravates the contradiction between the supply and demand of electricity over the last few years, seriously threatening the safe and stable operation of power grids. Intuitively, changing the traditional operation and planning mode of power systems is an urgent issue that must be addressed to improve the efficiency of power grid operation and promote the rational allocation of resources. The imbalance in power supply and demand can be solved by mobilizing demand-side resources (Lu and Hong, 2019). Demand response (DR) plays an important role in the competitive power market, and it can support the improvement of power system stability and the high-speed operation of the power market. DR is defined as “changes in electric usage by end-use customers from their normal consumption patterns in response to changes in the price of electricity over time, or to incentive payments designed to induce lower electricity use at times of high wholesale market prices or when system reliability is jeopardized” (Borlease, 2013). Thereafter, users can spontaneously change their electricity consumption habits in accordance with the electricity price or incentive measures formulated by the operator to obtain the greatest economic benefits (Allameh et al., 2019). Therefore, DR offers efficient solutions for power market by means of an incentive-based policy in which participating users receive incentives in the form of direct compensation and discount offers in general (Rezaee Jordehi, 2019; Vuelvas and Ruiz, 2019). Furthermore, the implementation of DR increases the efficiency of power system operation and reduces the number of blackouts. Many countries worldwide recognize the positive role of DR and have developed DR projects. In the beginning, DR has been used to help users adjust their electricity consumption behavior from the beginning; since then, it has developed rapidly into an important mechanism; DR can be adopted in the power market competition to maximize the interests of power customers, power plant operators, and other stakeholders (Luo et al., 2019). However, current research on DR has not involved encouraging users to change their electricity consumption behavior to reduce load difference between peak and off-peak seasons.
The number of power retailers in China has increased rapidly with the deregulation of its retail power market (Zeng et al., 2016; Liu et al., 2019; Zhao et al., 2021). As new participants enter the market, power consumers can choose from different retailers (Yang, 2014). In the face of the increasingly fierce competition in the power market, power retailers have designed diversified retail price packages to adapt to the market environment and meet the differentiated needs of consumers to improve their economic benefits (Zhang et al., 2019). The electric power retail market in China is developing gradually, and determining how reasonable packages can occupy the market is still in the exploration stage.
In view of the aforementioned problems, the current study designs a model of residential electricity packages that considers the penalty of load difference between peak and off-peak seasons. A penalty coefficient is set for the price of electricity consumption that exceeds package quantity. The utility of different packages to users is analyzed on the basis of the average monthly electricity consumption and electricity value of users. The probability of users choosing various packages is obtained by selecting the packages with maximum utility. The objective is to minimize the load difference between peak and off-peak seasons without reducing profit as the constraint. The simulation results of the data of residents’ electricity consumption in a certain area in China show that the utility of users’ electricity consumption is improved. The load difference between peak and off-peak seasons is considerably reduced, and the curve of users’ power demand is smooth. With the opening of the electricity market, some power retailers have focused on the benefits of setting up packages. Therefore, the current study compares and analyzes the effect of power packages considering the penalty of load difference to maximize the profits of retailers. The results show that retailers obtain higher profits and the load difference between peak and off-peak seasons is reduced to a certain extent.
The remaining parts of this paper are organized as follows: Section 2 provides a review of literature. Section 3 introduces the user utility model considering the penalty mechanism, including model hypothesis, and option probability. Section 4 establishes the model of residential electricity packages considering the penalty mechanism. Section 5 introduces the numerical study, including input data, simulation results. Finally, Section 6 presents the conclusion of this paper.
2 Literature review
For most countries, adequate and stable power supply plays an important role in economic development (Hamdi et al., 2014). Ming et al. (2016) proposed that China attaches great importance to the development of the power industry. Since 2015, the “power reform No. 9 document” and supporting documents have been promulgated. The liberalization level of retail power market in China has been constantly improved, the user selection right of retail power market has gradually opened, and diversified power retail competitors have emerged rapidly (Lin et al., 2019a; Lin et al., 2019b; Yang and Faruqui, 2019). Many scholars have made great efforts in the research of the retail market of electric power (Bartelj et al., 2010; Ghazvini et al., 2015; Kharrati et al., 2016; Youn and Jin, 2016). Bae et al. (2014) reported that competition in the retail power market is beneficial to retailers and the environment. Hartley et al. (2019) found that liberalizing the electricity market can reduce the cost of retailers by studying the electricity consumption data of Texas. Wu and Zhang (2017) observed that competition in power supply and retail liberalization can lead to a fall in electricity prices in Singapore’s retail market. Peng and Tao (2018) proposed an interregional power trading model for analyzing the behavior of power retailers in the spot market. Ghazvini et al. (2019) assessed the performance of liberalization of Portugal’s retail power market. They found that the retail market is still highly concentrated despite the high conversion rate of users. Fontana et al. (2019) analyzed the switching behavior of the Italian power retail market.
Other related streams of literature have focused on DR. The implementation of DR projects can cause users to reduce or transfer load during peak period, alleviating the tense situation of power resource supply in the power market environment. DR makes an important contribution to the adequacy of power system resources, and it can be regarded as the shock absorber of the power market. It can lower peak electricity price, reduce price fluctuation, smoothen users’ load curve, and enhance system reliability (Critz et al., 2013; Fei et al., 2017; Guo et al., 2017). At present, scholars at home and abroad have conducted numerous studies on the electricity price design scheme based on DR and achieved some results. The peak demand can be reduced by changing the power consumption mode of users, so as to reduce the high cost of generators to meet the peak demand. At the same time, this process improves the reliability of the power system and the users service (Hatami et al., 2016; Lin et al., 2017; Nojavan et al., 2017). NwuluNnamdi and Xia (2015) integrated a game theory into the dynamic economic emission dispatch considering DR. Stavrakas and Flamos (2020) pointed out that in peak demand period, suppliers build factories with high marginal cost to meet the additional demand, thereby increasing the electricity cost of users. Therefore, in the peak period, the economic balance between users and suppliers can be achieved through DR. Yalcintas et al. (2015) found that if the working hours of the office building are advanced by 1 h, the energy use in peak period can be reduced, and the power cost can be decreased by 1–3%. Dynamic pricing enables users to implement new saving measures to reduce costs, such as thermal storage systems. Yan et al. (2015) studied how to realize DR by implementing dynamic pricing mechanism. Their results encourage smart grid consumers to change their electricity consumption mode in accordance with the change in electricity price. Li et al. (2017) considered DR using load transfer technology. Such DR typically transfers schedulable devices from peak period to off-peak period.
In summary, although the construction of the electricity retail market and the DR of the electricity industry have been widely studied, current research has not included a power scheme for reducing the load difference of users between peak and off-peak seasons. Seasonal power supply shortage aggravates the contradiction between supply and demand and seriously threatens the safe and stable operation of power grids. Among loads that can participate in DR, residential load has the highest potential and can effectively ameliorate the demand-side load curve (Rieger et al., 2016; Liao and Li, 2018). With the continuous improvement of China’s electricity market reform, residential users will become the service objects of power retailers in the future electricity market. Therefore, this paper has three main contributions in comparison to the previous studies. First, this paper proposes a residential power package model based on residential electricity utility. Second, power retailers provide multiple power packages for residents to improve their electricity utility. Further, this paper reduces the load difference of users in peak and off-peak seasons, smooths the power consumption curve, and improves the system stability without affecting the cost of reducing profits.
3 Consumer utility model considering penalty mechanism
The most effective package is selected by establishing a utility function for the average electricity consumption during peak and off-peak seasons and the electricity value of users. The electricity consumption of users typically exceeds package quantity during peak season, whereas package quantity has a surplus during off-peak season. Users can control their electricity consumption during peak season by increasing the penalty coefficient, and thus, reduce load difference between peak and off-peak seasons.
3.1 Model assumption
In view of the current power policy and package mode in China and the characteristics of actual residential power consumption, the following assumptions are made for the model.
1) This study assumes that a single power retailer purchases electricity from the spot market and resells power to consumers by making reasonable electricity packages.
2) Considering the basic time unit of China’s electricity packages, this work sets month as the span unit of packages. The monthly surplus of an electricity retailer is zero because current electricity cannot be stored. A retailer’s income is calculated on an annual basis. Users select the same package every month because the utility function is obtained on the basis of average monthly electricity consumption.
3) The electricity consumption of residents has an extremely small lower limit, which is disregarded in the proposed model, i.e., zero is the lower limit. The upper limit of monthly electricity consumption is set in accordance with specific data.
3.2 Option probability
The value of unit electricity for different users is different. Assuming that the value of unit electricity for users is evenly distributed (Siano and Sarno, 2016).
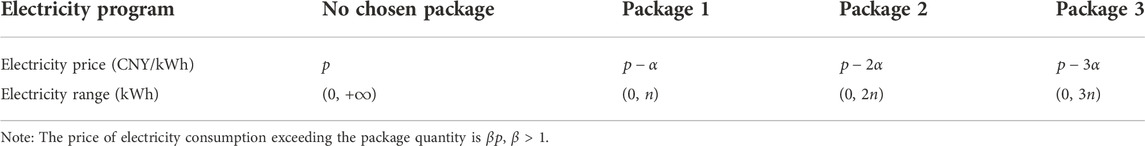
TABLE 1. The settings of each package plan.
The average monthly electricity consumption of users can be expressed as the average monthly electricity consumption of users during peak and off-peak seasons.
Electricity consumption during peak season is higher than that during off-peak season, i.e., Y > X.
1) When Z > 3n,
Therefore,
Similarly,
2) When
From
From
Therefore, when
When
For the rationality of package setting, we assume that
Similarly,
Therefore, given
3) Similarly, users choose Package 2 when
4) Moreover, users do not select any package when
Different packages are selected on the basis of users’ average monthly electricity consumption, as indicated in Table 2.
• From

TABLE 2. Different packages are selected on the basis of the average monthly electricity consumption of users.
As shown in Figure 1, the average monthly electricity consumption of residents during peak and off-peak seasons and the upper limit of the monthly electricity consumption of residents are divided into regions to determine users who choose Package 3. From the electricity consumption data of a certain area used in the calculation example of this study, the upper limit of monthly electricity consumption is assumed in Eq. 2. We have verified that when the critical point is exceeded, most users will choose Package 3. For the rationality of package setting, the upper limit is assumed to be less than this critical point.
• From
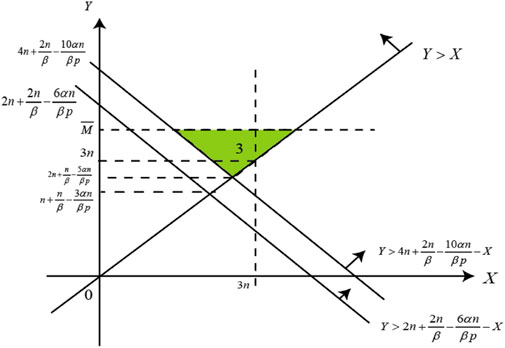
FIGURE 1. Users who choose Package 3.
As shown in Figure 2, the average monthly electricity consumption of residents during peak and off-peak seasons and the upper limit of the monthly electricity consumption of residents are divided into regions to determine users who choose Package 2.
• From
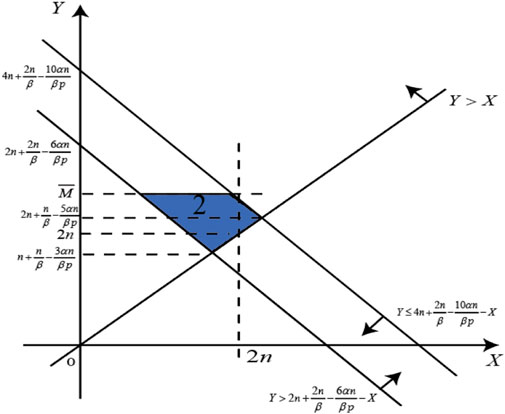
FIGURE 2. Users who choose Package 2.
As shown in Figure 3, the average monthly electricity consumption of residents during peak and off-peak seasons and the upper limit of the monthly electricity consumption of residents are divided into regions to determine users who choose Package 1.
• From
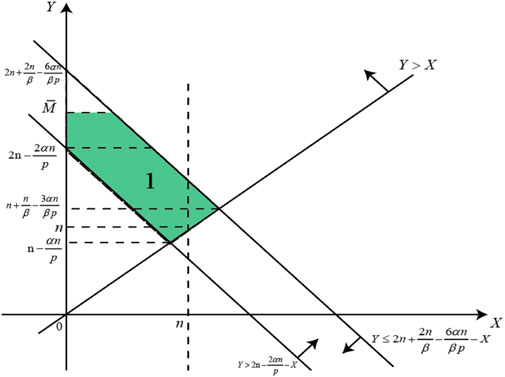
FIGURE 3. Users who choose Package 1.
As shown in Figure 4, the average monthly electricity consumption of residents during peak and off-peak seasons is divided into regions to determine users who do not choose any package.
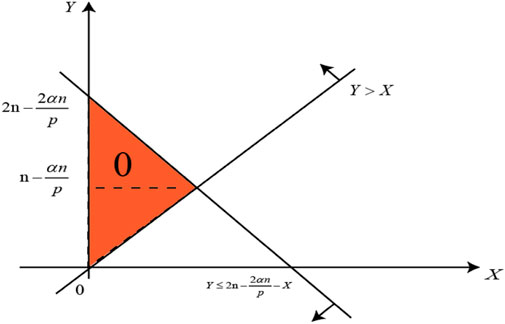
FIGURE 4. Users who do not choose any package.
Set
From Figure 1, the probability of choosing Package 3 is
From Figure 2, the probability of selecting Package 2 is
From Figure 3, the probability of choosing Package 1 is
From Figure 4, the probability of not choosing any package is
In accordance with the preceding calculation formulas, the probability of selecting packages is the value obtained by dividing the area of the selected package with the entire area.
4 The model of residential electricity packages
The selection probability of electricity packages can be obtained from the aforementioned electricity utility during peak and off-peak seasons. After determining the probability of each package, the monthly expected profit and expected electricity consumption during peak and off-peak seasons can be calculated. The objective function is to minimize load difference between peak and off-peak seasons without affecting the cost of reducing profits.
Set
Where g (y) is probability density function of average monthly electricity consumption in peak season, and f (x) is probability density function of average monthly electricity consumption in off-peak season.
As shown in Area 3 of Figure 1, the retailer’s expected profit per user of choosing Package 3 every month during peak season is
The expected monthly power consumption per user of Package 3 during peak season is
The retailer’s expected profit per user of choosing Package 3 every month during off-peak season is
The expected monthly power consumption per user of Package 3 during off-peak season is
On the basis of Area 2 in Figure 2, the retailer’s expected profit per user of choosing Package 2 every month during peak season is
The expected monthly power consumption per user of Package 2 during peak season is
The retailer’s expected profit per user of choosing Package 2 every month during off-peak season is
The expected monthly power consumption per user of Package 2 during off-peak season is
From Area 1 in Figure 3, the retailer’s expected profit per user of Package 1 every month during peak season is
The expected monthly power consumption per user of Package 1 during peak season is
The retailer’s expected profit per user of choosing Package 1 every month during off-peak season is
The expected monthly power consumption per user of choosing Package 1 during off-peak season is
Considering Region 0 in Figure 4, the expected profit per user of not selecting any package every month during peak season is
The expected monthly power consumption per user of not selecting any package during peak season is
The expected profit per user of not selecting any package every month during off-peak season is
The expected monthly power consumption per user of not selecting any package during off-peak season is
The expected monthly profit per user during peak season
Where
The expected monthly electricity consumption per user during peak season
where
The expected monthly profit per user during off-peak season
Where
The expected monthly consumption per user during off-peak season
where
Therefore, the expected profit for a year for packages sets by an electricity retailer is
Without any package, the expected monthly electricity consumption of users during peak season is
Without any package, the expected monthly electricity consumption of users during off-peak season is
The expected profit for a year without any package is
Limiting load difference between peak and off-peak seasons is necessary to improve the load shape of residents and increase the operating efficiency of a system. The objective function of the mathematical model is
5 Numerical study
5.1 Data
On the basis of the load data of 10,000 residents of a city in China, the current study uses maximum likelihood estimation to calculate the average power consumption during peak season
5.2 Simulation results
The values of the relevant parameters of the model are obtained in accordance with the aforementioned data. The particle swarm optimization algorithm is edited on Python software to solve the package model. When minimizing load difference between peak and off-peak seasons, the decision variables are the discount coefficient of electricity price, the electricity quantity of Package 1, and the price penalty coefficient for electricity consumption that exceeds package quantity. The best fitness function is minimizing the load difference between peak and off-peak seasons. The iterative process is illustrated in Figure 5.
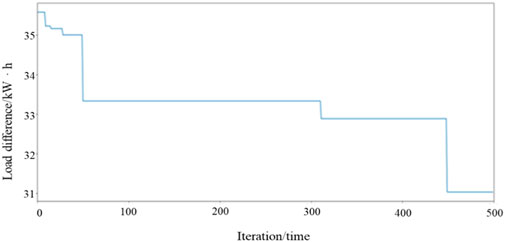
FIGURE 5. Particle swarm optimization convergence process.
As shown in Table 3, the prices of Packages 1, 2, and 3 decrease by 9.9, 19.8, and 29.7% respectively, and residents can save 32.076, 128.304, and 288.684 CNY, respectively, by buying these packages. This finding can encourage users to use more electricity and increase the profits of retailers. The price of electricity consumption that exceeds package quantity is 128.80% of the electricity price without selecting any package, 142.95% of Package 1’s electricity price, 160.60% of Package 2’s electricity price, and 183.21% of Package 3’s electricity price to restrict users from consuming electricity included in the packages as much as possible and reduce load difference between peak and off-peak seasons.
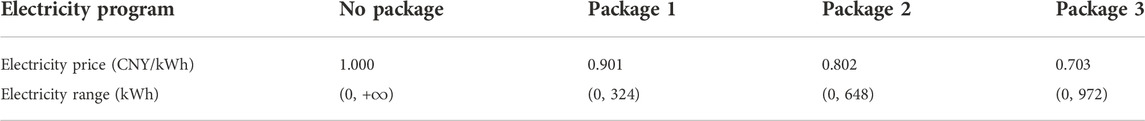
TABLE 3. Settings of each package plan.
The settings of the various packages listed in Table 4 provide users with many choices. Residents can choose the appropriate package in accordance with their average monthly electricity consumption, which is no longer the traditional unified electricity price, to improve electricity utility.

TABLE 4. Choosing from different packages on the basis of users’ average monthly electricity consumption.
As shown in Figure 6, 83% of the users choose to buy packages, and only a few users opt not to buy a package, indicating that the settings of the packages are extremely attractive to users. Most users choose Package 2, followed by Package 1. Such choice is related to the peak distribution of power consumption.
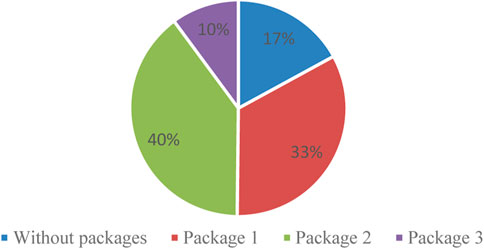
FIGURE 6. Probability of users choosing packages.
As shown in Figure 7, the expected power consumption of users with packages is higher than that of users without packages, particularly during off-peak seasons, indicating that users with packages are encouraged to use more power. Load difference during peak and off-peak seasons is reduced by 78.01%, improving the power demand curve of users and the operation efficiency of power systems.
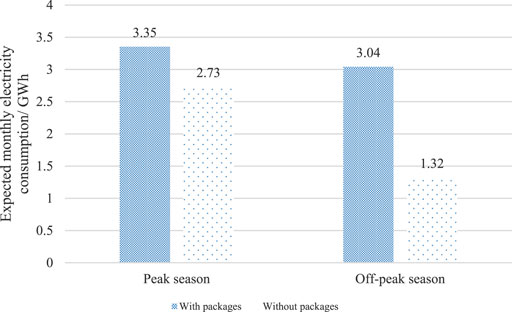
FIGURE 7. Comparison of electricity consumption with and without packages.
The profits of retailers with and without packages are calculated in Table 5. The set of packages increases the profits of electricity retailers by 27.88% during peak season and 50.46% during off-peak season. Overall profit was increased by 37.35%. Therefore, the retail packages of residents during peak and off-peak seasons provide them with many choices and reduce load difference without reducing profits by considering the penalty of load difference. This condition is extremely beneficial for the stability of power systems and the long-term development of electricity retailers.
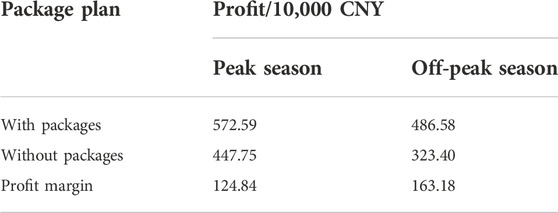
TABLE 5. Profits with and without packages.
5.3 Comparison results
With the deregulation of the market on the retail side of China’s power industry, power retailers provide electricity packages to electricity users to ensure their market share and sustainable profitability. When an electricity retailer focuses on the benefits of providing packages, the load difference penalty is disregarded. In particular, the price of electricity consumption that exceeds package quantity is set as the benchmark price p on the basis of residential electricity packages that consider penalty for load difference between peak and off-peak seasons. The utility of different packages to users is analyzed in accordance with their average monthly electricity consumption and electricity value, and the best package is selected via utility function maximization. The cost–benefit model of the retail power package is established on this basis. Similarly, the discount coefficient of the price of decision variable
In the model of residential electricity packages that does not consider the penalty mechanism of load difference between peak and off-peak seasons, the price of electricity consumption that exceeds package quantity is 1 CNY/kWh. Meanwhile, the price of electricity consumption that exceeds package quantity when the penalty mechanism is considered is 1.288 CNY/kWh. The latter is 28.800% higher than the former. As shown in Figure 8, the electricity prices of Packages 1, 2, and 3 with the penalty mechanism are 4.149, 8.864, and 14.268%, respectively, which are lower than those without the penalty mechanism. The electricity quantity of Packages 1, 2, and 3 with the penalty mechanism is 9.459% higher than that of Packages 1, 2, and 3 without the penalty mechanism.
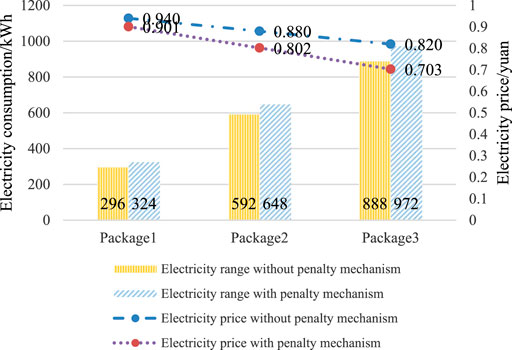
FIGURE 8. Price and quantity of electricity packages with and without the penalty mechanism.
As shown in Figures 9, 10, many users do not choose an electricity package in the former by comparing electricity packages with and without load difference penalty. In particular, 17% of the former and 15% of the latter do not choose packages. However, increasing the penalty coefficient encourages users to choose packages with more quantity. Among the packages that consider the load difference penalty mechanism, 11.111 and 17.647% more users choose Packages 3 and 2, respectively, than those that do not consider the load difference penalty mechanism.
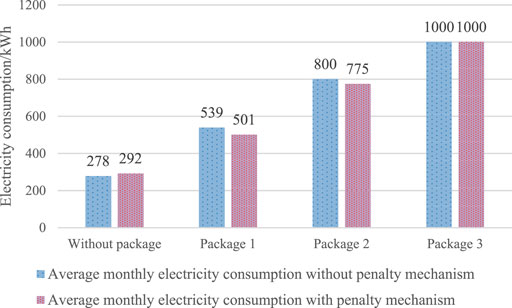
FIGURE 9. Different packages selected in accordance with the average monthly electricity consumption of users with and without the penalty mechanism.
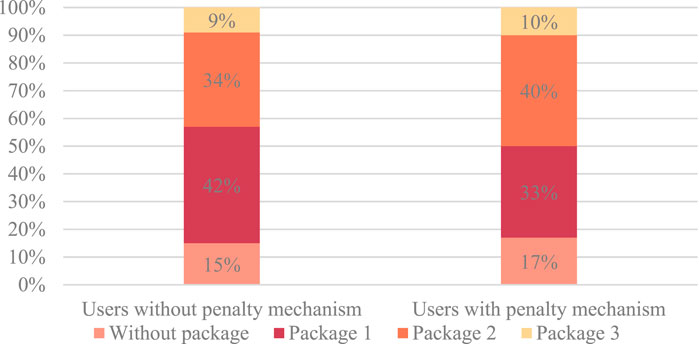
FIGURE 10. Probability of users choosing different packages with and without the penalty mechanism.
As shown in Figures 11, 12, the load difference in residential electricity consumption packages that do not consider the penalty of load difference during peak and off-peak seasons is reduced from 141 kWh to 60 kWh. When the penalty is considered, the load difference is decreased from 141 kWh to 31 kWh. The latter reduces load difference by 35.802% more than the former.
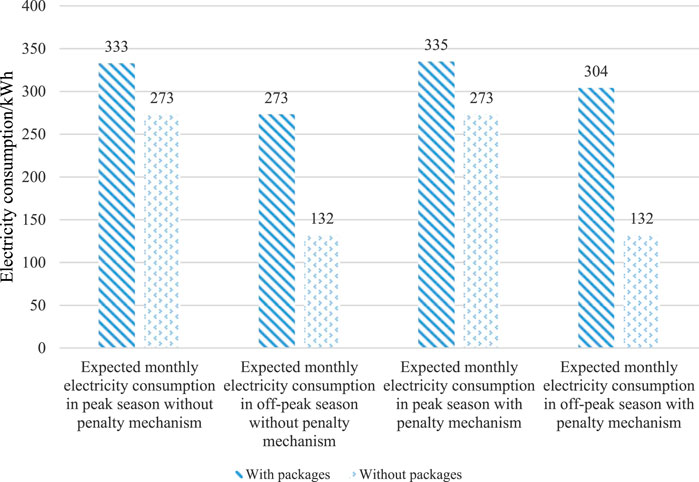
FIGURE 11. Expected monthly electricity consumption with and without the penalty mechanism.
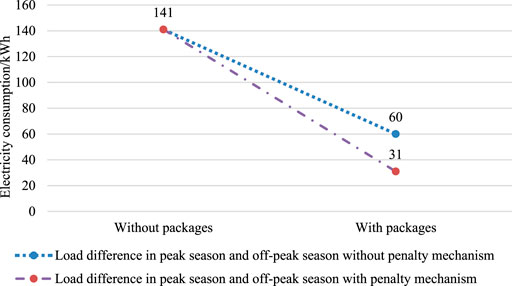
FIGURE 12. Load difference between peak season and off-peak season with and without the penalty mechanism.
As shown in Figures 13, 14, a retailer’s profit in the residential electricity packages that do not consider the penalty of load difference between peak and off-peak seasons increases from 7.715 million CNY to 10.7325 million CNY. Meanwhile, that in the electricity package that considers penalty increases from 7.715 million CNY to 10.5917 million CNY. The profit of the latter is 4.506% higher than that of the former during peak season and 27.772% lower than that of the former during off-peak season.
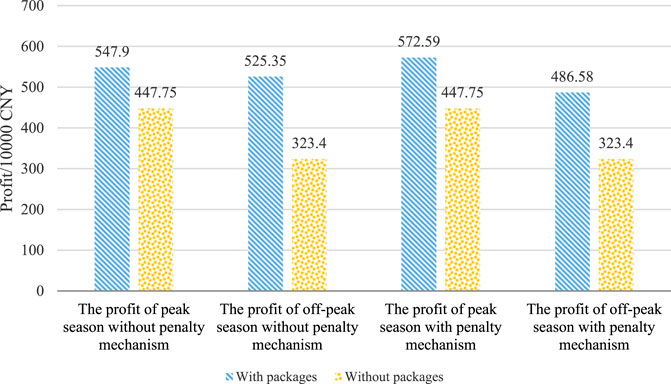
FIGURE 13. Peak season and off-peak season profits with and without the penalty mechanism.
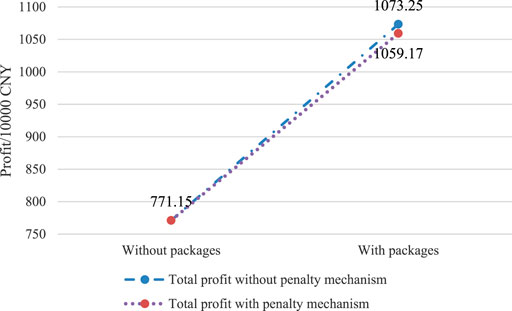
FIGURE 14. Total profit of packages with and without the penalty mechanism.
In summary, regardless of whether load difference penalty is considered, the residential electricity packages for peak and off-peak seasons provide many choices for residents and improve the utility of residential electricity. Load difference between peak and off-peak seasons is reduced, and retailer’s profit is increased. Residential power consumption packages during peak and off-peak seasons enable users to choose from among many electricity consumption packages that consider the penalty mechanism of load difference. This condition increases the off-peak season electricity consumption of users and significantly reduces load difference between peak and off-peak seasons. However, the price of residential electricity packages that do not consider the penalty mechanism during peak and off-peak seasons is higher than that of each package that considers the penalty mechanism, and retailer’s profit increases remarkably. Therefore, whether electricity retailers should adopt residential power consumption packages during peak and off-peak seasons with or without load difference penalty is based on their focus. They can adopt it without considering load difference penalty when focusing on acquiring more profits. Meanwhile, they can adopt it while considering load difference penalty when they focus on stable user power consumption.
6 Conclusion
The demand of power users has been increasing in recent years, along with the contradiction between power supply and demand due to the seasonal shortage of supply, seriously threatening the safe and stable operation of power grids. Therefore, under the background of the gradually liberalizing power market in China, this study discusses whether to consider the penalty of load difference between peak and off-peak seasons in the design of residential electricity packages. The two mechanisms provide many choices to residents, improving the utility of residents’ electricity consumption, reducing the load difference between peak and off-peak seasons, and increasing the profit of retailers. The penalty mechanism is considered in residential electricity packages. This mechanism reduces load difference between peak and off-peak seasons to a considerable extent. A retailer’s profit increases remarkably without considering the penalty mechanism.
In the design of residential electricity packages that consider the penalty of load difference between peak and off-peak seasons, the penalty coefficient is set for the price of electricity consumption that exceeds package quantity. In accordance with the average monthly electricity consumption and electricity value of users, the utility of different packages to users is analyzed, and the best package is selected by maximizing the utility function. The load difference model of retail packages during peak and off-peak seasons is established. From the simulation results of the example, packages that consider the setting of the penalty mechanism provide many choices to residents and improve the utility of electricity consumption. Users are encouraged to use electricity reasonably, and load difference between peak and off-peak seasons is reduced to smoothen the power demand curve of users, increasing a retailer’s profit to a certain extent.
In the design of residential electricity packages that do not consider the penalty of load difference between peak and off-peak seasons, an optimization model of residential electricity packages under the background of opening and selling electricity is proposed. On the basis of the average monthly electricity consumption and electricity value of users, the utility of different packages to users is analyzed. The best package is selected by maximizing the utility function, establishing the cost–benefit model of electricity retail packages. From the simulation results of the example, the setup of packages provides many choices to residents and improves the utility of residents’ electricity consumption. The profits of retailers are increased, and load difference between peak and off-peak seasons is reduced to a certain extent.
Furthermore, future research can extend our analysis to several directions. In this work, we comprehensively study how the most effective package can be chosen in terms of residential users’ electricity consumption during peak and off-peak seasons. However, an analysis of the change in electricity consumption after residential users choose a package remains lacking. Therefore, the next stage will focus on the design of electricity retail packages that consider a change in users’ electricity consumption. This study develops electricity packages for residents and then designs electricity packages suitable for industrial and commercial electricity users in accordance with their characteristics.
Data availability statement
The datasets presented in this article are not readily available because the data is provided by the cooperative enterprise. The original data is not allowed to be released due to contractual constraints. Requests to access the datasets should be directed to JD, jfdong4@hfut.edu.cn.
Author contributions
XZ formal analysis, writing—original draft JD methodology, writing—review and editing GW conceptualization, supervision YC perform the analysis with constructive discussions.
Funding
This work has been supported by the Basic Science Center of National Natural Science Foundation of China (Grant No. 72188101).
Acknowledgments
The authors thank the referees for their valuable comments and suggestions to help improve this paper.
Conflict of interest
The authors declare that the research was conducted in the absence of any commercial or financial relationships that could be construed as a potential conflict of interest.
Publisher’s note
All claims expressed in this article are solely those of the authors and do not necessarily represent those of their affiliated organizations, or those of the publisher, the editors and the reviewers. Any product that may be evaluated in this article, or claim that may be made by its manufacturer, is not guaranteed or endorsed by the publisher.
References
Allameh, G., Mehrabad, M. S., and Sadjadi, S. J. (2019). Pricing decisions in a decentralized biofuel supply chain with RIN mechanism. Energy Sources Part B Econ. Plan. Policy 14, 254–273. doi:10.1080/15567249.2019.1668499
Bae, M., Kim, H., Kim, E., Chung, A. Y., Kim, H., and Roh, J. H. (2014). Toward electricity retail competition: Survey and case study on technical infrastructure for advanced electricity market system. Appl. Energy 133, 252–273. doi:10.1016/j.apenergy.2014.07.044
Bartelj, L., Paravan, D., Gubina, A. F., and Golob, R. (2010). Valuating risk from sales contract offer maturity in electricity market. Int. J. Electr. Power & Energy Syst. 32, 147–155. doi:10.1016/j.ijepes.2009.06.022
Chan, S., C., Tsui, K., Yunhe, H., and Wu, F. F. (2012). Load/price forecasting and managing demand response for smart grids: Methodologies and challenges. IEEE Signal Process. Mag. 29, 68–85. doi:10.1109/msp.2012.2186531
Critz, D. K., Busche, S., and Connors, S. (2013). Power systems balancing with high penetration renewables: The potential of demand response in Hawaii. Energy Convers. Manag. 76, 609–619. doi:10.1016/j.enconman.2013.07.056
Fei, W., Xu, H., Xu, T., Li, K., Catalo, J. P. S., and Catalao, J. P. (2017). The values of market-based demand response on improving power system reliability under extreme circumstances. Appl. Energy 193, 220–231. doi:10.1016/j.apenergy.2017.01.103
Fontana, M., Iori, M., and Nava, C. R. (2019). Switching behavior in the Italian electricity retail market: Logistic and mixed effect Bayesian estimations of consumer choice. Energy Policy 129, 339–351. doi:10.1016/j.enpol.2019.01.060
Ghazvini, M. F., Faria, P., Ramos, S., Morais, H., and Vale, Z. (2015). Incentive-based demand response programs designed by asset-light retail electricity providers for the day-ahead market. Energy 82, 786–799. doi:10.1016/j.energy.2015.01.090
Ghazvini, M. F., Ramos, S., Soares, J., Castro, R., and Vale, Z. (2019). Liberalization and customer behavior in the Portuguese residential retail electricity market. Util. Policy 59, 100919. doi:10.1016/j.jup.2019.05.005
Guo, P., Li, V. O. K., and Lam, J. C. K. (2017). Smart demand response in China: Challenges and drivers. Energy Policy 107, 1–10. doi:10.1016/j.enpol.2017.04.019
Hamdi, H., Sbia, R., and Shahbaz, M. (2014). The nexus between electricity consumption and economic growth in Bahrain. Econ. Model. 38, 227–237. doi:10.1016/j.econmod.2013.12.012
Hartley, P. R., Medlock, K. B., and Jankovska, O. (2019). Electricity reform and retail pricing in Texas. Energy Econ. 80, 1–11. doi:10.1016/j.eneco.2018.12.024
Hatami, A. G. F. N. M., Fakhri, A. P., Nojavan, S., Majidi, M., and Hatami, H. (2016). A stochastic self-scheduling program for compressed air energy storage (CAES) of renewable energy sources (RESs) based on a demand response mechanism. Energy Convers. Manag. 120, 388–396. doi:10.1016/j.enconman.2016.04.082
Kharrati, S., Kazemi, M., and Ehsan, M. (2016). Equilibria in the competitive retail electricity market considering uncertainty and risk management. Energy 106, 315–328. doi:10.1016/j.energy.2016.03.069
Khodaei, A., Shahidehpour, M., and Bahramirad, S. (2011). SCUC with hourly demand response considering intertemporal load characteristics. IEEE Trans. Smart Grid 2, 564–571. doi:10.1109/TSG.2011.2157181
Li, C., Yu, X., Yu, W., Chen, G., and Wang, J. (2017). Efficient computation for sparse load shifting in demand side management. IEEE Trans. Smart Grid 8, 250–261. doi:10.1109/TSG.2016.2521377
Liao, B. F., and Li, B. Y. (2018). A marketing strategy in a closed-loop supply chain with loss-averse consumers. Math. Probl. Eng. 2018, 1–9. –9. doi:10.1155/2018/2560153
Lin, H., Wang, Q., Wang, Y., Liu, Y., Sun, Q., and Wennersten, R. (2017). The energy-saving potential of an office under different pricing mechanisms – application of an agent-based model. Appl. Energy 202, 248–258. doi:10.1016/j.apenergy.2017.05.140
Lin, J., Kahrl, F., Yuan, J., Chen, Q., and Liu, X. (2019a). Economic and carbon emission impacts of electricity market transition in China: A case study of guangdong province. Appl. Energy 238, 1093–1107. doi:10.1016/j.apenergy.2019.01.128
Lin, J., Kahrl, F., Yuan, J., Liu, X., and Zhang, W. (2019b). Challenges and strategies for electricity market transition in China. Energy Policy 133, 110899. doi:10.1016/j.enpol.2019.110899
Liu, H., Zhang, Z., Chen, Z.-M., and Dou, D. (2019). The impact of China’s electricity price deregulation on coal and power industries: Two-stage game modeling. Energy Policy 134, 110957. doi:10.1016/j.enpol.2019.110957
Lu, R., and Hong, S. H. (2019). Incentive-based demand response for smart grid with reinforcement learning and deep neural network. Appl. Energy 236, 937–949. doi:10.1016/j.apenergy.2018.12.061
Luo, Z., Hong, S. H., and Ding, Y. M. (2019). A data mining-driven incentive-based demand response scheme for a virtual power plant. Appl. Energy 239, 549–559. doi:10.1016/j.apenergy.2019.01.142
Ming, M. A., Sm, B., Xz, C., and Dn, A. (2016). Have market-oriented reforms improved the electricity generation efficiency of China’s thermal power industry? An empirical analysis - ScienceDirect. Energy 114, 734–741. doi:10.1016/j.energy.2016.08.054
Nojavan, S., Majidi, M., Najafi-Ghalelou, A., Ghahramani, M., and Zare, K. (2017). A cost-emission model for fuel cell/PV/battery hybrid energy system in the presence of demand response program: c-Constraint method and fuzzy satisfying approach. Energy Convers. Manag. 138, 383–392. doi:10.1016/j.enconman.2017.02.003
NwuluNnamdi, I., and Xia, X. (2015). Multi-objective dynamic economic emission dispatch of electric power generation integrated with game theory based demand response programs. Energy Convers. Manag. 89, 963–974. doi:10.1016/j.enconman.2014.11.001
Peng, X., and Tao, X. (2018). Cooperative game of electricity retailers in China’s spot electricity market. Energy 145, 152–170. doi:10.1016/j.energy.2017.12.122
Rezaee Jordehi, A. (2019). Optimisation of demand response in electric power systems, a review. Renew. Sustain. Energy Rev. 103, 308–319. doi:10.1016/j.rser.2018.12.054
Rieger, A., Thummert, R., Fridgen, G., Kahlen, M., and Ketter, W. (2016). Estimating the benefits of cooperation in a residential microgrid: A data-driven approach. Appl. Energy 180, 130–141. doi:10.1016/j.apenergy.2016.07.105
Siano, P., and Sarno, D. (2016). Assessing the benefits of residential demand response in a real time distribution energy market. Appl. Energy 161, 533–551. doi:10.1016/j.apenergy.2015.10.017
Stavrakas, V., and Flamos, A. (2020). A modular high-resolution demand-side management model to quantify benefits of demand-flexibility in the residential sector. Energy Convers. Manag. 205, 112339. doi:10.1016/j.enconman.2019.112339
Sun, Q., Shi, L., Ni, Y., Si, D., and Zhu, J. (2017). An enhanced cascading failure model integrating data mining technique. Prot. Control Mod. Power Syst. 2, 5. doi:10.1186/s41601-017-0035-3
Vuelvas, José, and Ruiz, F. (2019). A novel incentive-based demand response model for cournot competition in electricity markets. Energy Syst. 10, 95–112. doi:10.1007/s12667-018-0271-2
White, C. D., and Zhang, K. M. (2011). Using vehicle-to-grid technology for frequency regulation and peak-load reduction. J. Power Sources 196, 3972–3980. doi:10.1016/j.jpowsour.2010.11.010
Wu, Y., and Zhang, L. (2017). Evaluation of energy saving effects of tiered electricity pricing and investigation of the energy saving willingness of residents. Energy Policy 109, 208–217. doi:10.1016/j.enpol.2017.07.011
Yalcintas, M., Hagen, W. T., and Kaya, A. (2015). An analysis of load reduction and load shifting techniques in commercial and industrial buildings under dynamic electricity pricing schedules. Energy Build. 88, 15–24. doi:10.1016/j.enbuild.2014.11.069
Yan, C., Xue, X., Wang, S., and Cui, B. (2015). A novel air-conditioning system for proactive power demand response to smart grid. Energy Convers. Manag. 102, 239–246. doi:10.1016/j.enconman.2014.09.072
Yang, Y., and Faruqui, A. (2019). Reducing electricity prices and establishing electricity markets in China: Dos and don’ts. Electr. J. 32, 106633. doi:10.1016/j.tej.2019.106633
Yang, Y. (2014). Understanding household switching behavior in the retail electricity market. Energy Policy 69, 406–414. doi:10.1016/j.enpol.2014.03.009
Youn, H., and Jin, H. J. (2016). The effects of progressive pricing on household electricity use. J. Policy Model. 38, 1078–1088. doi:10.1016/J.JPOLMOD.2016.06.001
Zakariazadeh, A., Jadid, S., and Siano, P. (2014). Economic-environmental energy and reserve scheduling of smart distribution systems: A multiobjective mathematical programming approach. Energy Convers. Manag. 78, 151–164. doi:10.1016/j.enconman.2013.10.051
Zeng, M., Yang, Y., Wang, L., and Sun, J. (2016). The power industry reform in China 2015: Policies, evaluations and solutions. Renew. Sustain. Energy Rev. 57, 94–110. doi:10.1016/j.rser.2015.12.203
Zhang, Y., Meng, K., Kong, W., Dong, Z. Y., and Qian, F. (2019). Bayesian hybrid collaborative filtering-based residential electricity plan recommender system. IEEE Trans. Ind. Inf. 15, 4731–4741. doi:10.1109/TII.2019.2917318
Zhao, W., Zhang, J., Li, R., and Zha, R. (2021). A transaction case analysis of the development of generation rights trading and existing shortages in China. Energy Policy 149, 112045. doi:10.1016/j.enpol.2020.112045
Glossary
p Benchmark electricity price per unit of electricity
Y Average monthly electricity consumption in peak season
X Average monthly electricity consumption in off-peak season
Z Average monthly electricity consumption
pi Probability of choosing package i (i = 1, 2, 3)
p0 The probability of not choosing the packages
g (y) Probability density function of average monthly electricity consumption in peak season Y
f (x) Probability density function of average monthly electricity consumption in off-peak season X
Ry Expected monthly revenue in peak season
Rx Expected monthly revenue in off-peak season
Dy Expected monthly electricity consumption in peak season
Dx Expected monthly electricity consumption in off-peak season
N Total number of users
c Price of electricity in spot market
m The month of the year in which the off-peak season occurs
n Electricity quantity of package 1
Keywords: electricity deregulation, electricity package, demand response, load difference, punishment mechanism
Citation: Zhou X, Dong J, Wang G and Chu Y (2023) Residential electricity package model considering load difference penalty in China. Front. Energy Res. 10:1009510. doi: 10.3389/fenrg.2022.1009510
Received: 02 August 2022; Accepted: 30 August 2022;
Published: 10 January 2023.
Edited by:
Ke Yan, National University of Singapore, SingaporeReviewed by:
Hessam Golmohamadi, Aalborg University, DenmarkTao Ding, Hefei University of Technology, China
Copyright © 2023 Zhou, Dong, Wang and Chu. This is an open-access article distributed under the terms of the Creative Commons Attribution License (CC BY). The use, distribution or reproduction in other forums is permitted, provided the original author(s) and the copyright owner(s) are credited and that the original publication in this journal is cited, in accordance with accepted academic practice. No use, distribution or reproduction is permitted which does not comply with these terms.
*Correspondence: Yan Chu, chuyan@lixin.edu.cn