Electric power cyber-physical systems vulnerability assessment under cyber attack
 Zhengwei Qu1*
  Wenting Sun
- 1School of Electrical Engineering, Yanshan University, Qinhuangdao, Hebei, China
- 2Smart Distribution Center of State Grid Jibei Electric Power Limited Company, Qinhuangdao, Hebei, China
Improving the accuracy of the vulnerability assessment of the power cyber-physical system has important practical value for protecting the vulnerable links of the system and preventing large power outages. This article studies the vulnerability assessment of power cyber-physical systems under cyber-attacks. First, from the perspective of topology, the electrical betweenness is used as the structural vulnerability index of the power system. Based on the power flow characteristics of the power network, the voltage is used as the state vulnerability index. Then, starting from the structure, the node degree and clustering coefficient are selected to analyze the structural vulnerability. Considering the service transmission characteristics of the information system, the power service importance is selected as the vulnerability assessment index of the information system. The two selected indexes are used to construct a quantitative formula, and a comprehensive index is obtained to complete the node vulnerability assessment of the power information system. Then, on the basis of the system vulnerability assessment, we screen to determine the entry and target nodes of network attacks and predict the network attack path. Finally, the effectiveness of the proposed method for vulnerability assessment and feasibility is verified by MATLAB programming simulation.
Introduction
Since modern smart grids have various deeply coupled cyber-physical components, they are vulnerable to malicious cyber-attacks. In view of the frequent power outage accidents in recent years, the vulnerability of the power system has become a research hotspot for scholars from all over the world. Scientifically identifying and evaluating the vulnerable links of power cyber-physical systems (CPSs) has very important theoretical and practical significance for studying fault propagation between the power network and information network and improving the safe and reliable operation of the power CPS.
Although there are many studies on power system vulnerability assessment and power cascading failures, the selection of vulnerability index lacks comprehensive consideration, and vulnerability is often analyzed from isolated networks. Wang et al. (2016) summarized the research status of the influencing factors of structural vulnerability and protection strategies on the basis of an overview of the modeling and vulnerability assessment methods of power information-physical interdependent networks. Zhan et al. (2014) proposed weighted complex network parameters and the comprehensive sensitivity of microgrid nodes and lines to form a microgrid vulnerability evaluation system and consider the network parameters of nodes. Lian et al. (2019) proposed an evaluation index that integrates the importance of power nodes and the topology of the information network, which provides a reference for improving the robustness of the power system. Ji et al. (2016a) summarized the modeling methods, existing models, and vulnerability assessment methods of interdependent networks, which have great reference value for future research on CPS vulnerability. Li et al. (2020) proposed a hierarchical membership function based on the vulnerability of the network on the physical side to describe the vulnerability between various levels of the evaluation index. A total of four indexes of voltage increment severity were there to analyze the entire distribution network.
Ji et al. (2016b) adopted the complex network theory and uses a multi-layer complex network model to extract the multi-layer centrality between the networks and the shortest electrical path algorithm to evaluate the robustness of the power network. Chen et al. (2007) proposed a large-scale grid structure vulnerability analysis method based on grid topology. This method emphasizes the influence of the overall architecture of the power grid on fault propagation, and helps to study the propagation mechanism of cascading faults in large power grids. Koc et al. (2016) and Fang et al. (2017). analyzed the structural vulnerability of the distributed power grids and propose a complex network method based on the maximum power flow to identify critical lines in the system. In addition, Gutiérrez et al. (2015) proposed a method based on the graph theory to analyze the vulnerability of the power grid structure. Park et al. (2012) used the N-1 method to collect all physical faults and information faults when evaluating the power system of the fusion information system, analyzed the response function of the power system under faults, and compared the reliability of the system under normal operation. The vulnerability index is used to analyze and evaluate the vulnerability of the power system. Tang et al. (2015) proposed a composite system correlation matrix that can reflect the relationship between power–communication topology. Based on the source-flow path electrical subdivision method, the communication system vulnerability index the power communication business information interaction vulnerability, and the composite system static vulnerability matrix was obtained. The vulnerability of the power–communication composite system at a certain time section can be judged. Li et al. (2018) proposed a CPS vulnerability assessment method for the distribution network in distributed cooperative control mode based on dynamic attack–defense game, which guides the design of future cooperative control systems from a risk perspective.
At present, there has been research on the vulnerability of power CPS. Although the modeling of the information side is integrated on the basis of the power network, when selecting the vulnerability index, the integrated power cyber-physical system, the analysis of multiple aspects and angles has not been fully considered in the case of combining the characteristics of each side network.
Therefore, this study proposes to establish a comprehensive vulnerability index of the power system from two aspects of topology structure and operation state based on the complex network theory and power flow characteristics of the power network. This index not only implies a relatively static and invariable network structure but also reflects the system operation state, and has the characteristics of conforming to the basic electrical laws of the power network. When considering the node vulnerability of the information system, starting from the network structure, the node degree and clustering coefficient are selected to analyze the structural vulnerability. Considering the service transmission characteristics of the information system, the importance of power business is selected as the vulnerability assessment index of the information system. A quantitative formula is constructed for the two selected indexes, and a comprehensive index is finally obtained to quantify the node vulnerability of the information system and complete the vulnerability assessment of the power information node. Then, on the basis of the system vulnerability assessment, a screen was there to determine the entry and target nodes of network attacks and predict the network attack path.
Power system vulnerability index
This section first introduces the two indexes determined from the comprehensive analysis of the structural vulnerability and state vulnerability of the power system, and combines the topological vulnerability index and the state vulnerability index in a linearly weighted manner to generate a new comprehensive evaluation index.
Power system structural vulnerability index—electrical betweenness
Betweenness is defined as the ratio of the number of paths passing through the node among the shortest paths in the network to the total number of shortest paths. Betweenness can represent the influence of a node and can measure the importance of each node or edge in the network.
But in power systems, power does not inherently flow only along the shortest paths. Considering the node capacity, the impedance of the transmission line, and the weighted adjacency matrix, the electrical betweenness can truly reflect the occupancy of the node in the “generator-load” power transmission, and can consider the influence of the generation power and load level of different nodes, quantification of the contribution value of each node in the power flow transmission of the whole network is more in line with the actual physical meaning of the power system. Therefore, this study chooses the electrical betweenness as the structural vulnerability index of the power system.
The electrical betweenness of the node
where
where
Eq. 2 reflects the occupancy rate of node pairs
When calculating, it is assumed that the system has
In the formula,
If the unit injection current element added between node
where
In the calculation, the current caused by the unit injection current element between each node and the reference node on each branch should be calculated according to Eq. 3, and then directly subtracted according to Eq. 4 to obtain the current value which is caused by adding the current value of the unit injection current element between the “generator-load” node pairs, and then substitute it into Eq. 1 to obtain the electrical betweenness of each node, which can greatly simplify the operation.
The index is normalized, and the electrical betweenness index is defined as follows:
Considering that the smaller the electrical betweenness index of the node is, the more fragile the node is, so the structural vulnerability index is selected as follows:
According to the calculation and analysis of the abovementioned electrical betweenness index, the steps for calculating the electrical betweenness are given as follows:
1) The topology diagram of the power grid is formed according to the abovementioned simplified method, and only the main grid part of the high-voltage transmission network is considered.
2) The nodes are divided into power generation, load, and intermediate nodes, and only the electrical betweenness of the line caused by the power generation and load node pairs is calculated. The line parameters only consider the reactance and do not consider the ground leakage capacitance. The generation node matrix, load node matrix, and line impedance matrix are formed.
3) The connectivity of the network is determined. A pair of power generation load node pairs is arbitrarily selected, and the electrical betweenness component of the line is calculated according to Eq. 1.
4) After traversing all the power generation load node pairs, the electrical betweenness of the line is calculated, arranged in descending order, and the cumulative distribution is calculated.
The flow chart of dielectric number calculation is shown in Figure 1.
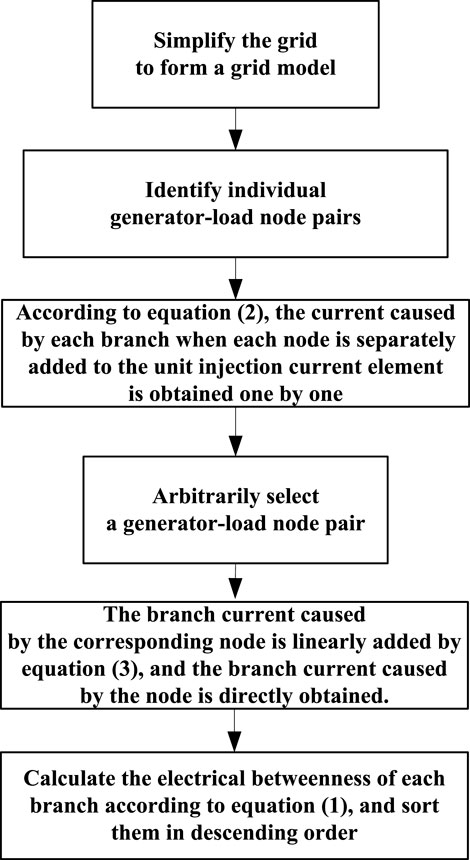
FIGURE 1. Electrical betweenness calculation flowchart.
Power system state vulnerability index—voltage
The power system is a complex dynamic system. There are four kinds of power system stability, among which voltage stability is an important aspect.
At present, there are many different voltage stability indexes, which are generally divided into two categories: state index and margin index. The state index is used to evaluate the stability of the system at the time according to the system operating state parameters, and the amount of calculation is relatively small. The margin index has good linearity and clear physical meaning, which can easily take into account various factors in the transition process, but the calculation process needs to solve the critical value, so the calculation process will be more complicated. The main expressions of the voltage stability index are as follows:
Since voltage is an important operating state parameter of the node, the voltage index is also an important index to measure the vulnerability of the node. The node state vulnerability index adopts the index of Eq. 8 as follows:
In Eq. 10,
The calculation speed and accuracy of the node critical voltage value are directly related to the calculation of the node state vulnerability index. Therefore, seeking a relatively fast and accurate algorithm is the key to calculating the node critical voltage. At present, the main methods of the node critical voltage calculation are: continuous power flow method, load admittance method, power flow multi-solution method, and other methods.
In this study, a modified nonlinear power flow (PNFA) (Shi et al., 2010) algorithm is used to calculate the node critical voltage.
Comprehensive vulnerability index of the power system
A new comprehensive index is obtained by combining the index of structural vulnerability—electrical betweenness and the index of state vulnerability—voltage through linear weighting, which not only takes into account the impact of the damaged power system structure but also can taking into account the influence of the grid operation status on the power system.
where
The weight factors
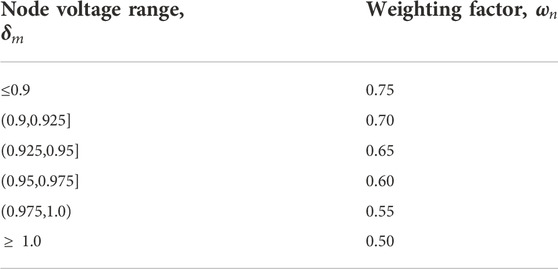
TABLE 1. Weight molecules corresponding to different voltage levels.
Information system vulnerability index
This section introduces the selection of index from the network structure to analyze the vulnerability of the information system, considers the service transmission characteristics of the information system, and selects the power service importance as the vulnerability assessment index. Then, a quantitative formula is constructed for the two selected indexes, and a comprehensive index is finally obtained to quantify the node vulnerability of the information system and complete the vulnerability assessment of the communication network node.
Information system structural vulnerability index
Information system nodes have large scales and diverse topological structures. The commonly used indexes, when evaluating the topological importance of network nodes, are the degree centrality and betweenness centrality of nodes. Because betweenness centrality needs to grasp the global information of the entire network, it has high computational complexity for large-scale network structures such as power communication networks. Different from betweenness centrality and closeness centrality, degree centrality mainly considers the node’s own information, which is simple in calculation and low in time complexity, and is suitable for large-scale networks.
In the network node, the node aggregation feature has a great influence on the influence of the node. In the transmission layer of the power information network, there are many triangular structures formed by nodes. If the betweenness used as an index and the link weight is not considered, a node with a degree of two in the triangular structure will not be included in the shortest path of the network, thereby reducing the influence and importance of this node when calculating the evaluation. At the same time, the edge nodes belonging to the access layer in the network are not easy to form in a triangular structure, and the influence represented by the clustering coefficient will reach the maximum value. It can be seen that although the clustering coefficient cannot reflect the scale of adjacent nodes, it can quantify the degree of connection between the nodes and adjacent nodes. This study analyzes the node vulnerability from the network topology structure, comprehensively considers the node degree and clustering coefficient, and proposes the network topology structure importance evaluation index
where
In Eq. 13,
where the smaller the clustering coefficient
Information system functional vulnerability index
As a special complex network structure, the information system has its own unique industrial background. The nodes are responsible for a large amount of power business data related to the power grid, mainly including relay protection, stability system, dispatch automation, wide-area measurement, and other services. The nodes undertake different types and quantities of communication services, and the service importance is used to represent the impact on the power grid when a service is interrupted or the service quality is defective. The more serious the impact on the power grid, the greater the importance of the corresponding service. The more the types and quantities of services a node undertakes, the more serious the impact of node failure on the power grid will be. Therefore, when evaluating the node vulnerability, the node business importance is used as an index to measure.
Table 2 shows the importance of various services obtained according to the security division characteristics of different services and the requirements for channels, combined with reference (Fan and Tang, 2014), which are divided into five categories, representing the average value of the importance of various services.
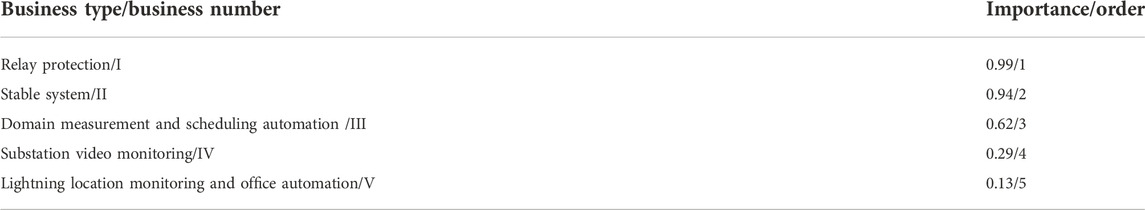
TABLE 2. Types and importance of electricity businesses.
The number of links connected to a node and the services in each link jointly determine the importance of a node at the service layer. The more links a node is connected to, the greater the type and quantity of services carried by the links, which means that more services are transmitted through the node. Therefore, when calculating the service importance of a node, the influence of the number of links and the number and type of services on the importance of the node is considered. The calculation formula for defining the business importance of a node is as follows:
where
From Eq. 15, it can be seen that the more links a node is connected to and the more business types and quantities that are more important to the operation of the power grid, the node has a greater business importance.
The information fusion is completed for the quantization results of two angles, and the method to obtain the quantized value of node vulnerability is as follows:
The vulnerability quantification formula that finally defines the information node is as follows:
Network attack path prediction
This section introduces the determination of the network attack entry node according to the vulnerability value of the information system. Then, we select the key indicators for the power system nodes, sort the nodes according to the key points, and determine the network attack target nodes according to the criticality of the power nodes. Finally, we use the Dijkstra algorithm to predict the network attack path.
Determination of the attack entry node and attack target node
When attackers launch a network attack, they usually invade the network step by step and conduct the attack step by step. The most critical step in the attack process is to select the attack-entry nodes and the attack-target nodes. Based on the idea of game theory, the attacker’s point of view is to minimize the implementation cost of the attacker and maximize the system loss.
Therefore, this study assumes that the attacker’s vulnerability of the information system is the starting point of the attack, and the ultimate goal of the attack is to select the nodes that can make the most profit, that is, some key nodes to attack. First, we determine the attack-entry point, that is, the vulnerability point of the information system, which has been obtained from the second part of the power CPS vulnerability assessment.
The next step is to determine the attack-target node, which is also a key node.
Assuming that there are
Then, the equivalent impedance
where
For a physical side network with
When a line is mistakenly cut due to a network attack in the network, the electrical topology importance factor of the line in the system is
where
It is assumed that the largest connected domain in the target network contains
Combining the two impact factor indicators, the impact factor of the attack-target layer is
where
The attack path prediction algorithm is designed on the basis of the Dijkstra classic algorithm, referring to the effectiveness of the Dijkstra algorithm in finding the single-source shortest path in a directed graph. The algorithm needs to calculate the maximum possible path from the initially occupied node to the target node. The steps to predict the attack path are as follows:
1) First, the model of the power cyber-physical system is established
2) The introduced vulnerability index method is used to calculate the vulnerability value of the power system and information system
3) The correlation matrix of the model is input
4) The attack entry node and the attack target node is calculated
The attack path effect is shown in the figure as follows.
The blue and yellow lines in Figure 2 represent an attack path that a network attacker may take from the attack-entry node to the attack-target node. The path starts from the entry node of the information system to the attack-target node of the physical system, that is, electricity. The critical node of the system ends. By adopting the principle of finding the shortest path from a single source by using the Dijkstra algorithm, and based on the evaluation results of the vulnerability value of each node in the system, the predicted network attack path is designed, and the maximum possible attack path that the attacker may take is obtained.
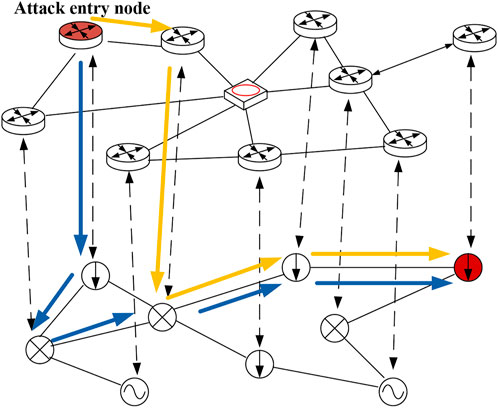
FIGURE 2. Attack-path prediction demonstration diagram.
Case study
In this section, the IEEE14 node is used as an example to calculate the electrical betweenness and voltage index of the system node, which proves that the selection of the power system index is more reasonable and accurate. Second, the vulnerability values of the electrical nodes and information nodes of the power cyber-physical system are calculated, which confirms that the quantitative value of the proposed comprehensive vulnerability index conforms to the actual system operation. Finally, the key indicators of the power system nodes are selected, the key points are sorted, and the network attack-target points are determined according to the key points of the power nodes. Finally, the Dijkstra algorithm is used to predict the network attack path. The effectiveness of the algorithm in path prediction is verified.
Power system vulnerability study
The IEEE14 node is used as an example, as shown in Figure 3. The electrical betweenness vulnerability index of the line is calculated based on MATLAB programming, and the electrical betweenness data of the line is obtained.
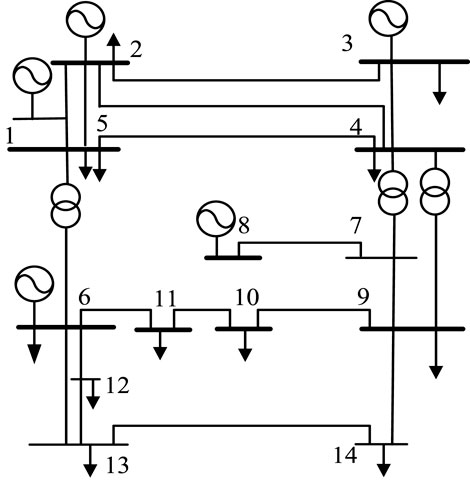
FIGURE 3. IEEE14 system wiring diagram.
The calculated data show that the distribution of the dielectric values of the lines is extremely uneven. Most of the lines’ dielectric values are near the average value, but there are still a few lines whose dielectric values are much higher than the average value. The vulnerable lines identified by the electrical betweenness index are compared with the capacity betweenness identification results proposed by He et al. (2013), as shown in Table 3.
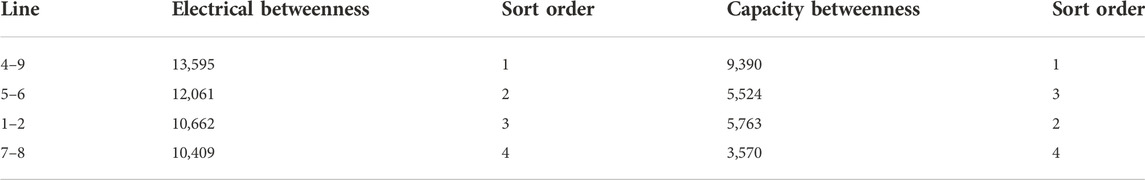
TABLE 3. Comparison between the IEEE14 node line electrical and capacity.
It can be seen from Table 3 that in the identification results of the two betweenness indexes, the rankings of lines 4–9 and 5–6 are very high, and we can also consider them to be vulnerable lines. Similarly, we can see from the wiring diagram in figure 3 that these lines happen to be at important key positions, and most of the vulnerable lines obtained are long-distance connections, and their disconnection will divide the power grid into several areas, which will seriously affect the structure of the power grid.
The results obtained by using the electrical betweenness as an index of the structural vulnerability of the power system are compared with the capacity betweenness model proposed in (He et al., 2013), and finally we can obtain similar results, which are more accurate and practical. Therefore, the electrical betweenness is used as The power system structural vulnerability index is more superior.
Based on MATLAB programming, the node’s structural vulnerability index, electrical betweenness and state vulnerability voltage index, could be calculated. At the same time, based on the results of the structural vulnerability index and state vulnerability index, the comprehensive vulnerability index of the node is obtained, as shown in Figure 4.
FIGURE 4. IEEE14 node vulnerability index value.
From Figure 4, we can clearly know that when different indexes are selected, the vulnerability of each node is evidently different. The selection of a single index will result in an inaccurate assessment of node vulnerability. Node 8 is taken, for example, from the perspective of topology, node 8 is a weak link, but the calculation results from the actual operating state show that the voltage margin is large, which indicates that the node is very fragile and operates very stably. Therefore, it is more reasonable, accurate, and practical to conduct a comprehensive vulnerability assessment of nodes at different node voltage levels based on the vulnerability analysis methods of both the state and structure. The vulnerability of power system components is not only closely related to their own inherent structural vulnerability but also closely related to the system’s real-time operating parameters and network constraints.
According to the analysis of Figure 4, we can also draw a conclusion that the ranking result of the comprehensive vulnerability of each node because the state vulnerability and structural vulnerability of the node are considered, the ranking is compared with the ranking of the state, and the structural vulnerability index has changed. In short, the comprehensive vulnerability considers two aspects comprehensively, and the result can better reflect the comprehensive characteristics of the node. Compared with the unilateral vulnerability, it is more instructive for the operation of the real system.
Power cyber-physical system vulnerability study
Figure 5 is a diagram of a power cyber-physical system of power 14 nodes–information 14 nodes. In this example, the power cyber-physical composite system is divided into three layers, namely the information system, the power system, and the physical-cyber interaction layer.
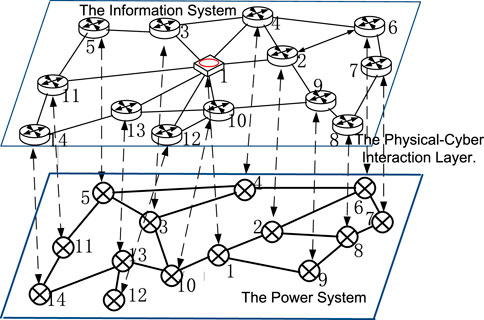
FIGURE 5. Power 14 node-information 14 node system diagram.
Based on MATLAB programming, according to the index and calculation method that be proposed, the vulnerability index data of the power cyber-physical system is calculated based on the corresponding power and information network parameters. The results are shown in Table 4.
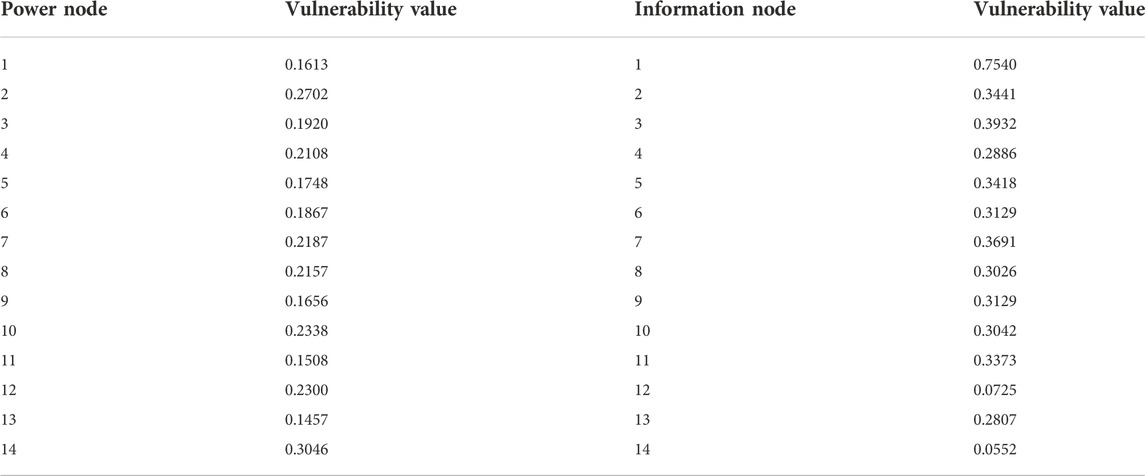
TABLE 4. Node vulnerability value of the power cyber-physical system.
According to the quantification results of the vulnerability index of the power system and the calculation results of the vulnerability index of the information system, the comprehensive vulnerability index of the power cyber-physical system is obtained, as shown in Figure 6.

FIGURE 6. Node comprehensive vulnerability value.
According to the analysis in Figure 6, we know that information node 1 has the highest business importance. In fact, as the dispatching center station, information node 1 carries the largest traffic volume and the centralized distribution of traffic, and its administrative level is the highest. Therefore, this node has the greatest impact on the network after being attacked. The key link should be focused on the protection of the node. At the same time, nodes 2, 3, and 5 are also more important in terms of topology structure and traffic volume. Once destroyed, the consequences will be serious and the comprehensive importance obtained will be relatively high. In fact, it can be seen from the topology diagram that each of these node is a sink node, and the calculation result is consistent with the actual situation, which is also a vulnerable link in the network. According to the graph analysis, it can be seen that the power nodes 12 and 14 are located at the terminal end of the power system, and the information nodes 12 and 14 are also at the terminal edge positions in the communication network. Topological importance and business importance are both relatively low, thus nodes 12 and 14 suffer less damage after being attacked, so the quantified value of the comprehensive vulnerability index is low. All these results show that the method we mentioned is accurate and reasonable and more in line with the actual situation.
Network path prediction study
The calculation example is simulated according to the IEEE14 node system, and the attack-target node is calculated and determined according to the method proposed in the third part. The calculation results are shown in Figure 7, Figure 8.
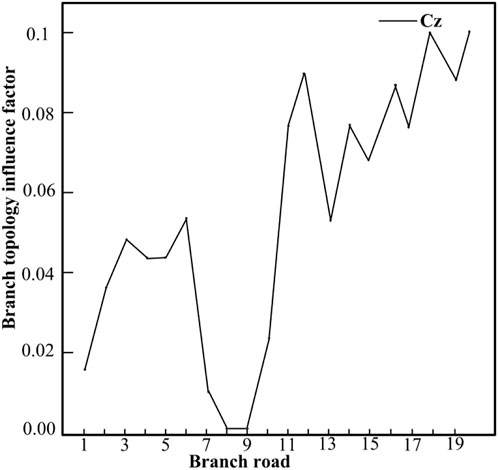
FIGURE 7. Branch topology influence factor Fig.8 Branch connectivity impact factor.
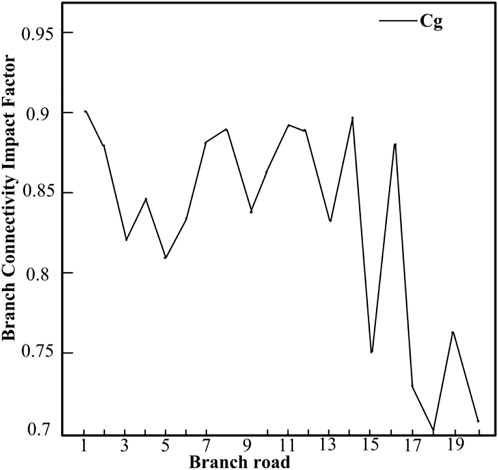
FIGURE 8. Comprehensive vulnerability index of the power cyber-physical system.
It can also be seen from the wiring diagram of the IEEE 14 node system that if branch 5–6 is disconnected, the power grid will become the upper and lower parts, which is the branch that has the greatest impact on the system, followed by branch 20, which is in line 4–9. Therefore, it can be determined that the attack target lines 5–6, and the power system nodes 5 and 6 are the key target nodes of the attack. At this time, the attacker obtains the maximum benefit.
According to the vulnerability assessment of the information system, the nodes 12, 13, and 14 of the information system are selected as the attack entry points. Power system nodes 5 and 6 are marked as 19 and 20 in the construction model node, and the path is obtained, there are 3*2 = 6 attack paths, as shown in Figure 9.
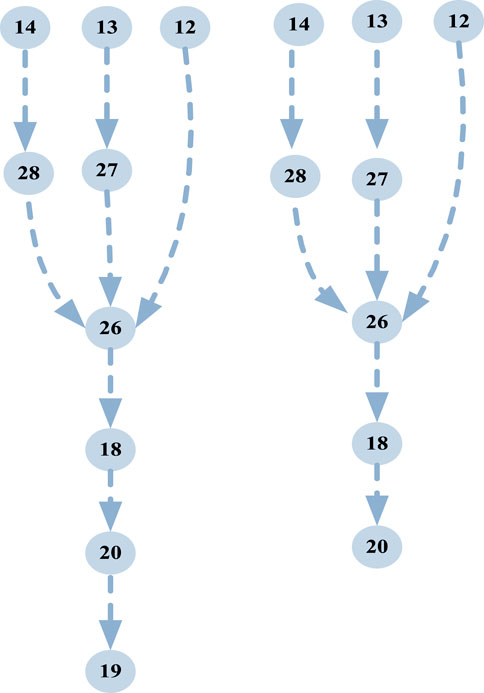
FIGURE 9. Network attack path prediction diagram.
It can be seen from the figure that nodes 16, 18, and 20 are in a key position. The attack path passes through these nodes many times, which is also a vulnerable link of the system, and its key protection should be addressed.
Conclusion
In this work, we fully consider the power flow characteristics and complex network theory of the power grid, and propose the index that can indicate the comprehensive vulnerability of the power system. These indexes fully consider the topology and operating status of the power system, not only considering the impact of the power system structure is destroyed, and the impact of the power grid operation status on the power system can be taken into account, the accuracy of the system vulnerability assessment is improved, and the assessment results are more in line with the actual operation of the power system. In the analysis of the information system, starting from the network structure, the node degree and the clustering coefficient are selected to analyze the structural vulnerability, and secondly, considering the service transmission characteristics of the information system, the importance of the power service is selected as the vulnerability assessment index of the information system. The two selected indexes are used to construct a quantitative formula, and finally a comprehensive index is obtained to quantify the node vulnerability of the information system and complete the vulnerability assessment of the nodes of the power cyber-physical system. Finally, the key nodes and weak nodes are selected to predict the network attack path. In this study, the feasibility and accuracy of the method are verified by the IEEE14 node and power cyber-physical system.
Data availability statement
The original contributions presented in the study are included in the article/Supplementary Material. Further inquiries can be directed to the corresponding author.
Author contributions
SW is the experimental designer and executor of this study, completed data analysis, and wrote the first draft of the manuscript; SX and ZX participated in the experimental design and analysis of experimental results; and QZ is the project designer and person in charge, guided the experiment design, analyzed data, wrote the thesis, and revised the manuscript. All authors read and agreed to the final text.
Conflict of interest
Authors JD, JZ and YL were employed by State Grid Jibei Electric Power Limited Company.
The remaining authors declare that the research was conducted in the absence of any commercial or financial relationships that could be construed as a potential conflict of interest.
Publisher’s note
All claims expressed in this article are solely those of the authors and do not necessarily represent those of their affiliated organizations, or those of the publisher, the editors, and the reviewers. Any product that may be evaluated in this article, or claim that may be made by its manufacturer, is not guaranteed or endorsed by the publisher.
References
Chen, X., Sun, K., and Cao, Y. (2007). Structural vulnerability analysis of large power grid based on complex network theory. Trans. China Electrotech. Soc. 22 (10), 138. doi:10.3321/j.issn:1000-6753.2007.10.025
Fan, B., and Tang, L. (2014). Vulnerability analysis of power communication networks. Chin. J. Electr. Eng. 34 (7), 1191. doi:10.13334/j.0258-8013.pcsee.2014.07.022
Fang, J., Su, C., and Chen, Z. (2017). Power system structural vulnerability assessment based on an improved maximum flow approach. IEEE Trans. Smart Grid 2 (2), 777. doi:10.1109/TSG.2016.2565619
Gutiérrez, F., Nuño, J., and Barocio, E. (2015). Using a graph cuts approach to analyze the structural vulnerability of the power grids. Central Am. Panama Convention, 1. doi:10.1109/CONCAPAN.2014.7000456
He, J., Song-ling, P., Yu, B., Zhang, W., Hong-peng, L., and Yao-nian, L. (2013). Identification of vulnerable lines in power grid based on capacity betweenness index. Power Syst. Prot. control 41 (8), 30. doi:10.3969/j.issn.1674-3415.2011.23.019
Ji, X., Wang, B., and Chaoyang, D. (2016). Power Information-physical interdependence network vulnerability assessment and edge protection strategy. Power Grid Technol. 6, 1865. doi:10.13335/j.1000-3673.pst.2016.06.038
Ji, X., Wang, B., Dichen, L., and Zhao, T. (2016). A review of dependence network theory and its application in structural vulnerability analysis of power information-physical systems. Proc. csee 36 (17), 4521. doi:10.13334/j.0258-8013.pcsee.160492
Koc, Y., Raman, A., and Warnier, M. (2016). Structural vulnerability analysis of electric power distribution grids. J. Power & Energy Eng. 3 (11), 1–13. doi:10.1504/ijcis.2016.081299
Li, J., Dong, J., and Zhang, L. (2020). Comprehensive evaluation of vulnerable nodes based on membership function of grade division. Electr. Meas. Instrum., 1. doi:10.19753/j.issn1001-1390.2002.08.015
Li, P., Liu, Y., Xin, H., and Qi, D. (2018). Vulnerability assessment of distribution network information physical system under distributed cooperative control mode. Automation Electr. power Syst. 42 (10), 22. doi:10.7500/AEPS20170705002
Lian, X., Zhang, W., Tong, Q., and Tang, W. (2019). Vulnerability assessment method of power information physical system consideringinformationnodefailure. Glob. energy Internet 2 (6), 523
Park, K. J., Liu, R., and Liu, X. (2012). Cyber-physical systems: Milestones and research challenges. Comput. Commun. 36 (1), 1–7. doi:10.1016/j.comcom.2012.09.006
Shi, Y., Han, F., Li, S., and Yang, Y. (2010). Research on improved continuous power flow algorithm based on nonlinear prediction. Electr. Technol. (2), 27. doi:10.3969/j.issn.1673-3800.2010.02.014
Tang, Y., Han, X., Wu, Y., Ju, Y., Xia, Z., and Ni, M. (2015). Comprehensive vulnerability assessment of power system considering the influence of communication system. Chin. J. Electr. Eng. 35 (23), 6066. doi:10.13334/j.0258-8013.pcsee.2015.23.013
Wang, Q., Pipattanasomporn, M., Kuzlu, M., Tang, Y., Li, Y., and Rahman, S. (2016). Framework for vulnerability assessment of communication systems for electric power grids. IET Gener. Transm. Distrib. 10 (2), 477–486. doi:10.1049/iet-gtd.2015.0857
Zhan, X., Xiang, T., Chen, H., Zhou, B., and Yang, Z. (2014). Vulnerability assessment and reconfiguration of microgrid through search vector artificial physics optimization algorithm. Int. J. Electr. Power & Energy Syst. 62 (2), 679–688. doi:10.1016/j.ijepes.2014.05.024
Keywords: power systems, information system, attack path prediction, cyber-physical power system, vulnerability assessment
Citation: Qu Z, Sun W, Dong J, Zhao J and Li Y (2023) Electric power cyber-physical systems vulnerability assessment under cyber attack. Front. Energy Res. 10:1002373. doi: 10.3389/fenrg.2022.1002373
Received: 25 July 2022; Accepted: 14 September 2022;
Published: 05 January 2023.
Edited by:
Dongdong Li, Shanghai University of Electric Power, ChinaReviewed by:
Nikolaos Manousakis, University of West Attica, GreeceNeeraj Kumar Singh, Larsen & Toubro (India), India
Copyright © 2023 Qu, Sun, Dong, Zhao and Li. This is an open-access article distributed under the terms of the Creative Commons Attribution License (CC BY). The use, distribution or reproduction in other forums is permitted, provided the original author(s) and the copyright owner(s) are credited and that the original publication in this journal is cited, in accordance with accepted academic practice. No use, distribution or reproduction is permitted which does not comply with these terms.
*Correspondence: Zhengwei Qu, ysu_qzw@163.com