Experimental Study on the Relationship Between Cavitation and Lift Fluctuations of S-Shaped Hydrofoil
 Haiyu Liu
 Pengcheng Lin1
 - 1College of Hydraulic Science and Engineering, Yangzhou University, Yangzhou, China
- 2JiangSu TaiHu Planning and Design Institute of Water Resources Co., Ltd, Suzhou, China
- 3Jining Water Conservancy Development Center, Jining, China
- 4Nanjing Water Planning and Designing Institute Corp., Ltd, Nanjing, China
In order to study the energy loss of bi-directional hydraulic machinery under cavitation conditions, this paper uses high-speed photography combined with six-axis force and torque sensors to collect cavitating flow images and lift signals of S-shaped hydrofoils simultaneously in a cavitation tunnel. The experimental results show that the stall angle of attack of the S-shaped hydrofoil is at ±12° and that the lift characteristics are almost symmetrical about +1°. Choosing α = +6° and α = −4° with almost equal average lift for comparison, it was found that both cavitation inception and cloud cavitation inception were earlier at α = −4° than at α = +6°, and that the cavitation length at α = −4° grew significantly faster than at α = +6°. When α = +6°, the cavity around the S-shaped hydrofoil undergoes a typical cavitation stage as the cavitation number decreases: from incipient cavitation to sheet cavitation to cloud cavitation. However, when α = −4°, as the cavitation number decreases, the cavitation phase goes through a developmental process from incipient cavitation to sheet cavitation to cloud cavitation to sheet cavitation to cloud cavitation, mainly because the shape of the S-shaped hydrofoil at the negative angle of attack affects the flow of the cavity tails, which is not sufficient to form re-entrant jets that cuts off the sheet cavitation. The formation mechanism of cloud cavitation at the two different angles of attack (α = +6°、−4°) is the same, both being due to the movement of the re-entrant jet leading to the unstable shedding of sheet cavity. The fast Fourier analysis reveals that the fluctuations of the lift signals under cloud cavitation are significantly higher than those under non-cavitation, and the main frequencies of the lift signals under cloud cavitation were all twice the frequency of the cloud cavitation shedding.
Introduction
The instability and shedding of sheet cavitation will cause noise and performance decline of hydraulic machinery, and severe shedding will cause vibration and material damage (Brennen, 1995; Franc and Michel, 2005; Luo et al., 2016). The evolution of cloud cavitation is not only a complex two-phase flow phenomenon, but also causes unsteady changes in performance of hydraulic machinery (Arndt, 2003; Zwart et al., 2004). In order to provide a theoretical basis for the performance change and efficiency improvement of rotating machinery under cavitation conditions, most of the researches were carried out on the basic unit foil of hydraulic machinery.
The cavitation tunnel experiment is the most direct way to obtain the cavitating flow phenomenon and lift-drag data of the hydrofoil (Foeth et al., 2006; Foeth et al., 2008). Knapp et al. (Knapp, 1955) predicted the existence of the re-entrant jets in cloud cavitation experiments. Kubota et al. (Kubota et al., 1989) used high-speed photography combined with Laser Doppler Anemometry to test that the cloud cavitation shedding is formed by a speed close to the hydrofoil surface that is opposite to the mainstream. Kawanami et al. (Kawanami et al., 1997) successfully prevented the generation of cloud cavitation by installing an obstacle on the surface of the hydrofoil, and verified the existence of the re-entrant jet from cavitating experiments. Wang et al. (Wang et al., 2001) carried out high-speed photography and LDV tests on three different stages of cavitation development, and studied the finger-like structure that accompanies the incipient cavitation, the large-scale shedding of sheet cavitation and the development of super-cavitation. This study provides a basis for understanding the lift variation of hydrofoil in different cavitation stages. The above research provides an experimental basis for understanding cloud cavitation flow and promotes the progress on the role of re-entrant jet in sheet cavitation shedding.
Leroux et al. (Leroux et al., 2004) found through high-speed photography that when the cavity length exceeds 0.5C, the development speed of the cavity length slows down. After the cavity length exceeds 0.7C, partial cavitation instability leads to shedding. Combined with the wall pressure pulsation test, it is found that this phenomenon is related to periodic fluctuations of the re-entrant jet. Leroux et al. (Leroux et al., 2005) further studied the dynamics of two kinds of cloud cavitation movement around 2D hydrofoil through numerical simulation combined with positive pressure fluid model, and found that re-entrant jet was still the main factor of cloud cavitation shedding, and the effect of shock wave could not be ignored. Dular et al. (Dular et al., 2004) used PIV to test the cavitation flow of the hydrofoil with sweeping leading edge, and analyzed the cavitation structure and the re-entrant jet with obvious three-dimensional effect, and verified the hypothesis; Huang et al. (Huang et al., 2014) obtained cavitation flow phenomenon around Clark-y through PIV technology and found that the periodic shedding of attached cavitation has an important influence on the development of vorticity in the flow field. By modifying the ZGB cavitation model, Sun et al. (Sun and Tan, 2020) accurately simulated the cavitation flow of the centrifugal pump under partial load, analyzed the mutual influence of cavitation, vortex and pressure fluctuation, and provided a new perspective for the study of cavitation in the pump. Xiao et al. (Xiao and Tan, 2020) adopted the design method of controllable velocity method to suppress the pressure pulsation in the impeller under different IGVFs, provides a new view for the design of hydraulic machinery under the condition of two-phase flow. These studies provide a reasonable theoretical and experimental basis for understanding the complex dynamic flow in cavitation flow.
Based on a large number of studies on the re-entrant jet and cloud cavitation, researchers began to adopt active/passive control methods to suppress the occurrence of cloud cavitation. In terms of active control, Yu et al. (Yu et al., 2021) studied the interaction between active ventilation and cloud cavitation around the hydrofoil, Kadivar et al. (Kadivar et al., 2018; Kadivar and Javadi, 2018; Kadivar et al., 2019) placed a cylindrical cavitating-bubble generators (CCGS)on the surface of CAV2003 hydrofoil. The CCGS generates a cavitation vortex in the wake flow to counteract the motion of the re-entrant jet, successfully delaying the shedding of cloud cavitation, and provide a three dimensional passive control design method to weaken the strength of re-entrant jet. In the research on TLV (Tip leakage vortex), Liu et al. (Liu and Tan, 2018; Liu and Tan, 2020) innovatively adopted the C groove method on the tip clearance side, and used the groove jet to impact TLV, which successfully weakened the primary and secondary TLV, providing a new idea for inhibiting TLV and improving the performance of the hydrofoil.
The S-shaped hydrofoil is mainly used in the design of bi-directional hydraulic machinery (Li et al., 2017; Ma et al., 2018; Živan et al., 2018; Zhang et al., 2021). Ramachandran et al. (Ramachandran et al., 1986) analyzed the lift-drag characteristics of four different reversible S-shaped foils in tidal power plant. They found that the S-shaped foil with a maximum camber value of 5% has the best cascade performance. Chacko et al. (Chacko et al., 1994) cut off the trailing edge of the foil by 3, 6, and 9% to study the forward and reverse performance. With the increase of the cutting length, the lift coefficient of forward condition increases, but the lift coefficient of reverse condition decreases. At the same time, the sharp trailing edge shape can improve the lift-drag in forward direction of flow. but the lift-drag in the reverse direction of flow will be deteriorated. This study provides a valuable reference for the design of asymmetric S airfoil.
The lift and drag performance of the S-shaped hydrofoil has been partially studied, and it was found that the lift of S-shaped hydrofoil would increase with the development of cavitation (Premkumar et al., 2014), contrary to the influence of cavitation on lift of conventional hydrofoil (Wang et al., 2001). These unusual changes in lift and drag may lead to bi-directional hydraulic machinery with different characteristics from other hydraulic machinery under cavitation conditions. Meanwhile, cavitation is a complex unsteady two-phase flow phenomenon, which requires further study on unsteady lift variation of S-shaped hydrofoil, especially the unsteady fluctuation characteristics of lift under cloud cavitation. In this paper, cavitation tests are performed on a symmetrical S-shaped hydrofoil. Based on the results of high-speed photography, the cavitation map of the S-shaped hydrofoil and the variation of the cavity length with the different cavitation number at two angles of attack (α = −4°and 6°) are drawn. At the same time, according to the lift-drag signal data, the correlation between lift-drag and cloud cavitation was analyzed, and the main frequency that caused the change of lift-drag around the S-shaped hydrofoil was revealed.
Experiment
Experimental Setup
The cavitation study of the S-shaped hydrofoil was carried out in the cavitation tunnel of Yangzhou University. The main part of the cavitation cavern consists of a constriction section, a test section and a diffusion section and each has a length of 2, 1, 1.8 m. The test section has an inlet rectangular section size of 0.1 × 0.22 m2 (width × height), The maximum inlet velocity of the test section can reach 15 m/s, and a steady running speed of between 4 and 12 m/s; The inlet pressure of the test section is controlled by a vacuum pump connected to the top of the water tank and the minimum inlet pressure can be reduced to 20 kPa. The lift data of the S-shaped hydrofoil is collected by the six-axis force and torque sensors with an acquisition frequency of 7,000 Hz, while the cavitating flow around the hydrofoil is recorded by a high-speed camera with an acquisition frequency of 7,000 Hz, both of which are connected to a computer for simultaneous acquisition. In addition, the cavitation tunnel can also record operating parameters such as water temperature, inlet and outlet pressure and flow rate in real time via corresponding sensors. Figure 1 is the overall image and partial image of the cavitation tunnel.
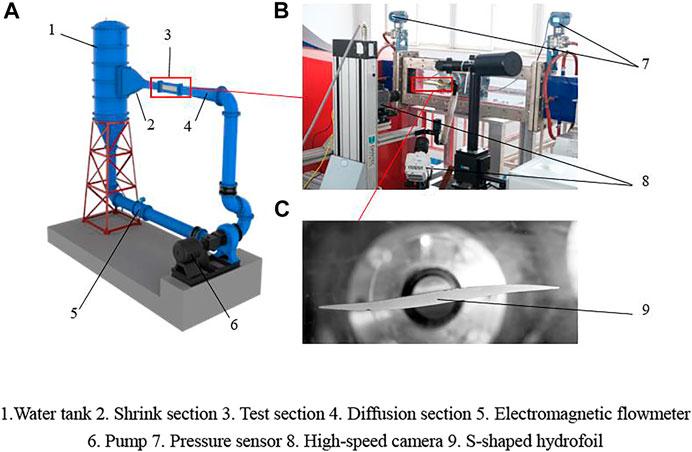
FIGURE 1. (A) Sketch of the cavitation water tunnel (B) image of test section (C) the S-shaped hydrofoil. 1. Water tank 2. Shrink section 3. Test section 4. Diffusion section 5. Electromagnetic flowmeter. 6. Pump 7. Pressure sensor 8. High-speed camera 9. S-shaped hydrofoil.
The experimental object is a S-shaped hydrofoil commonly used in bi-directional pump design. The S-shaped hydrofoil is centrally symmetrical about the midpoint of the chord and the maximum thickness of the S-shaped hydrofoil is located at 23% C and 77% C respectively. The hydrofoil has a chord length of 150 mm and a span length of 100 mm. The test angle of attack is from −16° to +16° and the inlet cavitation number is from 2.00 to 0.25, The cavitation number

TABLE 1. The parameters of the cavitation tunnel and the hydrofoil.
Uncertainty Analysis
The total uncertainty of the cavitation tunnel is mainly determined by the uncertainty values of the individual test instruments. During the experiments, the parameters of the cavitation tunnel and the hydrofoil need to be recorded, mainly including: angle of attack, lift-drag signals, inlet and outlet pressure, flow rate and water temperature. The angle of attack of the hydrofoil is precisely adjusted by an in-house designed angle adjustment mechanism, the lift-drag signals is measured by the six-axis force and torque sensors from ATI. The inlet and outlet pressures are recorded by pressure transmitters. The water temperature during the experiment is recorded by a temperature sensor. The electromagnetic flowmeter records the operating flow rate used to calculate the inlet velocity of the test section.
Table 2 shows the uncertainty values for each instrument used in the cavitation tunnel. Based on these uncertainty values, the total uncertainty of the test system for the cavitation tunnel was calculated.
Where
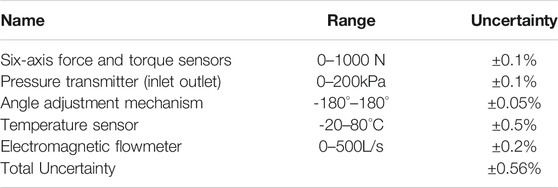
TABLE2. Uncertainty values for instruments.
Analysis of Experimental Results
Lift-Drag Characteristics of S-Shaped Hydrofoil at Different Angles of Attack
Usually when using S-shaped hydrofoil, the design process tends to flow through the convex surface first and then the concave surface. Therefore, the counterclockwise rotation direction is defined as the positive angle of attack. The positions of other geometric parameters of the S-shaped hydrofoil are all marked in Figure 2.
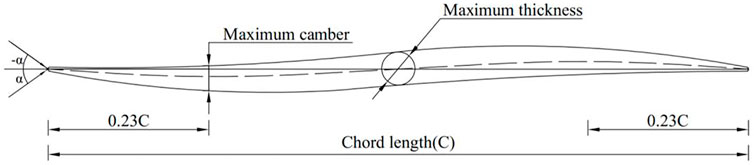
FIGURE 2. Scheme of S-shaped hydrofoil operation.
Figure 3 shows the lift-drag performance of the S-shaped hydrofoil for angles of attack from −16° to +16°. It should be noted that when the angle of attack is +16° or −16°, there is a distance of 69 mm between the hydrofoil and the upper and lower walls, and the limit of the angle of attack in cavitation test is −12°–12°, which will not cause blocking effect. As can be seen in Figure 3: the angle of attack for zero lift is at +1°. When the positive and negative angles of attack reach +12° and −12° respectively, the lift of the hydrofoil starts to decrease and the S-shaped hydrofoil reaches the stall angle of attack. The angle of attack for positive lift ranges from 1° to 11° and for negative lift from −12° to +1°. Negative lift operates at a wider range of angles of attack and has a greater maximum lift value than positive lift, however, the angle of attack for positive lift corresponds to a lower drag value. For further comparison in this paper, the suction surface and pressure surface shown in Figure 2 are defined uniformly.
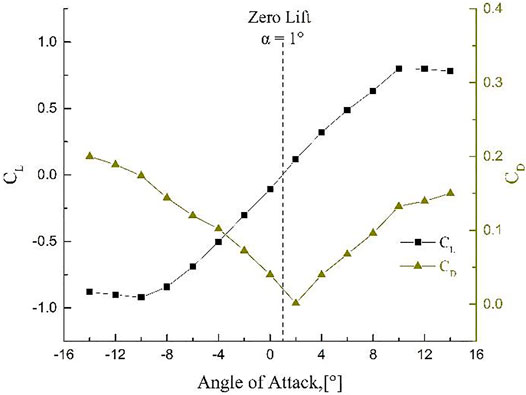
FIGURE 3. Lift-drag performance of hydrofoil with different angles of attack.
The S-Shaped Hydrofoil Cavitation Mapping Analysis
According to the images measured by the high-speed photography experiment in the cavitation water tunnel, the cavitation maps at different angles of attack and different cavitation numbers as shown in Figure 4 are drawn. Figure 4 is mainly consists of cavitation contours with l/C = 0.25, l/C = 0.5, l/C = 0.75, and l/C = 1 and the sheet/cloud cavitation area. The shaded part is the region of cloud cavitation, and the blank part is the region of sheet cavitation. As is shown in Figure 4A: when α∈(0°,4°), the cavitation of S-shaped hydrofoil is always in the stage of sheet cavitation, mainly because the thickness of cavity is not enough to produce cloud cavitation. However, when α∈(4°,6°), the cavitation number of cloud cavitation inception increases gradually as the angle of attack increases and the cavity length develops to 0.75–1C. Due to the curvature of the latter part of the S-shaped hydrofoil is larger than that of the conventional hydrofoil, the strength of re-entrant jets at the tail of cavity is strengthened. Although the strength of the re-entrant jets still cannot cut off the cavity from the leading edge of the hydrofoil, it causes the holes from 0.5 to 1C to change into an unstable state, resulting in a periodic change in the cavity length from 0.5C to l。When α belongs to (6°, 10°), the sheet cavitation is always transformed into cloud cavitation near the maximum cavity length developed to 0.25l.
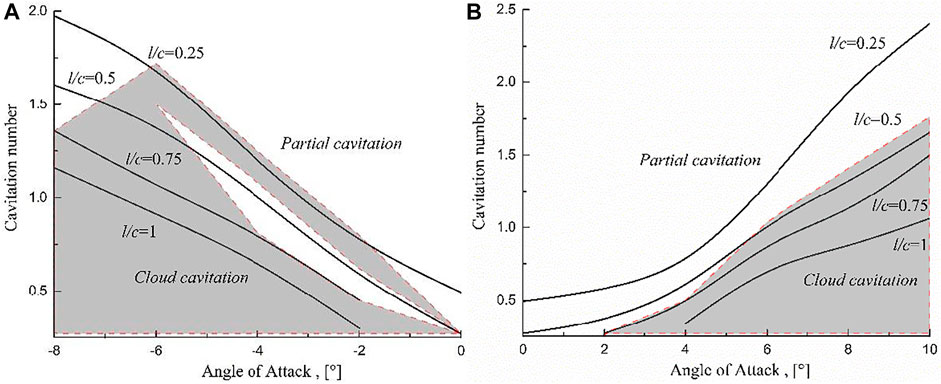
FIGURE 4. Cavitation map of S-shaped hydrofoil at different angles of attack. ((A) negative angle of attack, (B) positive angle of attack).
As is shown in Figure 4B:when α∈(−6°,0°) and the cavity length reaches 0.5C, there is a phenomenon that cloud cavitation changes to sheet cavitation, mainly because the re-entrant jets at the tail of the cavity is affected by the S-shaped characteristics of the hydrofoil, and the sheet cavity cannot be cut off to form cloud shedding. Until the cavity length exceeds 0.75C, cloud cavitation can occur again. With the further decrease of the Angle of attack α∈ (−8°,−6°), the influence of the shape of hydrofoil on the movement of the re-entrant jet weakens, and this phenomenon gradually disappears.
Relationship Between Cavitation Number and Cavity Length
Since α = +6° is the common angle of attack designed for pumps, and the lift coefficients of the angles of attack of+6° and −4° are almost the same, these two angles of attack are selected for further comparison of cavitation performance. As is shown in Figure 5 and Figure 6, first, the growth rate of the cavity length of α = −4° obviously exceeds that of α = 6°. When the maximum cavity length is l∈ (0,0.5C), since the shape characteristics of the front half of the S-shaped hydrofoil are similar to the conventional hydrofoil, the development of cavitation is also similar. When α = −4° and the maximum cavity length reaches 0.23 l, periodic cloud cavitation will occur. But when α = +6° and the maximum cavity length reaches 0.27 l, periodic cloud cavitation will occur. The main reason is that at negative angle of attack, the pressure surface is more likely to induce vortex, which intensifies the generation and shedding of cavity and produces cavitation inception and cloud cavitation earlier than that at positive angle of attack. When the cavitation number further decreases, and the maximum cavity length develops between 0.5 and 0.75C, the cavitation has been in the cloud cavitation stage and the cycle time of cloud cavitation gradually increases at α = +6°. but when α = −4°, the cavitation stage in Figures 5C,D changes from cloud cavitation to “stable” sheet cavitation. Finally, when the maximum cavitation length is between 0.75C and C, The cavitation is still in the cloud cavitation stage at α = +6°.The cavitation is again transformed from sheet cavitation to periodic cloud cavitation at α = −4°.
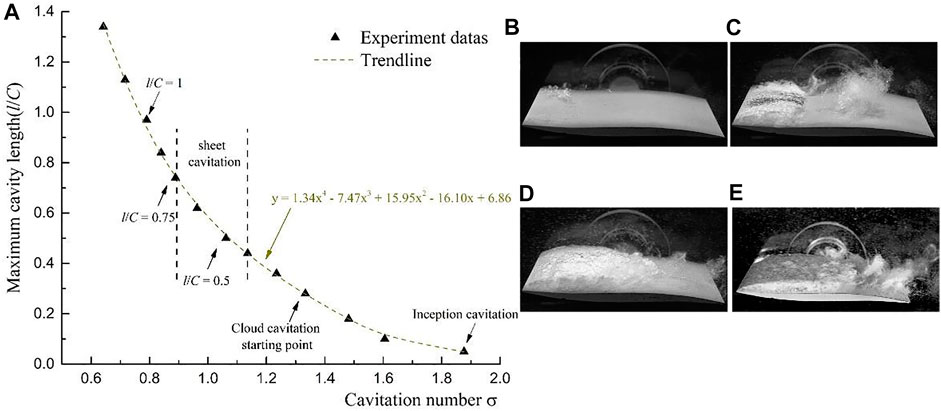
FIGURE 5. The relationship between cavitation number and cavity length (U∞ = 9 m/s, α = -4°).
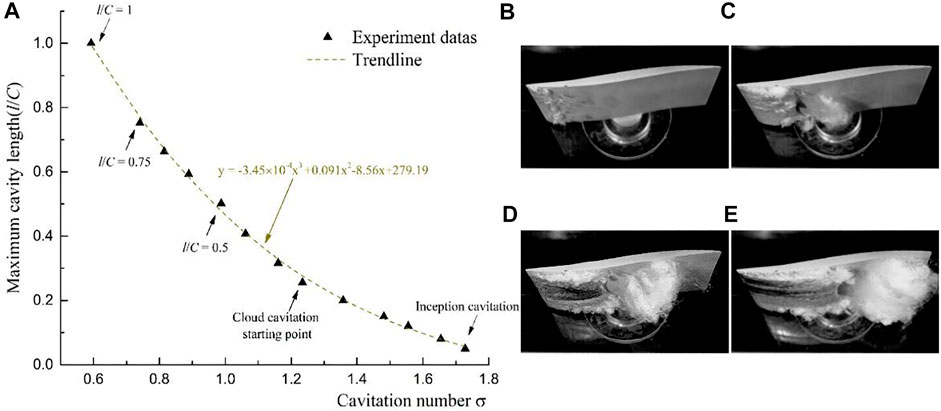
FIGURE 6. The relationship between cavitation number and cavity length (U∞ = 9 m/s, α = +6°).
Flow Characteristics of Cloud Cavitation
Two cavitation numbers with obvious periodicity of cloud cavitation were selected for detailed analysis. Figure 7 is the cloud cavitation images recorded by high-speed photography, in which, the cavitation number in Figure 7A is 1.13, and that in Figure 7B is 0.98. The cycle time of cloud cavitation in Figure 7A is Tref1 = 0.022s, and the shedding frequency f1 = 45.5 Hz. From t = t1 to t = t4, the cavitation around the hydrofoil is in the stage of sheet cavitation, and the maximum cavity length has developed to l = 0.4C, and the fog-like cavitation group of the last shedding period remains at the trailing edge. Under the joint movement of the re-entrant jets from the tail of cavity and the side-entrant jets on both sides of the wall, the vapor-liquid interface begins to become blurred, from the original smooth “mirror surface” with obvious boundaries to the non-smooth vapor-liquid mixture. When the re-entrant jets reach the leading edge of the hydrofoil, the sheet cavity can no longer maintain its maximum cavity length, and the sheet cavity is cut off from the leading edge, resulting in a large scale cloud shedding. From t = t5 to t = t6, after the large-scale cavity that has fallen off quickly leave the surface of the hydrofoil and moves towards the trailing edge of the hydrofoil as a cloud of vapor-liquid mixture. At the same time, the sheet cavity of the suction surface re-grows from the leading edge of the hydrofoil. From t = t7 to t = t8, the shed cloud cavity gradually breaks up after moving to the high pressure region, and the sheet cavity on the hydrofoil surface again reach the maximum cavity length of l = 0.4C. The sheet cavity again shows a mirror effect at the vapor-liquid interface and the cavitation on the hydrofoil surface is about to enter the next shedding cycle.
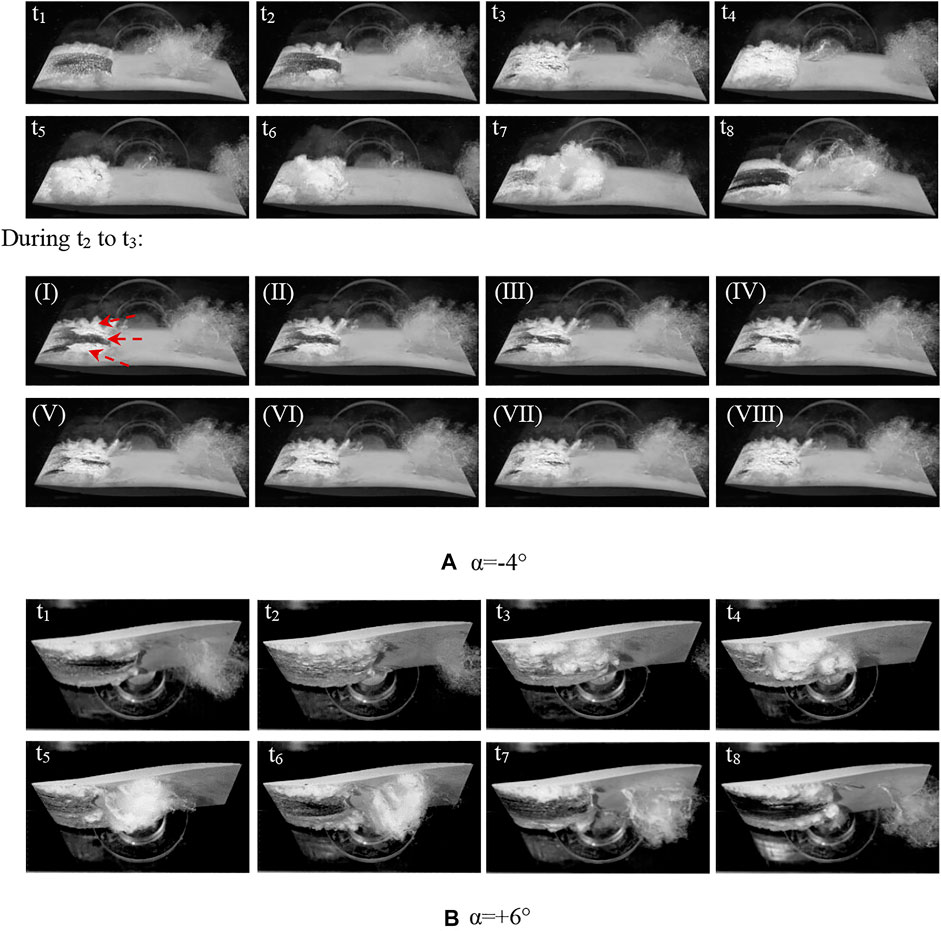
FIGURE 7. The dynamic evolution of cloud cavitation (U∞ = 9 m/s).
When the angle of attack is +6° and the cavitation number decreases to 0.98, the cycle time of cloud cavitation is Tref2 = 0.026 s, the shedding frequency of cloud cavitation f2 = 38.4 Hz, and the maximum cavity length develops to 0.5C. The cloud cavitation phenomena at the two different angles of attack have similar motion characteristics, and both have experienced a cloud cavitation and shedding process from cavity growth to shedding to collapse (regrowth). The shedding of the sheet cavity at two different angles of attack is dominated by the movement of the re-entrant jet. Before the cavity is cut off by the re-entrant jet, the cavity surface will be impacted by the movement of the re-entrant jet from smooth “mirror” to a non-smooth gas-liquid mixture state. During the process of sheet cavity regrowth, smooth interface is formed on the cavity surface.
Evolution of Lift Fluctuations Caused by Cloud Cavitation
While recording the two cloud cavitation phenomena in Figure 7, a six-axis force and torque sensors was used to simultaneously collect the evolution in lift signals during a period of T = 1s. In Figure 8 and Figure 10, the fluctuation range of lift signals in the non-cavitation condition is significantly lower than that in the cloud cavitation condition. In addition, the lift signal fluctuations at α = +6° is significantly greater than −4°, which may be caused by more intense flow-induced vortex around the S-shaped hydrofoil. Apply the fast Fourier transform to process the four different fluctuating lift signals, and obtain the frequency spectra of the lift signals (Figures 9A,B and Figures 11A,B). As can be seen from Figure 9, in the non-cavitation condition, when α = −4°, the frequency of lift coefficient is widely distributed within 0–200 Hz and 400–1000 Hz. The amplitude of each frequency is small difference and there is almost no obvious main frequency. When α = +6°, the frequency spectra of the lift signals can clearly see that the main frequency is about 200 Hz and there is a lower amplitude distribution in the range of 200–700 Hz. There are obvious differences in the frequency spectra at different in the angle of attack, mainly due to the difference in vortex around S-shaped hydrofoil caused by the changes angles of attack, and it can be seen that the frequency domain distribution of Figure 9A is more stable than Figure 9B
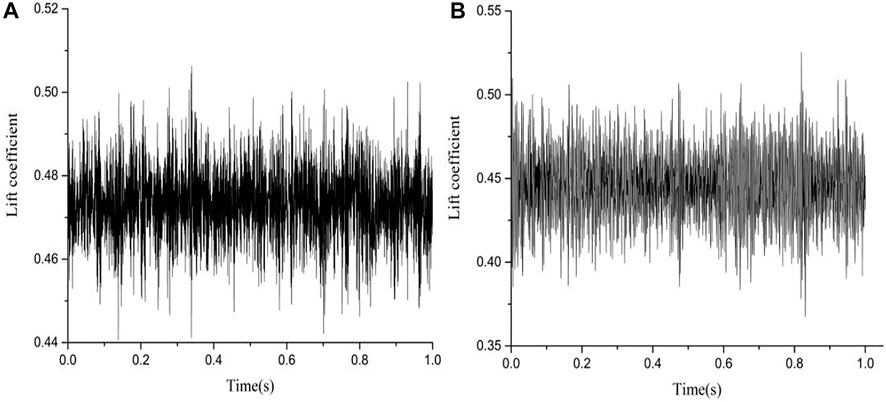
FIGURE 8. Original lift signals at non-cavitation conditions. ((A) α = -4°, σ = 1.95、(B) α = 6°, σ = 1.95).
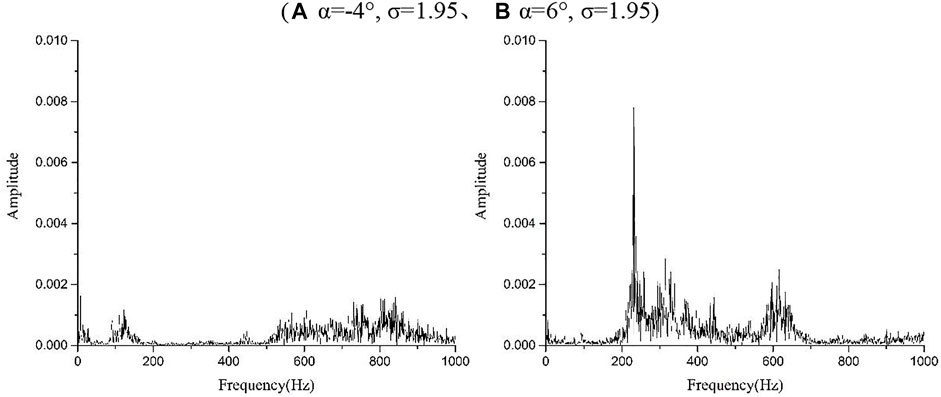
FIGURE 9. Frequency spectra of the lift signals at non-cavitation conditions. ((A) α = -4°, σ = 1.95、(B) α = 6°, σ = 1.95).
Figure 10 is the original lift signals during the evolution of cloud cavitation. When cloud cavitation occurs, the lift signals change more dramatically, mainly because the evolution of cloud cavitation causes the change of pressure distribution on the hydrofoil surface, which affects the lift signals. Cloud cavitation is the main flow phenomenon around hydrofoil. The fluctuation of lift signals should be determined by the movement period of cloud cavitation, that is, the main frequency of lift signals is consistent with the frequency of cloud cavitation. The frequency spectra of lift signals (Figure 10) are shown in Figure 11. As can be seen in Figure 11, the main frequency of the lift signals in Figure 11A is fL1 = 93 Hz ≈ 2f1 and the main frequency of the lift signals in Figure 11B is fL2 = 77 Hz ≈ 2f2. The main frequency of the lift coefficient at two different angles of attack is twice the frequency of the cloud cavitation shedding. It means that in one cycle of cloud cavitation shedding, it causes two periodic fluctuations in the lift signals. At the same time, there are also frequency components of approximately 200–800 Hz in the frequency spectra of the cloud cavitation conditions.
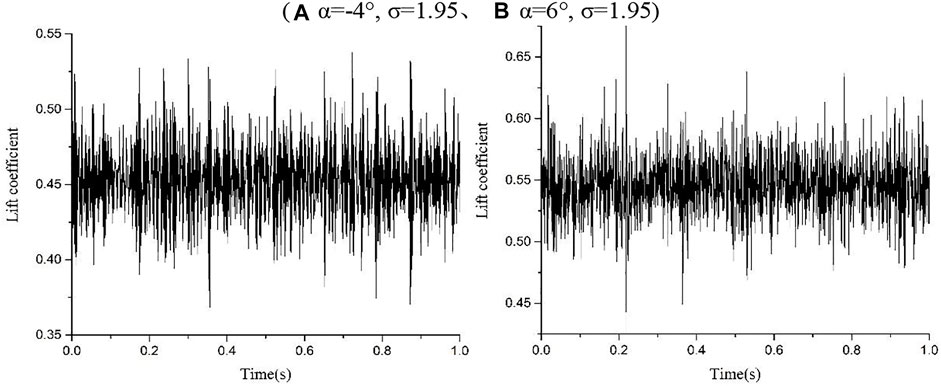
FIGURE 10. Original lift signals at cloud cavitation conditions.
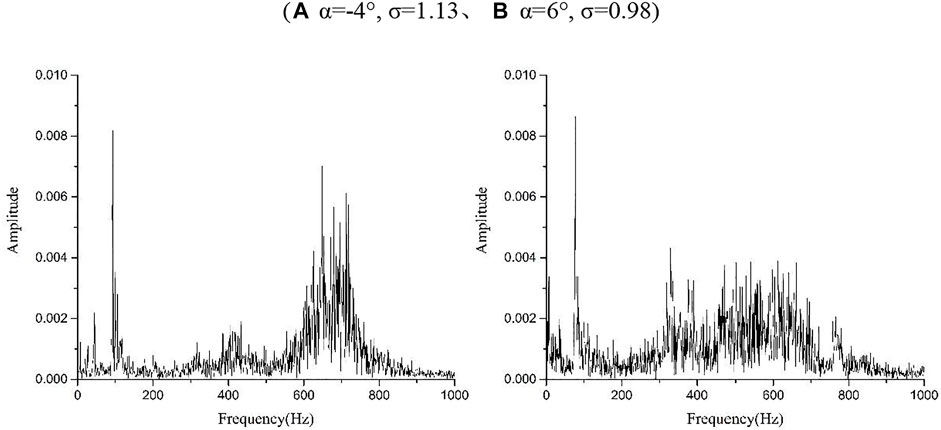
FIGURE 11. Frequency spectra of the lift signals at cloud cavitation conditions. ((A) α = -4°, σ = 1.13、(B) α = 6°, σ = 0.98)
Conclusion
In this paper, the lift and drag characteristics of S-shaped hydrofoil at different attack angles are recorded by cavitation tunnel, and the cavitation images at different cavitation numbers are collected by high speed photography. In order to further study the cavitation performance of S-shaped hydrofoil, two angles of attack (α = −4° and α = +6°) were selected to conduct detailed comparison from three aspects: cavity length, cloud cavitation movement and lift signal fluctuation.
(1) Under non-stalling conditions, the angle of attack of negative lift has a wider operation range and the maximum lift value is larger than the angle of attack of positive lift, but the drag corresponding to the angle of attack of positive lift is smaller. If bi-directional hydraulic machinery pursues the highest efficiency, it is recommended to choose a positive angle of attack for design.
(2) The cavitation map of S-shaped hydrofoil shows that regardless of positive or negative angle of attack, cloud cavitation always occurs when the maximum cavity length develops to about 0.25 l, The development of cavitation at the positive angle of attack is similar to that of the conventional hydrofoil, but there is an unconventional phenomenon at negative angle of attack α∈(−6°, 0°): During the process of cavitation number decreases, the cavitation will change from cloud cavitation to sheet cavitation.
(3) Both incipient cavitation and cloud cavitation inception at α = −4° are earlier than that at α = +6°, and the growth rate of cavity length at α = −4° is obviously faster than that at α = +6°. However, when the maximum cavity length l∈ (0.5C, 0.75C), cloud cavitation changes to sheet cavitation at α = −4°. For bi-directional hydraulic machinery that may operate under severe cavitation conditions, the angle of attack of −4° can be considered in the design.
(4) The formation mechanism of cloud cavitation at two different angles of attack is the same, both of which are caused by the instability and shedding of sheet cavity due to the motion of the re-entrant jet. The lift fluctuations of α = +6° obviously exceed α = −4° at the non-cavitation conditions. After the occurrence of cloud cavitation, the main frequency of lift signals at two angles of attack is half of the shedding frequency of cloud cavitation. This phenomenon means that the unsteady performance of bi-directional hydraulic machinery designed with S-shaped hydrofoil may be different from that designed with conventional hydrofoil under cavitation conditions.
In this paper, the movement details of the re-entrant jet and the reasons for the evolution of the lift signals are still not very clear. Those phenomena may be related to the change of surface pressure caused by the unique S-shape of hydrofoil, and we will discuss the internal flow through numerical simulation combined with experimental data in future work to provide a basis for the study of cavitation flow in bi-directional hydraulic machinery.
Data Availability Statement
The original contributions presented in the study are included in the article/Supplementary Material, further inquiries can be directed to the corresponding author.
Author Contributions
HL completed the writing and experiment part, PL completed the data processing, FT provided theoretical guidance and financial support, Ye chen helped to modify the article, WZ and SY provided the experimental guidance.
Funding
A project funded by the Priority Academic Program Development (PAPD) of Jiangsu Higher Education Institutions Support for construction.
Conflict of Interest
The author YC was employed by the company JiangSu TaiHu Planning and Design Institute of Water Resources Co., Ltd. The author SY was employed by the company Nanjing Water Planning and Designing Institute Corp., Ltd.
The remaining authors declare that the research was conducted in the absence of any commercial or financial relationships that could be construed as a potential conflict of interest.
Publisher’s Note
All claims expressed in this article are solely those of the authors and do not necessarily represent those of their affiliated organizations, or those of the publisher, the editors and the reviewers. Any product that may be evaluated in this article, or claim that may be made by its manufacturer, is not guaranteed or endorsed by the publisher.
References
Arndt, R. E. A. (2003). Cavitation in Vortical Flows. Annu. Rev. Fluid Mech. 34 (1), 143–175. doi:10.1146/annurev.fluid.34.082301.114957
Chacko, B., Balabaskaran, V., Tulapurkara, E. G., and Radha Krishna, H. C. (1994). Performance of S-Cambered Profiles with Cut-Off Trailing Edges. J. Fluids Eng. 116, 522–527. doi:10.1115/1.2910308
Dular, M., Bachert, R., Stoffel, B., and Širok, B. (2004). Experimental Evaluation of Numerical Simulation of Cavitating Flow Around Hydrofoil. Eur. J. Mech. B-fluid 24, 522–538. doi:10.1016/j.euromechflu.2004.10.004
Foeth, E. J., van Doorne, C. W. H., van Terwisga, T., and Wieneke, B. (2006). Time Resolved PIV and Flow Visualization of 3D Sheet Cavitation. Exp. Fluids 40, 503–513. doi:10.1007/s00348-005-0082-9
Foeth, E. J., van Terwisga, T., and van Doorne, C. (2008). On the Collapse Structure of an Attached Cavity on a Three-Dimensional Hydrofoil. J. Fluids Eng.-Trans. ASME 130, 071303. doi:10.1115/1.2928345
Huang, B., Zhao, Y., and Wang, G. (2014). Large Eddy Simulation of Turbulent Vortex-Cavitation Interactions in Transient Sheet/cloud Cavitating Flows. Comput. Fluids 92, 113–124. doi:10.1016/j.compfluid.2013.12.024
Kadivar, E., and Javadi, K. “Effect of Cavitating-Bubble Generators on the Dynamics of Unsteady Cloud Cavitation,” in Proceedings of the Marine Industries Conference, Edinburgh, September 2018.
Kadivar, E., Moctar, O. E., and Javadi, K. (2018). Investigation of the Effect of Cavitation Passive Control on the Dynamics of Unsteady Cloud Cavitation. Appl. Math. Model. 64, 333–356. doi:10.1016/j.apm.2018.07.015
Kadivar, E., Moctar, O. E., and Javadi, K. (2019). Stabilization of Cloud Cavitation Instabilities Using Cylindrical Cavitating-Bubble Generators (CCGs). Int. J. Multiphase Flow 115, 108–125. doi:10.1016/j.ijmultiphaseflow.2019.03.019
Kawanami, Y., Kato, H., Yamaguchi, H., Tanimura, M., and Tagaya, Y. (1997). Mechanism and Control of Cloud Cavitation. J. Fluids Eng.-Trans. ASME 119, 788–794. doi:10.1115/1.2819499
Knapp, R. T. (1955). Recent Investigations of the Mechanics of Cavitation and Cavitation Damage. J. Fluids Eng.-Trans. ASME 77, 1045–1054.
Kubota, A., Kato, H., Yamaguchi, H., and Maeda, M. (1989). Unsteady Structure Measurement of Cloud Cavitation on a Foil Section Using Conditional Sampling Technique. J. Fluids Eng.-Trans. ASME 111, 204–210. doi:10.1115/1.3243624
Leroux, J.-B., Astolfi, J. A., and Billard, J. Y. (2004). An Experimental Study of Unsteady Partial Cavitation. J. Fluids Eng. 126, 94–101. doi:10.1115/1.1627835
Leroux, J.-B., Coutier-Delgosha, O., and Astolfi, J. A. (2005). A Joint Experimental and Numerical Study of Mechanisms Associated to Instability of Partial Cavitation on Two-Dimensional Hydrofoil. Phys. Fluids 17 (5), 052101. doi:10.1063/1.1865692
Li, D., Wang, H., Qin, Y., Han, L., Wei, X., and Qin, D. (2017). Entropy Production Analysis of Hysteresis Characteristic of a Pump-Turbine Model. Energ. Convers. Manag. 149, 175–191. doi:10.1016/j.enconman.2017.07.024
Liu, Y., and Tan, L. (2020). Influence of C Groove on Suppressing Vortex and Cavitation for a NACA0009 Hydrofoil with Tip Clearance in Tidal Energy. Renew. Energ. 148, 907–922. doi:10.1016/j.renene.2019.10.175
Liu, Y., and Tan, L. (2018). Method of C Groove on Vortex Suppression and Energy Performance Improvement for a NACA0009 Hydrofoil with Tip Clearance in Tidal Energy. Energy 155, 448–461. doi:10.1016/j.energy.2018.04.174
Luo, X.-W., Ji, B., and Tsujimoto, Y. (2016). A Review of Cavitation in Hydraulic Machinery. J. Hydrodyn. 28, 335–358. doi:10.1016/s1001-6058(16)60638-8
Ma, P., Wang, J., and Wang, H. (2018). Investigation of Performances and Flow Characteristics of Two Bi-directional Pumps with Different Airfoil Blades. Sci. China Technol. Sci. 61, 1588–1599. doi:10.1007/s11431-017-9195-x
Premkumar, T. M., Kumar, P., and Chatterjee, D. (2014). Cavitation Characteristics of S-Blade Used in Fully Reversible Pump-Turbine[J]. J. Fluids Eng. 136 (5), 051101. doi:10.1115/1.4026441
Ramachandran, R., Krishna, H., and Narayana, P. (1986). Cascade Experiments over “S” Blade Profiles. J. Energ. Eng. 112 (1). doi:10.1061/(asce)0733-9402(1986)112:1(37)
Sun, W. H., and Tan, L. (2020). Cavitation-Vortex-Pressure Fluctuation Interaction in a Centrifugal Pump Using Bubble Rotation Modified Cavitation Model under Partial Load[J]. J. Fluids Eng. 142, 051206. doi:10.1115/1.4045615
Wang, G., Senocak, I., Shyy, W., Ikohagi, T., and Cao, S. (2001). Dynamics of Attached Turbulent Cavitating Flows. Prog. Aerospace Sci. 37, 551–581. doi:10.1016/s0376-0421(01)00014-8
Xiao, W., and Tan, L. (2020). Design Method of Controllable Velocity Moment and Optimization of Pressure Fluctuation Suppression for a Multiphase Pump. Ocean Eng. 220 (2), 108402. doi:10.1016/j.oceaneng.2020.108402
Yu, A., Qian, Z., Wang, X., Tang, Q., and Zhou, D. (2021). Large Eddy Simulation of Ventilated Cavitation with an Insight on the Correlation Mechanism between Ventilation and Vortex Evolutions. Appl. Math. Model. 89, 1055–1073. doi:10.1016/j.apm.2020.08.011
Zhang, X., Tang, F., Liu, C., Shi, L., Liu, H., Sun, Z., et al. (2021). Numerical Simulation of Transient Characteristics of Start-Up Transition Process of Large Vertical Siphon Axial Flow Pump Station. Front. Energ. Res. 9, 706975. doi:10.3389/fenrg.2021.706975
Živan, S., Miloš, J., and Jasmina, B. J. (2018). Design and Performance of Low-Pressure Reversible Axial Fan with Doubly Curved Profiles of Blades. J. Mech. Sci. Technol. 32, 3707–3712.
Zwart, P. J., Gerber, A. G., and Belamri, T. “A Two-phase Flow Model for Predicting Cavitation Dynamics,” in Proceedings of International Conference on Multiphase Flow, Yokohama, Japan, May-June 2004.
Glossary
Notation
α = Angle of attack (°)
C = Chord length (m)
l = Cavity length (along the hydrofoil center line) (m)
σ = Cavitation number
f1, f2 = Cloud cavitation frequency (Hz)
fL1, fL2 = Lift pulsation frequency (Hz)
Tref1, Tref2 = The cycle time of cloud cavitation at α = -4°,+6° (s)
t = Different moments in cloud cavitation (s)
CL, CD = Lift coefficient, drag coefficient
Pin = The inlet pressure (Pa)
Pv = The saturated vapor pressure (Pa)
U∞ = The inlet velocity (m/s)
ETotal = The total uncertainty of the cavitation tunnel
Es = The uncertainty of the six-axis force and torque sensors
EP = The uncertainty of the temperature sensor
EA = The uncertainty of the angle adjustment mechanism
ET = The uncertainty of the temperature sensor
EE = The uncertainty of the electromagnetic flowmeter
Keywords: S-shaped hydrofoil, cloud cavitation, high-speed visualization, unsteady lift fluctuations, re-entrant jet
Citation: Liu H, Lin P, Tang F, Chen Y, Zhang W and Yan S (2021) Experimental Study on the Relationship Between Cavitation and Lift Fluctuations of S-Shaped Hydrofoil. Front. Energy Res. 9:813355. doi: 10.3389/fenrg.2021.813355
Received: 11 November 2021; Accepted: 02 December 2021;
Published: 16 December 2021.
Edited by:
Lei Tan, Tsinghua University, ChinaReviewed by:
Changchang Wang, Beijing Institute of Technology, ChinaYabin Liu, University of Edinburgh, United Kingdom
Copyright © 2021 Liu, Lin, Tang, Chen, Zhang and Yan. This is an open-access article distributed under the terms of the Creative Commons Attribution License (CC BY). The use, distribution or reproduction in other forums is permitted, provided the original author(s) and the copyright owner(s) are credited and that the original publication in this journal is cited, in accordance with accepted academic practice. No use, distribution or reproduction is permitted which does not comply with these terms.
*Correspondence: Fangping Tang, tangfp@yzu.edu.cn