Overnight-Intraday Mispricing of Chinese Energy Stocks: A View from Financial Anomalies
 Min Zhou1
  Xiaoqun Liu2*
- 1School of Design and Art, Hunan Institute of Technology, Hengyang, China
- 2School of Economics, Hainan University, Haikou, China
We verify the existence of firm-level “intraday return vs. overnight return” pattern and overnight-intraday effect of nine financial anomalies of Chinese energy industry stocks of the Chinese stock market. Though energy finance has been an independent research area, we also take Chinese A-shares stocks as samples for empirical analysis to avoid the so-called sample selection bias. Specifically, it verifies that the overnight returns are strongly negative and intraday returns are positive for energy industry stocks, which is totally contrary to the American stock markets. In addition, alphas of the zero-cost strategies based on nine classic financial anomalies are almost earned at night for energy industry stocks. Finally, it is risk-related anomalies that occur overnight for energy industry stocks, while both four risk-related anomalies and two firm characteristics related anomalies occur at night for all A-shares stocks. Our empirical findings based on Chinese financial markets enrich the existing research on the mispricing of financial anomaly and shed a new sight on the asset pricing in energy finance.
1 Introduction
The empirical analysis of the existence and mechanism of financial anomalies have always attracted much attention from scholars. In recent years, extant papers mainly focus on pinning down which model is optimal to simultaneously depict financial anomalies, and how to make profits through those financial anomalies. Admittedly, financial anomaly represents an access to arbitrage, and investors can fully exploit this mispricing opportunity by constructing zero-costing trading strategies and exactly quantify the risk exposure of the anomaly by Fama and MacBeth (1973) regression.
Numerous financial anomalies are usually documented by various factor models, including the three-factor model of Fama and French (1993), the five-factor model of Fama and French (2015), the four-factor model of Fama and French (1993) and Carhart (1997), the four-factor “q-factor” model of Hou et al. (2015a), and the four-factor mispricing-factor model of Stambaugh et al. (2015). For instance, Stambaugh et al. (2015) construct two mispricing factors from the set of 11 prominent anomalies examined by Stambaugh et al. (2012), Stambaugh et al. (2014), Stambaugh et al. (2015). In addition, Hou et al. (2015a), Hou et al. (2015b) examined 73 anomalies, such as the total volatility, idiosyncratic volatility, and systematic volatility in Ang et al. (2006), the failure probability in Campbell et al. (2008), the dispersion of analysts’ earnings forecasts in Diether et al. (2002), the total accrual in Richardson et al. (2005), and the illiquidity in Amihud (2002). They concluded that their q-factor model consisting of the market factor, a size factor, an investment factor, and a profitability factor largely summarizes the cross-section of average stock returns, while one-half of the anomalies are insignificant in the broad cross-section.
Anomalies mean that we could earn profits by a long-short strategy based on the specific anomaly, that is, a chance of arbitrage exists. Taking the Ang et al. (2006) idiosyncratic volatility and Campbell et al. (2008) distress risk, for example, both high idiosyncratic stocks and financially distressed stocks have delivered anomalously low return, named idiosyncratic volatility puzzle and financial distress puzzle by researchers, respectively. These two puzzles represent that the investors could earn profits by trading strategies of long (short) high (low) idiosyncratic stocks and long (short) high (low) financially distressed stocks.
In recent years, the literature documents unique characteristics of the components of close-to-close return among different financial markets (Cliff et al., 2008; Cai and Qiu 2009; Kelly and Clark 2011; Aboody et al., 2018; Lou et al., 2019; Muravyev and Ni 2020; Hendershott et al., 2020; Qiao and Dam 2020). Specifically, Cliff et al. (2008) document that strongly positive return at night and negative return during the day holds for individual stocks, equity indexes, and future contracts on equity indexes Cai and Qiu (2009) find that overnight non-trading period returns are significantly higher than both trading period returns and close-to-close daily returns in 23 countries at the stock index level, and they asserted that short selling contributed to this phenomenon. Kelly and Clark (2011) also report the positive overnight and negative intraday risk premium at index exchange-traded funds level. Aboody et al. (2018) examine the suitability of using overnight returns to measure firm-specific investor sentiment by analyzing whether they possess characteristics expected of a sentiment measure. Lou et al. (2019) verify the overnight-intraday effect with 14 anomalies, demonstrating that risk-adjusted alphas are either totally overnight effect or totally intraday effect. Muravyev and Ni (2020) decompose option returns into intraday and overnight components, finding a pattern of positive intraday returns and negative overnight returns. Hendershott et al. (2020) find that stock returns are positively related to beta overnight, whereas returns are negatively related to beta during the trading day. Qiao and Dam (2020) document the average overnight return in the Chinese stock market is negative and argue that the “T+1” trading rule contributes significantly to this overnight return puzzle.
Energy finance is interdisciplinary, setting up a bridge on two most important industries, that is, finance and energy, in real life. In recent years, topics on asset pricing, financial risk management, investment, and so on have been widely applied in the energy industry area (Wen et al., 2021a; Wen et al., 2021b; Cao et al., 2022; Farouq et al., 2021; Liu et al., 2021; Peng et al., 2021; Tian et al., 2021; Zheng et al., 2021). In this paper, we verify the existence of firm-level “intraday return vs. overnight return” pattern and overnight-intraday effect of nine financial anomalies in the energy industry market. Though energy finance has been an independent research area, we also take A-shares stocks as samples for empirical analysis to avoid the so-called sample selection bias. The empirical results show that strong persistence of overnight and intraday firm-level return emerge both in energy industry stocks and A-shares stocks. In addition, the overnight returns are strongly negative and intraday returns are positive, which is totally contrary to the American stock markets. However, Qiao and Dam (2020) also provide evidence of negative overnight returns in the Chinese stock market, and they argue that the “T+1” trading rule contributes significantly to this overnight return puzzle. Finally, profits are almost earned entirely overnight among nine trading strategies in energy industry stocks and A-shares stocks, which is sharply in contrast to the results of Lou et al. (2019).
The organization of this paper is as follows. Section 2 puts forward the motivation, a brief summary of energy finance, and potential contributions. Section 3 describes the data and methodology. Section 4 presents the empirical analysis of the anomaly strategies at levels of portfolio analysis and Fama-MacBeth regression. Section 5 concludes.
2 Motivation and Contribution
Motivated by the literature on non-trading hour vs. trading hour return patterns at individual stock, index stock, and index fund levels, the overnight-intraday effect from a portfolio strategies view of Lou et al. (2019), and the special overnight effect in the Chinese stock market of Qiao and Dam (2020), we attempt to examine overnight-intraday trading strategies in the cross-section of energy industry stock returns in China. As for the construction of trading strategies, we choose the basic five financial anomalies according to the five-factor model of Fama and French (2015) and the “q-factor” model of Hou et al. (2015a), that is, size, value, momentum, reversal, and profitability. In addition, we choose the following most influential anomalies, named idiosyncratic volatility puzzle, beta, and turnover.
Energy is the foundation and driving force for the progress of human civilization. Energy and resource constraints, together with climate change, environmental risks, and challenges have become severe global problems in the modern world. How to develop a clean and low-carbon energy strategy matters to world energy security, to addressing global climate change, and to boosting global economic growth. Energy finance mainly focuses on the significant connection between energy and finance. As the asset pricing and financial risk management are the frontiers in finance (Güngör and Tastan 2021; Huong et al., 2021; Liow et al., 2021; Mao and Zhang 2021; Umutlu and Bengitöz 2021), in recent years, the literatures on energy-based asset pricing, and energy financial risk management have received considerable attention (Gong and Lin 2017, Gong and Lin 2018, Gong and Lin 2021; Gong et al., 2021).
Energy finance is an interdisciplinary, setting up a bridge between two most important industries in real life. In recent years, topics on asset pricing, financial risk management, investment, and so on have been widely applied in the energy industry area (Lian et al., 2020; Ye et al., 2020; Zolfaghari et al., 2020; Dai et al., 2021; Ghoddusi and Wirl, 2021; Si et al., 2021; Wang et al., 2021). Specifically, Lian et al. (2020) examine how the tail behavior of various risk factors affects the tail behavior of individual oil stock returns; Ye et al. (2020) investigate the interaction between crude oil prices and investor sentiment from the time and the frequency domains; Zolfaghari et al. (2020) verify that the energy market and the stock market have stronger co-volatility spillover than foreign currency market; Ghoddusi and Wirl (2021) discuss the risk-hedging feature of the refinery industry when the crude oil market faces supply vs. demand shocks; Dai et al. (2021) demonstrate that the skewness of oil price return can predict the aggregate stock market returns; Si et al. (2021) investigate the effects of financial deregulation on the energy enterprises’ operational risks in China; Wang et al. (2021) examine the impact of equity concentration on the investment efficiency of Chinese energy companies based on the shock that the shareholding ratio restriction of qualified foreign institutional investors (QFIIs) is relaxed.
The potential contributions of this paper are as follows: at first, it is a nature point that we investigate the overnight-intraday effect of trading strategies in the energy industry, and as far as we know, we are the first to empirically test which financial anomaly belongs to overnight effect or intraday effect in the energy industry stocks as well as in A-shares stocks. Second, we demonstrate the pattern of overnight anomaly vs. intraday anomaly both in the Chinese energy industry market and Chinese A-shares markets, thus, it could not only avoid the sample bias, but also contribute to the empirical asset pricing in the area of energy finance. Last, it is beneficial to well understand the financial anomalies in a particular industry and in all Chinese A-shares stock markets from the perspective of components of return, as we do find differences between these two samples. That is, in cases of trading strategies based on market risk and liquidity risk, profits are earned entirely overnight for energy industry stocks, while there are much more financial anomalies belonging to overnight effect for A-shares stocks beside the risk-related anomalies.
3 Data and Methodology
The data is collected from China Stock Market & Accounting Research (CSMAR) database and Wind database from January 2001 to December 2019 for all energy stocks and A-shares stocks traded in Chinese stock markets. Stocks with prices below ¥1 a share are excluded from the sample. For each firm i, at one day d, we decompose daily close-to-close return
Then, we calculate the monthly overnight return and intraday return by accumulating the above daily return components across days in each month d, namely
Because we conduct our trading strategies at the portfolio level, so we also calculate the following three components of the portfolio, p,
where
The main object of this paper is to analyze which financial anomalies belong to overnight effect or intraday effect, so it is of interest to explain how to measure these anomalies as well. Based on the influential five-factor model of Fama and French (2015) and the “q-factor” model of Hou et al. (2015a), in this paper, we construct nine trading strategies according to the size, value, momentum, reversal, profitability, idiosyncratic volatility, beta, turnover, and the corresponding definition or measurement, which are introduced in Section 4.
4 Empirical Results
In this section, we first examine the persistence of overnight/intraday return for the anomaly alphas pattern of the anomalies by portfolio analysis and Fama-MacBeth regression. More specifically, we decompose the abnormal returns earned by a range of trading strategies based on the following anomalies, including size, value, momentum, reversal, profitability, idiosyncratic volatility, beta, and turnover into their overnight and intraday components.
4.1 Persistence of Overnight/Intraday Abnormal Returns for Trading Anomaly Strategy
Trading strategies are constructed to capture the alpha associated with trading at night or during the day, and thereby we should first test the persistence in the components of close-to-close return. We conduct the test by calculating the raw excess decomposed returns and the risk-adjusted excess decomposed returns based on overnight return-sorted and intraday return-sorted portfolios, respectively. Specifically, given that the existence of the persistence of overnight returns or intraday returns, we could see a positive (negative) long-short overnight (intraday) alpha of the overnight return-based portfolio, and a negative (positive) long-short overnight (intraday) alpha of the intraday return-based portfolio, respectively.
We verify the overnight-intraday continuation and reversal patterns by rebalancing the portfolios in the current month and calculating the components of the close-to-close return in the next month both in the energy industry stocks and China A-shares stocks.
Table 1 shows the basic descriptive statistics of the main variables for energy industry stocks. First, there are 74 energy industry stocks over the period from 2002 to 2019. The mean (media) monthly overnight return of the Chinese energy stock market is −3.71% (−3.67%), while the mean monthly intraday return is 2.83% (2.93), further confirming the pattern of overall negative overnight return and positive intraday return in the Chinese stock market, as documented by Qiao and Dam (2020). Meanwhile, the corresponding monthly standard deviations of the monthly overnight return and intraday return are 0.0143 and 0.0114, consistent with the classic hypothesis of return-risk tradeoff. The average monthly turnover, price earnings ratio (PE), and return on equity (ROE) are 56.65, 62.16, and 0.97, respectively. In addition, the mean monthly idiosyncratic volatility and market beta are 0.024 and 0.068, respectively.
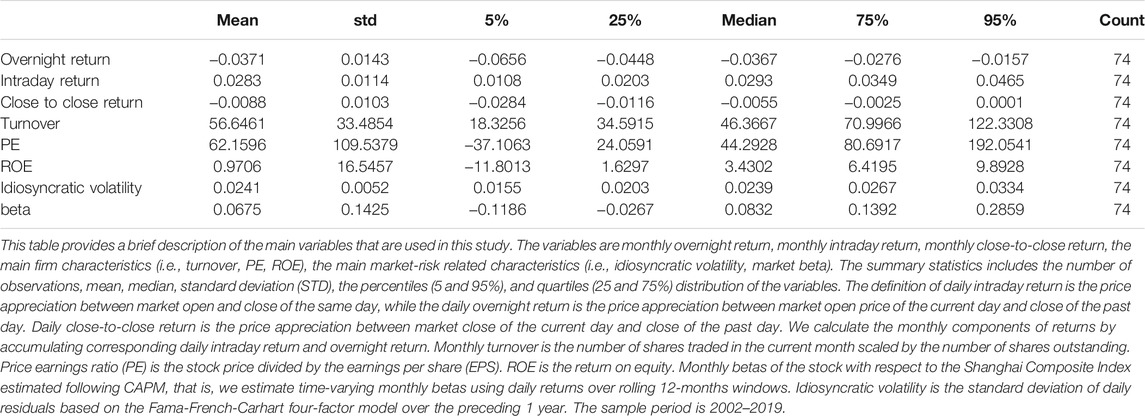
TABLE 1. Descriptive statistics
For energy industry stocks, due to the limited sample data, we construct zero-cost trading strategies of longing (shorting) the current month value-weight top (bottom) quintile for the past 1-month overnight return-sorted portfolios (Panel A) and the intraday return-sorted portfolio (Panel B), respectively. Table 2 reports monthly portfolio raw excess return, and two risk-adjusted abnormal overnight return and intraday return.
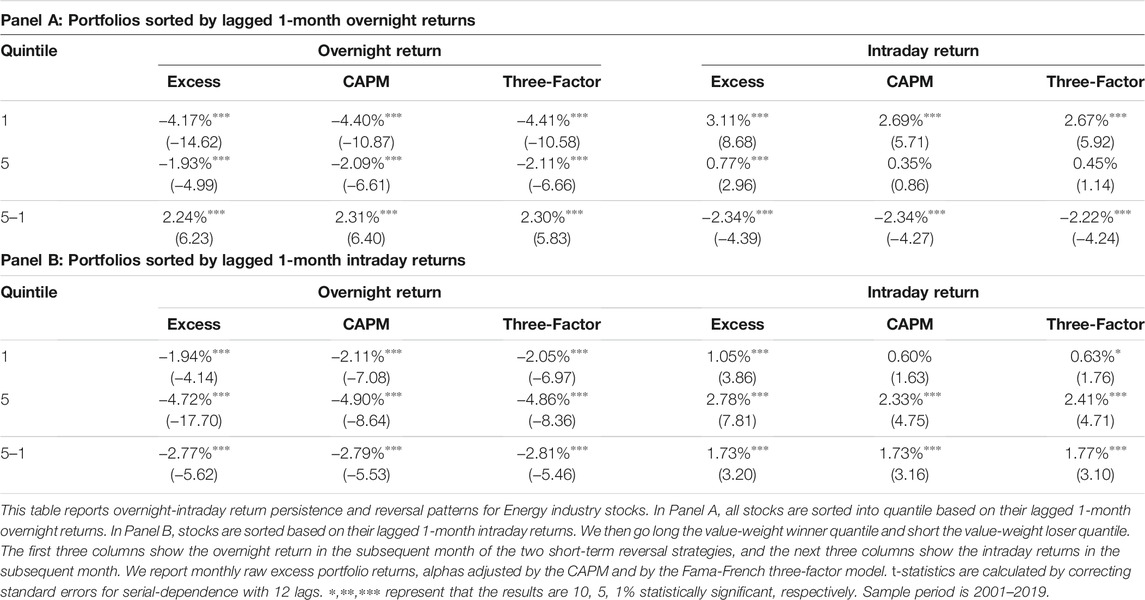
TABLE 2. Persistence of overnight-intraday return for energy industry stocks
Correspondingly, as for all A-shares stocks, we construct zero-cost trading strategies of longing (shorting) the current month value-weight top (bottom) decile for the past 1-month overnight return-sorted portfolios (Panel A) and the intraday return-sorted portfolio (Panel B), respectively. Table 3 reports monthly portfolio raw excess return, and two risk-adjusted abnormal overnight and intraday returns.
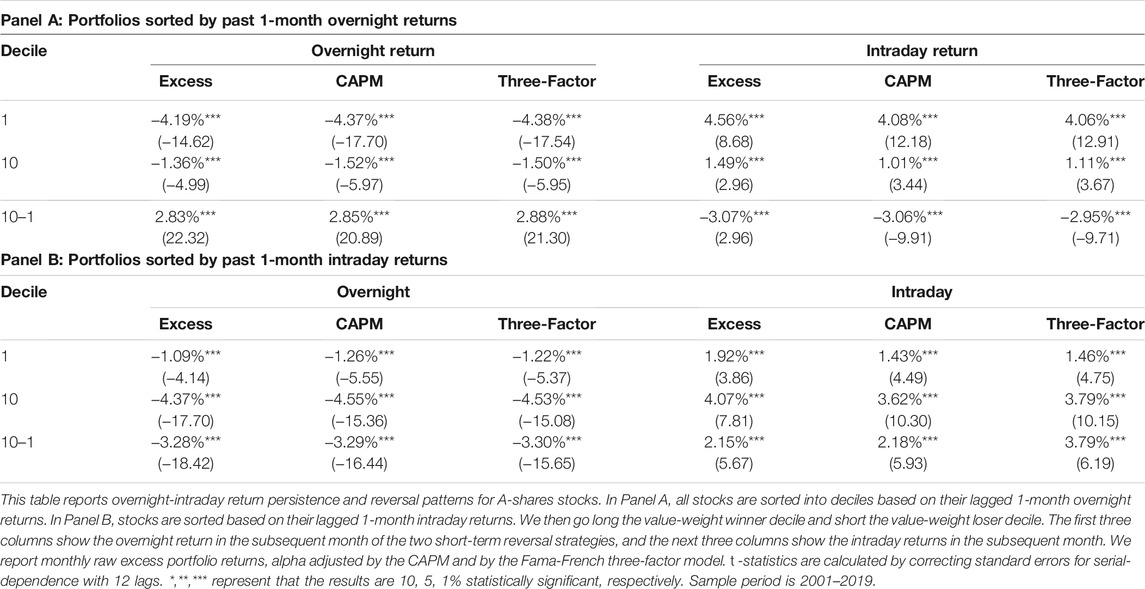
TABLE 3. Persistence of overnight/intraday return for A-shares stocks
The empirical results in both the energy stocks and China A-shares stocks totally contrast to Lou et al. (2019). When using the energy stocks as the sample, a long-short strategy based on the past 1-month overnight returns earns a strongly significant raw excess overnight return of 2.24% as well as significantly CAPM or the three-factor adjusted alphas, reaching 2.31% or 2.30% in the current month, respectively. Meanwhile, a significantly average CAPM (three-factor)-adjusted intraday alpha of −2.34% (−2.22%) per month is earned based on the overnight-return hedge portfolio, verifying a reversal in the intraday period as well.
We almost get the same results when utilizing the Chinese A-shares stocks as a sample, a long-short strategy based on the past 1-month overnight returns yields a strongly significant average raw excess overnight return of 2.83% in the current month. When adjusted by CAPM and Fama-French 3 factor models, the overnight alphas are still significantly positive. Meanwhile, a significantly average CAPM (three-factor)-adjusted intraday alpha of −3.06% (−2.95%) per month is earned based on the overnight-return hedge portfolio, that is, an intraday reversal effect exists.
On the other hand, when we go long the top quantile of the energy stocks and go short the bottom ones based on the past 1-month intraday return, we could get significant positive (negative) raw excess intraday (overnight) returns and two-risk adjusted intraday (overnight) alphas. Again, the above finding continues to hold when sorting stocks using the China A-shares stocks as our sample.
In all, Table 2 and Table 3 confirm that there are striking overnight/intraday momentum and reversal patterns both in China A-shares stocks and the energy stocks. In addition, we depict these momentum and reversal patterns in overnight return and intraday return in Figure 1 and Figure 2.
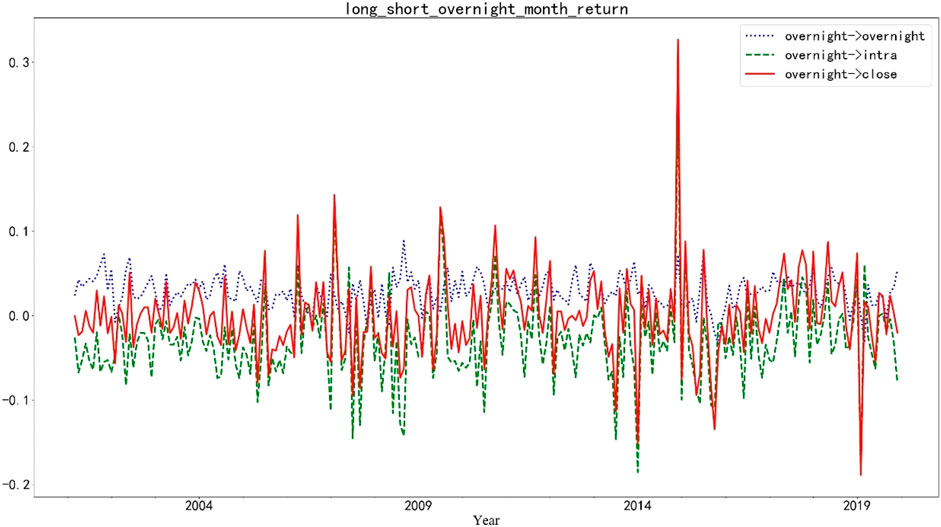
FIGURE 1. This figure depicts the overnight-intraday persistence and reversal pattern return for energy industry stocks, as reported in Panel A of Table 2. The blue dotted curve corresponds to using 1-month lagged overnight returns to forecast the current overnight return. The green dashed curve corresponds to using lagged overnight returns to forecast the current intraday return. The red solid curve corresponds to using lagged overnight returns to forecast the current close-to-close return.

FIGURE 2. This figure depicts the intraday-overnight persistence and reversal pattern return for energy industry stocks, as reported in Panel B of Table 2. The blue dotted curve corresponds to using 1-month lagged intraday returns to forecast the current overnight return. The green dashed curve corresponds to using lagged intraday returns to forecast the current intraday return. The red solid curve corresponds to using lagged intraday returns to forecast the close-to-close return.
4.2 Cross-Sectional Overnight-Intraday Alphas of the Anomalies
In this part, we use a list of popular financial anomies to understand the overnight-intraday pattern. We decompose the abnormal returns earned by a range of trading strategies based on the following anomalies, including size, value, momentum, reversal, profitability, idiosyncratic volatility, beta, and turnover, into their overnight and intraday components.
We empirically test the cross-sectional overnight/intraday alphas of the anomalies by portfolio analysis and Fama-MacBeth regressions. In the portfolio analysis, for each financial anomaly, we calculate the CAPM-adjusted overnight/intraday alphas of zero-cost trading strategies, that is, we get the risk-adjusted alpha by long (or short) the top portfolio and short (or long) the bottom portfolio according to the characteristics of the anomies. For instance, as for idiosyncratic volatility anomaly, we go long low idiosyncratic volatility quantile and short high idiosyncratic volatility quantile. However, for the well-known momentum anomaly, we will go long the top winner cumulative returns of the portfolio and go short the bottom loser cumulative ones. Section 4.2.1 and Section 4.2.2 present the overnight anomalies and intraday anomalies with the portfolio analysis, respectively.
4.2.1 Overnight Anomalies
We verify that four out of nine financial anomalies in energy industry stocks, including idiosyncratic volatility, beta, turnover, and reversal, belong to the overnight effect. Table 4 and Table 5 report overnight alphas and intraday alphas based on equity premium and eight cross-sectional anomaly-based strategies for the energy industry stocks and A-shares stocks, respectively. The details are shown in the following part. Energy industry stocks and A-shares stocks are sorted into quantile and decile, respectively.
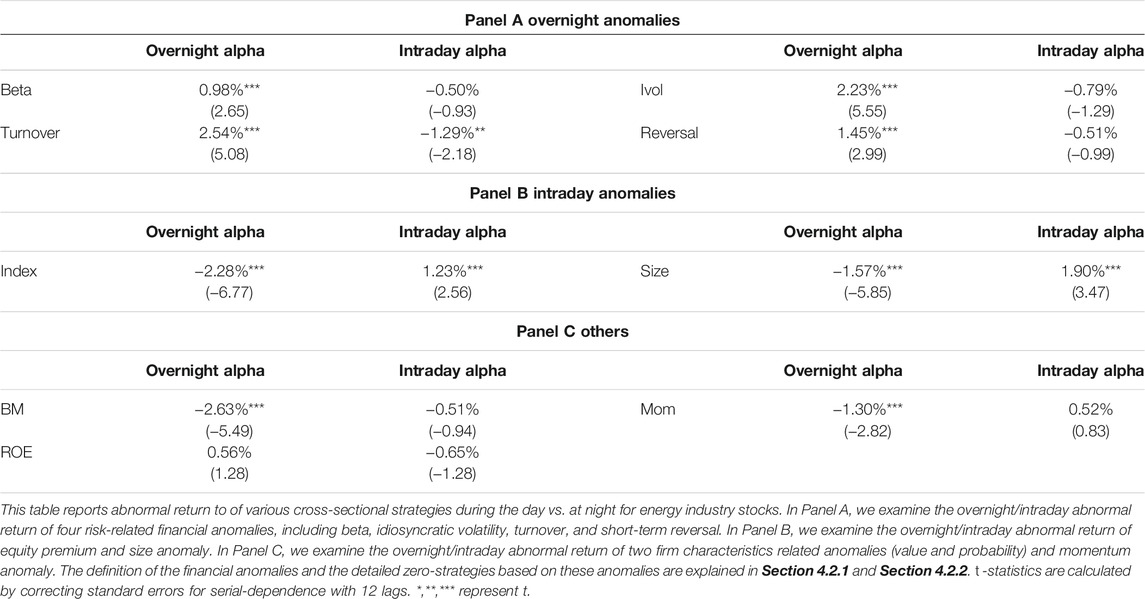
TABLE 4. Overnight-intraday abnormal return of anomalies for energy industry stocks
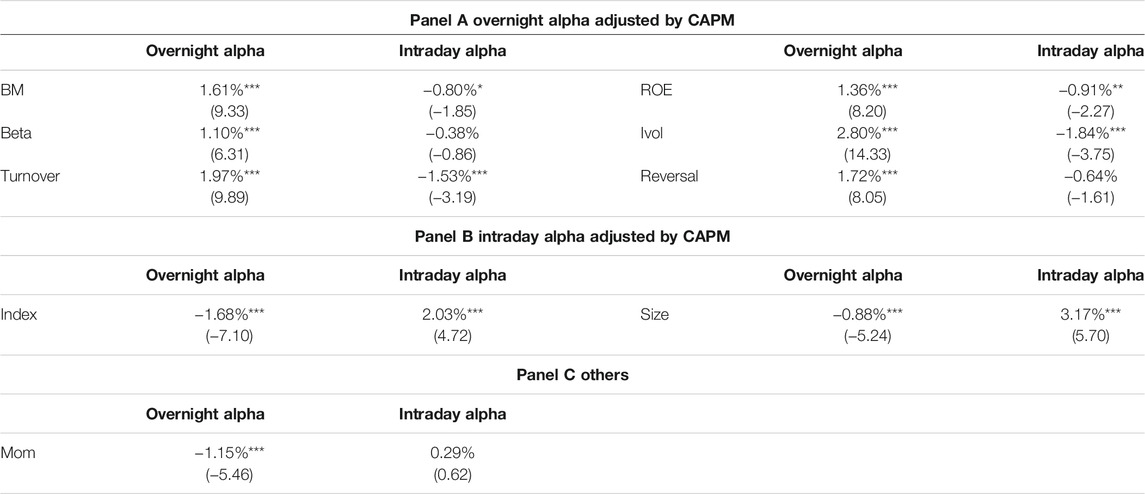
TABLE 5. Overnight/intraday abnormal return of anomalies for A-shares stocks. This table reports abnormal return to of various cross-sectional strategies during the day vs. at night for A-shares stocks. In Panel A, we examine the overnight/intraday abnormal return of four risk-related financial anomalies (beta, idiosyncratic volatility, turnover, short-term reversal) and two firm characteristics related financial anomalies (value and probability). In Panel B, we examine the overnight/intraday abnormal return of the momentum anomaly. The definition of the financial anomalies and the detailed zero-strategies based on these anomalies are explained in Section 4.2.1 and Section 4.2.2. t -statistics are calculated by correcting standard errors for serial-dependence with 12 lags. *,**,*** represent that the results are 10, 5,1% statistically significant, respectively. The sample period is 2001–2019.
Specifically, the first discussed two zero-cost trading strategies are risk-related financial anomies. The most traditional one is that high market beta stocks should have high return original from the CAPM of Sharpe (1964), Lintner (1965), and Black (1972), while be challenged by empirical evidence which shows that the security market line is not volatile (Frazzini and Pedersen 2014); the other is the well-known “idiosyncratic volatility puzzle” found by Ang et al. (2006), which argued that high idiosyncratic volatility stocks had abnormally low return.
We analyze the beta strategy that goes long the low-beta quintile (decile) and short the high-beta quintile (decile) for energy stocks (A-shares stocks). According to Lou et al. (2019) and Dimson (1979), we measure beta using daily returns over the last 12 months with three lags in the market model regression for each stock, the beta is the sum of the four coefficients, which is beneficial to taking non-synchronous trading issues into account. Panel A of Table 4 and Table 5 demonstrate that the beta alphas are totally overnight phenomenon in energy industry and all A-shares stocks, which is in sharp contrast to the Lou et al. (2019). Specifically, the overnight CAPM alpha is 0.98% (1.10%) with an associated t-statistics of 2.65 (6.31) for energy stocks (all A-shares stocks), and the corresponding intraday CAPM alpha is −0.50% (−0.38%) with an associated t-statistics of −0.93 (−0.86) for energy stocks (all A-shares stocks).
As for the idiosyncratic strategy (Ivol), we go long the low idiosyncratic volatility quintile (decile) and short the high idiosyncratic volatility quintile (decile) for the energy stocks (all A-shares stocks). We measure the idiosyncratic volatility as the volatility of the residual from a daily Fama-French-Carhart four-factor regression estimated over the last year. Panel A of Table 4 and Table 5 report that the Ivol alphas are a totally overnight phenomenon in energy stocks (all A-shares stocks) inconsistent with the result of Lou et al. (2019). Specifically speaking, the overnight CAPM alpha is 2.23% (2.80%) with an associated t-statistics of 5.55 (14.33) for all energy stocks (all A-shares stocks), and the corresponding intraday CAPM alpha is −0.27% (−1.84%) with an associated t-statistics of −1.29 (−3.75) for energy stocks (all A-shares stocks).
Then, we examine the turnover and short-term reversal anomalies, which is related to the liquidity risk. We first analyze the turnover strategy that goes long the lowest turnover quintile (decile) and short the highest turnover quintile (decile) for energy stocks (all A-shares stocks) based on the previous findings of Datar et al. (1998) and Lee and Swaminathan (2000), who show that turnover could negatively explain the cross-section average returns. We measure the turnover as the average daily volume over the last 12 months following Lee and Swaminathan (2000). Again, Panel A of Table 4 and Table 5 report that the turnover premiums are a totally overnight phenomenon in the energy industry and all A-shares stocks as there is significant negative expected intraday return, inconsistent with the result of Lou et al. (2019). In particular, the strongly statistically significant overnight CAPM alpha is 2.54% (1.97%) for energy stocks (all A-shares stock), and the corresponding insignificant intraday CAPM alpha is −1.29% (−1.53%) for energy stocks (all A-shares stocks).
At last, we measure short-term reversal as 1-month return and analyze this strategy (reversal) that goes long the low past 1-month return quintile (decile) and short the high turnover quintile (decile) for the energy stocks (A-shares stocks). Panel A of Table 4 and Table 5 report that the STR premiums are totally overnight phenomenon in energy industry and all A-shares stocks, inconsistent with the result of Lou et al. (2019). Specifically, the highly significant overnight CAPM alpha is 1.45% (1.72%) for energy stocks (all A-shares stocks), and the corresponding insignificant intraday CAPM alpha is −1.29% (−0.64%) for energy stocks (A-shares stocks).
Except the above four risk-related financial anomalies, value and probability anomalies documented in Fama-French five-factor model belong to overnight effect for all A-shares stocks. We investigate the value strategy that goes long the highest book-to-market quintile (decile) and short the lowest book-to-market quintile (decile) for energy stocks (A-shares stocks). It is found that for A-shares stocks, essentially, the value alpha occurs overnight, which is totally inconsistent with Lou et al. (2019), while the value alpha does not exist for energy stocks. Specifically, as for energy stocks, both the overnight and intraday CAPM alphas are negative, −2.63% with a t-statistics of −5.49 and −0.51% with a t-statistics of −0.94, respectively. However, as for all A-shares stocks, the overnight CAPM alphas are 1.61% with a t-statistics of 9.33, while the intraday CAPM alpha is slightly negative, −0.80%, and statistically significant with an associate t-statistic of −1.85.
Besides the classic firm characteristics, the literature documented that profitability could be another anomaly in cross-sectional stock markets (Haugen and Baker 1996; Vuolteenaho 2002; Novy-Marx 2013), and the latest and famous one is Fama and French (2015) who proposed and tested that the profitability could help capture the cross-section of average returns based on the Fama-French 3-factor. In this paper, we measure the profitability by the return on equity (ROE), then conduct profitability strategy that goes long the highest profitability quintile (decile) and short the lowest profitability quintile (decile) for energy stocks (all A-shares stocks). Panel C of Table 4 and Panel A of Table 5 report that the profitability alphas are overnight phenomenon for all A-shares stocks. Specifically, both the overnight and intraday CAPM alpha are not statistically significant in energy stocks, while the overnight and intraday CAPM alpha are 1.36% with an associated t-statistics of 8.20 and −0.91% with an associated t-statistics of 8.20, respectively, for all A-shares stocks. In all, essentially, the profitability alpha in China belongs to overnight, which is contrary to the result of Lou et al. (2019), implying a huge difference in these two markets exists.
4.2.2 Intraday Anomalies
We verify that two out of nine financial anomalies both in energy industry stocks and all A-shares stocks, including equity premium and size belong to the intraday effect.
First, we analyze the basic equity overnight premium and intraday premium at an index level, we could interpret it as the anomaly related to CAPM. Panel B of Table 4 shows that the market portfolio as measured by the value-weight energy stocks has an average monthly overnight raw excess return of −2.28% and an average intraday raw excess return of 1.23%. Panel B of Table 5 shows that the market portfolio as measured by the value-weight all A-shares stocks has an average monthly overnight alpha of 2.03% and an average intraday excess return of −1.68%. These findings mean that the equity premium is an overnight phenomena both in energy industry stocks and A-shares stocks, which is consistent with previous work done by Qiao and Dam (2020), who document the average overnight return in the Chinese stock market is negative and argue that the “T+1” trading rule contributes significantly to this overnight return puzzle.
It is well acknowledged that size effect and value effect, proposed by Fama and French (1992), are the first two anomalies in empirical asset pricing. Then, momentum effect, first proposed by Jegadeesh and Titman (1993), and formally put forward as an asset pricing factor by Carhart (1997) along with the size and value effect were widely used as a risk-adjustment benchmark in empirical studies. Specifically, as for the size anomaly, we go buying the smallest quintile (decile) and selling the largest quintile (decile) for energy stocks (A-shares stocks). Panel B of both Table 4 and Table 5 report the Size’s CAPM-adjusted overnight and intraday abnormal returns for energy stocks and all A-shares stocks, respectively. We find the size alpha occurs intraday for both samples, which is quite consistent with Lou et al. (2019). As we can see, the CAPM-adjusted intraday alphas are 1.90% with an associated t-statistics of 3.47 and 3.17% with t-statistics of 5.70, while the CAPM-adjusted overnight alphas are −1.57% with an associated t-statistics of 3.47 and −0.88% with an associated t-statistics of −5.24 for energy stocks and all A-shares stocks, respectively.
We then pin down the abnormal overnight returns and intraday returns of the momentum strategy founded by Jegadeesh and Titman (1993) and developed by Carhart (1997). We find the momentum premium almost does not occur in overnight and intraday for the two samples, specifically, the intraday CAPM alpha is statistically insignificant, 0.52% with an associated t-statistics of 0.62 (0.29% with t-statistics of 0.83) for the winner quintile (decile) minus the loser quintile (decile) for energy stocks (all A-shares stocks), and the corresponding overnight CAPM alpha is significantly negative, −1.15% with an associated t-statistics of 0.62 (with t-statistics of −1.30%). These results are quite different from Lou et al. (2019), implying there are obvious discrepancies of the investors’ behavior between the United States and China’s stock market.
In all, the results of Panel A of Table 4 and Table 5 show unique characteristics of the overnight and intraday abnormal profits of a series of trading strategies in China energy industry stocks and A-shares stocks, which is quite different from the America stock market. On the one hand, only the alpha of the Size strategy occurs within the day, and the premia of the other seven strategies all occur overnight. However, in Lou et al. (2019), the alphas of three momentum (momentum, price momentum, industry momentum) and reversal strategy mainly occur overnight, while others all occur within the day. Why do such significant differences exist between these two countries? We think that the potential reason lies in the “T+1” trading mechanism in China. “T+1” trading rule prohibits traders to sell shares they bought on the same day, leading to asymmetric effects for buyers and sellers and making most of the investors prefer to trade at the close rather than at the open. Qiao and Dam (2020) verify that the “T+1” trading rule produces a discount on opening prices due to this asymmetric effect, in essence a liquidity discount, and it could explain the negative overnight return, named overnight return puzzle. On the other hand, it is risk-related anomalies that occur during overnight for energy industry stocks, while both four risk-related anomalies and two firm characteristics related anomalies occur within the day for all A-shares stocks.
4.2.3 Fama-MacBeth Regressions
We further conduct the Fama-MacBeth regressions to test the cross-section of intraday and overnight expected abnormal returns. The advantage of this econometric method is that we could control for a list of characteristics and thus make the result more precise, while we could only do one-dimension, double-dimension, or at most three-dimension portfolio sorts. We carry out five cross-sectional regressions as does Lou et al. (2019).
The five cross-sectional regressions conclude: the dependent variables are close-to-close return (regression 1), overnight return (regression 2), intraday return (regression 3), overnight return minus intraday return (regression 4), scaled overnight return minus intraday return (the coefficient in this regression is the difference between the overnight coefficient ∗24/18.5 and intraday coefficient ∗24/5.5 (regression 5), respectively. In each regression, we include the above anomalies except for short-term reversal (Str), as we also control the most recent 1-month intraday/overnight return (ret_intraday/ret_overnight), the exponentially weighted moving averageovernight/intraday return (ewma_overnight/ewma_intraday).
As for energy stocks, (Regression 1) in Table 6 shows that ewma_overnight, Mom, and Turnover are statistically significant. (Regression 2) shows that ret_overnight, Size, Turnover, ROE, and Ivol are statistically significant, while (Regression 3) reveals that all the ret_overnight, ewma_overnight, Size, Turnover, ROE are significant. It is worth noting that the sign of the coefficient of the same significant independent variables are totally different for (Regression 2) and (Regression 3). (Regression 4) and (Regression 5) indicate that the overnight and intraday partial alpha for each anomaly is not equal, and the scaled difference is obvious.

TABLE 6. Fama-MacBeth return regression for Energy industry stocks. This table reports Fama-MacBeth regressions of monthly excess components of stock returns on lagged firm characteristics. The dependent variable in the first column is the close-to-close return in the following month; the dependent variable in the second column is the overnight return in the following month, and the dependent variable in the third column is the intraday return in the following month. In Column 4, we report the difference between the coefficients in Columns 2 and 3 (i.e., overnight-intraday). In Column 5, we report the difference between the overnight coefficient ∗24/18.5 and intraday coefficient ∗24/5.5. The independent variables are the same with Table 5 t -statistics are calculated by correcting standard errors for serial-dependence with 12 lags. *,**,*** represent that the results are 10, 5,1% statistically significant, respectively. Sample period is 2001–2019.
As for A-shares stocks, the results are essentially same with Energy stocks. Regression (1) in Table 7 shows that ret_intraday, Size, BM, and Turnover are statistically significant. Regression (2) shows that ewma_overnight, ewma_intraday, Size, Turnover, and ROE are statistically significant, while Regression (3) reveals no independent variables are significant. Regression (4) and Regression (5) indicate that the overnight and intraday partial alpha for each anomaly is not equal, and the scaled difference is obvious.

TABLE 7. Fama-MacBeth return regression for A-shares stocks.
In summary, the predictive power of these characteristics to the overnight return is better than that of the intraday component, which is consistent with the fact that most characteristic strategies of Table 4 occur in the overnight to a certain extent.
5 Conclusion
Financial anomaly is one of the most important topics in empirical asset pricing and financial risk management. The extant papers show that there is a sharp distinction in the financial anomalies between the Chinese stock market and the Western stock market due to their market structure, market institution, investor’s structure, and so on. For instance, Hou et al. (2020) confirm that 65% of the 452 anomalies fail to hold up at the t-value of 1.96, while Qiao (2019) constructs 231 anomalies in Chinese A-shares stock market and find only 41 anomalies are significant at the 5% significance level. Enlightened by Lou et al. (2019) who link investor heterogeneity to the persistence of the overnight return and intraday returns, this paper attempts to explore the financial anomalies in the energy industry from the perspective of the component of close-to-close return. The paper demonstrates a unique characteristic of the overnight and intraday abnormal profits of a series of trading strategies in Chinese energy industry stocks and A-shares stocks, which is quite contrary to Lou et al. (2019).
More specifically, we first verify that there are overnight/intraday return persistence and reversal patterns. Contrary to the developed countries, the overnight premium is negative for energy industry stocks and A-shares stocks. In addition, by using portfolio analysis and Fama-MacBeth regression, it is found that risk-adjusted alphas earned by seven trading strategies based on the value, profitability, beta, turnover, idiosyncratic volatility, and reversal are actual overnight effects, while only size trading strategy is an intraday effect. However, in Lou et al. (2019), the premia of three types of momentum and reversal strategy mainly occur overnight, while others all occur within the day. We think it possible that overnight return puzzle caused by “T+1” trading rule in Qiao and Dam (2020) might contribute to the above results. Finally, the energy industry has its own uniqueness, that is, it is risk-related anomalies that occur during overnight for energy industry stocks, while both four risk-related anomalies and two firm characteristics related anomalies occur within the day for all A-shares stocks.
Data Availability Statement
The original contributions presented in the study are included in the article/Supplementary Material. Further inquiries can be directed to the corresponding author.
Author Contributions
Conceptualization: MZ and XL Methodology: MZ and XL Software: MZ and XL Validation: MZ Formal analysis: XL Investigation: MZ and XL Resources: XL Data curation: MZ Writing—Original Draft: XL Writing—Review; Editing: MZ and XL Visualization: MZ Supervision: XL Project administration: MZ and XL Funding acquisition: MZ and XL.
Funding
MZ acknowledges financial support from the National Nature Science Foundation of China (grant number #72073058). XL acknowledges financial support from the National Nature Science Foundation of China (grant numbers #71761010, #72101067).
Conflict of Interest
The authors declare that the research was conducted in the absence of any commercial or financial relationships that could be construed as a potential conflict of interest.
Publisher’s Note
All claims expressed in this article are solely those of the authors and do not necessarily represent those of their affiliated organizations, or those of the publisher, the editors, and the reviewers. Any product that may be evaluated in this article, or claim that may be made by its manufacturer, is not guaranteed or endorsed by the publisher.
Supplementary Material
The Supplementary Material for this article can be found online at: https://www.frontiersin.org/articles/10.3389/fenrg.2021.807881/full#supplementary-material
References
Aboody, D., Even-Tov, O., Lehavy, R., and Trueman, B. (2018). Overnight Returns and Firm-specific Investor Sentiment. J. Financ. Quant. Anal. 53 (2), 485–505. doi:10.1017/s0022109017000989
Amihud, Y. (2002). Illiquidity and Stock Returns: Cross-Section and Time-Series Effects. J. Financial Markets 5, 31–56. doi:10.1016/s1386-4181(01)00024-6
Ang, A., Hodrick, R. J., Xing, Y., and Zhang, X. (2006). The Cross-Section of Volatility and Expected Returns. J. Financ. 61, 259–299. doi:10.1111/j.1540-6261.2006.00836.x
Black, F. (1972). Capital Market Equilibrium with Restricted Borrowing. J. Busin. 45, 444–454. doi:10.1086/295472
Branch, B., and Ma, A. (2012). Overnight Return, the Invisible Hand behind Intraday Returns. J. Financ. Mark. 2, 90–100.
Branch, B., and Ma, A. (2008). The Overnight Return, One More Anomaly. Unpublished working paper. Amherst: University of Massachusetts.
Cai, T. T., and Qiu, M. (2008). International Evidence on Overnight Return Anomaly. Unpublished working paper. Wellington: Massey University.
Campbell, J. Y., Hilscher, J., and Szilagyi, J. (2008). In Search of Distress Risk. J. Financ. 63, 2899–2939. doi:10.1111/j.1540-6261.2008.01416.x
Cao, J., Wen, F., Zhang, Y., Yin, Z., and Zhang, Y. (2022). Idiosyncratic Volatility and Stock price Crash Risk: Evidence from china. Financ. Res. Lett. 44, 102095. doi:10.1016/j.frl.2021.102095
Carhart, M. M. (1997). On Persistence in Mutual Fund Performance. J. Finance 52, 57–82. doi:10.1111/j.1540-6261.1997.tb03808.x
Cliff, M. T., Cooper, M. J., and Gulen, H. (2008). Return Differences between Trading and Non-trading Hours: Like Night and Day. Unpublished working paper. Blacksburg: Virginia Tech.
Dai, Z. F., Zhou, H. T., Kang, J., and Wen, F. H. (2021). The Skewness of Oil price Returns and Equity Premium Predictability. Energy Econ 94, 1–11. doi:10.1016/j.eneco.2020.105069
Datar, V. T., Y. Naik, N., and Radcliffe, R. (1998). Liquidity and Stock Returns: An Alternative Test. J. Financial Markets 1, 203–219. doi:10.1016/s1386-4181(97)00004-9
Diether, K. B., Malloy, C. J., and Scherbina, A. (2002). Differences of Opinion and the Cross Section of Stock Returns. J. Finance 57, 2113–2141. doi:10.1111/0022-1082.00490
Dimson, E. (1979). Risk Measurement when Shares Are Subject to Infrequent Trading. J. Financial Econ. 7, 197–226. doi:10.1016/0304-405x(79)90013-8
Fama, E. F., and French, K. R. (2015). A Five-Factor Asset Pricing Model. J. Financial Econ. 116, 1–22. doi:10.1016/j.jfineco.2014.10.010
Fama, E. F., and French, K. R. (1993). Common Risk Factors in the Returns on Stocks and Bonds. J. Financial Econ. 33, 3–56. doi:10.1016/0304-405x(93)90023-5
Fama, E. F., and French, K. R. (1992). The Cross-Section of Expected Stock Returns. J. Finance 47, 427–465. doi:10.1111/j.1540-6261.1992.tb04398.x
Fama, E. F., and MacBeth, J. D. (1973). Risk, Return, and Equilibrium: Empirical Tests. J. Polit. Economy 81, 607–636. doi:10.1086/260061
Farouq, I. S., Sambo, N., Umar Sambo, N., Ahmad, A. U., Jakada, A. H., and Danmaraya, I. i. A. (2021). Does Financial Globalization Uncertainty Affect CO2 Emissions? Empirical Evidence from Some Selected SSA Countries. Quant. Financ. Econ. 5 (2), 247–263. doi:10.3934/qfe.2021011
Frazzini, A., and Pedersen, L. H. (2014). Betting against Beta. J. Financial Econ. 111, 1–25. doi:10.1016/j.jfineco.2013.10.005
Ghoddusi, H., and Wirl, F. (2021). A Risk-Hedging View to Refinery Capacity Investment in OPEC Countries. Energy J 42 (1), 67–92. doi:10.5547/01956574.42.1.hgho
Gong, X., and Lin, B. (2021). Effects of Structural Changes on the Prediction of Downside Volatility in Futures Markets. J. Futures Markets 41, 1124–1153. doi:10.1002/fut.22207
Gong, X., and Lin, B. (2017). Forecasting the Good and Bad Uncertainties of Crude Oil Prices Using a HAR Framework. Energ. Econ. 67, 315–327. doi:10.1016/j.eneco.2017.08.035
Gong, X., and Lin, B. (2018). The Incremental Information Content of Investor Fear Gauge for Volatility Forecasting in the Crude Oil Futures Market. Energ. Econ. 74, 370–386. doi:10.1016/j.eneco.2018.06.005
Gong, X., Liu, Y., and Wang, X. (2021). Dynamic Volatility Spillovers across Oil and Natural Gas Futures Markets Based on a Time-Varying Spillover Method. Int. Rev. Financial Anal. 76, 101790. doi:10.1016/j.irfa.2021.101790
Güngör, A., and Taştan, H. (2021). On Macroeconomic Determinants of Co-movements Among International Stock Markets: Evidence from DCC-MIDAS Approach. Quant. Financ. Econ. 5 (1), 19–39. doi:10.3934/qfe.2021002
Haugen, R. A., and Baker, N. L. (1996). Commonality in the Determinants of Expected Stock Returns. J. Financial Econ. 41, 401–439. doi:10.1016/0304-405x(95)00868-f
Hendershott, T., Livdan, D., and Rösch, D. (2020). Asset Pricing: A Tale of Night and Day. J. Financial Econ. 138 (3), 635–662. doi:10.1016/j.jfineco.2020.06.006
Hou, K., Xue, C., and Zhang, L. (2015b). A Comparison of New Factor Models. Working paper. Columbus: Ohio State University, University of Cincinnati, and Ohio State University.
Hou, K., Xue, C., and Zhang, L. (2015a). Digesting Anomalies: An Investment Approach. Rev. Financ. Stud. 28, 650–705. doi:10.1093/rfs/hhu068
Hou, K., Xue, C., and Zhang, L. (2020). Replicating Anomalies. Rev. Financ. Stud. 33 (5), 2019–2133. doi:10.1093/rfs/hhy131
Huong, T. T. X., Nga, T., Nga, T. T. T., and Oanh, T. T. K. (2021). Liquidity Risk and Bank Performance in Southeast Asian Countries: a Dynamic Panel Approach. Quant. Financ. Econ. 5 (1), 111–133. doi:10.3934/qfe.2021006
Jegadeesh, N., and Titman, S. (1993). Returns to Buying Winners and Selling Losers: Implications for Stock Market Efficiency. J. Finance 48, 65–91. doi:10.1111/j.1540-6261.1993.tb04702.x
Kelly, M. A., and Clark, S. P. (2011). Returns in Trading versus Non-trading Hours: the Difference Is Day and Night. J. Asset Manag. 12, 132–145. doi:10.1057/jam.2011.2
Lee, C. M. C., and Swaminathan, B. (2000). Price Momentum and Trading Volume. J. Finance 55, 2017–2069. doi:10.1111/0022-1082.00280
Lian, Z. Y., Cai, J., and Webb, R. I. (2020). Oil Stocks, Risk Factors, and Tail Behavior. Energ. Econ 91, 1–19. doi:10.1016/j.eneco.2020.104932
Lintner, J. (1965). The Valuation of Risk Assets and the Selection of Risky Investments in Stock Portfolios and Capital Budgets. Rev. Econ. Stat. 47, 13–37. doi:10.2307/1924119
Liow, K. H., Song, J., Song, J., and Zhou, X. (2021). Volatility Connectedness and Market Dependence across Major Financial Markets in China Economy. Quant. Financ. Econ. 5 (3), 397–420. doi:10.3934/qfe.2021018
Liu, R., Chen, J., and Wen, F. (2021). The Nonlinear Effect of Oil price Shocks on Financial Stress: Evidence from China. North Am. J. Econ. Finance 55, 101317. doi:10.1016/j.najef.2020.101317
Lou, D., Polk, C., and Skouras, S. (2019). A Tug of War: Overnight versus Intraday Expected Returns. J. Financial Econ. 134 (1), 192–213. doi:10.1016/j.jfineco.2019.03.011
Mao, L., Zhang, Y., and Zhang, Y. (2021). Robust Optimal Excess-Of-Loss Reinsurance and Investment Problem with P-Thinning Dependent Risks under CEV Model. Quant. Financ. Econ. 5 (1), 134–162. doi:10.3934/qfe.2021007
Muravyev, D., and Ni, X. (2020). Why Do Option Returns Change Sign from Day to Night? J. Financial Econ. 136, 219–238. doi:10.1016/j.jfineco.2018.12.006
Novy-Marx, R. (2013). The Other Side of Value: the Gross Profitability Premium. J. Financial Econ. 108, 1–28. doi:10.1016/j.jfineco.2013.01.003
Peng, Q., Wen, F., and Gong, X. (2021). Time‐dependent Intrinsic Correlation Analysis of Crude Oil and the US Dollar Based on CEEMDAN. Int. J. Fin Econ. 26 (1), 834–848. doi:10.1002/ijfe.1823
Qiao, K., and Dam, L. (2020). The Overnight Return Puzzle and the “T+1” Trading Rule in Chinese Stock Markets. J. Financ. Markets 50, 1–13. doi:10.1016/j.finmar.2020.100534
Robert, F., Stambaugh, R. F., and Y Yuan, Y. (2017). Mispricing Factors. Rev. Financ. Stud. 30 (4), 1270–1315.
Sharpe, W. F. (1964). Capital Asset Prices: a Theory of Market Equilibrium under Conditions of Risk*. J. Finance 19, 425–442. doi:10.1111/j.1540-6261.1964.tb02865.x
Si, D. K., Li, X. L., and Huang, S. J. (2021). Financial Deregulation and Operational Risks of Energy enterprise: The Shock of Liberalization of Bank Lending Rate in China. Energ. Econ 93, 1–10. doi:10.1016/j.eneco.2020.105047
Stambaugh, R. F., Yu, J., and Yuan, Y. (2015). Arbitrage Asymmetry and the Idiosyncratic Volatility Puzzle. J. Finance 70, 1903–1948. doi:10.1111/jofi.12286
Stambaugh, R. F., Yu, J., and Yuan, Y. (2014). The Long of it: Odds that Investor Sentiment Spuriously Predicts Anomaly Returns. J. Financial Econ. 114, 613–619. doi:10.1016/j.jfineco.2014.07.008
Stambaugh, R. F., Yu, J., and Yuan, Y. (2012). The Short of it: Investor Sentiment and Anomalies. J. Financial Econ. 104, 288–302. doi:10.1016/j.jfineco.2011.12.001
Tian, M., Li, W., and Wen, F. (2021). The Dynamic Impact of Oil price Shocks on the Stock Market and the USD/RMB Exchange Rate: Evidence from Implied Volatility Indices. North Am. J. Econ. Finance 55, 101310. doi:10.1016/j.najef.2020.101310
Umutlu, M., Bengitöz, P., and Bengitöz, P. (2021). Return Range and the Cross-Section of Expected index Returns in International Stock Markets. Quant. Financ. Econ. 5 (3), 421–451. doi:10.3934/qfe.2021019
Vuolteenaho, T. (2002). What Drives Firm-Level Stock Returns. J. Finance 57, 233–264. doi:10.1111/1540-6261.00421
Wang, J. Y., Wang, H., and Wang, D. (2021). Equity Concentration and Investment Efficiency of Energy Companies in China: Evidence Based on the Shock of Deregulation of QFIIs. Energ. Econ 93, 1–8. doi:10.1016/j.eneco.2020.105032
Wen, F., Cao, J., Liu, Z., and Wang, X. (2021a). Dynamic Volatility Spillovers and Investment Strategies between the Chinese Stock Market and Commodity Markets. Int. Rev. Financial Anal. 76, 101772. doi:10.1016/j.irfa.2021.101772
Wen, F., Zhang, K., and Gong, X. (2021b). The Effects of Oil price Shocks on Inflation in the G7 Countries. North Am. J. Econ. Finance 57, 101391. doi:10.1016/j.najef.2021.101391
Ye, Z. K., Hu, C. Y., Oy, G. D., and W, F. H. (2020). The Dynamic Time-Frequency Relationship between International Oil Prices and Investor Sentiment in China: A Wavelet Coherence Analysis. Energ. J 41 (5), 251–270. doi:10.5547/01956574.41.5.fwen
Zheng, Y., Zhou, M., and Wen, F. (2021). Asymmetric Effects of Oil Shocks on Carbon Allowance price: Evidence from China. Energ. Econ. 97, 105183. doi:10.1016/j.eneco.2021.105183
Keywords: trading strategies, overnight-intraday effect, energy industry, financial anomaly, fama-macbeth cross-sectional regression
Citation: Zhou M and Liu X (2022) Overnight-Intraday Mispricing of Chinese Energy Stocks: A View from Financial Anomalies. Front. Energy Res. 9:807881. doi: 10.3389/fenrg.2021.807881
Received: 02 November 2021; Accepted: 07 December 2021;
Published: 25 February 2022.
Edited by:
Jian Chai, Xidian University, ChinaCopyright © 2022 Zhou and Liu. This is an open-access article distributed under the terms of the Creative Commons Attribution License (CC BY). The use, distribution or reproduction in other forums is permitted, provided the original author(s) and the copyright owner(s) are credited and that the original publication in this journal is cited, in accordance with accepted academic practice. No use, distribution or reproduction is permitted which does not comply with these terms.
*Correspondence: Xiaoqun Liu, liuxiaoqun22@163.com