CO2 Storage Potential Reconnaissance of the Newly Identified Red Beds of Hazlehurst in the Southeastern United States
 Ruoshi Cao
 James Knapp
 Prem Bikkina
 Richard Esposito3
- 1Oklahoma State University, Boone Pickens School of Geology, Stillwater, OK, United States
- 2Oklahoma State University, Chemical Engineering, Stillwater, OK, United States
- 3Southern Company, Birmingham, AL, United States
The states of Georgia and South Carolina emitted ∼100 million tons (Mt) of CO2 in 2019 from point sources. Integration and interpretation of subsurface data enabled identification of a previously unrecognized, regionally extensive, and thick (up to 450 m) sedimentary sequence—the Red beds of Hazlehurst (RbH)—as a potential saline reservoir for CO2 storage in the southeastern United States. Based on the renewed stratigraphic framework and structural interpretation of the RbH interval, we analyzed detailed well logs and the depositional environments to provide reconnaissance-level regional scale estimations of the storage resource. The volumetric results suggest the effective storage area (∼85,000 km2) has a maximum resource potential for 390 gigatons (Gt) of anthropogenic CO2. Petrophysical measurements suggest the permeability of RbH ranges from 0.001 to 48 mD, and the porosity ranges from 11.1 to 18.4%. Residual/capillary trapping and solubility trapping act as the main trapping mechanisms for long term storage and prevent vertical migration of CO2 into the shallow freshwater aquifers. Due to the heterogeneity observed in geophysical logs and the scarcity of well penetrations, future data collection is needed to characterize the storage aquifer and confining aquitards of a site-specific system at this stage.
Introduction
In 2019, Georgia and South Carolina emitted 91 Mt of CO2 from large point source facilities such as power plants (82%), pulp and paper (6%), minerals (4%), and chemicals (2%) based on the EPA Greenhouse Gas Reporting Program. Underground CO2 storage provides a means to mitigate the contribution to global warming and ocean acidification of industrial carbon dioxide emissions (IPCC 2005). Compared with other CO2 host sites such as depleted oil and gas reservoirs or unmined coal seams, saline aquifers are present in widespread areas which minimizes the transportation costs but on the other hand, the storage and safety potentials are not well characterized (Bachu and Adams, 2003).
A previous feasibility study suggested adverse reservoir conditions for CO2 storage in the Triassic age South Georgia Rift basins in southern South Carolina and southern Georgia due to complex faulting and low permeability (Waddell 2015). A more recent study based on seismic reflection and well log data (Cao and Knapp, 2018) depicted an alternative Mesozoic tectonic and magmatic evolution model for the southeastern United States. The study introduced a previously unrecognized red beds sequence—the Red beds of Hazlehurst (RbH). We will first provide regional preliminary volumetric estimates of storage resources for this newly discovered deep saline formation. Secondly, we will propose a potential site of interest. Thirdly, we then discuss current limitations in formation characterization and future data collection.
Geological Background
Renewed Stratigraphic Framework
Mesozoic rifting of the Pangean supercontinent formed a sinuous belt of aborted, asymmetric rift basins along the current North American Atlantic margin extending from Northern Florida to Newfoundland. Froelich and Olsen (1984) termed the continental basin strata and basalt flows observed in the exposed basins as the Newark Supergroup, and described the lithology to be predominantly red clastics with minor basaltic igneous rocks. The basins in the southeastern United States (South Carolina, Georgia, and Florida) formed as half-graben structures during Triassic time and are buried under the Coastal Plain sediments (Olsen et al., 1989). In the study area, the Coastal Plain is composed of sandy, unconsolidated Cretaceous and younger sediments that gently dip (<1°) from the “Fall Line” toward the coast line (Figure 1). To uncover the geology buried under the Coastal Plain, previous worker conducted geological and geophysical surveys in the area (discussed below).
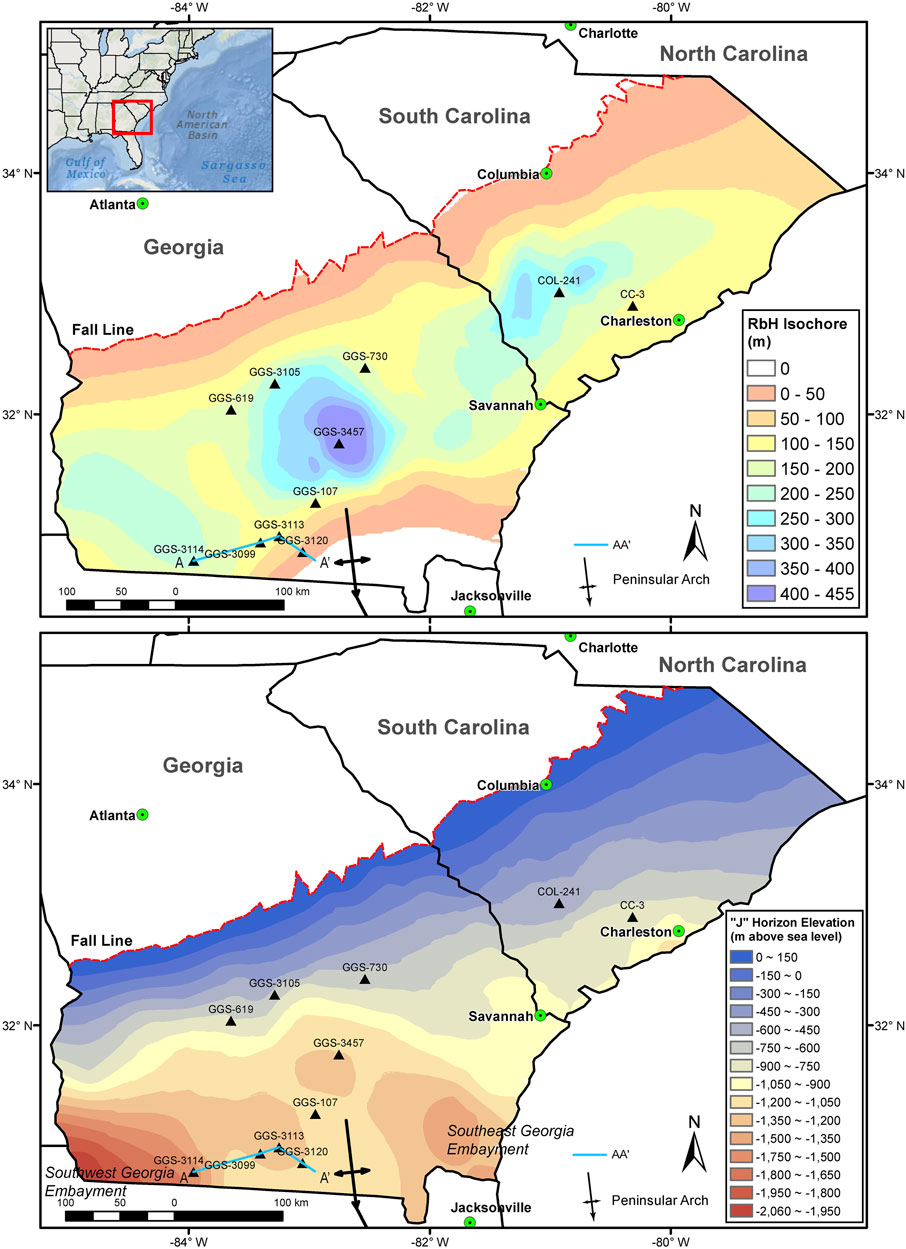
FIGURE 1. Isochore map of RbH modified from Cao and Knapp (2018) showing the thickness variation and structural elevation of the top of RbH (“J” horizon) in Georgia and South Carolina. Peninsular Arch produces structural high in southern Georgia. Triangles mark the wells analyzed in this study.
Sporadic oil test wells encountered red sedimentary rocks that are lithologically similar to the Newark Supergroup. For more than 120 years, scholars have interpreted these occurrences as Triassic rift basins directly underlying much of the South Carolina, Georgia, Alabama and Florida Coastal Plain (Darton, 1896; Daniels et al., 1983; Klitgord et al., 1984; Olsen, 1997, Heffner 2013). Recent studies in the Atlantic coastal plain have documented the existence of a red beds section from outcrops, geophysical data, or borehole samples (Behrendt, 1986; Scott et al., 1961; Marine and Siple, 1974; Gray, 1978; Olsen, 1980; Gohn et al., 1983a; Chowns and Williams, 1983; Ediger, 1986; Costain and Coruh, 1989; Sartain and See, 1997). In most cases, these occurrences share common lithological and stratigraphic descriptions such as unfossiliferous, reddish-brown to pink, conglomeratic to fine grained sandstone or claystone lying unconformably above older rocks. Based on those investigations, Cao and Knapp (2018) identified a Jurassic age, previously unrecognized, regionally extensive, post-rift red beds sequence (RbH) based on integrated seismic and well data in Georgia and South Carolina (Figure 1).
This revised understanding of the lithostratigraphy of the southeastern United States introduced new potential for the underground CO2 storage in Georgia and South Carolina. In the southeastern United States, the deposition occurred during Early to Middle Jurassic in a subaerial, oxidizing environment that produced the red sandstone and claystone observed in core samples and cuttings. The total extent of RbH is estimated to be over 300,000 km2 and had covered the eastern North America continental margin prior to erosion. The section thickens up to 450 m in southern Georgia. An updated general lithostratigraphy framework for the study area was also introduced based on the new constraints for the tectonics evolution. Structurally, RbH sits unconformably (“T” horizon) above the syn-rift Triassic basin strata or older basement rocks, and sits below the regional basal unconformity (“J” horizon) of the Coastal Plain sequence (Figure 2).
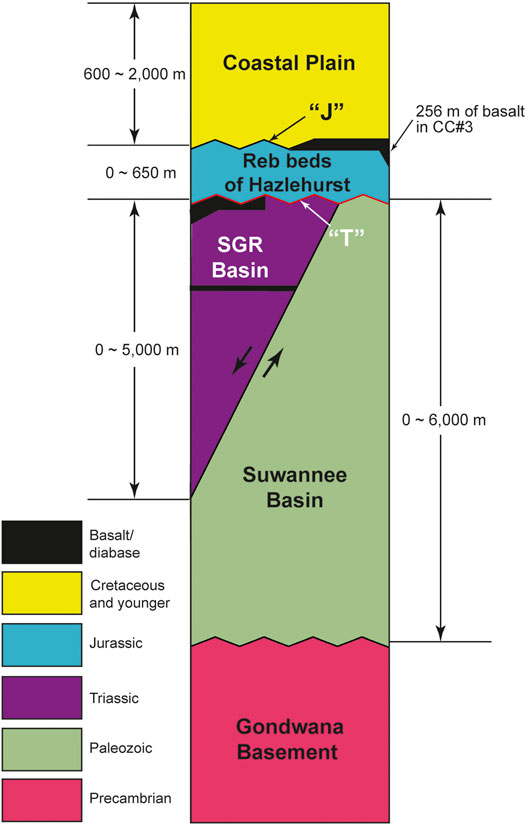
FIGURE 2. Schematic lithostratigraphic columns for the study area. Cao and Knapp (2018) suggested the inferred Jurassic age section from these previous studies is the RbH, which is bounded both above and below by unconformities, the “J” and newly-defined “T”, respectively. Basaltic volcanism can be found locally on both the “J” and presumably the “T” horizons. The thickness estimates for different stratigraphic units are based on Cao and Knapp (2018), and Boote and Knapp (2016).
The RbH gently dips seaward and reaches a maximum burial depth of 2 km in the Southwest Georgia Embayment (Figure 1). The Peninsular arch is a dominant subsurface antiformal feature that plunges to the SSE from southern Georgia to Florida. The Peninsular Arch was an extremely low-relief paleo-topographic high throughout most of the Mesozoic until Late Cretaceous time, when it was finally covered (thus coeval with the deposition of the RbH) (Duncan, 1998). Structurally, the northern portion of the arch separates the Southwest Georgia Embayment and Southeast Georgia Embayment (Figure 1). The Paleozoic quartzitic sandstone and dark shale of the Peninsular arch occupy the southeastern Georgia. An erosional unconformity separates the Paleozoic rocks from the overlying RbH that pinch out against the arch’s west flank (Applin, 1951). We will explore the plausible reservoir/seal conditions created by the depositional and structural evolution of the arch.
Depositional Environment, Lithology and Tectonic Regime
Different depositional environment and lithology are associated with different storage coefficients, which affect the estimations for deep saline formation’s storage resources (Gorecki et al., 2009). Because only a fraction of the pore space within any given geological formation will be available or amenable to CO2 storage. We use a storage coefficient to assign a value to the fraction of the formation in which CO2 can be effectively stored. Gorecki et al., 2009 examined the storage efficiency at the end of CO2 injection from more than 20,000 hydrocarbon reservoirs. Using probabilistic distributions of reservoir properties and Monte Carlo numerical simulation, the storage efficiencies were determined for 12 different clastics and carbonates depositional environments.
The RbH is composed mostly of interbedded calcareous claystone and conglomeratic sandstone. The majority of the deep wells that have penetrated the Coastal Plain in Georgia and South Carolina are dry holes drilled by the oil and gas industry since the 1970s. Despite the absence of petroleum reservoirs in the area, RbH is a thick and ubiquitous deep saline aquifer that underlies most of the Georgia and southern South Carolina Coastal Plain.
The southeastern United States is over 1,000 km away from any plate boundaries, and commonly referred to as the type example of a seismically quiet Atlantic-type continental margin (Dewey and Bird, 1970). However, the 1886 Charleston earthquake (magnitude 7) occurred near Charleston, South Carolina indicates nonuniform basement components near the coastal area. The present stress regime appeared to be of NE-SW compression, rather than of extension as it presumably was during the Mesozoic rifting (Rankin, 1977). As the aftershocks of the earthquake may still be underway today, although it is out of the scope of this study, the tectonic and stress regime of the seismic zone should be taken into consideration for future risk assessment.
Data
CO2 storage estimates depend on a multitude of factors. We compiled subsurface data at different scales to characterize the storage reservoir.
On the regional scale, in situ pressure, temperature and salinity directly affect the density and viscosity of CO2 and formation water. The estimated temperature data at 500 m and 1,000 m depth were compiled from the National Renewable Energy Laboratory Geothermal Prospector. Assuming an overall normal depth-pressure gradient (no over-pressured nor under-pressured zones) in an open system, the water table data from the past two years were compiled from the National Ground-Water Monitoring Network (https://cida.usgs.gov/ngwmn/index.jsp). The structural surfaces of the top and base of RbH derived from Cao and Knapp, 2018 provide geometric boundaries of the reservoir. EPA Greenhouse Gas Reporting Program (https://www.epa.gov/ghgreporting/ghgrp-emissions-location) provided the location and quantity of point source greenhouse gases emissions in South Carolina and Georgia.
On the local scale, we use mud logs, geophysical logs, and reported petrophysical measurements of core samples from 11 wells (CC-3, COL-241, GGS-107, GGS-619, GGS-730, GGS-3099, GGS-3105, GGS-33113, GGS-3114, GGS-3120, and GGS-3457) to provide in situ investigation on the lithology, porosity, and permeability of the RbH (Cao and Knapp, 2018). 10 of the 11 wells except Clubhouse Crossroads drill hole #3 (CC-3) (Figure 1) have Spontaneous Potential (SP), Gamma (GR), short-normal (SFL, SN, LL8, or AM16), and long-normal (ILD or LN) electrical resistivity logs. CC-3 is the only cored well that reported the lithological, depositional facies analysis of the RbH. Core samples from CC-3 and GGS-3114 produced experimentally derived fluid flow properties (Gohn et al., 1983a; Akintunde et al., 2013) (Table 1). Well GGS-107 is the only well that contains formation water analysis information (Table 2).
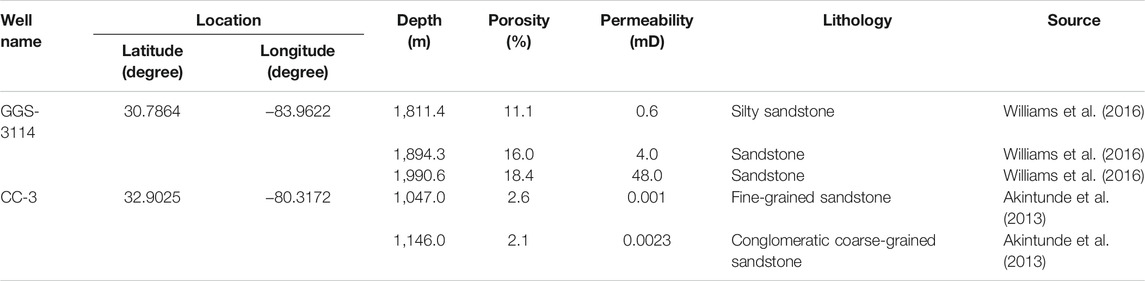
TABLE 1. Porosity and permeability measurements.
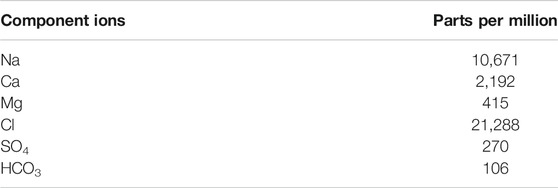
TABLE 2. GGS-107 Water Analysis from Depth 1,206 to 1,309 m.
Subsurface Analysis
Geologic storage of CO2 requires a subsurface reservoir with appropriate porosity and permeability within a depth and temperature range suitable for maintaining CO2 in a supercritical state. For the following three subsections We utilize the subsurface data on local and regional scale to 1) evaluate the reservoir characteristics (lithology, porosity, permeability, and depositional environment) of the RbH; 2) delineate the suitable portion of the reservoir area with sufficient temperature, pressure and salinity to maintain injected CO2 in supercritical state; and 3) calculate the prospective storage capacity to accommodate injected CO2.
Formation Evaluation
The core samples from CC-3 suggest the RbH was deposited in a fluvial environment. In CC-3, the RbH’s lithofacies were divided into an upper section (39 m) of fine-grained mudstone, siltstone, and argillaceous sandstone and a lower section (82 m) of coarse-grained mudstones and conglomeratic sandstones (Figure 3). The fine-grained facies and the paucity of structures and vertical sedimentary sequences suggest the deposition occurred on dry-basin floors that contain fine-grained alluvium derived from distal parts of adjacent alluvial fans. Gohn et al., 1983a also interpreted the lower coarse-grained conglomeratic sandstones represent deposition on the medial to distal part of an ancient alluvial fan. Similar lithology of brick-red conglomeratic shales interbedded with medium-to fine-grain calcareous sandstones are also reported for the RbH in Georgia (Chowns and Williams, 1983). In comparison with similar continental sediments, Gohn et al. (1983a) suggested the RbH in the CC-3 well were deposited in fluvial and alluvial-fan environment. Despite the lack of core samples in other areas, we herein consider the overall depositional environment for the RbH as fluvial to quantitively estimate storage coefficients based on available data.
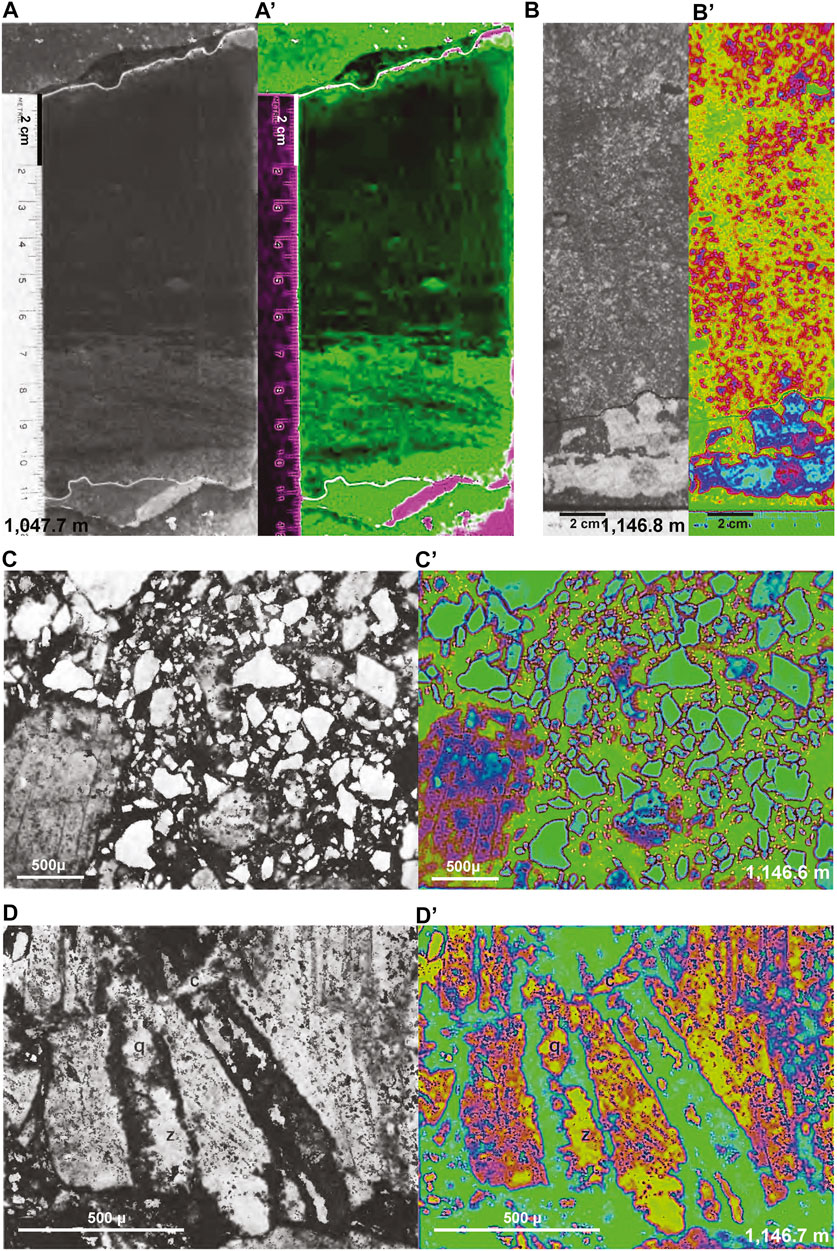
FIGURE 3. Original (A, B, C, and D) and synthetic color (A′, B′, C′, and D′) images of CC-3 core segments (A and B) and photomicrographs (B and D) modified from Gohn et al. (1983a) and Gohn (1983b). Citing Gohn’s descriptions: (A) Upper fine-grained facies red beds. Medium grained, cross-laminated sandstone overlies eroded top of mudstone with quartz granules. Carbonaceous debris is concentrated along cross laminations. Base of sample is from 1,047.7 m depth. (B) Lower coarse-grained facies red beds. Slabbed section showing contact (highlighted) between sandstone bed and underlying mudstone and calcite in mudstone. Samples from a depth of 1,146.8 m. (C) Conglomeratic sandstone from a depth of 1,146.6 m. Note possible framework-grain-supported fabric, poor sorting, and moderate to poor rounding of grains. Large, subhedral plagioclase grain at left (D) Plagioclase grain at the edge of a granodioritic clast from a depth of 1,146.7 m. Sedimentary matrix is at left and lower left. Composite epidote (dark), quartz (q), and zeolite (?) (z) veins cut the plagioclase and terminate at the clast boundary (bottom). Later compactional fracture (horizontal) offsets the veins and is partially filled by diagenetic calcite (c). Note the permeability and porosity measurements were made on samples at 1,147.0 m and 1,146.0 m (Akintunde et al., 2013).
To better illustrate the core sample images published in the original paper (Gohn et al., 1983a), the low and high frequency content of the original gray scale images were assigned to the hue and value, respectively. The hue, saturation, and value (HSV) data were then transformed into RGB space producing the synthetic color images. This method improves the display of subtle large-scale features such as laminations while retaining fine details. CC-3 penetrated (from younger to older) 775 m of Coastal Plain sediments, 256 m of basalt and bottomed in 121 m of well-consolidated RbH.
Geophysical logs and mud logs illustrate oscillating permeability and porosity of the RbH across the study area, both vertically and laterally. Due to the salinity difference between the formation water and fresh drilling water, we can identify the permeable zones by comparing the discrepancy between the shallow resistivity log (e.g. short-normal) and deep resistivity log (e.g., long-normal) (Figure 4). When drilling with fresh water, permeable rocks tend to produce smaller deep resistivity values than shallow resistivity values. The yellow-colored intervals mark the zones where drilling mud had infiltrated into the formation, thus correspond to the permeable zones. Larger difference indicates higher permeability. Three wells in the northern portion of the study area (COL-241, GGS-730, and GGS-3105) show poor reservoir quality as no permeable zone can be identified by the logs. On the other hand, the other seven wells all show permeable intervals in the RbH. Those porous sandstones could not be proven to belong to any individual regional stratigraphic unit due to the scarcity of data, inconsistent thickness and stratigraphic positions. Some porous intervals of the RbH are separated from the overlying Coastal Plain sediments by thick sections of impermeable red beds (GGS-3457, and GGS-619), while the impermeable zones in other wells (GGS-107, GGS-3120, GGS-3113, GGS-3099, and GGS-3114) are either thin or less impermeable.
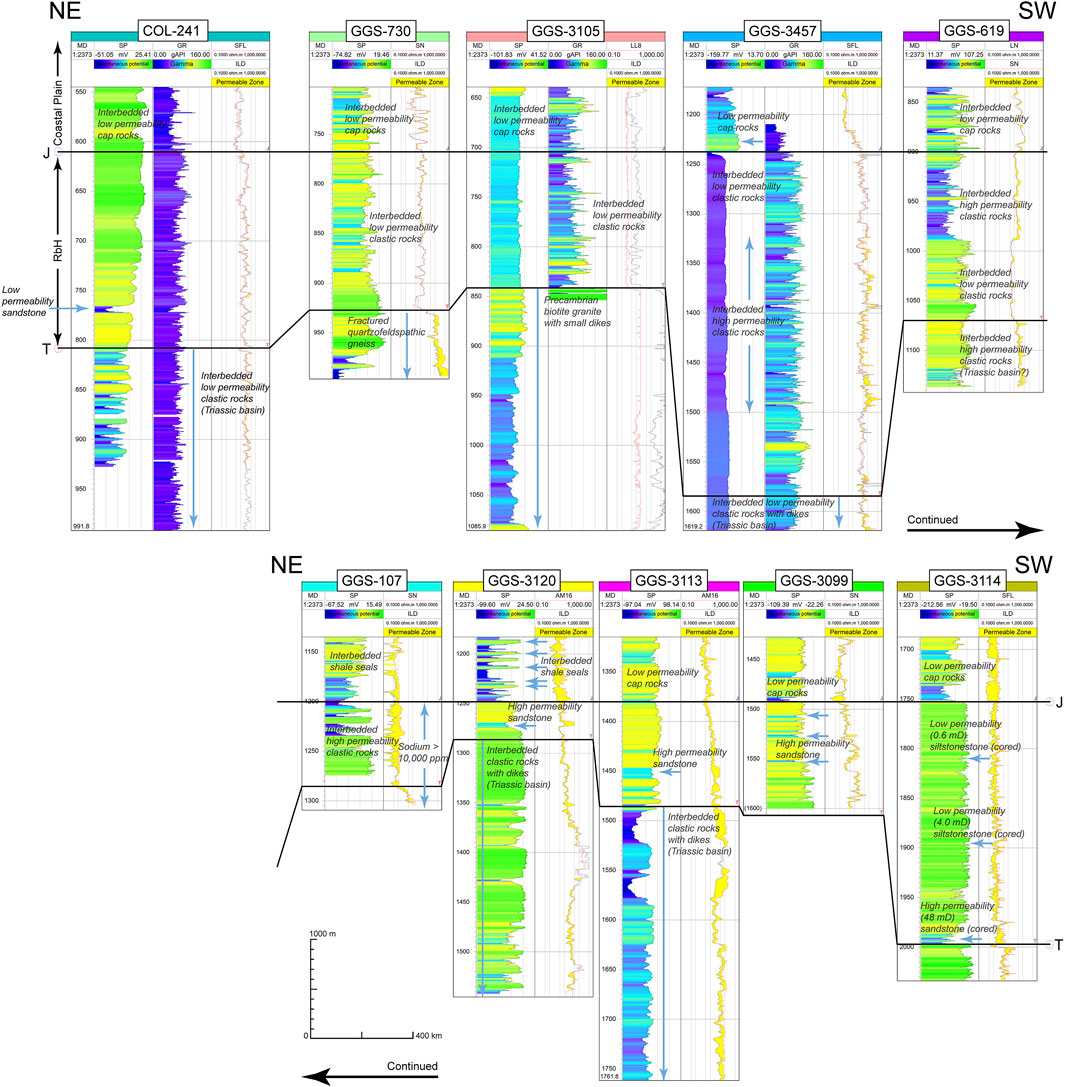
FIGURE 4. Well section flattened on the “J” horizon (top of the RbH) showing geophysical logs and interpreted permeable zones in each well. Yellow-colored zones indicate permeable intervals, the larger the difference between the resistivity curves, the more permeable the rock is. The clay content in the RbH is calculated based on SP logs and mud logs from three wells (GGS-3120, GGS-3113, and GGS-3114).
Experimentally derived porosity and permeability data available from CC-3 and GGS-3114 (Table 1) illustrate promising reservoir quality rocks in Southern Georgia. The variation of the absolute permeability of the three core samples from GGS-3114 correlates well with the permeable zones indicated by deep/shallow resistivity logs. In southern Georgia, the RbH cores from GGS-3114 show similar lithology yet variation in permeability (Table 1) which is inversely correlated with depth. The thickest clean sand is found at the base of the RbH at 1,984–1,997 m depth with a permeability and porosity of 48 mD and 18.4%, respectively. In Coastal South Carolina, the cores from CC-3 well yielded extremely low permeability and very low porosity compared with other wells (Akintunde et al., 2013). The high matrix content and abundance of unstable minerals such as plagioclase and potassium feldspar suggest the muddy matrix probably prevented the development of secondary porosity as corrosive fluids cannot access the feldspar grains. The low permeability and porosity observed in CC-3 is likely caused by poor sorting, strong compaction, carbonate cement, or a combination of those factors. Detailed examination of facies and minerology by Gohn et al. (1983a) suggested the immature red beds in CC-3 was deposited in an alluvial-fan environment, possibly within 20 km from the source. Thus, we believe the measured fluid flow properties of the red beds in CC-3 well were locally derived and not a suitable overall representation for the RbH.
We correlated the endmember lithologies (shale and sandstone) from mud logs of three wells in Southern Georgia (GGS-3114, GGA-3113, and GGS-3120) with SP logs to calculate the clay contents. The results show good correlation with the resistivity logs—the higher the calculated clay content the lower the permeability. The estimations for these three wells show the average clay contents of the RbH are 36.5, 74.1, and 66.2% respectively. In other words, the porous sandstone contents in those three wells are 63.5, 25.9, and 33.8%, respectively. Those numbers are consistent with 21–76% estimation given by Gorecki et al. (2009) for clastic rocks deposited in a fluvial environment. It is evident that additional data are needed to adequately illustrate the clay content distribution in the RbH.
Adequate Depth
For compliance with the Safe Drinking Water Act, and to maximize the storage security and potential, CO2 needs to be injected under adequate depth to maintain a supercritical state (above 31.3°C, and 7.4 MPa). Supercritical CO2 is ideal for the storage due to its liquid-like density and gas-like viscosity. We calculated the temperature and minimum pore pressure (hydrostatic pressure) at the base of the RbH (“T” horizon) in the Coastal Plain area of Georgia and South Carolina. The “T” horizon temperature is linearly interpolated/extrapolated based on temperature estimations at 1,000 m and 1,500 m depth (assuming linear geothermal gradient within the depth of interest). The hydrostatic pressures are calculated based on the elevation difference between the “T” horizon and the 2-year (2018 and 2019) average water table elevation.
The suitable portion of the RbH should also contain formation water with salinity greater than 10,000 mg/L total dissolved solids, according to the US-DOE’s National Energy Technology Laboratory best practice manuals for geologic carbon storage projects (2017). Formation water analysis from GGS-107 suggests existence of highly saline water (>10,000 ppm total dissolved solids) at 1,206 to 1,309 m depth in southern Georgia. Additional formation water data in other parts of the study area is needed to accurately depict the salinity distribution in the RbH. With the constraints from temperature, pressure, and salinity, the suitable portion of the RbH for CO2 storage is determined to be approximately 85,000 km2 (Figure 5).

FIGURE 5. Map of the study area with suitable temperature, pore pressure and salinity conditions for CO2 storage. The estimations were made at the “T” horizon (the base of the RbH). The yellow and dark blue dashed lines mark the updip limit of the minimum temperature, hydrostatic pressure for supercritical CO2, respectively. The well location coordinates can be found in and Knapp (2018).
Prospective Storage Resources
We adopted the US-DOE methodology (Goodman et al., 2011) to estimate the storage resource for the entire RbH in an open system. Using numerical simulations and field-based data, Gorecki et al. (2009) developed a set of broadly applicable coefficients for more realistic effective storage resource estimates in saline formations. The volumetric approach is based on the reservoir’s physical geometry, fluid properties, geologic heterogeneity, buoyancy effects and sweep efficiency (See Eqs 1, 2, and Table 3).
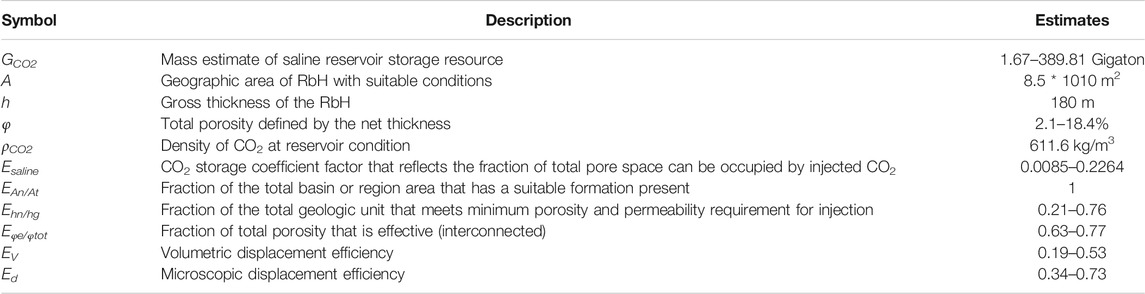
TABLE 3. Saline formation CO2 effective storage resource estimation parameters.
The reservoir area A that has suitable temperature, pressure, and salinity conditions for the injected CO2 to be in supercritical state is assessed to be about 85,000 km2 as discussed in the previous section (thus, EAn/At = 1). The majority of the RbH has a gross thickness from 100 to 250 m, and the weighted average gross thickness h is calculated to be 180 m (Figure 6B). The total porosity φ of the sandy red beds ranges from 2.1 to 18.4% based on the experimentally derived measurements (Table 1). The density of the CO2 (ρCO2) is approximated to be 611.6 kg/m3 under the weighted average reservoir conditions (49°C and 12.2 MPa, Figure 6C, D) (Span and Wagner, 1996). As discussed in the previous section that the depositional environment of RbH is largely fluvial, thus, the rest of the parameters (Ehn/hg, Eφe/φtot, EV, and Ed) are estimated accordingly and will be discussed in a later section (Gorecki et al., 2009). The minimum and maximum storage resource can then be calculated using the endmembers of the total porosity (φ) and the storage coefficient (Esaline) (Table 3).

FIGURE 6. (A) The RbH isochore map and the CO2 emissions from large industrial facilities in Georgia and South Carolina in 2019. The emission data is compiled from the EPA Greenhouse Gas Reporting Program. The blue polygon depicts the reservoir area with suitable temperature and pressure for supercritical CO2; (B) Statistical distribution of various RbH thickness in the reservoir area. Note most (74.9%) of the red beds are approximately 100–250 m thick, and the weighted average thickness is 180 m; (C,D) are the distribution of reservoir temperature and pressure in the reservoir area, respectively. The weighted averages are 49°C and 12.2 MPa, respectively.
Based on aforementioned data analysis, we are able to estimate the range of storage resources in the RbH as well as to illustrate the geographic distribution of the emission sources relative to the potential reservoir area.
The potential reservoir area underlies two major CO2 emission centers (Savannah, GA and Charleston, SC area). Most of the industrial CO2 point sources in Georgia and South Carolina are located within 150 km range from the reservoir area (Figure 6A). Although there are a number of analogous injection practices, such as natural gas storage, occurred in densely populated areas, most of the suitable RbH reservoir is in the less populated portion of Georgia and South Carolina. Due to the ubiquitous presence of the reservoir, the cost for transporting CO2 is likely to be minimal.
Discussion
In this section, we will propose an area with a potential stratigraphic/structural trap system. Based on the local geological characteristics and other studies, we discuss the main trapping mechanisms for the system and propose necessary future data collection. We will also discuss the importance of scale when estimating reservoir resources.
Potential Area of Review
Based on the current available subsurface data, we identified an area of interest (the area around cross-section AA′ in Figure 1) that possesses potential stratigraphic/structural trap. Stratigraphically, the RbH pinch out against the west flank of the Peninsular Arch and are overlapped by the Coastal Plain beds (Figure 7). The apparent dip of the onlapping RbH along AA′ is less than 1°. We use the endmembers of the SP and mud logs to estimate the clay content in those four wells (GGS-3114, GGS-3099, GGS-3113, and GGS-3120) and a 50% clay content cut-off to separate sand-rich reservoir intervals from clay-rich seal intervals. Core sample at the base of GGS-3114 suggests the presence of a porous and permeable sandstone layer at the base of the RbH. Although the correlation of stratigraphy is weak due to the large distance between the wells, we can see the interbedded shale and sandstone in the RbH as well as the overlying cap rocks near the base of the Coastal Plain. Based on the logs, this area lacks a continuous regional cap rock, however, multiple low permeability intervals and local cap rocks are identified near the base of the Coastal Plain that can impede the vertical fluid migration to the Coastal Plain (GGS-3114, GGS-3099, GGS-3113, and GGS-3120, Figure 4). The Coastal Plain beds in this area belong to the Southeastern Coastal Plain aquifer system. Hydrological studies show that the basal Black Warrior River aquifer is overlain by a regional confining unit and contains stagnant water with dissolved-solids concentrations greater than 10,000 mg per liter (Miller, 1992). Those conditions favor a local stratigraphic trap system.
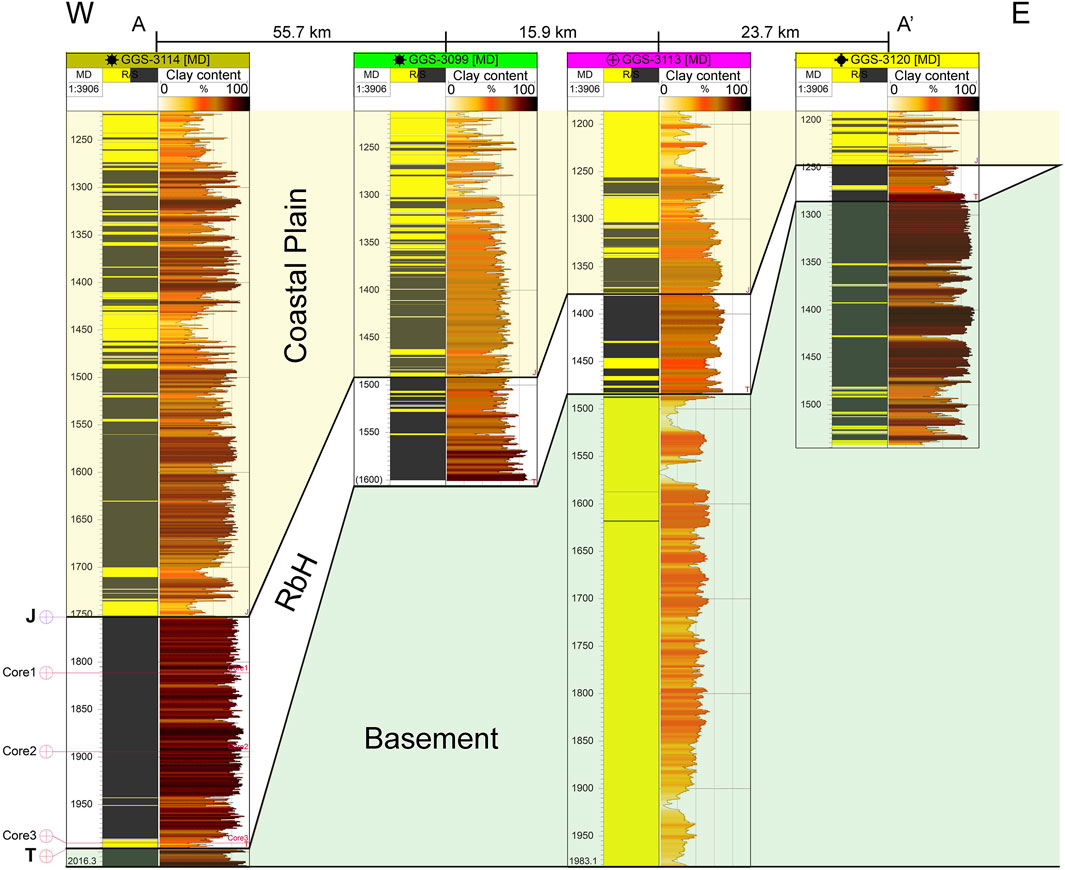
FIGURE 7. Cross-section AA′ showing the clay content and reservoir/seal distribution in the four wells in southern Georgia. The wells are leveled at the ground level and the measured depth is in meters. Clay content is calculated based on SP/mud logs and 50% clay content cut-off is used to differentiate sand-dominated reservoir and clay-dominated seal rocks. The RbH is seen onlapping the Peninsular Arch basement rock and pinch out east to GGS-3120.
The sandstone interval identified at 1,991 m in well GGS-3114 (Core 3) provides a potential test site for reservoir rock with high permeability and strength to allow safe dissipation of induced stresses and fluid pressures from CO2 injection. The available cap rock, in total of 240 m thick, is made of clastic rocks with high clay content. On a regional scale, the injected CO2 will be trapped as it migrates updip to the pinch-out point, but even in the absence of stratigraphic or structural trap, the CO2 could be simply stored in the pore spaces of reservoir rocks according to several studies (Bachu, 2000; Bachu and Adams, 2003; Shukla et al., 2013).
The major uncertainty for effective CO2 storage in this system is the characteristics of the confining aquitards. The relative permeability, capillary entry pressure and potential migration bypass cannot be currently determined based on sparse two-dimensional well data. Future 3-D seismic survey correlated with additional wells should bring insights to detailed structural and stratigraphic mapping of the area. Petrophysical properties derived from additional cored intervals are also necessary to depict the site-specific reservoir characterization in future studies.
Certainly, much remain to be studied about the phenomena involved in the process of final mitigation of the CO2 injected into the RbH and the effects on the integrity and efficiency of reservoir, cap rocks, and basement.
Trapping Mechanisms
Various trapping mechanisms in deep saline aquifers operate on different time scales (IPCC, 2005), and this adds another layer of complexity to estimating future site-specific storage capacity. This section will explain and discuss the four trapping mechanisms (stratigraphic/structural, residual, solubility, and mineralization) that will take effect at different time scales during the geological trapping of CO2. We found that in the absence of a significant regional physical trap, the residual trapping is the most reliable and effective mechanism for sequestering CO2 in the RbH (Gorecki et al., 2009; Burnside and Naylor, 2014).
The stratigraphic/structural trapping is the main mechanism during and in the first few years after the injection. The interbedded shaly sections of the RbH can potentially impede the migration of buoyant CO2 via high capillary pressure. However, the lack of data in the potential area of review prevents thorough investigation of the seal geometry and integrity.
During the drainage process, the injected CO2 displaces the native reservoir fluid (saline water) until the maximum CO2 saturation (Smax) is obtained. After the injection, the imbibition process drives the brine back to re-occupy some pore space until the residual saturation (microscopic displacement efficiency, Ed) is reached. In the open system, as the free-phase CO2 retreats through the pores in the RbH, some CO2 will be physically trapped in the pore space due to relative permeability hysteresis. This process occurs over time scales of days to months in core sample experiments and is predicted to have great contribution for trapping within 10’s of years (Burnside and Naylor, 2014). Krevor et al. (2012) reported Smax = 46% and Ed = 31% for the conglomeratic sandstone from the Cretaceous Tuscaloosa Massive Sand formation, which has many similarities in comparison with the RbH such as grain maturity, sizes, and angularity, cementation, porosity heterogeneity, and depositional environment. Overall, Burnside and Naylor (2014) demonstrated that 13–92% of the injected CO2 can be residually trapped.
The solubility trapping occurs as the injected CO2 contacts unsaturated formation brine. The amount of dissolved CO2 is a function of reservoir temperature, pressure, and salinity. We calculated the solubility of CO2 in fresh water under a wide range of temperature and pressure conditions (Spycher et al., 2003) (Figure 8) and noticed the water can become up to 5.8% denser at the highest solubility. Due to the less solubility of CO2 in saline water (Spycher and Pruess, 2005) and liberation of CO2 when pressure drops, solubility trapping provides minor contribution in the short-term, especially during injection, and is a less secure mechanism than residual trapping in the long-term.
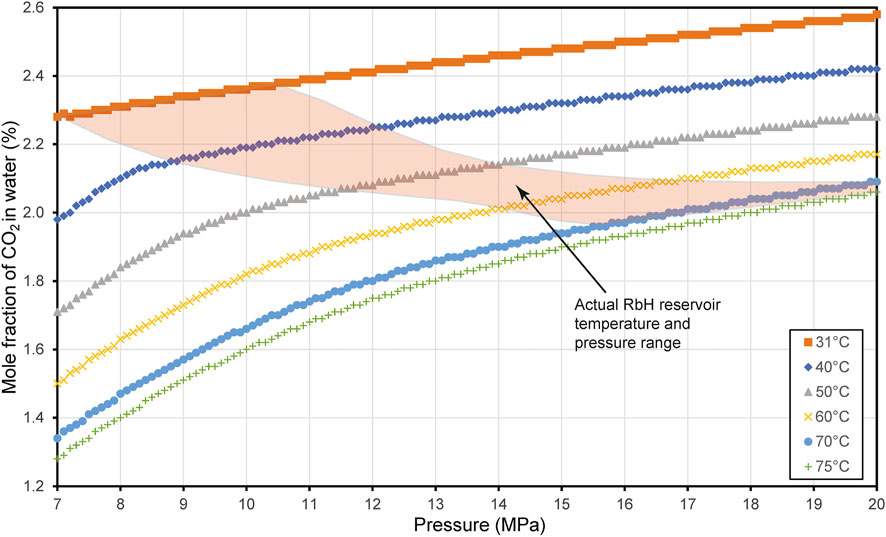
FIGURE 8. Theoretical solubility of CO2 in fresh water under the reservoir conditions: from 31°C to 75°C and 70–200 MPa (Spycher et al., 2003; Bikkina et al., 2011). The solubility has positive correlation with pore pressure and inverse correlation with temperature. The mass of dissolved CO2 is insignificant compared to other trapping mechanisms. The shaded area represents the actual reservoir temperature and pressure conditions in the study area. Note the CO2 is less soluble in saline water than in fresh water (Spycher and Pruess, 2005), and any pressure drop (for example, due to leakage) will lead to the liberation of CO2.
The mineral trapping geochemically converts CO2 into stable minerals, thus is the most secure trapping mechanism, yet the most time consuming and least understood for the RbH.
Recent theoretical and experimental models for post-injection migration of CO2 gravity flow in confined and sloping aquifer suggest residual trapping, solubility trapping, and capillary pinning complement each other in limiting the ultimate migration distance of CO2 gravity currents (Zhao et al., 2014). According to their model, in the case of a closed system with an impermeable confining seal, the majority (up to 87% with less than 1 Mt of injected CO2) of CO2 is immobilized by capillary pinning. The contribution of each of the trapping mechanisms is a function of the amount of CO2 injected. The mass fraction of immobilized CO2 by capillary pinning decreases to about 65% when 15 Mt of CO2 was injected. On the other hand, the mass fraction of immobilized CO2 by residual trapping and solubility trapping increases from less than 10% to about 20%.
Issue of Scale
The scale of assessment for effective CO2 storage resources is of great importance (Bachu, 2015). Our preliminary resource assessment is conducted over the entire sedimentary formation (regional scale). Notwithstanding that the net to total area (EAn/At) is relatively well constrained by temperature, pore pressure, and salinity data, other geologic variables such as net to gross thickness (Ehn/hg), effective porosity (Eφe/φtot), and displacement efficiencies (EV and Ed) are more likely to be on the lower end of the estimates (Table 3). The estimated range of these coefficients are only constrained by the depositional environment of the RbH. As we based our assessment of porosity and permeability on a few site-specific measurements, there will be a larger fraction of the RbH that is not amenable to CO2 storage. On the other hand, since the entire formation is open to noncompartmentalized hydrodynamic flow, it is reasonable to extrapolate the site-specific rock and fluid property values to the entire study area (Gorecki et al., 2009).
It is more ideal to examine the storage potential of the RbH based on its geological distribution from geoscience or engineering perspective. Nontechnical policy makers and stakeholders tend to require storage resources to be estimated according to geographic conventions that are typically defined by political rather than geological boundaries. In order to be more accessible to broader audience, our maps and resource estimates are bounded by the state boundaries of South Carolina and Georgia.
Conclusion
The newly identified deep saline formation - the RbH and the updated lithostratigraphic model brings a vast potential for the onshore CO2 storage in the southeastern United States. Our preliminary estimates suggest that the 85,000 km2 suitable reservoir area provides a maximum 390 Gt of storage resource. Mud logs and geophysical log data suggest heterogeneous properties for both reservoir and seal intervals, yet the scarcity of current subsurface data limits the further characterization of the system.
We proposed an area of review for a possible stratigraphic/structural trap system in southern Georgia based on well logs and core measurements. In the absence of regional stratigraphic trapping conditions, the residual trapping acts as the main trapping mechanisms for the long-term storage. The seal integrity and effectiveness depend upon the cap rock’s capillary entry pressure, which is related to the pore size, the interfacial tension between the native and injected fluids, and the relative wettability of the rock to the fluids. To understand the short-term (especially during injection) trapping mechanisms (stratigraphic and hydrodynamic trapping) for the area of review, additional seismic, well log, and petrophysical data are needed. Those should be the focus of future data collection for the characterization of a site-specific storage system.
Data Availability Statement
The datasets for this study can be found in the (EPA Greenhouse Gas Reporting Program) (https://www.epa.gov/ghgreporting/ghgrp-emissions-location). (National Ground-Water Monitoring Network) (https://cida.usgs.gov/ngwmn/index.jsp). (National Renewable Energy Laboratory Geothermal Prospector) (https://maps.nrel.gov/geothermal-prospector/?aL=KM9nbd%255Bv%255D%3Dt&bL=clight&cE=0&lR=0&mC=40.21244%2C-91.625976&zL=4).
Author Contributions
RC integrated seismic and well data to analyze and map the geological features and distribution of the newly defined Red beds of Hazlehurst. RC gathered and analyzed the subsurface data for adequate storage depth, formation evaluation, and prospective storage resource. RC Proposed the potential area of review. JK provided advice on the renewed stratigraphy, depositional environment, and overall manuscript review. PB provided the numerical analysis of the CO2 solubility, advised on trapping mechanisms, and overall manuscript review. RE suggested the study and provided overall manuscript review.
Funding
Financial support for RC was provided by the Boone Pickens School of Geology.
Conflicts of Interest
Author RE is employed by Southern Company.
The remaining authors declare that the research was conducted in the absence of any commercial or financial relationships that could be construed as a potential conflict of interest.
Publisher’s Note
All claims expressed in this article are solely those of the authors and do not necessarily represent those of their affiliated organizations, or those of the publisher, the editors, and the reviewers. Any product that may be evaluated in this article, or claim that may be made by its manufacturer, is not guaranteed or endorsed by the publisher.
Acknowledgments
We thank Oklahoma State University for providing research resources, Georgia Geological Survey’s geophysical log database, and colleagues and friends for providing ideas and support.
References
Akintunde, O. M., Knapp, C., and Knapp, J. (2013). Petrophysical Characterization of the South Georgia Rift Basin for Supercritical CO2 Storage: a Preliminary Assessment. Environ. Earth Sci. 70 (7), 2971–2985. doi:10.1007/s12665-013-2355-6
Applin, P. L. (1951). Preliminary Report on Buried Pre-mesozoic Rocks in Florida and Adjacent States. US Geol. Surv. Circular 91, 28. doi:10.3133/cir91
Bachu, S., and Adams, J. J. (2003). Sequestration of CO2 in Geological media in Response to Climate Change: Capacity of Deep saline Aquifers to Sequester CO2 in Solution. Energ. Convers. Manag. 44, 3151–3175. doi:10.1016/s0196-8904(03)00101-8
Bachu, S. (2015). Review of CO2 Storage Efficiency in Deep saline Aquifers. Int. J. Greenhouse Gas Control. 40, 188–202. doi:10.1016/j.ijggc.2015.01.007
Bachu, S. (2000). Sequestration of CO2 in Geological media: Criteria and Approach for Site Selection in Response to Climate Change. Energ. Convers. Manag. 41, 953–970. doi:10.1016/s0196-8904(99)00149-1
Behrendt, J. C. (1986). “Structural Interpretation of Multichannel Seismic Reflection Profiles Crossing the southeastern United States and the Adjacent continental Margin: Decollements, Faults, Triassic(?) Basins and Moho Reflections,” in Reflection Seismology, the continental Crust. Editors M. Barazangi, and L. Brown (Washington, D.C: American Geophysical Union Geodynamic Series), 201–213. doi:10.1029/gd014p0201
Bikkina, P. K., Shoham, O., and Uppaluri, R. (2011). Equilibrated Interfacial Tension Data of the CO2-Water System at High Pressures and Moderate Temperatures. J. Chem. Eng. Data 56 (10), 3725–3733. doi:10.1021/je200302h
Boote, S. K., and Knapp, J. H. (2016). Offshore Extent of Gondwanan Paleozoic Strata in the southeastern United States: The Suwannee Suture Zone Revisited. Gondwana Res. 40, 199–210. doi:10.1016/j.gr.2016.08.011
Burnside, N. M., and Naylor, M. (2014). Review and Implications of Relative Permeability of CO2/brine Systems and Residual Trapping of CO2. Int. J. Greenhouse Gas Control. 23, 1–11. doi:10.1016/j.ijggc.2014.01.013
Cao, R., and Knapp, J. (2018). “Newly Identified Subsurface Stratigraphic Unit in the Southeastern U.S.: Red Beds of Hazlehurst and Cessation of Triassic Rifting,” in Presented at 2018 Fall Meeting (San Francisco, CA: AGU). T51H-0271.
Chowns, T. M., and Williams, C. T. (1983). Pre-Cretaceous Rocks beneath the Georgia Coastal plain. US Geological Survey Professional Paper, 1–42.
Costain, J. K., and Coruh, C. (1989). “Tectonic Setting of Triassic Half-Grabens in the Appalachians: Seismic Data, Acquisition, Processing and Results,” in Extensional Tectonics and Stratigraphy of the North Atlantic Margins. Editors A. J. Tankard, and H. R. Balkwill (Alexandria, VA: American Association of Petroleum Geologists Memoir), 155–174.
Daniels, D. L., Zietz, I., and Popenoe, P. (1983). “Distribution of Subsurface Lower Mesozoic Rocks in the Southeastern United States as Interpreted from Regional Aeromagnetic and Gravity Maps,” in Studies Related to the Charleston, South Carolina, Earthquake of 1886-- Tectonics and Seismicity. Editor G. S. Gohn (Washington D.C.: U.S. Geological Survey Professional Paper), K1–K24.
Darton, N. H. (1896). Artesian-well Prospects in the Atlantic Coastal Plain Region. U.S. Geol. Surv. Bull. 138, 232.
Dewey, J. F., and Bird, J. M. (1970). Mountain Belts and the New Global Tectonics. J. Geophys. Res. 75 (14), 2625–2647. doi:10.1029/jb075i014p02625
Duncan, J. G. (1998). Geological History of an Accreted Terrane: Paleozoic Stratigraphy of the North Florida Basin. Suwannee Terrane: The Florida State University.
D. W. Rankin (Editor) (1977). Studies Related to the Charleston, South Carolina, Earthquake of 1886: A Preliminary Report (Vol. 1028) (Washington D.C.: Department of the Interior, Geological Survey).
Ediger, V. S. (1986). Paleopalynological Biostratigraphy, Organic Matter Deposition, and Basin Analysis of the Triassic-(?) Jurassic Richmond Rift Basin. Virginia, U. S. A: [University Park (PA)]: Pennsylvania State University, 548. [Ph.D. dissertation].
Froelich, A. J., and Olsen, P. E. (1984). Newark Supergroup, a Revision of the Newark Group in Eastern North America. Alexandria, VA: USGS Bulletin 1537-A, A55–A58.
Gohn, G. S. (1983b). “Geology of the Basement Rocks Near Charleston, South Carolina—data from Detrital Rock Fragments in Lower Mesozoic (?) Rocks in Clubhouse Crossroads Test Hole #3,” in Studies Related to the Charleston, South Carolina, Earthquake of 1886—Tectonics and Seismicity. Editor G. S. Gohn (Washington D.C.: U.S. Geol. Surv. Profess. Pap.), E1–E22.
Gohn, G. S., Houser, B. B., and Schneider, R. R. (1983a). “Geology of the Lower Mesozoic (?) Rocks in Clubhouse Crossroads Test Hole #3 Near Charleston, South Carolina,” in Studies Related to the Charleston, South Carolina, Earthquake of 1886 — Tectonics and Seismicity. Editor G. S. Gohn (Washington D.C.: US Geological Survey Professional Paper. 1313), D1–D17.
Goodman, A., Hakala, A., Bromhal, G., Deel, D., Rodosta, T., Frailey, S., et al. (2011). U.S. DOE Methodology for the Development of Geologic Storage Potential for Carbon Dioxide at the National and Regional Scale. Int. J. Greenhouse Gas Control. 5 (4), 952–965. doi:10.1016/j.ijggc.2011.03.010
Gorecki, C. D., Sorensen, J. A., Bremer, J. M., Ayash, S. C., Knudsen, D. J., Holubnyak, Y. I., et al. (2009). Development of Storage Coefficients for Carbon Dioxide Storage in Deep saline Formations. Report No. San Diego, CA: Energy & Environmental Research Center (EERC), University of North Dakota.
Gray, M. G. (1978). Pre-Gulfian Rocks of the Southwestern Georgia Coastal Plain. Atlanta (GA)]: Emory University. [master’s thesis].
Heffner, D. M. (2013). Tectonics of the South Georgia Rift. [Columbia (SC)]: University of South Carolina, 178. [Ph.D. thesis].
Klitgord, K. D., Popenoe, P., and Schouten, H. (1984). Florida: a Jurassic Transform Plate Boundary. J. Geophys. Res. 89, 7753–7772. doi:10.1029/jb089ib09p07753
Krevor, S. C., Pini, R., Zuo, L., and Benson, S. M. (2012). Relative Permeability and Trapping of CO2 and Water in sandstone Rocks at Reservoir Conditions. Water Resour. Res. 48 (2), 1. doi:10.1029/2011wr010859
Marine, I. W., and Siple, G. E. (1974). Buried Triassic basin in the central Savannah River Area, South Carolina and Georgia. Geol. Soc. America Bull. 85 (2), 311–320. doi:10.1130/0016-7606(1974)85<311:btbitc>2.0.co;2
Miller, J. A. (1992). Summary of the Hydrology of the southeastern Coastal plain Aquifer System in Mississippi, Alabama, Georgia, and South Carolina. USA: Regional aquifer system analysis--southeastern coastal plain.
Olsen, P. E., Schlische, R. W., and Gore, P. J. W. (1989). Tectonic, Depositional, and Paleoecological History of Early Mesozoic Rift Basins, Eastern North America: International Geological Congress Field Trip T351. Newark, NJ: American Geophysical Union, 174.
Olsen, P. E. (1997). Stratigraphic Record of the Early Mesozoic Breakup of Pangea in the Laurasia-Gondwana Rift System. Annu. Rev. Earth Planet. Sci. 25, 337–401. doi:10.1146/annurev.earth.25.1.337
Olsen, P. E. (1980). “Triassic and Jurassic Formations of the Newark basin,” in Field Stud- Ies of New Jersey Geology and Guide to Field Trips. Editor W. Manspeizer (Annual Meeting of the New York State Geological Association, 52nd), 2–39.
Sartain, S. M., and See, B. E. (1997). The South Georgia Basin: An Integration of Landsat, Gravity, Magnetics and Seismic Data to Delineate Basement Structure and Rift basin Geometry. Gulf Coast Assoc. Geol. Soc. Trans. 47, 493–498.
Scott, K. R., Hayes, W. E., and Fietz, R. P. (1961). Geology of the Eagle Mills Formation. Trans. Gulf Coast Assoc. Geol. Soc. 11, 1–14.
Shukla, R., Ranjith, P. G., Choi, S. K., Haque, A., Yellishetty, M., and Hong, L. (2013). Mechanical Behaviour of Reservoir Rock under Brine Saturation. Rock Mech. Rock Eng. 46 (1), 83–93. doi:10.1007/s00603-012-0246-x
Span, R., and Wagner, W. (1996). A New Equation of State for Carbon Dioxide Covering the Fluid Region from the Triple‐Point Temperature to 1100 K at Pressures up to 800 MPa. J. Phys. Chem. reference Data 25 (6), 1509–1596. doi:10.1063/1.555991
Spycher, N., and Pruess, K. (2005). CO2-H2O Mixtures in the Geological Sequestration of CO2. II. Partitioning in Chloride Brines at 12-100°C and up to 600 Bar. Geochimica et Cosmochimica Acta 69 (13), 3309–3320. doi:10.1016/j.gca.2005.01.015
Spycher, N., Pruess, K., and Ennis-King, J. (2003). CO2-H2O Mixtures in the Geological Sequestration of CO2. I. Assessment and Calculation of Mutual Solubilities from 12 to 100°C and up to 600 Bar. Geochimica et cosmochimica acta 67 (16), 3015–3031. doi:10.1016/s0016-7037(03)00273-4
Williams, L. J., Raines, J. E., and Lanning, A. E. (2016). Geophysical Log Database for the Floridan Aquifer System and southeastern Coastal Plain Aquifer System in Florida and Parts of Georgia, Alabama, and South Carolina (Ver. 1.1, December 2016). Reston, VA: U.S. Geological Survey Data Series, 12.
Keywords: CO2 storage, Georgia, South Carolina (United States), red beds of Hazlehurst, coastal plain, reservoir characterisation
Citation: Cao R, Knapp J, Bikkina P and Esposito R (2021) CO2 Storage Potential Reconnaissance of the Newly Identified Red Beds of Hazlehurst in the Southeastern United States. Front. Energy Res. 9:793300. doi: 10.3389/fenrg.2021.793300
Received: 11 October 2021; Accepted: 02 December 2021;
Published: 16 December 2021.
Edited by:
Dario Grana, University of Wyoming, United StatesReviewed by:
Michael L. Oristaglio, Yale University, United StatesKei Ogata, University of Naples Federico II, Italy
David Dominic, Wright State University, United States
Copyright © 2021 Cao, Knapp, Bikkina and Esposito. This is an open-access article distributed under the terms of the Creative Commons Attribution License (CC BY). The use, distribution or reproduction in other forums is permitted, provided the original author(s) and the copyright owner(s) are credited and that the original publication in this journal is cited, in accordance with accepted academic practice. No use, distribution or reproduction is permitted which does not comply with these terms.
*Correspondence: Ruoshi Cao, rcao@okstate.edu