3-Dimensional Multiphysics Modeling of Behaviors of Pressurized Water Reactor Fuel Rods With Missing Pellet Surface
 Xinhu Zhang
 Zhao Wang1
  Wenbo Liu
 Di Yun
- 1School of Nuclear Science and Technology, Xi’an Jiaotong University, Xi’an, China
- 2Nuclear Power Institute of China, Chengdu, China
- 3China Nuclear Power Technology Research Institute Co., Ltd., Shenzhen, China
- 4State Key Laboratory of Multi-phase Flow, Xi’an Jiaotong University, Xi’an, China
A 3-dimensional (3D) fuel performance analysis program, able to simulate normal operating conditions and accident conditions for PWR fuel behaviors, was developed based on the Multiphysics Object-Oriented Simulation Environment (MOOSE) finite-element framework. By taking fission products swelling, densification and expansion of pellet, thermal and irradiation creep, gap heat transfer, fission gas release, and cladding crack propagation into consideration, detailed fuel behaviors have been simulated in a multiphysics coupling way. Local defects in fuel pellet caused during manufacturing and filling processes known as the missing pellet surface (MPS) can cause abnormal stress distribution of the cladding and it could even lead to cladding failure. Taking Stress Corrosion Cracking (SCC) phenomenon into consideration, a simulation of PWR fuel rodlet that consists of a pellet with an MPS defect and an intact pellet was conducted. The fuel rod has experienced with sorts of events, including normal operating conditions and a high-power ramp event. The simulation results indicated that: 1) The MPS defect affects the temperature and displacement distribution in the vicinity of the MPS defect. When the pellets are in contact with the cladding, the inner surface of the cladding presents a large tensile hoop stress, which accelerates the crack propagation. 2) During the ramp event, the crack propagation rate was higher than that under normal condition and crack length expanded by about 0.1 µm.
Introduction
Under the harsh radiation environment in a nuclear reactor, the structure of the nuclear fuel assembly and the fuel rod experience complex in-reactor behaviors. Nuclear fuel is a multicomponent system which needs to satisfy strict performance criteria in a variety of aspects, and the multi-physics behavioral phenomena of the fuel rod generally occurs on a large time scale and the continuum spatial scale, making it difficult to describe the fuel behaviors accurately. In order to enhance heat transfer and avoid cladding collapse, the gap between pellet and cladding is generally pre-filled with helium. When the pellet and cladding continue to deform and come into contact, this phenomenon is called Pellet cladding interaction (PCI). Many phenomena that influence the PCI process and PCI behaviors will in turn affect other fuel behavioral phenomena, including heat transfer and mechanical response of the fuel. Therefore, accurate simulation of the PCI behavior is imperative for numerical fuel performance analysis.
The world’s first recorded fuel failure due to PCI occurred on June 17, 1963, after the second refueling of the GETR reactor in Vallecitos during the start-up process (Cox, 1990). Since then, scientists in the last century have put a lot of efforts into studying the mechanism of PCI. Analyses that have been done included stress analysis of the cladding, analyses of thermodynamics of fission products and the chemical properties of zirconium iodide compounds, etc. As early as 1987, scientists began to use computer simulation methods to assist experiments to verify PCI-related behaviors (Massih et al., 2005).
In the past 50 years, Boiling Water Reactors (BWRs) and Pressurized Water Reactors (PWRs) are the two main types of reactors, and in comparison, BWRs are more prone to cladding tube cracking failure accidents caused by PCI (Khvostov et al., 2013). IAEA report shows that, from 1980 to 2010, about 35% fuel rod leak incidents in heavy water reactors (CANDU reactors) and 12% fuel rod leak incidents in BWR were caused by PCI (Iaea, 2010). In PWRs, the fretting between the fuel rod and the spacer grids is the main mechanism of fuel rod breach and leakage. The incidence of cladding failures due to PCI behavior increased between 1980 and 2000. In PWR, fuel rod leakage caused by PCI is relatively rare, but it has also happened (Khvostov et al., 2013; Iaea, 2010). PCI caused breach mainly occurs when there are pellet chips caught in between the fuel-cladding gap or under the presence of MPS. Figure 1 shows a cross-sectional view of a fuel rod with a cladding failure, reproduced from Capps et al. (2015).
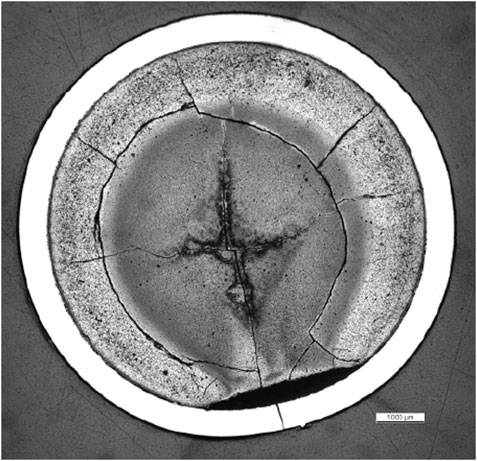
FIGURE 1. A cross-sectional view of a cladding failed fuel rod (Capps et al., 2015).
The physical field variables of the fuel rod, such as the maximum temperature of the fuel pellet, the maximum stress of the cladding, and the maximum thickness of the oxide layer, affect the core design scheme and many safety criteria. Many countries have developed various fuel rod performance analysis programs, and most developed programs used 1.5D (or 2D) axisymmetric models to simulate fuel behavior. EPRI has developed a 2D fuel performance analysis code, named FALCON, based on the finite element method (FEM) (Rashid et al., 2004; Khvostov et al., 2013), which used r-θ or r-z model to simulate the fuel rod behaviors, and FALCON can analyze fuel rod behaviors under steady-state conditions and transient conditions. It is worth mentioning that FALCON can analyze MOX fuel and coated fuel rods as well (Rashid et al., 2004). PNNL has developed a light water reactor fuel performance analysis program FRAPCON-3 (Bernd et al., 1997), based on the FORTRAN programming language, which used 1D axisymmetric models to simulate steady-state behaviors of fuel rod. This procedure was also adopted by the Nuclear Regulatory Commission (NRC). FRAPCON provides initial conditions for the transient analysis program FRAPTRAN (Geelhood et al., 2016) (also developed by PNNL), and can analyze reactor accidents with short time scale processes. TRANSURANUS (Lassmann et al.,) is a 1.5D quasi-static fuel performance analysis program developed by the European Commission’s Joint Research Center in Karlsruhe, Germany. Westinghouse has integrated specific models on TRANSURANUS so that the latest version of TRANSURANUS can perform the best estimation and conservative safety analysis of PWR and VVER fuel rods (Geelhood et al., 2016). INL has developed a new generation fuel performance analysis program BISON based on the MOOSE framework (Williamson et al., 2012). BISON contains 2D r-z and 3D fuel models and has been used in commercial fuel rods analysis work (Williamson et al., 2016). BISON can analyze spherical TRISO-coated fuel particle as well, which confirms its powerful multidimensional coupling analysis capabilities. CEA has developed a 2D and 3D fuel rod analysis code named TOUTATIS based on the FEM code CASTEM 2000 (Bentejac et al.,). Since then, CEA has integrated multiple fuel analysis codes, developed the PLEIADES platform, and built a more advanced fuel performance analysis program, ALCYONE, based on the PLEIADES platform (Van Uffelen et al., 2019). ALCYONE can analyze the behaviors of the fuel rod in 1.5D, 2D, and 3D configurations, and can analyze normal and off-normal operating conditions of the UO2 and MOX fuel rods. In addition to the special fuel performance analysis program developed by the above specific research institutes, many scholars also used commercial software, such as ABAQUS, COMSOL, and ANSYS to perform analyses of fuel rods using 2D or 3D models (Williamson, 2011; Rong and Zhou, 2016; Tang et al., 2016; Zhu et al., 2018).
When the fuel pellet surface is missing, the fuel rod is no longer symmetrical in the circumferential direction. Since the pellet and the cladding generally do not come into contact with each other in the missing surface location, the temperature and displacements distribution in this region will also be different from the rest of the fuel rod. In this case, the 1.5D model and the r-z 2D models are no longer applicable. It is difficult for the 2D r-θ model to analyze the “ridge effect” of the cladding corresponding to the position of the contact surface of the pellet, and it is also not possible for such model to analyze fuel rods with MPS defects accurately. Therefore, the three-dimensional fuel performance analysis model is the most appropriate way to study MPS resulted failure mechanisms and the associated PCI process.
In 2016, Nathan Capps studied the influence of MPS defect size on the hoop stress distribution of the cladding using the BISON-CASL program, and calculated the stress reduction factor of 7–16% for a finite length MPS by BISON-CASL (Capps et al., 2016). B.W. Spencer studied the effect of MPS defects on BWR fuel performance by BISON, and analyzed the temperature and stress distributions adjacent to the MPS defects during a blade pull event (Spencer et al., 2016). Williamson illustrated an analysis of PCMI failures from manufacturing defects using combined 2D and 3D analyses by BISON, and showed BISON’s advanced capabilities in fuel performance simulation (Williamson et al., 2012).
In this paper, we developed a 3D fuel performance analysis program based on the MOOSE framework, suitable for simulation under normal operating conditions and accident conditions for PWR fuel behavior analysis. In addition to conventional stress and temperature simulations, this program also adds a stress corrosion cracking model to predict the growth of cracks on the inner surface of the cladding. This paper is organized as follows: Modeling Description mainly describes the related model of UO2 fuel and Zr-4 cladding used in this work. In Validation, the verification of our code is performed comparing with FRAPCON-4 using the experimental data of the fuel rods IFA-432r1 and IFA-513r6 of the Halden HBWR reactor. Simulation Results shows the corresponding modeling results under stable operating conditions and the third irradiation cycle power ramp event conditions. Conclusion provides a summary of this work.
Modeling Description
The MOOSE Framework
The basic framework used in this paper, the MOOSE framework, was developed by Idaho National Laboratory (INL). The MOOSE framework is a typical finite element framework, which embedded Libmesh source code and solver library PETSc, etc, that greatly reduces the application difficulty of the MOOSE framework. The moose framework provides the basic code for physical module, which is conducive to the secondary development for scholars. Compared with commercial software, it is more maneuverable, and researchers can modify the underlying code to achieve different functions.
Geometric Model and Modeling Parameters
In this paper, a modeling and analysis of the fuel rod consisted by a non-defective pellet and a MPS pellet is carried out. under transient conditions, the three-dimensional heat transfer behavior, mechanical behavior, fission gas release behavior and cladding crack propagation behavior are considered. The fuel behavior in stable operating conditions and power ramp tests are simulated. In stable operating conditions two shutdown and refueling processes were also simulated to describe the effect of the stress surge on the crack propagation in the cladding inner surface during the power-up process.
When constructing the geometric model, the refined shape of pellets is considered in this paper, including dishes and chamfers. Figure 2A shows the 2D geometric model of two pellets and cladding. Figure 2B shows the shape of the MPS defect. In the research literature surveyed, the MPS defect thickness of different kind of fuel rods is different (Spencer et al., 2012; Spencer et al., 2016), and the thickness of the missing block in this paper is obtained from Figure 1. In this paper, the MPS defect thickness is set to 0.4 mm.
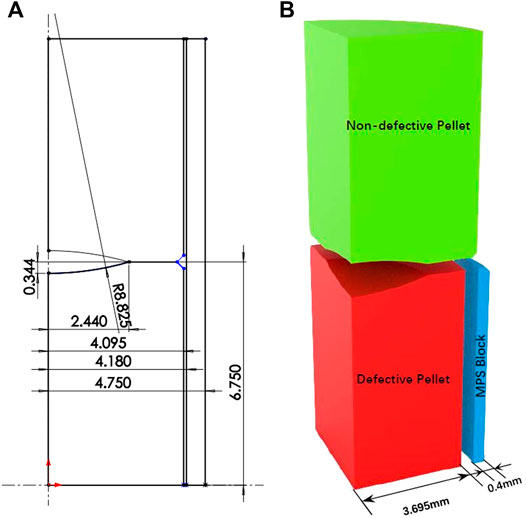
FIGURE 2. (A) The 2D geometric model of pellet and cladding, (B) MPS geometric parameters.
In this paper, the geometric model of the fuel rod contains two pellets and a section of contoured cladding. In the calculation of the gas cavity, the volume of the gas chamber at the top of the fuel rod, the gap volume between the pellets and the cladding, and the gap volume between two adjacent pellets are considered. The two pellets are located at the hot spot of the reactor, and the purpose of this setting is that the modeling results can cover the general situation.
The reactor operating parameters required in the models including power factor with base volumetric power of 3.0 × 10⁸ W/m3 and boundary conditions like cladding outer surface temperature and coolant pressure are shown in Table 1. At the end of the fuel life, a power ramp is introduced to reflect the crack propagation of the cladding when the contact pressure between the pellet and the cladding is at its maximum. Other input parameters used in the models are shown in Table 2. In the process of mesh construction, local grids adjacent to the MPS defect were refined compared to other normal areas to make the calculation more accurate.
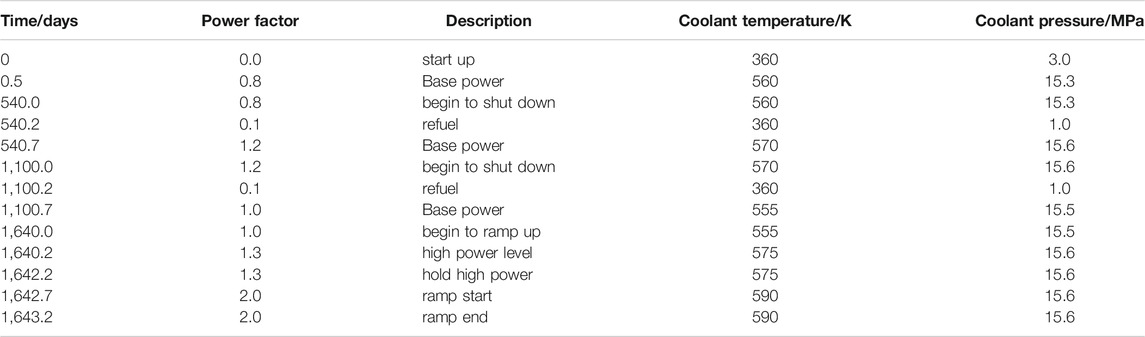
TABLE 1. Power history and time dependent boundary conditions in modeling.
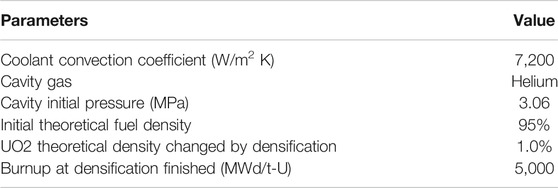
TABLE 2. Input parameters for models.
In the heat transfer simulation, the size of the gap between the pellet and the cladding which is the result of mechanical calculations affects the temperature distribution, and the temperature affects the material properties and eigenstrain in the mechanical calculations in return. This paper uses the Jacobian Free Newton Krylov (JFNK) numerical solution method provided by the MOOSE framework. Temperature and displacements are solved without distinction and can be called mutually in the control equations.
Fuel Models
Thermal Behavior Models
The heat transfer balance model used in analysis is given as:
where ρ,
The empirical model used by FRANCO (Lee, 1996) is adopted to calculate the thermal conductivity of UO2, and the thermal conductivity is dependent on temperature, burnup and porosity:
where
In the normal operating temperature range of the reactor, according to different experimental data, MATPRO (Siefken et al., 2001) gives the relationship between temperature and heat capacity as shown below:
where
The density of UO2 can generally be expressed as a function of temperature, or a function of strain. This paper uses the empirical model used in Newman’s work (Newman et al., 2009):
where
The cladding material used in the modeling is Zr-4 with a cold-worked (CW) microstructure. MATPRO (Siefken et al., 2001) gives the relationship between temperature and thermal conductivity of Zircaloy-4(Zr-4) as shown below:
where
Due to the large thermal conductivity of the cladding zirconium material, the temperature difference between the inner and outer walls of the cladding is relatively small. In this paper, the specific heat of the cladding takes a constant value of 320 (J/kg/K), similar to the setting in FRANCO. Similarly, the density of the cladding is also taken as a constant value of 6,510.5
The heat transfer model of the pellet-cladding gap is more complicated. As the burnup increases, the pellet swells and deforms. Such fuel pellet behavior makes the gap size and gas cavity pressure change with time. Typically, the heat transfer between pellets and cladding gap can be expressed as (Williamson et al., 2012):
where
where
where
where
where T is gas temperature (°C), and its value is generally taken as the average temperature of the outer surface of the pellet and the inner surface of the cladding.
The radiation heat transfer between the outer surface of the pellet and the inner surface of the cladding also contributes to the gap heat transfer process. According to Boltzmann’s law of radiation heat transfer (Williamson et al., 2012):
where σ is Stefan-Boltzmann constant with a value of 5.67 × 10⁻⁸ W/m−2/K−4;
When the burnup reaches a certain depth, the pellet and the cladding will come into contact, and then the heat transfers directly between the two contacting surfaces. Existing contact thermal conductivity models generally believe that thermal conductivity is related to the contact pressure as shown below (Williamson et al., 2012):
where
On the outer surface of the cladding, the coolant convective heat transfer boundary is considered. It should be mentioned that the convection heat transfer coefficient is set according to reference (Lassmann, O’Carroll, van de Laar, Ott; Van Uffelen et al., 2019), and the coolant temperature is set according to realistic power reactor data.
Mechanical Properties Models
In the mechanical modeling, this paper adopts the elastic mechanics constitutive model and the finite strain assumption, considering the elastic deformation, thermal expansion, irradiated swelling and other eigenstrain strains of the pellets and the cladding, thermal creep and irradiation creep model of pellets and cladding as well. In addition, the changes in mechanical properties at different temperatures are considered.
The Young’s modulus of UO2 is related to temperature and porosity (Van Uffelen and Suzuki, 2012), which can be expressed as:
where
This paper uses the thermal expansion model recommended by FRANCO to calculate the thermal strain value of fuel pellets, as follows (Lee, 1996):
Where ε is thermal strain (%), T is the temperature of the pellet (°C);
where ρ is density of the pellet
where ρ is density of the pellet
where
For the creep behavior of the pellets, it is necessary to consider the joint effect of thermal creep and irradiation creep. The creep rate is dependent on temperature, effective stress, density, grain size, fission rate, and the O/M ratio (1.998). The model used in MATPRO is as follows (Siefken et al., 2001):
where
In the above relationship,
For Zircaloy-4, the FRANCO program (Lee, 1996) uses the following formula to calculate the Young’s modulus:
where
The thermal expansion of cladding relative to 20°C can be expressed as:
where
The cladding will also undergo thermal creep and irradiation creep under high temperature and irradiation conditions, Hayes and Kassner investigated the secondary thermal creep of zirconium alloy which was also used in the BISON code (Hales et al., 2013), as shown as:
where
For irradiation creep, the Anderson creep model is available, and irradiation creep strain rate can be expressed as (Hales et al., 2013):
where
where T is temperature (K).
In this paper, the penalty function method is used to determine the contact, and the non-slip contact model is used (In reality, the pellet may slip over the cladding. In this paper, the edges of MPS are sharper and the radial displacement is larger than normal area. Considering the pinning effect of MPS defects, the non-slip boundary condition is used. Overall, the non-slip boundary conditions are a rigid assumption, based on which the circumferential stress of the cladding will be greater), which is already included in the MOOSE framework.
Cavity Pressure Models
The change of the fission gas content in the gas cavity will cause the pressure of the gas cavity to change. The composition of the mixed gas in the gas cavity and the pressure of the gas cavity will affect the heat transfer between the pellet and the cladding. In addition, the pressure change will affect the deformation of the pellet and the cladding, and changes the size of the gap between pellet and cladding, which will affect the gap heat transfer process in turn.
This paper uses an empirical relationship to simulate the generation and release process of fission gas, if 0.31 gas atoms are produced per fission, the amount of gas produced can be expressed as follows:
where
where
In this paper, the Ideal Gas Law is used to calculate the gas cavity pressure. The volume of the gas cavity includes: 1) the volume of the plenum at the top of the fuel rod, 2) the volume of the gap between the pellet and the cladding, 3) the volume of the gap between two adjacent pellets.
Stress Corrosion Cracking Model
As early as the 1960s, the Stress Corrosion Cracking (SCC) phenomenon was found in Zr-based alloys (Miller et al., 1981). In the 1970s, it had become the main cause of CANDU and BWR cladding failures (Iaea, 2010). Research on the behavior of SCC is mostly based on experimental methods (Wood, 1972), and the specific situation of SCC in zirconium alloy tubes under iodine corrosive environment has been studied. However, for the behavior in the reactor, it is difficult to describe the concentration of iodine accurately. Some scientists believe that when the temperature of the reactor rises, the iodide will decompose and a large amount of iodine will be released into the gas gap, which is a possible cause of the rupture of the cladding tube due to SCC in the case of power increase. In addition, some researchers believe that the cracking of the cladding is related to the hydride contained in the cladding matrix material (Tests, 2004), and that there is a hydride at the crack tip. The difference between the above two viewpoints lies in the circumstances of the cladding and the formation process of the initial crack source. In addition, the rupture of the cladding has an important relationship with the stress on the cladding tube. Figure 3 is the schematic diagram of the cladding cracking from reference (Baron and Hallstadius, 2012).
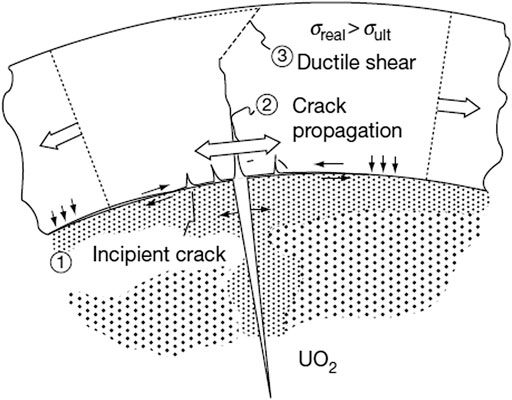
FIGURE 3. Schematic diagram of cladding stress corrosion cracking (Baron and Hallstadius, 2012).
For the cladding corrosion cracking process, the crack growth rate is a power function of the stress field intensity factor (Van Uffelen and Suzuki, 2012). In this paper, the Kreyns model was used and it can be expressed as (Kreyns et al., 1975):
where a is the length (depth) of the crack (inch), t is time (min), T is the temperature (K),
where
where c is the half length of the surface crack, and F (a,c,t,R) is the shape correction function and can be expressed as:
where
where
Validation
In order to test the accuracy of the selected model and the correctness of the modeling process, program validation has been done in this paper. Based on the models shown in Modeling Description, the program was developed based on the In order to test the accuracy of the selected model and the correctness of the modeling process, validation has been done in this paper. MOOSE platform and the program was validated by the experimental data of Halden reactor IFA-432r1 (Bradley et al., 1981a) 513r6 (Bradley et al., 1981b). IFA-432r1 and 513r6 are the two fuel rods used in the long-term steady-state irradiation experiment conducted in the Halden reactor. When modeling these experiments, considering the axial symmetry of the fuel rod, a two-dimensional axisymmetric finite element model was established, as shown in Figure 4, and the specific model parameters are shown in Table 3. The power of IFA-432r1 and 513r6 rods are shown in Figure 5.
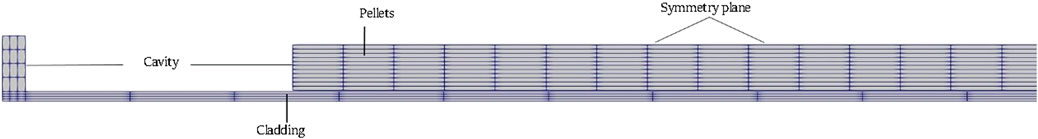
FIGURE 4. Two-dimensional axisymmetric model.
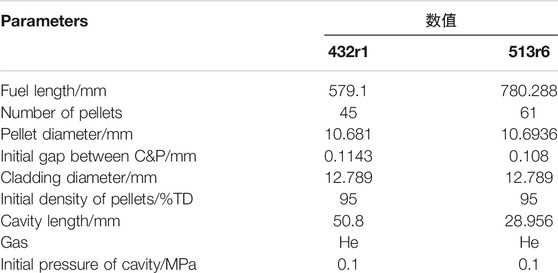
TABLE 3. Experimental model parameters of the IFA-432r1、513r6.
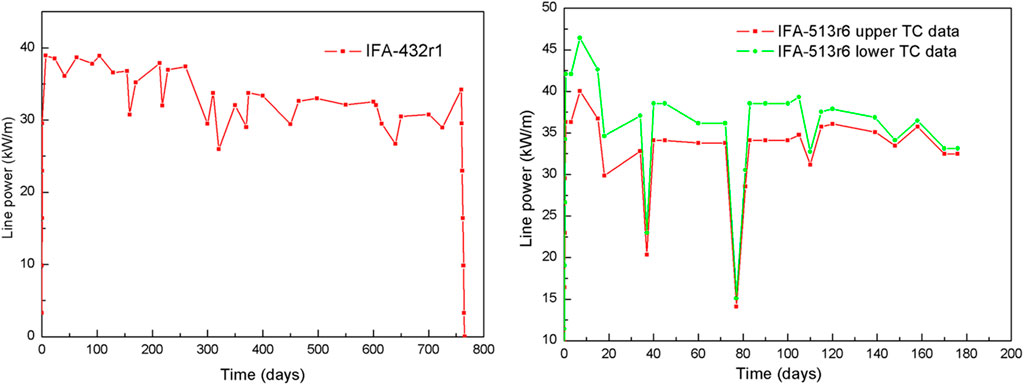
FIGURE 5. Variation of IFA-432r1 and IFA-513r6 power with time.
In this paper, simulation of IFA-432r1 and 513r6 rods were conducted and we compared the calculation results with the experimental data and the result of FRAPCON-4.0 under the same input. The comparison results are shown in Figures 6, 7.
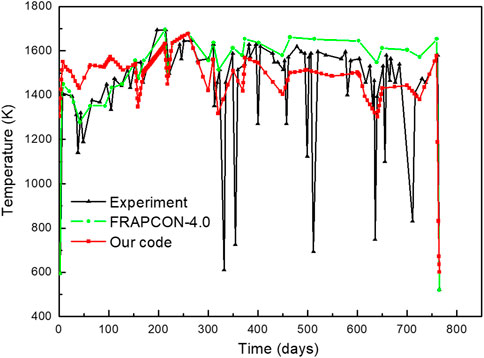
FIGURE 6. Experimental measured and predicted centerline temperature for 432r1.
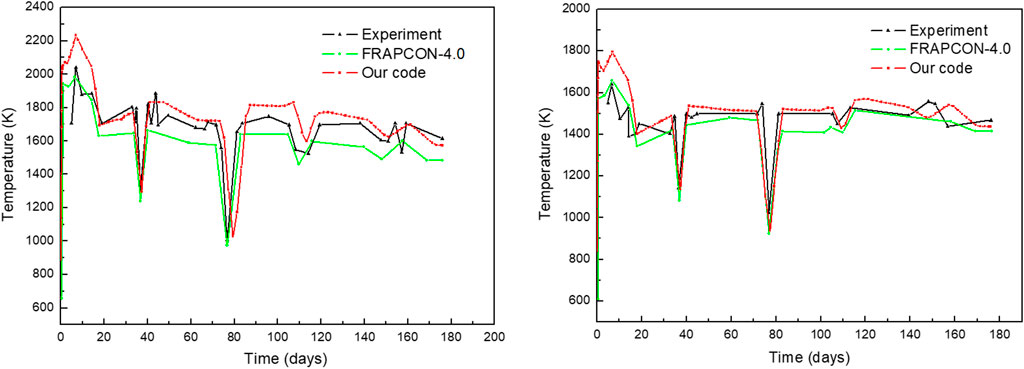
FIGURE 7. Experimental measured and predicted temperature at the upper end of the centerline (left), and temperature at the lower end of the centerline (right) for 513r6.
From the comparison results of IFA-432r1 rod, as shown in Figure 6, it can be seen that the distribution of experimental measured values matched calculated simulation values in 200–800 days to a reasonable extent, and the calculated values of the program in 0–200 days are higher than the experimental values and FRAPCON calculated values. The possible reason is that, during the start-up process the simulation of fuel densification and fission gas release behavior is not accurate enough (FRAPCON fission gas release model is more complicated and closer to the experiment), and the model may need to be further refined. From the comparison results of the 513r6 rod, as shown in Figure 7, it can be seen that during the entire 180-days operating life, the program simulation value is basically the same as the experimental value and the FRAPCON value, and for the transient behavior of the reactor, the performance analysis program developed in this paper has good analysis capabilities as well. Based on the comparative verification of rods IFA-432r1 and 513r6, it can be seen that the program developed in this paper has the ability to analyze the thermal-mechanical coupled behaviors of the fuel rod under irradiation conditions.
Simulation Results
In order to intuitively describe the temperature, stress and other parameter distribution of the pellet and cladding, several special points need to be selected on the geometric model, as shown in Figure 8. Points A and B are located on the surface of the MPS defect, and points D and E on the cladding surface are adjacent points of positions A and B. Points C and H are the points on the intact pellets, which are used to compare with the points on the surface of MPS pellet. Figure 9 gives a summary results of burnup distribution at point G along the full irradiation history.
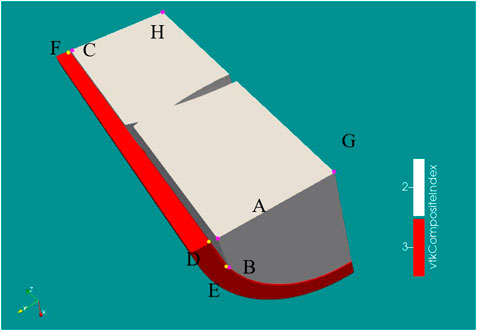
FIGURE 8. Schematic diagram of fuel rod data extraction points.
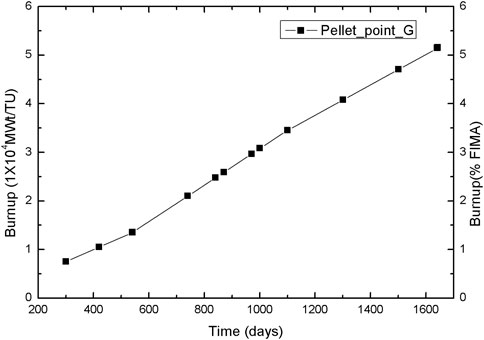
FIGURE 9. Burnup distribution at point G in full irradiation history.
Figure 10 shows the temperature distribution of fuel rod and cladding at the initial 540 days of reactor operation and at 1,643 days at the end of the ramp event. It can be observed that, MPS defect has different effects on temperature distribution when the reactor operation is at different stage. During the initial operation in Figures 10A,B, the pellet and the cladding have not yet come into contact. Because of the MPS defect, the thermal resistance of the gas layer in the MPS position is greater than that in the normal position, so the pellet temperature with the MPS defect is higher than that in the normal pellets, which makes the MPS containing pellet exhibit more intense thermal expansion and swelling behavior, and the size of the gap adjacent to the MPS defect (especially point D) is smaller than the gap size at point C. As a result, the cladding temperature at point D opposite to the MPS defect is lower than the surface temperature of the cladding at point F, and the cladding temperature at point E adjacent to the MPS defect is higher than the normal cladding inner surface temperature.
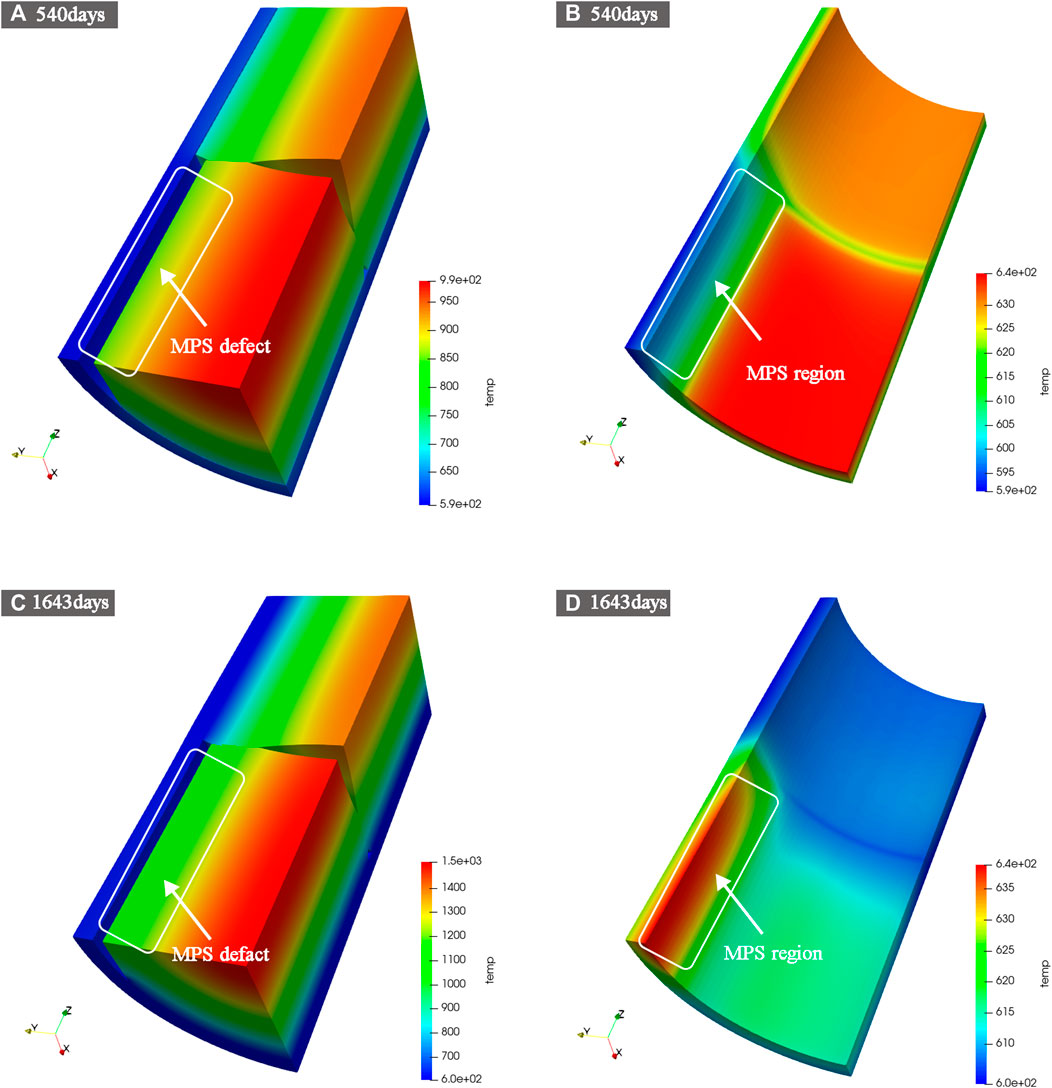
FIGURE 10. The temperature distribution of fuel rod and cladding at the initial 540 days of reactor operation life and at 1,643 days the end of ramp test.
At the end of the ramp event, as shown in Figures 10C,D, the pellet and the cladding were already in contact. The thermal resistance of the gas layer at the contact position is relatively small, so the temperature of the pellet and the cladding is low at the contact position. In the MPS defect position, the pellet and the cladding are not in contact, so the temperature is higher.
The more detailed temperature distributions are shown in Figure 11. Affected by the MPS defect, the center temperature of pellet with MPS defect is about 40 K higher than the center temperature of the normal pellet. Because of the increases of gap width, the temperature of point A is higher than the temperature of point B, and it is higher than the temperature of point C throughout the lifetime. It is worth mentioning that the temperature difference between point B and point C is different before and after the pellet contacts the cladding. At the initial stage of reactor operation, the temperature of cladding points F is higher than the temperature of point E and then this relationship reverses after fuel-cladding contact.
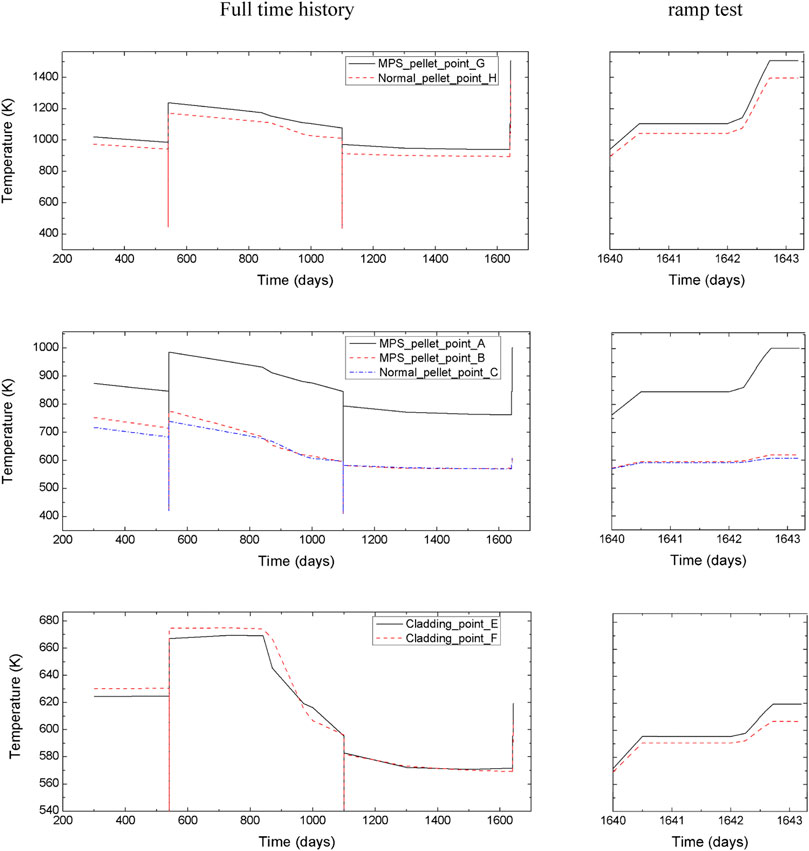
FIGURE 11. Time history of temperature at pre-set points showing a comparative way with MPS defects and no defect pellet.
In this work, the effects of changes in gap size and gas cavity pressure between the out surface of pellet and the inner surface of cladding on the temperature distribution were studied in details. Taking the operation time 800 days temperature distribution for comparison, when the gap size changes, the center line temperature of pellet is about 50 K lower than the case when the gap size is set to constant, and about 50 K higher than the case when the gas cavity pressure is set to 3.3Mpa. Therefore, it is necessary to consider the deformation of the pellet and the cladding and the change of the gas cavity pressure in the model.
As seen in Figure 12, the radial displacement distribution of the fuel rod and cladding at different stage varies greatly. During normal operation, the pellet and cladding did not come into contact at 300 days, and the temperature of the cladding adjacent to the MPS defect was relatively low, resulting in a large Young’s modulus and therefore a small deformation shown in Figures 12A,B. When the pellet and cladding just come into contact at 970 days, the cladding adjacent to the MPS defect continued to deform inward due to external pressure, as shown in.
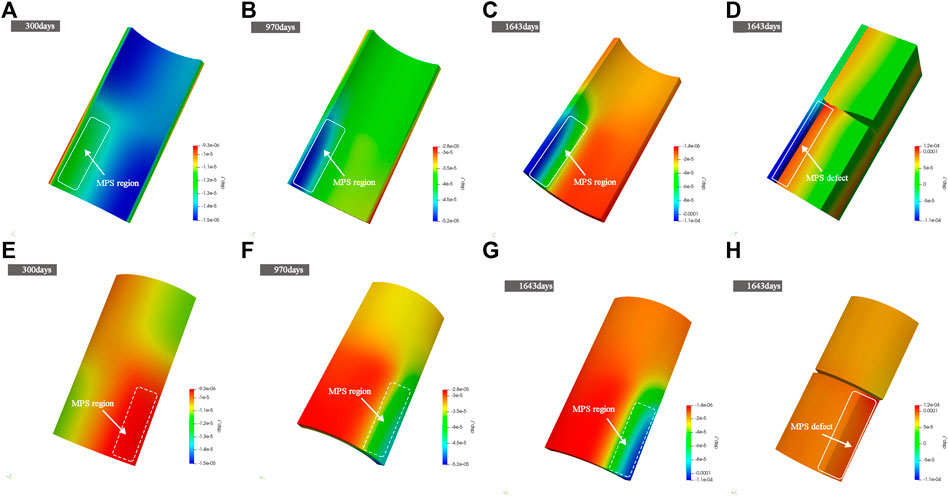
FIGURE 12. The radial displacement distribution on cladding inner surface (A–C), outer surface (E–G), fuel rod(d) and pellets surface(h) in different operating stage.
Figures 12B,F. At the end of the ramp test, the pellet and cladding have come into close contact at 1,643 days, and the deformation of the cladding adjacent to the MPS defect is more serious, as shown in Figures 12C,G. During the whole operation time, the pellet with MPS defect has a larger radial displacement than its counterpart without the MPS defect.
The more detailed radial displacement distribution are shown in Figure 13. During the full irradiation history, the pellet continues to deform outwards. Because the temperature at point A is higher than those at point B and C, the radial displacement at point A is greater than the radial displacement at point B and C, and the difference in displacement distribution between points B and C can be explained in the same way. Prior to contact, the displacement distribution at cladding points D, E, and F is basically the same. After the pellet and cladding come into contact, the cladding at point D continues to move inward due to the lack of support from the inside, and point F is pressed out by the pellet and moves outward. It is important that, during the early stage of contact, the cladding at point E slips and deforms towards the MPS defect (the cladding at point E is thinner than the cladding at point D), so it moves inward slightly, and in the later stage of contact, it is pressed by the pellet and moves outward.
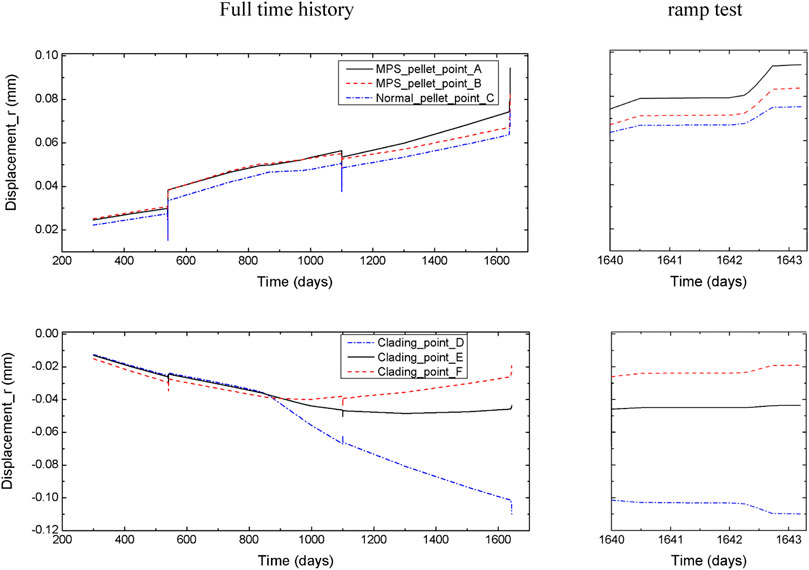
FIGURE 13. Radial displacement distribution in full irradiation history at pre-set points showing a comparative way with MPS defects and no defect pellet.
The Hoop stress and Von Mises stress distributions are shown in Figure 14. Before the pellet and cladding come into contact, there is no stress concentration, and the difference of the stress comes from the thermal stress because of the temperature gradient. After contact, there is a high circumferential tensile stress on the inner surface of the cladding opposite to the MPS defect center and a circumferential compressive stress on the inner surface of the cladding at the adjacent position, and the circumferential stress is reversed on the outer surface of the cladding, turning into a compressive stress, as shown in Figures 14A,B. As seen in Figure 14C, the Hoop stress on the outer surface of the pellet in the defect area is relatively high, and the Von Mises stress is also high in this area, as shown in Figure 14F. This indicates that the pellet with the MPS defect is more prone to cracking. At 1,643 days, during the ramp event, the stress of the cladding is much higher than that during normal operation at 1,100 days, the distribution of stress has also changed, as shown in Figures 14D,E. During high power stage, the impact of the MPS defect on the distribution of stress is more intensive.
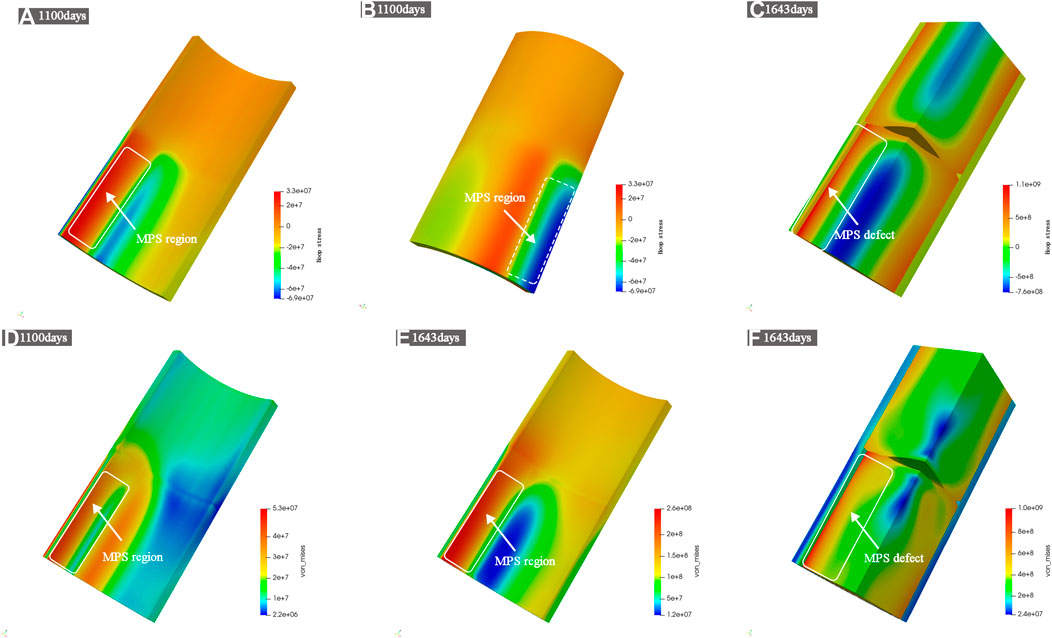
FIGURE 14. The hoop stress distribution (A–C) and Von_mises stress distribution (D–F) in 1100 and 1643 days.
The more detailed stress distributions are shown in Figure 15. During two shutdowns and refueling, the Von Mises stress of the pellet increased sharply due to the thermal stress caused by the temperature rise. During the ramp event, the power of the pellet increased significantly, and the stress level also increased sharply. In addition, during the high-power stage, the stress relaxation caused by creep is more significant. During the whole operation period, the Von mises stress at point D is higher than those at points E and F, and the structure near point D is more prone to plastic deformation. After contact, the hoop stress at point D is much higher than those at points E and F, which indicates that the inner surface of the cladding opposite to the MPS defect center is more prone to SCC.
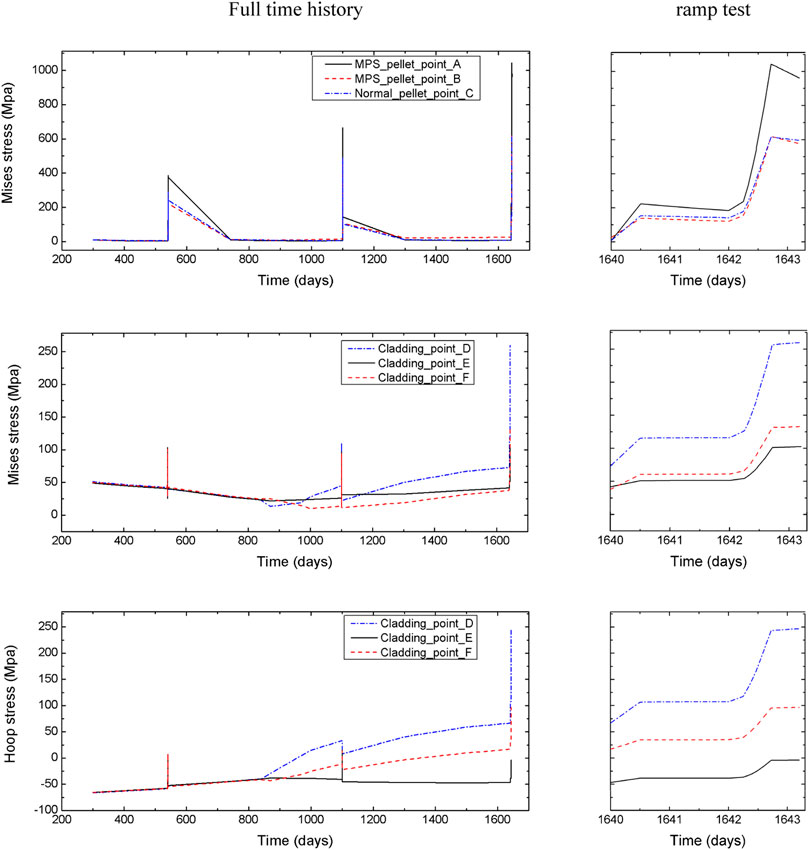
FIGURE 15. Von Mises and hoop stress distribution in full irradiation history at pre-set points.
Figure 16 shows the contact pressure distribution between pellet and cladding at 1,100 days and at 1,643 days. It exhibits that the contact pressure during the ramp test is about twice that at the normal operating conditions. Moreover, at the MPS defect location, the cladding deformed inward, causing the contact pressure between adjacent pellet and cladding to be concentrated. By comparing the contact pressure at point E and point F, it can be found that the contact pressure at point F is greater than the contact pressure at point E in the early stage of contact, and there is a flip of this relationship at the later stage of contact, as shown in Figure 17.
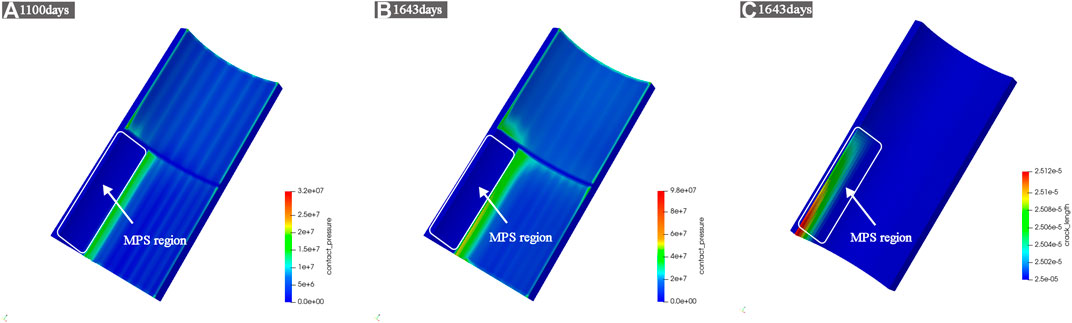
FIGURE 16. Contact pressure distribution in 1100 days (A), in 1643 days (B) and crack length distribution in 1643 days (C).
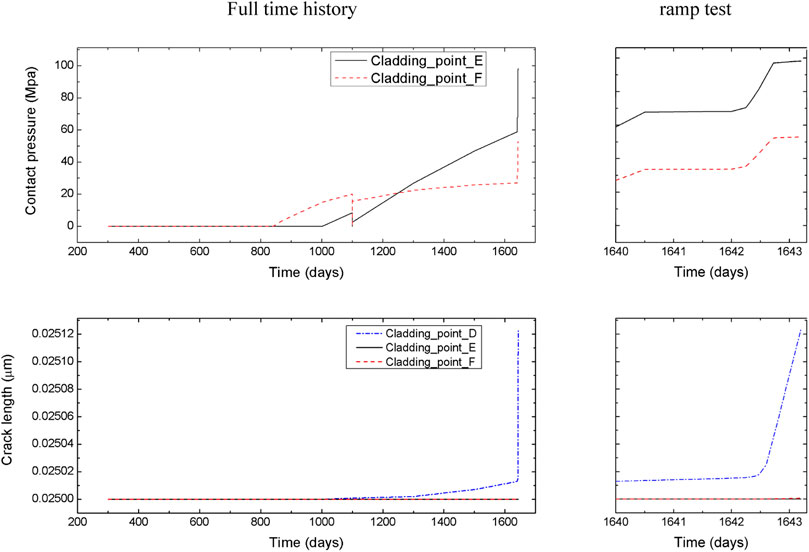
FIGURE 17. Contact pressure and crack length distribution in full irradiation history at pre-set points.
Figure 16C gives a summary of results of crack length (depth) distribution at the end of the ramp event. The crack length reached the maximum value at the inner surface of the cladding opposite to the MPS defect center. It can be seen from Figure 17 that the cracks at point E and point F basically did not propagate. During the ramp event, the crack propagation rate at point D rose sharply, which indicated that the cladding tube was easily damaged in the high temperature and high stress operation stage. It is worth mentioning that the SCC model used in this paper is an out-of-pile model, which does not consider the effects of complex behaviors under irradiation. This paper has not considered the pinning and tearing effects of the pellet tip crack on the inner surface of the cladding, so the prediction of crack propagation is still relatively reserved.
Conclusion
In this study, a 3D fuel performance analysis program has been developed based on the MOOSE framework. The code is able to simulate the thermodynamic behavior of fuel rods under steady-state and accident conditions with 2D and 3D geometries. The program has taken fission products swelling, densification and expansion of pellet, thermal and irradiation creep, gap heat transfer, fission gas release, and cladding crack propagation into consideration, detailed fuel behaviors can be simulated in this multiphysics coupling way. The influence of MPS has been described in detail, and the following conclusions can be drawn:
1) The impact of MPS on fuel performance is different before and after the pellet and cladding contact. From the analysis of the thermodynamic behavior of the fuel rod, the impact is greater at the later stage of the contact.
2) The temperature of pellet with the MPS defect is higher than the intact pellet, which makes the expansion and swelling of the MPS containing pellet more significant, causing the pellets to contact the cladding earlier. Because of the MPS defect, the cladding lacks internal support after contact, so the contact pressure between pellet and cladding became concentrated in the adjacent position of the MPS defect center.
3) After in contact, the MPS defect caused a large circumferential tensile stress on the inner surface of the cladding opposite to the MPS defect center, where the cladding crack propagation rate was much higher than those at other locations.
4) Due to SCC, short time power-up events such as ramp events will greatly increase the crack propagation. In severe cases, the integrity of the cladding will be damaged, leading to leakage of radioactive materials.
The main purpose of the current work is to accurately simulate the three-dimensional thermodynamic behavior of fuel rods. This paper demonstrates the good performance of the program by analyzing the influence of MPS defects on fuel performance under accident conditions. In the simulation of SCC behavior, the model used in this paper does not consider the influence of gas corrosion behavior in the gas cavity on the crack propagation of the cladding, so the simulation results are still conservative. In addition, this paper does not consider the influence of different shapes of MPS defects on fuel performance, if interested, check in Nathan Capps’ research (Capps et al., 2016). When the edge of the defect is sharper, the threat of the defect to the integrity of the cladding may be greater. Based on the results of modeling and analysis of MPS defects in the article, this paper recommends that the fuel rods be inspected after the pellets are installed to avoid the failure of the cladding tube due to MPS defects when the reactor power rises under high burnup conditions.
Data Availability Statement
The original contributions presented in the study are included in the article/Supplementary Material, further inquiries can be directed to the corresponding author.
Author Contributions
I hereby provide the following statement on the role of each author and confirm that all details provided here are truthful. XZ: Conceptualization, Methodology, Investigation, Writing – Original Draft ZW: Investigation XY: Methodology, Investigation WL: Conceptualization, Methodology DeY: Conceptualization, Writing – Review and Editing, Funding acquisition DiY: Conceptualization, Methodology, Writing – Review and Editing With Regards, DiY.
Funding
Funding support by State Key Research and Development Program of China, Grant No. 2018YFB1900405, is acknowledged.
Conflict of Interest
DY was employed by China Nuclear Power Technology Research Institute Co., Ltd.
The remaining authors declare that the research was conducted in the absence of any commercial or financial relationships that could be construed as a potential conflict of interest.
Publisher’s Note
All claims expressed in this article are solely those of the authors and do not necessarily represent those of their affiliated organizations, or those of the publisher, the editors and the reviewers. Any product that may be evaluated in this article, or claim that may be made by its manufacturer, is not guaranteed or endorsed by the publisher.
Acknowledgments
This code is based on the open source MOOSE finite element framework developed by Idaho National Laboratory in the United States.
References
Anderson, T. L. (1995). Fracture Mechanics: Fundamentals and Applications. 2nd Ed. Boca Raton: CRC Press, 636.
Baron, D. D., and Hallstadius, L. (2012). Fuel Performance of Light Water Reactors (Uranium Oxide and MOX). Compre. Nucl. Mater. 2, 481–514. doi:10.1016/b978-0-08-056033-5.00040-9
Bentejac, F., Bourreau, S., Brochard, J., Hourdequin, N., and Lansiart, S. Fuel Rod Modelling during Transients: The Toutatis Code. France: CEA.
Bernd, G. A., Beyer, C. E., Davis, K. L., and Lanning, D. D. (1997). FRAPCON-3: A Computer Code for the Calculation of Steady-State, Thermal-Mechanical Behavior of Oxide Fuel Rods for High Burnup. United States: Pacific Northwest National Laboratory; Idaho National Engineering and Environmental Laboratory.
Bradley, E. R., Cunningham, M. E., Daniel, J. L., Davis, N. C., Lanning, D. D., and Williford, R. E. (1981). Data Report for the Instrumented Fuel Assembly IFA-513. United States: Office of entific & Technical Information Technical Reports.
Bradley, E. R., Cunningham, M. E., Lanning, D. D., and Williford, R. E. (1981). Data Report for the NRC/PNL Halden Assembly IFA-432: April 1978-May 1980. United States: Office of Scientific & Technical Information Technical Reports.
Capps, N., Liu, W., and Montgomery, R. (2015). Demonstrate 3D PCI Analysis with BISON- CASL for PCI Fuel Failure in a Commercial Power Reactor. Knoxville: University of Tennessee.
Capps, N., Montgomery, R., Sunderland, D., Pytel, M., and Wirth, B. D. (2016). Evaluation of Missing Pellet Surface Geometry on Cladding Stress Distribution and Magnitude. Nucl. Eng. Des. 305, 51–63. doi:10.1016/j.nucengdes.2016.04.039
Cox, B. (1990). Pellet-Cladding Interaction(PCI) Failures of Zirconium alloy Fuel Cladding -a Review. J. Nucl. Mater. 172, 249–292. doi:10.1016/0022-3115(90)90282-R
Geelhood, K., Luscher, W., Cuta, J., and Porter, I. E. (2016). FRAPTRAN–2.0 a Computer Code for the Transient Analysis of Oxide Fuel Rods. Richland, Washington: U.S. Department of Energy.
Hales, J. D., Novascone, S. R., Williamson, R. L., Spencer, B. W., Pastore, G., Liw, W., et al. (2013). BISON Theory Manual the Equations behind Nuclear Fuel Analysis. Idaho Falls, Idaho: Idaho National Laboratory.
Hetnarski, R. B., and Ignaczak, J. (1956). Mathematical Theory of Elasticity. 2nd EditionSecond Edition. New York: New York McGraw-Hill Book Company.
Iaea (2010). Review of Fuel Failures in Water Cooled Reactors. Vienna, Austria: international atomic energy agency.
Khvostov, G., Lyon, W., and Zimmermann, M. A. (2013). Application of the FALCON Code to PCI Induced Cladding Failure and the Effects of Missing Pellet Surface. Ann. Nucl. Energ. 62, 398–412. doi:10.1016/j.anucene.2013.07.002
Kreyns, P. H., Spahr, G. L., and Mccauley, J. E. (1975). An Analysis of Iodine Stress Corrosion Cracking of Zircaloy-4 Tubing. J. Nucl. Mater. 61 (1976), 203–212.
Labmann, K., and Moreno, A. (1977). The Light-Water-Reactor Versión of the URANUS Integral Fuel-Rod Code. madrid: junta de energía nuclear.
Lassmann, K., O'Carroll, C., van de Laar, J., and Ott, C. TRANSURANUS: A Fuel Rod Analysis Code Ready for Use Karlsruhe. Karlsruhe, Germany: EC JRC, Institute for Transuranium Elements, 95–101.
Lee, K. (1996). Rsicc Peripheral Shielding Routine Collection FRANCO. Tennessee: Oak Ridge National Laboratory.
Massih, A. R., Jernkvist, L. O., Lindbäck, J. E., and Zhou, G. (2005). “Analysis of Pellet-Clad Interaction of LWR Fuel Rods during Power Ramps,” in 18th International Conference on Structural Mechanics in Reactor Technology (SMiRT-18), August 7-12, 2005 Beijing, China, 461–474.
Miller, A., Ocken, H., and Tasooji, A. (1981). Iodine Stress Corrosion Cracking of Zircaloy: Laboratory Data, a Phenomenological Model, and Predictions of In-Reactor Behavior. J. Nucl. Mater. 99 (1981), 254–268. doi:10.1016/0022-3115(81)90194-x
Newman, C., Hansen, G., and Gaston, D. (2009). Three Dimensional Coupled Simulation of Thermomechanics, Heat, and Oxygen Diffusion in Nuclear Fuel Rods. J. Nucl. Mater. 392, 6–15. doi:10.1016/j.jnucmat.2009.03.035
Rashid, Y., Dunham, R., and Montgomery, R. (2004). Fuel Analysis and Licensing Code: FALCON MOD01. San Diego, California: EPRI.
Rong, L., and Zhou, W. (2016). CAMPUS: Fully Coupled Multiphysics Modeling and Simulation of LWR and FBR Nuclear Fuel Behavior. Transactions of the American Nuclear Society.
Siefken, L. J., Coryell, E. W., Harvego, E. A., and Hohorst, J. K. (2001). SCDAP/RELAP5/MOD 3.3 Code Manual. Idaho Falls, Idaho: Idaho National Engineering and Environmental Laboratory.
Spencer, B. W., Hales, J. D., Novascone, S. R., and Williamson, R. L. (2012). 3D Simulation of Missing Pellet Surface Defects in Light Water Reactor Fuel Rods: Fuels Modeling and Simulation Department. Idaho Falls, Idaho: Idaho National Laboratory.
Spencer, B. W., Williamson, R. L., Stafford, D. S., Novascone, S. R., Hales, J. D., and Pastore, G. (2016). 3D Modeling of Missing Pellet Surface Defects in BWR Fuel. Nucl. Eng. Des. 307 (2016), 155–171. doi:10.1016/j.nucengdes.2016.07.008
Tang, C., Jiao, Y., Li, W., Qing, T., Miao, Y., and Chen, P. (2016). “Numerical Simulation of Different Sizes Missing Pellet Surface Effects on thermal-mechanical Behaviors in Nuclear Fuel Rods,” in 2016 24th International Conference on Nuclear Engineering, June 26-30-2016 (North Carolina: Charlotte). doi:10.1115/ICONE24-60116
Tests, A. M. A. F. (2004). A Metallographic and Fractographic Study of Outside-In Cracking Caused by Power Ramp Tests. J. Nucl. Mater. 327 (2004), 97–113.
Van Uffelen, P., and Suzuki, M. (2012). Oxide Fuel Performance Modeling and Simulations. Compre. Nucl. Mater. 3, 535–577. doi:10.1016/b978-0-08-056033-5.00071-9
Van Uffelen, P., Hales, J., Li, W., Rossiter, G., and Williamson, R. (2019). A Review of Fuel Performance Modelling. J. Nucl. Mater. 516 (2019), 373–412. doi:10.1016/j.jnucmat.2018.12.037
Williamson, R. L. (2011). Enhancing the ABAQUS Thermomechanics Code to Simulate Multipellet Steady and Transient LWR Fuel Rod Behavior. J. Nucl. Mater. 415 (2011), 74–83. doi:10.1016/j.jnucmat.2011.05.044
Williamson, R. L., Hales, J. D., Novascone, S. R., Tonks, M. R., Gaston, D. R., Permann, C. J., et al. (2012). Multidimensional Multiphysics Simulation of Nuclear Fuel Behavior. J. Nucl. Mater. 423 (2012), 149–163. doi:10.1016/j.jnucmat.2012.01.012
Williamson, R. L., Capps, N. A., Liu, W., Rashid, Y. R., and Wirth, B. D. (2016). Multi-Dimensional Simulation of LWR Fuel Behavior in the BISON Fuel Performance Code. Jom 68 (11), 2930–2937. doi:10.1007/s11837-016-2115-7
Wood, J. C. (1972). Factors Affecting Stress Corrosion Cracking of Zircaloy in Iodine Vapour. J. Nucl. Mater. 45 (1972/73), 105–122. doi:10.1016/0022-3115(72)90178-x
Yu, Pingan., and Zhu, Ruian. (1986). Nuclear Reactor thermal Analysis. Shanghai, China: Atomic Energy Press.
Zhu, W., Chungyu, Z., and Cenxi, Y. (2018). Multiphysics Modeling of Pressurized Water Reactor Fuel Performance. J. Nucl. Eng. Radiat. Sci. 4 (3), 031008. doi:10.1115/1.4039848
Keywords: pellet cladding interaction (PCI), missing pellet surface (MPS), Stress Corrosion Cracking (SCC), thermal-mechanical behavior, nuclear fuels
Citation: Zhang X, Wang Z, XI Y, Liu W, Deng Y and Yun D (2021) 3-Dimensional Multiphysics Modeling of Behaviors of Pressurized Water Reactor Fuel Rods With Missing Pellet Surface. Front. Energy Res. 9:738084. doi: 10.3389/fenrg.2021.738084
Received: 08 July 2021; Accepted: 02 September 2021;
Published: 21 September 2021.
Edited by:
Wenzhong Zhou, Sun Yat-sen University, ChinaReviewed by:
Luteng Zhang, Chongqing University, ChinaZhang Chunyu, Sun Yat-sen University, China
Yang Ding, Shanghai Nuclear Engineering Research and Design Institute, China
Copyright © 2021 Zhang, Wang, XI, Liu, Deng and Yun. This is an open-access article distributed under the terms of the Creative Commons Attribution License (CC BY). The use, distribution or reproduction in other forums is permitted, provided the original author(s) and the copyright owner(s) are credited and that the original publication in this journal is cited, in accordance with accepted academic practice. No use, distribution or reproduction is permitted which does not comply with these terms.
*Correspondence: Di Yun, diyun1979@xjtu.edu.cn