Structure Optimization of Outlet Uniformity for a Comas Tower Dryer
 Hebin Liao
 Wei Zhang1
  Sebastian Borucki
 Zhixiong Li
- 1Longyan Tobacco Industry Co.Ltd, Longyan, China
- 2Institute of Electrical Power Engineering and Renewable Energy, Opole University of Technology, Opole, Poland
- 3Yonsei Frontier Lab, Yonsei University, Seoul, South Korea
Tobacco drying is an important part in the whole process of cigarette production, and its quality is directly related to the quality of cigarettes. CTD (Comas Tower Dryer) is a new type of airflow dryer, which is widely used in the tobacco industry because of its high drying efficiency. In actual production, the uneven outlet of the tobacco cutter leads to a stacking phenomenon, which affects the subsequent process of production. In this paper, the distribution of the internal flow field of the drying tower was studied from the aspects of the overlap degree of the orifice plate and deformation of the top structure at the top of the drying tower to explore the way to optimize the inner flow field to lead to the uneven distribution of the outlet. The results show that the structure whose contact position between the wall and the outlet extending outward can improve the uniformity of the outlet, while the overlap degree of the orifice plate had no effect on the uniformity of the outlet.
1 Introduction
The tobacco industry has become one of the important pillar industries in China in recent years. It is of great significance in promoting the development of the national economy and has developed steadily and rapidly. With the continuous development of tobacco technology, domestic tobacco enterprises constantly update and perfect their equipment to improve the quality of the tobacco cutter. Tobacco drying is a crucial part in the whole process of tobacco production, which directly affects the taste and quality of the tobacco cutter and the benefit of enterprises. The main drying process in the tobacco industry is drum drying and airflow drying at present. With the advantage of high drying rate and short drying time, airflow drying has been more chosen by domestic tobacco industries. The CTD (Comas Tower Dryers) from the Italian company COMAS was introduced into the domestic tobacco industry because of its advantages like small footprint and low maintenance difficulty. In the actual drying process, however, the equipment has the following problems: the distribution of the tobacco cutter at the outlet is nonuniform, and the phenomenon of material blocking appears easily. Blocking materials is not conducive to the subsequent process development and unloading which not only affects the quality of cigarettes but also wastes energy. The distribution of the outlet tobacco cutter of a drying tower used is shown in Figure 1. Therefore, to study the uniformity of the tobacco cutter at the outlet is one of the preconditions to improve the quality of the tobacco cutter.
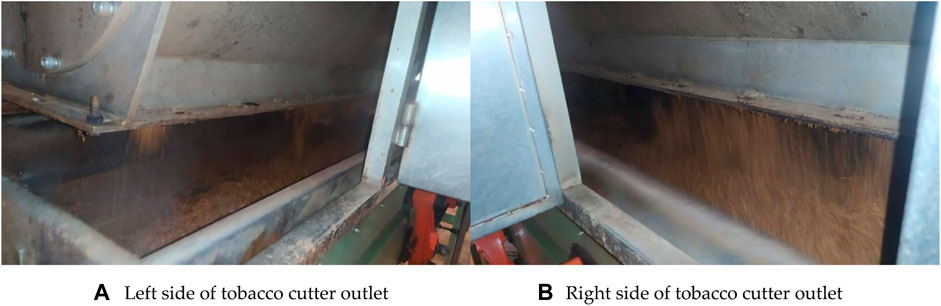
FIGURE 1. Tobacco cutter outlet.
Therefore, many scholars have invested a lot of resources and energy to study the drying process of the tobacco cutter and improve its technological parameters and structure, providing ideas and a theoretical basis for further improving the outlet uniformity. In the aspect of parameter optimization, Zhou et al. (Zhou et al., 2018) proposed an MSR-RBF-ARX model for the drum tobacco dryer to simulate the drying characteristics of the tobacco particles, and simulation results showed that the phenomenon of dry ends of tobacco could be greatly reduced by the control of the input variables. Poós et al. (Poós and Örvös, 2012) established a mathematical model and volumetric heat transfer coefficient to study the heat transfer characteristics in different driers, making it possible to calculate some parameters in the drying process. Bi et al. (Bi et al., 2020) proposed a new type of intelligent control system based on the PID control and concluded that the new control system could make the drying process more consistent by comparing it with the traditional control through experiments. Yi (Zhang, 2016) proposed a new dual control with the predictive PI control. Simulation experiments were used to verify the control effect, which showed that the algorithm had good control performance and can make the water content of the tobacco cutter more stable. Wu et al. (Wu et al., 2017) proposed a process control method based on the fuzzy neural network for intensive tobacco baking and verified the accuracy of the method by the production data. Bao et al. (Bao and Wang, 2016) used CFD to simulate the tobacco drying by heat pump technology and presented the data analysis. The results were consistent with the experiment data, indicating that the method can control the drying process of the porous media. Zhu et al. (Zhu et al., 2014) used the thermogravimetric analysis method to measure the thermal characteristics of flue-cured tobacco on the experimental platform of constant temperature and humidity. The results showed that the TPS method had better measurement accuracy. In addition, a prediction model of thermal conductivity of stacked tobacco was established, and the experiment showed that the model had a better prediction accuracy of thermal conductivity. Wei et al. (Wei et al., 2018) roasted the Yunyan 87 tobacco in an electric oven and measured the moisture status of tobacco leaves in the process by low-field nuclear magnetic resonance imaging technology. The experiment showed that the drying efficiency of tobacco leaves with stems was lower than that of tobacco without stems. Long et al. (Long et al., 2018) studied the physicochemical and sensory changes of middle-grade and low-grade cigarettes by the re-drying and humidification experiment and found that the SM-LTSR technology can make the middle- and high-grade cigarette better, while the SWM-HTR technology was suitable for low-grade cigarettes. Wang et al. (Wang et al., 2014) studied the effects of tobacco drying on the pyrolysis and combustion characteristics by means of experimental analysis and pointed out that the use of high temperature in the drying process could reduce harmful components in the smoke. Geng et al. (Geng et al., 2013a) studied the drying characteristics of the flexible filamentous particles in a drum and revealed the influence of variables on particle behavior such as speed, gas flow, and material flow. Gu et al. (Gu et al., 2014) simulated the heating process of a rotary dryer through experiments. A mathematical model of heat and mass transfer was established to study the influence of moisture content and humidity on flexible filamentous particles, and the results of temperature and humidity of particles under different operating conditions were obtained. Geng et al. (Geng et al., 2013b) simulated the mixing process of flexible filamentous particles in the cross section of the drum dryer and discussed the effects of the particle flying height, drum speed, and load on the overall motion. Geng et al. (Geng et al., 2011) took flexible filamentous particles as a rigid chain structure to simulate the dynamic process on the cross section of rotary dryer and discussed the influence of rotational speed and flight azimuth on the drying process. The results were in good agreement with the experimental results of video imaging under the same condition. In terms of the structural optimization, Bo (Hong, 2013) studied the principle work of airflow drying and the drying characteristics of tobacco through experiments and analyzed and proposed solutions for problems such as the blockage at the inlet and the evaluation of the oxygen content parameter. Xin (Zhang, 2018) used a prediction model of air drying by building an experimental hot air drying device. The drying process of the tobacco cutter was simulated with Fluent, and the structure of the drying machine was modified. The results showed that the effect of the drying tower was improved after the modification. Chin et al. (Chin and Law, 2014) used a two-stage drying method to dry the Ganoderma lucidum, and the results showed that compared with single-stage drying, this method had a shorter time and higher drying efficiency in the whole. It can be seen from the literature that it optimizes the drying process with the process parameters and process control methods to provide a certain guidance and theoretical basis to study the uniformity of the tobacco cutter outlet. However, very limited work considers the water uniformity at the tobacco cutter outlet during the drying process. It is crucial to study the influence factors of the uniformity of the tobacco at the outlet to optimize the structure to make the drying effect of the tobacco cutter more consistent.
In literature, the structure optimization of the drying tower is very little. The reason is that most of the drying towers used in the tobacco industry are directly introduced from the manufactures, while if changing the structure one may meet unexpected difficulties such as the production stoppage. It will cost labor and material resources if it turns out during the experiments that the structural optimization is not necessarily suitable for the dryer towers. Hence, there are few studies on whether the tower structure will influence the uniformity at the outlet. In order to address this current issue, the Fluent software (version 2020) is used in this paper to simulate the tobacco drying process from the aspects of the orifice plate dislocation and outlet reconstruction of the drying tower. The optimized structure was obtained, providing certain guidance for the improvement of the tobacco uniformity at the outlet. The structure of the drying tower is optimized to reveal the influence of the orifice plate structure change on the flow field. The change of the flow field is also analyzed by modifying the top structure of the drying tower.
2 Problem Description
2.1 CTD Structure
The basic principle of CTD is shown in Figure 2. After passing a series of auxiliary equipment, the tobacco cutter enters into the loosening device and was fully loosened by the high-frequency vibration then enters into the expansion unit with high-speed steam and hot air. The steam injection makes the tobacco cutter contact with as much amount of the steam as possible in a narrow range. On the one hand, the moisture inside the tobacco is discharged to the surface; on the other hand, the tobacco cutter can have a good deformation during the process. The tobacco cutter is pushed into the vertical drying section under the joint action of superheated steam and hot working air. Meeting with the working air mixed with the superheated steam, the moisture in the tobacco is taken by the working air, and the tobacco will move upward with the air. The dried and dehumidified tobacco cutter is separated from the air flow through the separator and begins to enter the next stage. The working air enters from the hot air inlet which can be divided into two parts. Part of the air passes through the orifice plate structure to become uniform and enters the vertical drying section through the air homogenizer. The other part is mixed with the superheated steam injected to act on the loose tobacco cutter and transport tobacco to the drying tower.
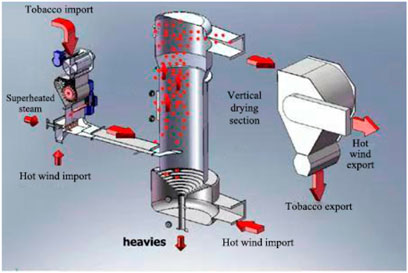
FIGURE 2. Flowchart of CTD.
2.2 Problem Description
In the actual production of the CTD drying tower, the tobacco cutter reaches the outlet after passing through the dryer and is sent out from the outlet through the transition structure. The distribution of the tobacco cutter at the outlet presents an uneven phenomenon; that means, the tobacco is less on the left side and more on the right side. Therefore, it is necessary to solve this problem because the tobacco will stack in the dryer.
From the view of the structure, there are two places that may cause the uniformity: one is the orifice plate structure and the other is the vertical upward wall at the top of the drying tower. In the CTD drying tower, the orifice plate is a double-layer structure, and the overlap degree will significantly affect the flow field in the drying tower. The upward working air near the outlet at the top of the drying tower forms resistance, resulting in nonuniformity. It should be noted that only the speed difference caused by the holes on the orifice plate is reduced. That is to say, the air at the lower/upper part of the homogenizer flows to the middle to form a hedge when meeting the circular plate and merges with the air at the lower part. If the air velocity distribution was significantly different after passing through the orifice plate, the nonuniformity still produces only the velocity gradient in the same section which is reduced after the fusion, which is beneficial to the drying process.
3 CTD Structure Optimization
3.1 Physical Model
The overall grid of the dryer is shown in Figure 3. The hexahedron is used at regular parts of the mesh model, and the tetrahedron is used in the transition part. The mesh is encrypted at the homogenizer and orifice plate for its thickness of about 3 orders of magnitude different from the size of the overall model. Three boundary conditions are included in the calculation model. The boundary conditions of the inlet consist of tobacco inlet velocity and steam inlet velocity. The outlet boundary conditions include the outlet pressure boundary conditions of the dryer. The wall boundary conditions are solid boundary conditions such as cylinder, orifice plate, and homogenizer.
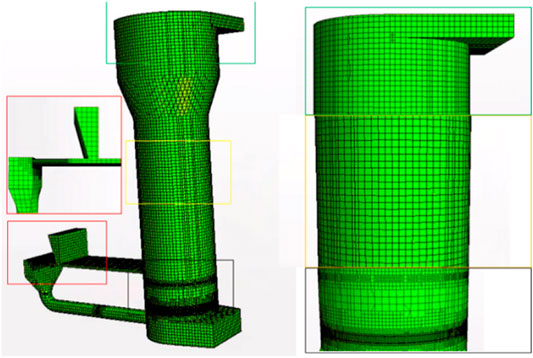
FIGURE 3. Simulation model of the CTD drying tower.
The inlet boundary is the velocity inlet, the direction is normal, and the turbulence intensity is

TABLE 1. Inlet boundary conditions.
pressure outlet is used as the overflow boundary, and the default parameters are adopted. The non-slip solid boundary condition is used when the wall is outer, and the turbulent wall function is used while the wall is nearer. The tobacco particles are based on the DPM settings. Ignoring the change of the water content, only the influence of the OPS and OS of the upper drying tower is studied during the simulation process.
Before calculation, the grid independence is verified first.
It is shown in Figure 4 that when the grid reaches 500,000, the outlet maximum error is significantly reduced, so the grid has been taken as the standard in subsequent calculations. After the grid independence verification, the simulation analysis is started.
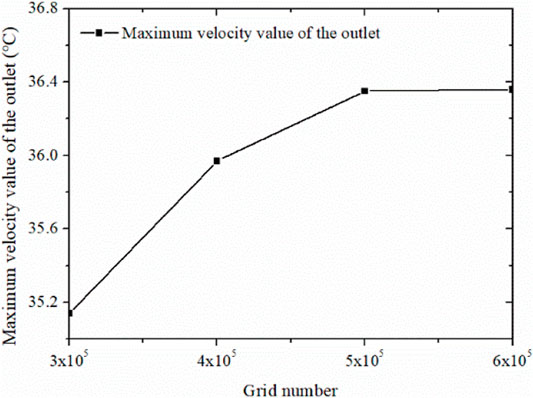
FIGURE 4. Grid independence analysis.
The optimization of the OPS is a process that the two orifice plates overlap at the beginning, then one of the orifice plates is rotated until they overlap again. Six models are designed during the process: OPS1 is the model at beginning, and the angle from the beginning to overlap again is 60°. Each model is designed with a 10° increase of the angle, and the OPS is shown in Figure 5.
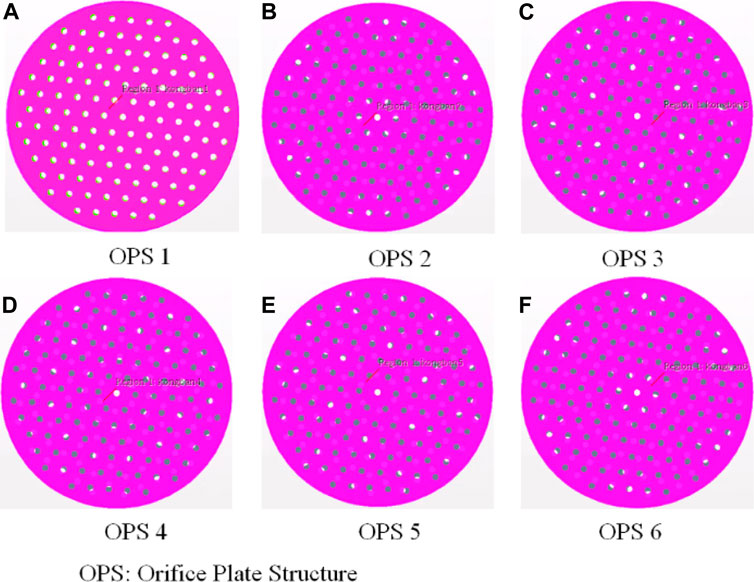
FIGURE 5. The models of six orifice plate structures.
3.2 Simulation Results of the Six OPS Models
The velocity field results of the six OPS models are shown in Figure 6. It is shown in Figure 6 that the velocity increases along the circular direction, and the lowest velocity is in the bottom of the middle part of the outlet section, while the velocity of both ends of the outlet section is larger. What is more, the largest velocity of OPS1–OPS6 is 36.35, 36.25, 36.16, 35.98, 36.09, and 36.27 m/s, respectively. The average velocity of the outlet is 28.67, 28.70, 28, 70, 28.70, 28.69, and 28.68 m/s, respectively. From the perspective of maximum and average velocity of the tobacco cutter outlet section, the OPS1 orifice plate structure has the worst performance in uniformity, while OPS4 and OPS5 have better performance. The reason is that the average velocity of the outlet section is almost the same for the six structures, but the OPS1 structure has a large velocity variance and its fluctuation is relatively larger than those of other structures.
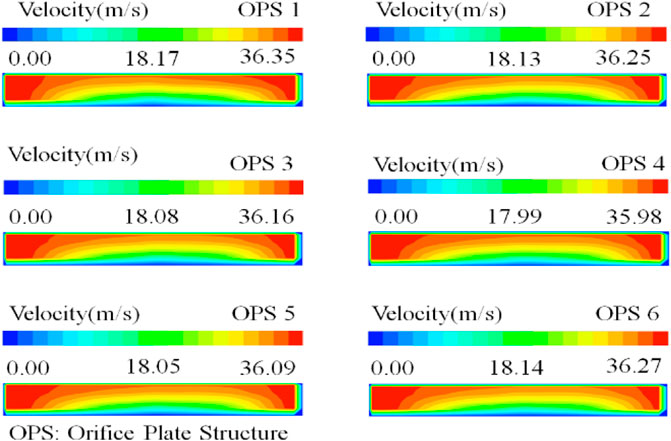
FIGURE 6. The results of the velocity field of the outlet section for six structures.
The uniformity of the tobacco cutter outlet section is affected by the mainstream field. The influence of OPS on the mainstream is shown in Figure 7, where the given section is the vertical plane passing through the center of the tobacco cutter outlet.
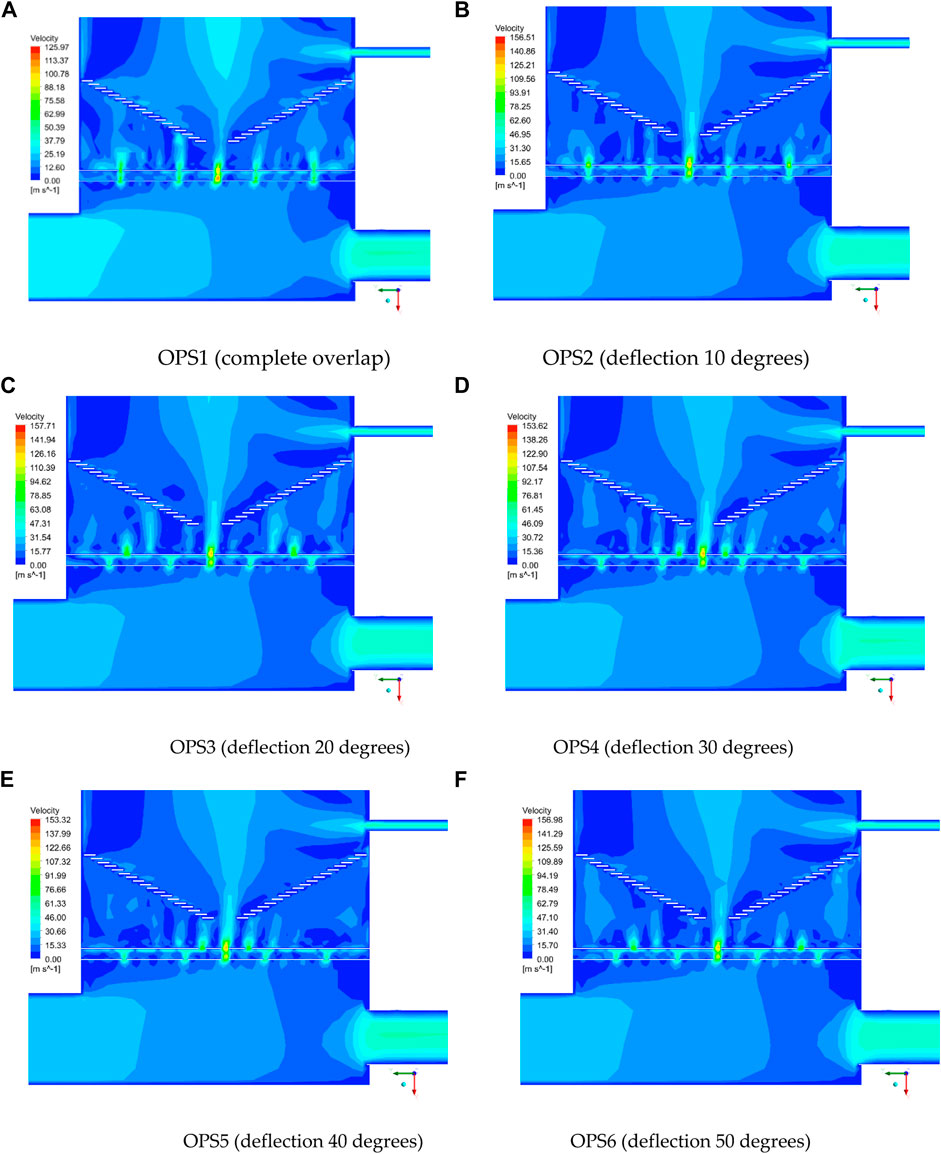
FIGURE 7. Influence of OPS on the mainstream field.
As is shown in Figure 7, the five structures from OPS2 to OPS6 have almost the same influence on the mainstream field with the maximum velocity located at the center of the overlapping hole. The maximum velocities of the five models are 156.51, 157.71, 153.62, 153.32, and 156.98 m/s, respectively. Owing to the overlapped structure, the maximum velocity of OPS1 is 125.97 m/s, which is significantly different. Considering the impact of airflow on the internal structure of the drying tower, the OPS1 structure is the best from the perspective of the global maximum speed; the others are basically the same. In addition, when the working air enters the drying tower, there is a phenomenon called the bias flow, which causes the direction of overall airflow trends to the inlet of working air.
The flow field above the orifice plate follows the fusion and diffusion law of the airflow channel. The velocity vector field after the air homogenizer is shown in Figure 8.
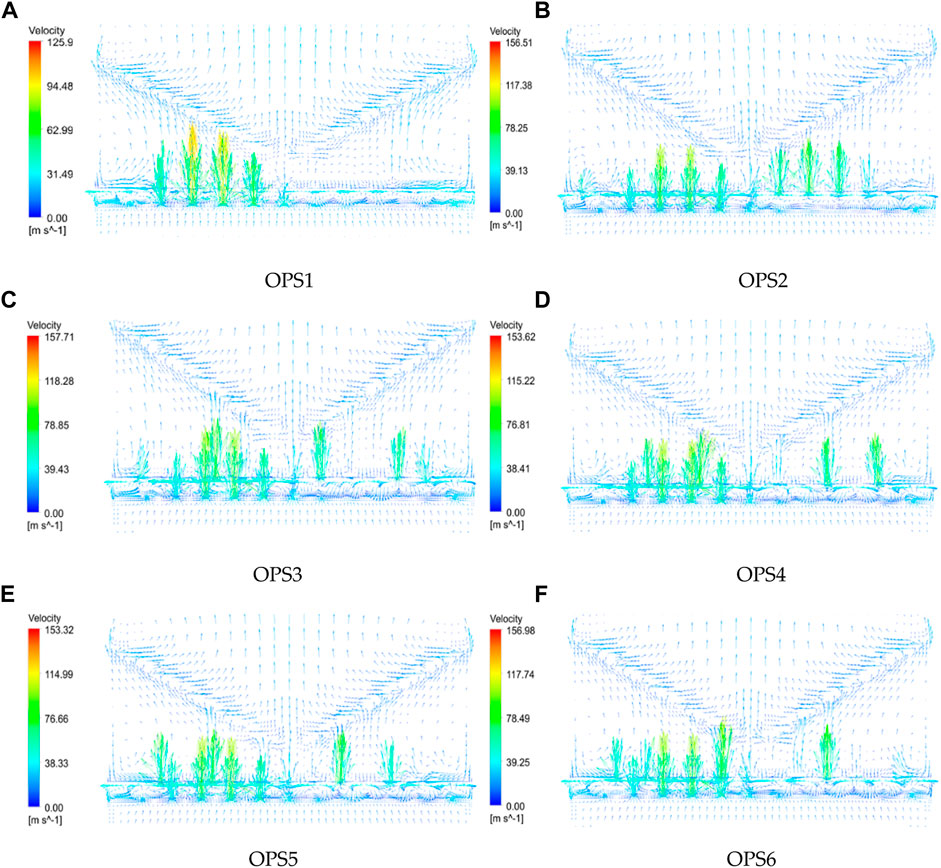
FIGURE 8. Influence of the air homogenizer on the mainstream field.
As is shown in Figure 8, the velocity vector field after the orifice plate is still different, but the changes of the flow field are basically the same after passing through the air homogenizer.
The flow field after the orifice plate and the air homogenizer goes up along the drying tower. The structure determines the flow field, and the flow field determines the final trend of the tobacco cutter particles. The trajectory results of tobacco particles with six orifice plate dislocation structures are shown in Figure 9. Among them, the particle ID just represents the number of particles, which is the serial number of particles during the process of simulation. Figure 9 shows the result of selecting one particle in every 80 tobacco particles. Different colors represent the particle trajectories of different serial numbers of the tobacco cutter. As is shown in Figure 9, after entering into the drying tower, the tobacco cutter moves with the air flow until it reaches the top and rebounds against the wall and finally flows out from the exit. During the process, some tobacco cutter particles will touch the wall of the drying tower again. The distribution on the outlet section shows an uneven phenomenon; that is, the tobacco cutter on the left is less than that on the right side. In addition, the particles on the left side of the tobacco cutter inlet moves to the outlet which shows a uniform state after passing through the flow field and the particles on the right side move to the middle and right parts of the outlet from OPS2 to OPS6, while OPS1 is just the opposite. Even though OPS1 is different from other models in particle trajectories, the whole distribution of the tobacco cutter in the outlet section of the drying tower is consistent; that is, the tobacco cutter on the middle and right sides is more than on the right side, which is still consistent with the problem described earlier. It proves that the optimization of OPS has no effect on the outlet nonuniformity, but OPS1 can significantly reduce the impact of the internal flow field on the orifice plate structure.
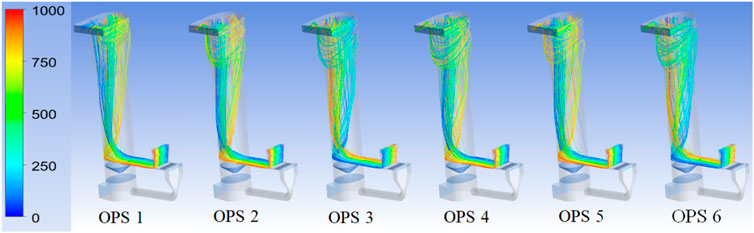
FIGURE 9. Particle trajectory of the tobacco cutter.
3.3 Structure Optimization Models
According to the simulation results of the orifice plate and the opening of the working air pipe, the optimization results are influenced by the mainstream field in the drying tower. The air homogenizer makes the flow field influenced by the orifice plate structure more uniform, which keeps the top flow field basically the same, as shown in Figures 10,11 and Figure 11.
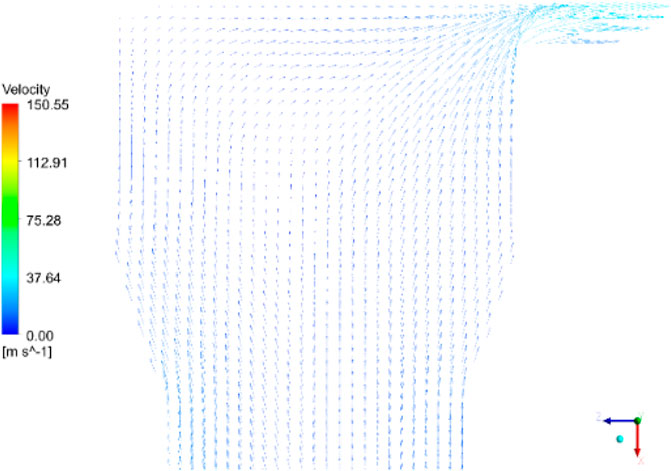
FIGURE 10. Velocity vector field of the vertical section at the top of the drying tower.
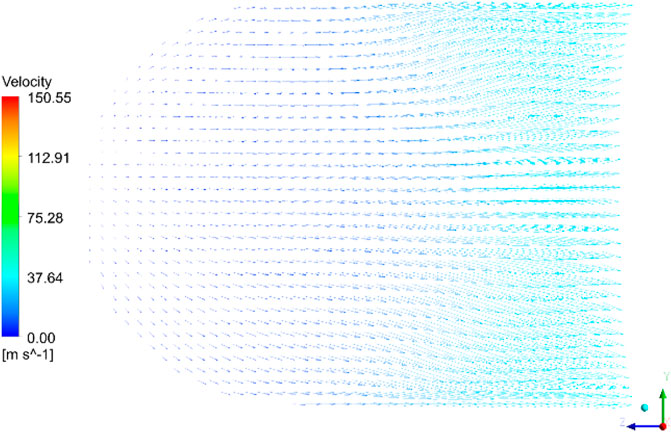
FIGURE 11. The velocity vector field of the cross section at the top of the drying tower.
It is shown in Figure 10 that the speed inside the drying cylinder is upward. Influenced by the upward velocity, the velocity toward the outlet is parabolic and the part is connected to the wall of the drying tower before the outlet. On the left side, the influence of the wall makes the working air move toward the outlet, and the upward velocity near the outlet side wall becomes the resistance, which makes the working air diffuse from the junction of the drying tower and the outlet. The velocity of the upper space of outlet is larger, while the bottom is slightly lower.
As is shown in Figure 11, influenced by the upward airflow and the wall, the velocity is from left to right. This phenomenon can be observed from the results of the tobacco particle trajectory shown in Figure 9. Then, influenced by the upward velocity at the junction of the drying tower and the outlet, the airflow moves toward both sides. Although the speed is similar, the position near the wall is the first to reach the same speed, so the tobacco cutter must be less in the middle and more on both sides. Furthermore, the velocity gradient of the upper side in the figure (right side of the exit section) is lower, which means that the velocity attenuation here is less and the transport capacity is stronger. Therefore, the tobacco at the right side of the exit section is more than that at the left side. In addition, the cross-sectional area is much larger than that of the tobacco cutter outlet and the flow is conserved, which makes the gradient of velocity near the outlet changed.
To sum up, the nonuniformity of the tobacco outlet is due to the resistance caused by the upward velocity which results from the structure of the wall and the outlet junction of the drying tower. Therefore, in this part, preliminary structural optimization is conducted to reduce upward velocity of the top structure of drying tower. Three structures are proposed, as shown in Figure 12.
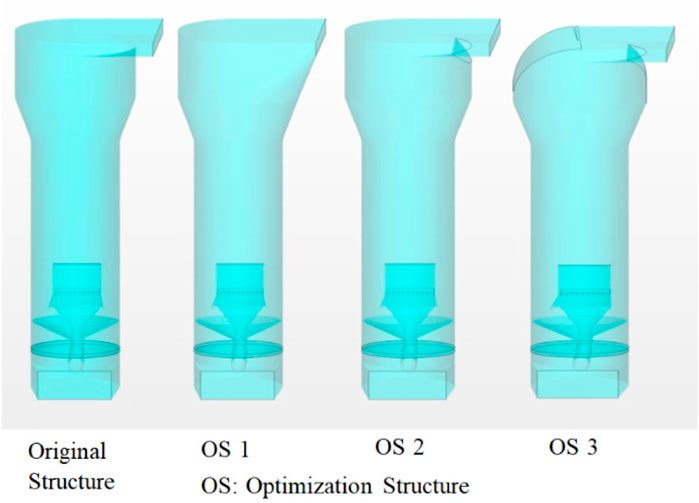
FIGURE 12. Preliminary study of structural optimization.
It is shown in Figure 12 that, compared with the top structure of the original drying tower, the change of the OS1 model is that the contact position between the wall of the drying tower and the outlet extends outward. When the field flow flows along the sloping wall, the equivalent resistance appears to the outlet section and the resistance of the upward velocity reduces to a certain extent. The change of the OS2 model is that the contact position between the wall of the drying tower and the outlet extends inward. The optimization in OS2 turns out to change the resistance of the upward velocity to disturb the top flow field of the drying tower. The air flow is regulated by the circular wall at the top of the drying tower and then passes out the outlet to weaken the resistance of the original upward velocity of the drying tower. The OS3 model changes the arc section on the left and right of the wall of the drying tower. The point is that the arc wall is more conducive to the stable flow field in the drying cylinder, which may reduce the disturbance ability in the structure (only the resistance of the upward velocity to the contact area between the wall and the outlet is reduced).
3.4 Structural Optimization Results
Based on the above structural optimization schemes, corresponding simulation analyses are carried out. The simulated boundary conditions are consistent with the orifice plate optimization conditions, and the outlet section velocity results under different structural conditions are shown in Figure 13.
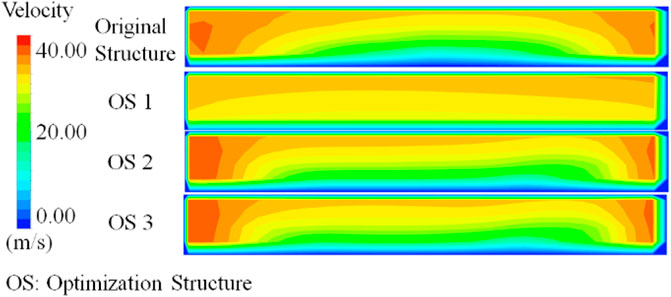
FIGURE 13. The outlet section velocity results of different OS models.
As is shown in Figure 13, the velocity fields of the original structure and OS2 and OS3 models are basically the same. The velocity is relatively large at the left and right sides of the outlet section and relatively small in the middle. Layered phenomena are presented in the top and low parts of the outlet section, and the upper part is larger and the lower part is smaller. However, OPS3 presents the overall velocity distribution. The statistics of maximum, the average, and the ratio of velocity over 30 m/s are shown in Table 2.
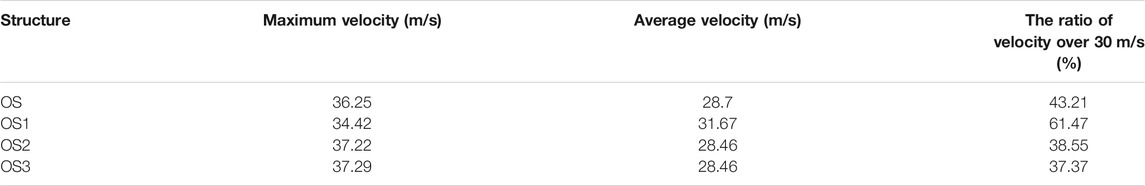
TABLE 2. The velocity results of outlet section of different structures.
As is shown in Table 2, OS3 has the maximum velocity, but the maximum of the average velocity is OS1, which means that the maximum velocity may not have the maximum average velocity because the velocity gradient is too large and the distribution is nonuniform. In addition, the maximum velocity of OS1 is 34.42 m/s and the average velocity is 31.67 m/s, which means that the outlet section distribution of OS1 is more uniform. The ratio of velocity over 30 m/s is about 61.47% which can also prove the inference. The proportion results of different velocity ranges of different models are shown in Table 3.
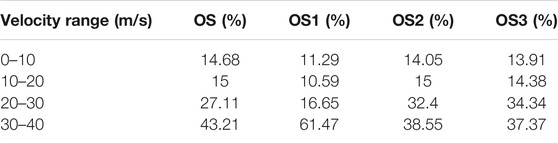
TABLE 3. Statistical results of proportion of velocity ranges of different structures at outlet section.
As is shown in Table 3, the proportions of different structures in the low-speed range are basically similar, and OS1 mainly concentrated in the range of 30–40 m/s, while the proportion of the OS gradually increased with the increase in velocity. OS2 and OS3 mainly concentrated in the range of 20–40 m/s, and the proportions are similar, which prove that OS2 can improve the uniformity of the cut tobacco at the outlet. It should be noted that the velocity of the right side is larger than that of the left side can only be seen in OS2 from Figure 13, which is slightly consistent with the cut tobacco bias phenomenon encountered in actual production. The other models have not yet shown this phenomenon, which is because the velocity result of the outlet section is two-dimensional. The cut tobacco bias phenomenon can be clearly seen from the particle trajectory results, as shown in Figure 14.
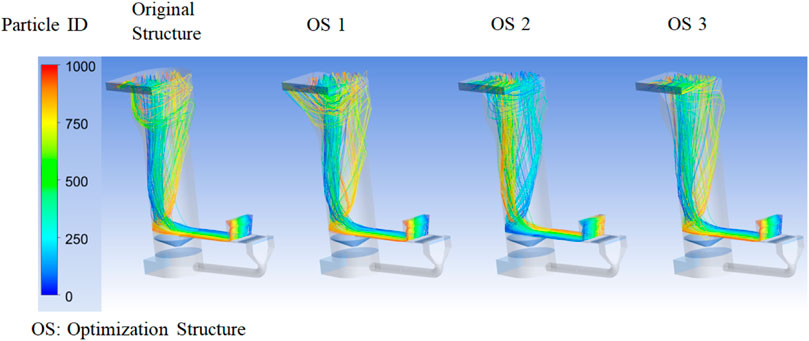
FIGURE 14. Particle trajectories of different OS structures.
It is shown in Figure 14 that, compared with the original structure, although OS1 is still not perfect to solve the material bias, the uniformity of the left side is basically the same to some extent, which proves that the optimization of this way is feasible. The only thing to do is to refine the structure to make the effect better. However, the effect of OS2 and OS3 is the same, showing an obvious bias phenomenon. The main reason for the result is the distribution of the flow field at the top of the drying tower, as shown in Figure 15.
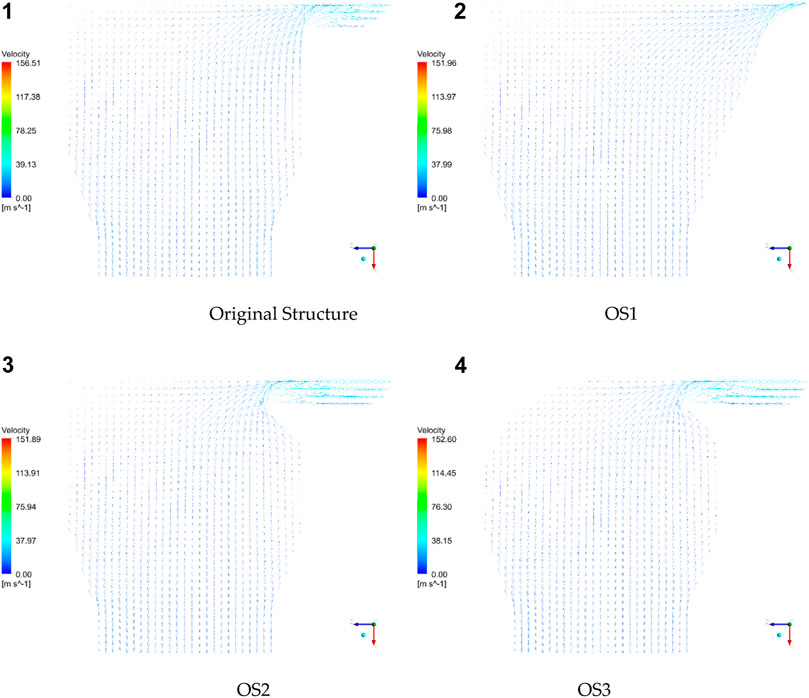
FIGURE 15. Velocity vector fields of different OS models.
As is shown in Figure 15, the uneven velocity distribution of OS is due to the resistance caused by the upward velocity of the contact area between the wall and outlet of the drying tower. The intention of the OS2 and OS3 structure is to disturb the flow field and reduce the influence of the resistance. However, actually, after bypassing the modified structure of the contact area, a resistance makes the velocity distribution of the outlet different. However, the effect of OS1 is basically the same as expected. The upward velocity expands along the slope and transitions at the outlet, thus forming an obvious velocity stratification phenomenon at the upper and lower parts of the exit section to reduce the resistance significantly.
4 Conclusion
The improvement of the structural optimization of CTD was explored in this paper. The influence of the orifice plate structure dislocation and the optimization of the top structure of the drying tower on the uneven outlet section are analyzed. The main conclusions are as follows:
The optimization of the orifice plate structure dislocation has little effect to improve the nonuniformity of the tobacco outlet, but the OPS1 model can significantly reduce the impact of the internal flow field on the orifice plate.
The upward velocity of the OS1 model expands along the slope and transits at the outlet, thus forming obvious velocity stratification at the upper and lower parts of the exit section, which can reduce the resistance and improve the uniformity of the outlet. However, the OS2 and OS3 models have little effect on improving the uniformity of the outlet.
Data Availability Statement
The raw data supporting the conclusion of this article will be made available by the authors, without undue reservation.
Author Contributions
Conceptualization, ZL; methodology, HL; software, WZ; validation, SB, JJ, and TL; formal analysis, HL; investigation, ZL; resources, MH; data curation, SB; writing—original draft preparation, Z.L; writing—review and editing, ZL and SB.
Funding
This project was supported by Narodowego Centrum Nauki, Poland (No. 2020/37/K/ST8/02748 and No. 2017/25/B/ST8/00962).
Conflict of Interest
HL was employed by Longyan Tobacco Industry Co. Ltd.
The authors declare that the research was conducted in the absence of any commercial or financial relationships that could be construed as a potential conflict of interest.
Publisher’s Note
All claims expressed in this article are solely those of the authors and do not necessarily represent those of their affiliated organizations, or those of the publisher, the editors, and the reviewers. Any product that may be evaluated in this article, or claim that may be made by its manufacturer, is not guaranteed or endorsed by the publisher.
Acknowledgments
Great thanks are given to Longyan Tobacco Industry Co. Ltd for providing the experimental data.
References
Bao, Y., and Wang, Y. (2016). Thermal and Moisture Analysis for Tobacco Leaf Flue-Curing with Heat Pump Technology. Proced. Eng. 146, 481–493. doi:10.1016/j.proeng.2016.06.377
Bi, S., Zhang, B., Mu, L., Ding, X., and Wang, J. (2020). Optimization of Tobacco Drying Process Control Based on Reinforcement Learning. Drying Tech. 38 (10), 1291–1299. doi:10.1080/07373937.2019.1633662
Chin, S., and Law, C. (2014). Maximizing the Retention of Ganoderic Acids and Water-Soluble Polysaccharides Content ofGanoderma lucidumUsing Two-Stage Dehydration Method. Drying Tech. 32 (6), 644–656. doi:10.1080/07373937.2013.850434
Geng, F., Li, Y., Wang, X., Yuan, Z., Yan, Y., and Luo, D. (2011). Simulation of Dynamic Processes on Flexible Filamentous Particles in the Transverse Section of a Rotary Dryer and its Comparison with Ideo-Imaging Experiments. Powder Tech. 207 (1-3), 175–182. doi:10.1016/j.powtec.2010.10.027
Geng, F., Li, Y., Yuan, L., Liu, M., Wang, X., Yuan, Z., et al. (2013). Experimental Study on the Space Time of Flexible Filamentous Particles in a Rotary Dryer. Exp. Therm. Fluid Sci. 44, 708–715. doi:10.106/j.expthermflusci.2012.09.011
Geng, F., Wang, Y., Li, Y., Yuan, L., Wang, X., Liu, M., et al. (2013). Numerical Simulation on Mixing Dynamics of Flexible Filamentous Particles in the Transverse Section of a Rotary Drum. Particuology 11 (5), 594–600. doi:10.1016/j.partic.2012.07.007
Gu, C., Zhang, X., Li, B., and Yuan, Z. (2014). Study on Heat and Mass Transfer of Flexible Filamentous Particles in a Rotary Dryer. Powder Tech. 267, 234–239. doi:10.1016/j.powtec.2014.06.059
Hong, Bo. (2013). Study on Analysis of COMAS TOWER DRYER and its Improvement Design. Fuzhou: Fuzhou University.
Long, M., Hua, Y., Wang, X., Wang, Y., He, C., Huangfu, D., et al. (2018). Effect of Different Combined Moistening and Redrying Treatments on the Physicochemical and Sensory Capabilities of Smoking Food Tobacco Material. Drying Tech. 36 (1), 52–62. doi:10.1080/07373937.2017.1299752
Poós, T., and Örvös, M. (2012). Heat and Mass Transfer in Agitated, Co-, or Countercurrent Conductive-Convective Heated Drum Dryer. Drying Tech. 30 (13), 1457–1468. doi:10.1080/07373937.2012.689402
Wang, H., Xin, H., Liao, Z., Li, J., Xie, W., Zeng, Q., et al. (2014). Study on the Effect of Cut Tobacco Drying on the Pyrolysis and Combustion Properties. Drying Tech. 32 (2), 130–134. doi:10.1080/07373937.2013.781622
Wei, S., Tian, B.-Q., Jia, H.-F., Zhang, H.-Y., He, F., and Song, Z.-P. (2018). Investigation on Water Distribution and State in Tobacco Leaves with Stalks during Curing by LF-NMR and MRI. Drying Tech. 36 (12), 1515–1522. doi:10.1080/07373937.2017.1415349
Wu, J., Yang, S. X., and Tian, F. (2017). An Adaptive Neuro-Fuzzy Approach to Bulk Tobacco Flue-Curing Control Process. Drying Tech. 35 (4), 465–477. doi:10.1080/07373937.2016.1183211
Zhang, Yi. (2016). Research on Advanced Control Strategy of CTD Airflow Dryer. Changning: Donghua University.
Zhang, X. (2018). Experimental and Simulation Study on Drying Characteristics of Comas tower Dryer. Xiangtan: Xiangtan University.
Zhou, F., Peng, H., Ruan, W., Wang, D., Liu, M., Gu, Y., et al. (2018). Cubic-RBF-ARX Modeling and Model-Based Optimal Setting Control in Head and Tail Stages of Cut Tobacco Drying Process. Neural Comput. Applic 30 (4), 1039–1053. doi:10.1007/s00521-016-2735-4
Keywords: optimization, structual analysis, structure optimization, thermal-analyses, practicability
Citation: Liao H, Zhang W, Borucki S, Jiang J, Lin T and Li Z (2021) Structure Optimization of Outlet Uniformity for a Comas Tower Dryer. Front. Energy Res. 9:719746. doi: 10.3389/fenrg.2021.719746
Received: 03 June 2021; Accepted: 05 November 2021;
Published: 17 December 2021.
Edited by:
Weixiong Wu, Jinan University, ChinaCopyright © 2021 Liao, Zhang, Borucki, Jiang, Lin and Li. This is an open-access article distributed under the terms of the Creative Commons Attribution License (CC BY). The use, distribution or reproduction in other forums is permitted, provided the original author(s) and the copyright owner(s) are credited and that the original publication in this journal is cited, in accordance with accepted academic practice. No use, distribution or reproduction is permitted which does not comply with these terms.
*Correspondence: Zhixiong Li, zhixiong.li@yonsei.ac.kr