Bi-Level Load Peak Shifting and Valley Filling Dispatch Model of Distribution Systems With Virtual Power Plants
- 1Key Laboratory of Smart Grid of Ministry of Education, Tianjin University, Tianjin, China
- 2Economic and Technology Research Institute, State Grid Tianjin Electric Power Company, Tianjin, China
- 3School of Electrical Engineering and Automation, Wuhan University, Wuhan, China
- 4China Electric Power Research Institute, Beijing, China
Distributed energy resources (DERs) have been widely involved in the optimal dispatch of distribution systems which benefit from the characteristics of reliability, economy, flexibility, and environmental protection. And distribution systems are gradually transforming from passive networks to active distribution networks. However, it is difficult to manage DERs effectively because of their wide distribution, intermittency, and randomness. Virtual power plants (VPPs) can not only coordinate the contradiction between distribution systems and DERs but also consider the profits of DERs, which can realize the optimal dispatch of distribution systems effectively. In this paper, a bi-level dispatch model based on VPPs is proposed for load peak shaving and valley filling in distribution systems. The VPPs consist of distributed generations, energy storage devices, and demand response resources. The objective of the upper-level model is smoothing load curve, and the objective of the lower-level model is maximizing the profits of VPPs. Meanwhile, we consider the quadratic cost function to quantify the deviation between the actual output and the planned output of DGs. The effectiveness of the bi-level dispatch model in load shifting and valley filling is proved by various scenarios. In addition, the flexibility of the model in participating in distribution system dispatch is also verified.
Introduction
With the continuous development of the economy and the growth of electricity demand, the problem of peak load of the power grid has become more and more significant, which has a great impact on distribution systems’ operation and resource utilization. Under the dual pressure of environmental pollution and shortage of fossil energy, renewable energy generation technologies have developed rapidly. The technologies of joint dispatching of distributed generations (DGs) and energy storage devices (ESS) for load peak shaving and valley filling are widely concerned (Sigrist et al., 2013; Setlhaolo and Xia, 2015; Aneke and Wang, 2016; and Sahand et al., 2019). Li et al., 2017, proposed a charging/discharging strategy of ESS considering time of use (TOU) price and DGs, and the strategy had good economic benefit and obvious peak load shifting effect. The traditional pumped storage power station was combined with wind power station by Sheng and Sun, 2014, which made the output of wind-storage devices into a stable and schedulable power source to participate in peak load regulation and load curve smoothing. Yang et al., 2018, proposed a variable parameter power control strategy for ESS considering the effect of peak shaving and valley filling and state of charge interval, which reduced the peak valley difference of the system significantly.
Meanwhile, with the gradual development of power markets, demand response (DR) has been widely studied as an important measure which can optimize the utilization of demand side resources (Setlhaolo et al., 2014; Shafie-Khah et al., 2016; and Chen et al., 2018). Xu et al., 2014, considered the charging demand and load demand establishing a charging control strategy model of electric vehicles’ (EVs) charging station based on dynamic TOU, which realized load peak shifting and valley filling effectively. Zhao et al., 2019, considered the uncertainty of flexible load in actual response and proposed a multitime scale model of day ahead, intraday, and real time. The model had a good effect on load peak shaving and valley filling, and it consumed renewable energy resources adequately. Rasheed et al., 2015, considered the user comfort, power consumption cost, and the reduction degree of power consumption peak to optimize the residential load and adopted different optimization algorithms to solve the model.
However, it is difficult to manage DGs effectively because of their small capacity, wide distribution, intermittency, and randomness. In addition, the load of middle-sized and small-sized users is scattered and highly uncertain which makes it hard to participate in the distribution systems’ dispatch and power markets’ transaction. The contradiction between DGs, DR, and power grid is well solved through virtual power plants (VPPs). VPPs can realize the aggregation, coordination, and optimization of active resources such as DGs, ESS, flexible load, and EVs, which participate in the power markets and power grids operation as special power plants by integrating the above resources (Wei et al., 2013). Therefore, a series of studies on VPPs participating in power systems’ dispatch is in full swing (Bai et al., 2015; Ju et al., 2016b; Koraki and Strunz, 2018; and Zahid et al., 2019). Pandzic et al., 2013, aggregated wind power plants, photovoltaic power plants, conventional gas turbine power plants, and pumped hydro storages as a VPP and realized midterm dispatch by maximizing the profits of the VPP. Yi et al., 2020, proposed a bi-level planning model, which effectively improved the security and economy of the system by pricing the reactive power appropriately. In Ref. (Liu et al., 2018), the dispatch model of VPPs was established considering DR and carbon emissions, which studied the impact of environmental protection characteristics on the economy of VPPs. Ju et al., 2016a, established an optimization model which can reduce the fluctuation of wind power output by using variable load and improve VPPs’ profits.
Based on the studies mentioned above, a bi-level dispatch model based on VPPs is proposed in this paper for load peak shaving and valley filling, which arranges the DGs, ESS, and DR as a VPP to smooth the load curve and alleviates the peak load problem of distribution systems. The objective of the upper-level model is smoothing load curve, and the objective of the lower-level model is maximizing the profits of VPPs. Meanwhile, we consider the quadratic cost function to quantify the deviation between the actual output and the planned output of DGs, which is used to reduce the waste of renewable energy resources. The model can not only effectively improve the adjustability of all kinds of distributed energy resources (DERs) in load peak shifting and valley filling but also can improve the economic profits of VPPs. Finally, the effectiveness of the bi-level dispatch model in load peak shifting and valley filling is proved by various scenarios. In addition, the flexibility of the model in participating in distribution systems’ dispatch is also verified.
The remainder of this paper is organized as follows. The related theoretical models and concepts are introduced in Preliminary. The structure and organization process of the model are given in Bi-Level Dispatch Model of Distribution Systems with Virtual Power Plants. The flowchart of the bi-level dispatch model, detailed objective functions, and constraints are also presented in Bi-Level Dispatch Model of Distribution Systems with Virtual Power Plants. Case studies are provided in Case Study. Conclusion gives the conclusions of this paper.
Preliminary
The Structure of Virtual Power Plant
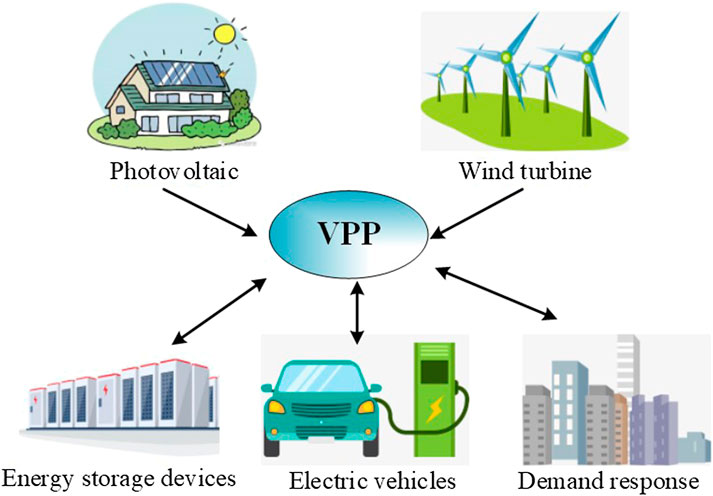
VPPs are management systems which integrate different types of DERs such as distributed generators, ESS, flexible load, and EVs through advanced control, measurement, and communication technologies. They are used to participate in the power markets’ transactions and distribution systems’ dispatch, so as to realize the effective regulation and control of DERs. The structure of VPPs is shown in Figure 1.
The Model of Flexible Load
In the case of peak load problem which is constantly prominent, DR as an important measure of load regulation and control has been widely concerned by experts and scholars. Flexible load as a key resource in demand side can alleviate the power supply pressure of power grid greatly by participating in DR, and it can achieve peak shifting and peak avoidance to a certain extent. The strategies of DR are divided into price-based DR (PBDR) and incentive-based DR (IBDR). The PBDR is divided into TOU pricing, critical peak pricing, and spot pricing. TOU is a common electricity price strategy in China, which can effectively reflect the difference of power supply cost in different periods of power grids. The main measures are increasing the price in the peak period and reducing the price in the low period appropriately, which are used to reduce the peak-valley difference. Transferable load is a main expression form of PBDR strategy. And the IBDR includes direct load control, interruptible load, demand side bidding, emergency DR, capacity market project, and auxiliary service project. Before the implementation of IBDR, the DR implementation agency should sign a contract with the participating users, which includes the limits of load curtailment, response duration, and maximum response times. Curtailable load is a main expression form of IBDR strategy. Therefore, we quantify DR as transferable load and curtailable load in this paper.
Transferable Load
Transferable load refers to the load whose power supply time can be changed while the total electricity consumption remains unchanged before and after the transferring. It can be flexibly adjusted according to the needs of users or power grids, such as EV power stations, ice storages, ESS, and partial load of industrial and commercial users (Wang et al., 2014). The model of transferable load is shown as follows:
where
Curtailable Load
Curtailable load refers to the load whose total electricity consumption will decrease after responding the DR strategies. The model of curtailable load is shown as follows:
where
The Organization Process of the Dispatch Model
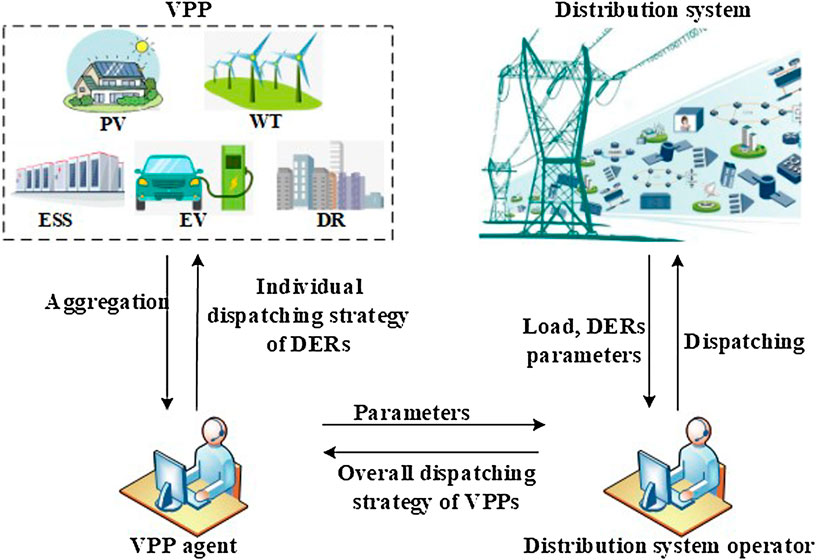
The main structure and organization process of the dispatch model of an active distribution network (ADN) with VPPs is formulated in Figure 2, and the detailed implementation procedures of the model are as follows:
(1) VPP agent aggregates the DERs such as photovoltaics (PVs), ESS, and some controllable resources such as curtailable load and transferable load firstly. Then, VPP agent submits the related parameters and aggregation model to the distribution system operator (DSO).
(2) According to the related parameters and aggregation model of VPP agent, the DSO will conduct the optimal dispatch scheme for the active distribution network which can smooth the load curve.
(3) According to the parameters of DERs and DR, VPP agent will conduct the optimal dispatch schemes of each individual resource in the VPPs with the goal of maximizing the profits of VPPs.
Bi-Level Dispatch Model of Distribution Systems With Virtual Power Plants
Basic Framework of the Bi-Level Dispatch Model
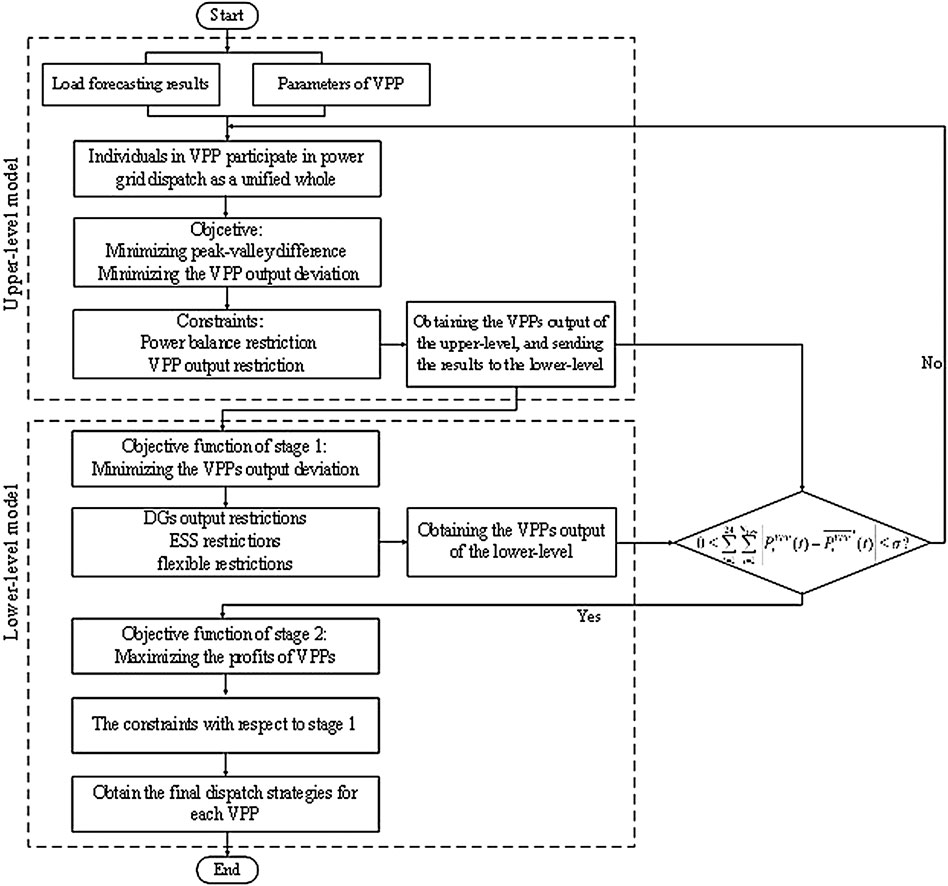
The distribution system side, VPP side and user side have different requirements in the dispatch process. Therefore, a bi-level dispatch model is proposed in this paper. The objective of distribution system side is smoothing load curves, which is in the upper-level model. The objective of VPP side is maximizing the profits, which is in the lower-level model. In addition, we also consider DR in the lower-level model, which by introducing the flexible load of user side for dispatching. Meanwhile, we consider the quadratic cost function to quantify the deviation between the actual output and the planned output of DGs, which is used to reduce the waste of renewable energy resources. The bi-level model satisfies a series of constraints such as power balance restriction, VPP output restriction, DG output restriction, ESS restriction, and flexible load restriction. In order to ensure the effectiveness in load peak shaving and valley filling, the distribution system level objective is the main focus, while the profits of VPPs are secondary. The specific dispatch strategies of individual resources in VPPs are obtained at last. There is a brief introduction to the iteration process. Firstly, the DSO of the upper-level sends the dispatch plan to the VPPs in the lower-level, and the VPPs in the lower-level make the response to the dispatch plan under the condition of satisfying their own operation constraints and then send the dispatch plan to the upper-level model. However, there are many constraints need to be satisfied of the units of VPPs, and VPPs may not be able to fully respond to the dispatch plan of distribution systems’ layer. If the VPPs’ output of the lower level does not fully respond to the planned output of the upper level, a new output will be generated in the VPPs’ layer and if the VPP output deviation between the upper-level and the lower level exceeds σ, the new output will be sent to the upper-level for a new iteration. The distribution system will make adjustments and resend the new dispatch strategies. Figure 3 shows the flow chart of the bi-level dispatch model.
The Description of the Upper-Level Model
Objective Function
The upper-level model is the distribution system side dispatch model, and the objective is minimizing the peak valley difference of distribution systems and minimizing the VPP output deviation between the upper-level and lower-level. The expression of the upper-level model is as follows:
(1) Minimizing the peak valley difference of distribution systems
where
(2) Minimizing the VPP output deviation
where
Constraints
(1) Power balance equation:
(2) VPPs’ output constraints:
where
The Description of the Lower-Level Model
Objective Function
Objective Function of Stage 1
There are many constraints need to be satisfied of the units of VPPs, VPPs may not be able to fully respond to the dispatch plan of distribution systems’ layer. Therefore, before the optimization of the lower-level model, we set the objective of minimizing the VPP output deviation between the upper level and lower level to obtain the actual output of the lower level. The objective can be described as follows:
If the VPPs’ output of the lower level fully responds to the planned output of the upper level, no new
Objective Function of Stage 2
The lower-level model is the VPP side dispatch model, and the objective is to maximize the profits of VPPs. In this paper, the profits of VPPs include the generation income of DGs, the compensation income of DR, and the peak-shaving income of ESS. It is worth noting that the peak-shaving income of ESS includes not only the electricity cost/income due to ESS charging/discharging but also the compensation for peak-shaving ancillary service and even some environmental profits in the process of peak shaving. However, due to the lack of appropriate ancillary service prices and the difficulty in collecting pollutant density of thermal power units, we only consider the charging and discharging income of ESS in this paper. The detailed description of the lower-level model is as follows:
where
Constraints
The Constraints of Stage 1
(1) The supply and demand balance of VPPs:
(2) DGs’ constraints:
where
(3) ESS constraints:
Equations 17–22 are the constraints of ESS. Equation 17 is the relationship between stored energy and charging/discharging power of ESS at time t, Equation 18 is the capacity constraint of ESS, Equations 19 and 20 are charging power and discharging power constraint, respectively, Equation 21 is working state constraint of ESS, and the working state can be divided into idle, charging, and discharging, and it can only be in one state in a moment; Equation 22 is the periodic constraint of ESS:
where
(4) Flexible Load Constraints:
Equations 23–26 are the curtailable load constraints, and Equations 27 to 29 are the transferable load constraints. Equation 23 is the user comfort and acceptance constraint, which limits the upper and lower limit of curtailable load capacity at time t. Equation 24 is the curtailable number constraint. Equation 25 is the upper and lower limit constraint of the response capacity of curtailable load in one user. Equation 26 is the constraint of the total response capacity of curtailable load in one VPP. Equation 27 is the user comfort and acceptance constraint, which limits the upper and lower limit of transferable load capacity at time t. Equation 28 is the upper and lower limit constraint of the response capacity of transferable load in one user. Equation 29 is the constraint of the total response capacity of transferable load in one VPP:
where
The Constraints of Stage 2
1) VPPs’ output constraints:
where
Other constraints of stage 2 are the same as that of stage 1.
Model Processing and Implement Method
The upper-level model of the bi-level dispatch model proposed in this paper is a typical mixed integer linear programming model. The lower-level model contains nonlinear objective functions, which is a mixed integer nonlinear programming model. The objective function in the lower-level model is transformed into linear description by KKT condition (Zhang et al., 2018, and Wei et al., 2015). Then, we can solve the model by calling optimization software CPLEX through YALMIP in MATLAB. The convergent gap value of CPLEX solver is set to 0.01%.
Case Study
Case Introduction
We consider two VPPs participating in the distribution system dispatch. One VPP consists two photovoltaic systems and one ESS. The installed capacity of PV is 100 kW, the capacity of the ESS is 1,800 kWh, and the rated power is 300 kW. The other VPP consists one photovoltaic system and one ESS. The installed capacity of PV is 200 kW, the capacity of the ESS is 900 kWh and the rated power is 150 kW. The load data are from a typical day of a city in southern China. DR resources contain transferable load and curtailable load in this paper. The transferable load accounts for 3% of the total load and the curtailable load accounts for 1% of the total load in the first VPP system. In the second VPP system, the transferable load accounts for 2% of the total load and the curtailable load accounts for 1% of the total load. We adopt TOU in this paper. The division of peak-valley time period and the electricity price of each period are shown in Table 1. The rated output of PV is shown in Table 2. In this paper, the system electricity price at the curtailable time is used to compensate for the curtailable load (Luo and Song, 2015), and 80% of the system electricity price at the transferable time is used to compensate the transferable load (Liu et al., )
Result Analysis
Scenario Setting
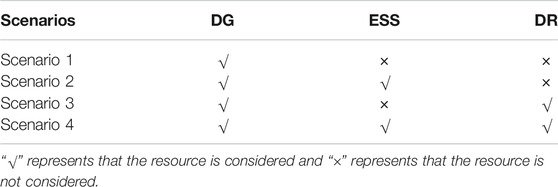
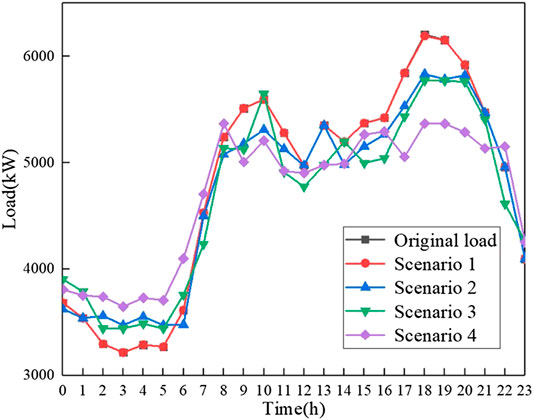
This paper simulates four different scenarios to analyze the optimization effect on the load curve by VPPs when aggregating different types of DERs. Scenario 1 is the benchmark scenario, which considers the optimization of load curve only with DGs; scenario 2 does not consider the DR, but only considers the DGs and ESS to optimize the load curve; scenario 3 does not consider ESS, but only considers DGs and DR to optimize the load curve; scenario 4 is a comprehensive scenario, considering DGs, ESS, and DR to optimize the load curve. Table 3 shows the scenarios in detail.
Optimization Effect and Analysis
Figure 4 shows the optimized load curve in different scenarios. In scenario 1, the peak period of DGs does not completely match with the peak period of load demand, so DGs power output cannot be fully absorbed, which causes the problem of resource waste. The effect of the optimization is not obvious. Scenario 2 considers the combination of DGs and ESS for dispatching. ESS smooths the load curve by discharging at peak periods and charging at valley periods. Meanwhile, the introduction of ESS can realize the local absorption of DGs, which can greatly improve the renewable energy resource utilization rate. Scenario 3 considers DR for optimizing load curve, and the introduction of DR can effectively reduce the load peak valley difference. In addition, due to the lack of ESS coordination, the waste of DGs is serious. Scenario 4 considers all the resources comprehensively. It can be seen from Figure 4 that the smoothness performance of load curve and the peak valley difference are optimal in scenario 4. Aggregating DGs, ESS, and DR as VPPs for distribution systems’ dispatch can relieve the pressure of power grid more.
Virtual Power Plant Dispatch Strategies and Analysis
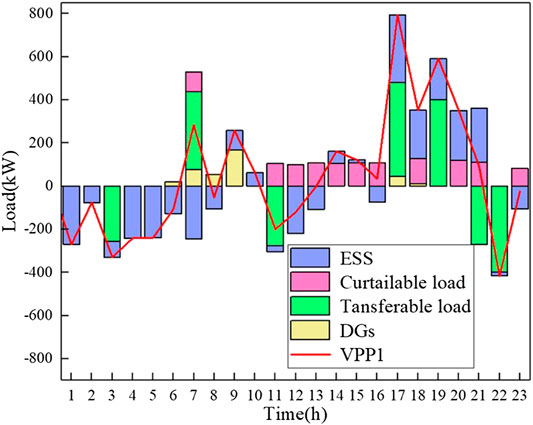
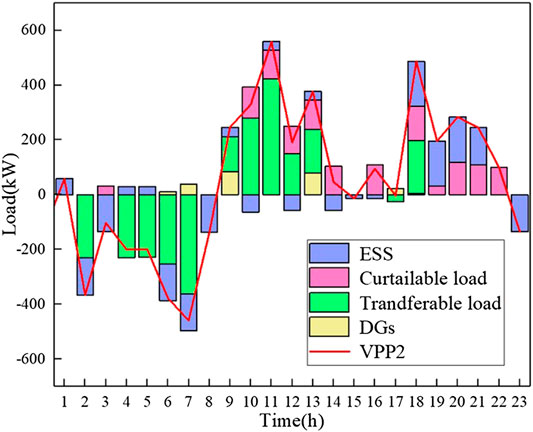
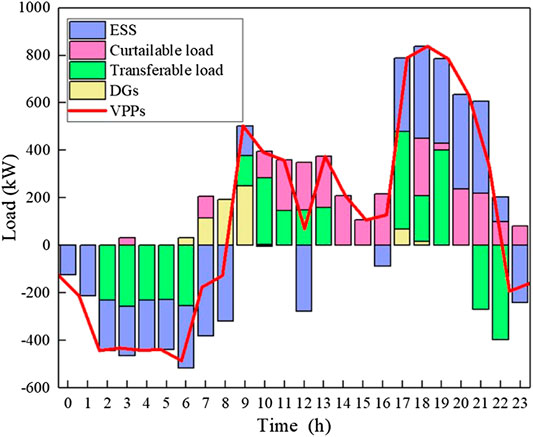
Figures 5 and 6 show the dispatch strategies of the two VPPs in scenario 4, respectively. Figure 7 shows the total dispatch strategies of VPPs in scenario 4. We can see that the ESS charging in the valley period of TOU price and discharging in the peak period of TOU price. Meanwhile, the transferable load is transferred from the peak period to the valley period, and the curtailable load is curtailed in the peak period. DGs output is close to the rated output, which greatly improves the utilization of resources and the profits of VPPs.
Table 4 shows the optimization performance of VPPs with some typical indexes of load curve in scenario 4. It can be clearly seen from Table 4 that aggregating DGs, ESS, and DR as VPPs to optimize the distribution systems load can improve the relevant indexes greatly, which can realize the load peak shaving and valley filling of the distribution systems effectively. Moreover, it can alleviate the pressure of the distribution systems greatly and provide scientific guidance for distribution systems planning, construction, and management.
Conclusion
The problem of large peak valley difference and the peak load problem have a negative impact on the distribution systems’ operation and resource utilization rate. A bi-level dispatch model of distribution systems with VPPs is proposed in this paper to solve the problems mentioned above. The objective of the upper-level model is smoothing load curve, and the objective of the lower-level model is maximizing the profits of VPPs. The effectiveness of the bi-level dispatch model in load peak shifting and valley filling is proved by various scenarios. In addition, the flexibility of the model in participating in distribution systems dispatch is verified as well. Through the analysis of the case studies, the following conclusions can be drawn:
(1) Active resources play an important role in solving the large peak valley difference and the peak load problem of distribution systems. In this paper, we aggregate various kinds of active resources as VPPs to participate in distribution systems’ dispatch, which solve the problem of high uncertainty and difficulty in management of the active resources. The model reflects the high flexibility of the VPPs in the process of distribution systems’ dispatch.
(2) The flexible load and ESS have a very significant performance in the smoothing load curve. In addition, the ESS can rely on their own charging and discharging characteristics to cooperate with the DGs in VPPs, which increases the utilization rate of resources.
(3) The bi-level dispatch model in this paper can not only maximize the local consumption of DGs and improve the economy of VPPs but also smooth the load curve and reduce the peak valley difference. Moreover, it can provide more scientific and accurate guidance for the future distribution systems’ planning.
Data Availability Statement
The original contributions presented in the study are included in the article/Supplementary Material; further inquiries can be directed to the corresponding author.
Author Contributions
FL contributed toward supervision, conceptualization, and writing—review and editing. XY contributed toward methodology, software, data curation, and writing—original draft. WW, TZ, LY, LZ, and MQ contributed toward writing—review and editing.
Funding
This work was supported in part by the National Key Research and Development Program of China under Grant 2016YFB0900100, National Natural Science Foundation of China under Grant 51977140, Grant U1866207, and Grant 51207101, and Natural Science Foundation of Tianjin under Grant 19JCYBJC21300.
Conflict of Interest
Author TZ was employed by State Grid Tianjin Electric Power Company. Author LZ and MQ were employed by China Electric Power Research Institute.
The remaining authors declare that the research was conducted in the absence of any commercial or financial relationships that could be construed as a potential conflict of interest.
Acknowledgments
Thanks for the data support provided by the project team members of National Key Research and Development Program of China, the National Natural Science Foundation of China, and the Natural Science Foundation of Tianjin.
Supplementary Material
The Supplementary Material for this article can be found online at: https://www.frontiersin.org/articles/10.3389/fenrg.2020.596817/full#supplementary-material
References
Aneke, M., and Wang, M. (2016). Energy storage technologies and real-life applications-A state of the art review. Appl. Energy 179, 350–377. doi:10.1016/j.apenergy.2016.06.097
Bai, H., Miao, S., Ran, X., and Ye, C. (2015). Optimal dispatch strategy of a virtual power plant containing battery switch stations in a unified electricity market. Energies 8, 2268–2289. doi:10.3390/en8032268
Chen, X., Wang, J., Xie, J., Xu, S., and Gan, L. (2018). Demand response potential evaluation for residential air conditioning loads. IET Gener. Transm. Distrib. 12, 4260–4268. doi:10.1049/iet-gtd.2018.5299
Ju, L., Li, H., Zhao, J., Chen, K., Tan, Q., and Tan, Z. (2016a). Multi-objective stochastic scheduling optimization model for connecting a virtual power plant to wind -photovoltaic-electric vehicles considering uncertainties and demand response. Energy Convers. Manag. 128, 160–177. doi:10.1016/j.enconman.2016.09.072
Ju, L., Tan, Z., Yuan, J., Tan, Q., Li, H., and Dong, F. (2016b). A bi-level stochastic scheduling optimization model for a virtual power plant connected to a wind-photovoltaic-energy storage system considering the uncertainty and demand response. Appl. Energy 171, 184–199. doi:10.1016/j.apenergy.2016.03.020
Koraki, D., and Strunz, K. (2018). Wind and solar power integration in electricity markets and distribution networks through service-centric virtual power plants. IEEE Trans. Power Syst. 33, 473–485. doi:10.1109/PESGM.2018.8586267
Li, X., Geng, G., Ji, Y., and Lu, L. (2017). Operation strategy of battery energy storage system in distribution network with distributed generation. Electric Power Automation Equipment 37, 59–65 [in Chinese, with English summary]. doi:10.16081/j.issn.1006-6047.2017.11.010
Liu, X., Wu, H., Wang, J., and Lu, J. (2020) Economic dispatch of a virtual power plant considering demand response in electricity market environment. Electr. Power, 53, 172–180 [in Chinese, with English summary]. doi:10.11930/j.issn.1004-9649.202001092
Liu, Z., Zheng, W., Qi, F., Wang, L., Zou, B., Wen, F., et al. (2018). Optimal dispatch of a virtual power plant considering demand response and carbon trading. Energies, 11, 1488–1506. doi:10.3390/en11061488
Luo, Q., and Song, Y. (2015). Marketing strategy in competitive retail market considering interruptible load. Autom. Electr. Power Syst. 39, 134–139 [in Chinese, with English summary]. doi:10.7500/AEPS20140910001
Pandzic, H., Kuzle, I., and Capuder, T. (2013). Virtual power plant mid-term dispatch optimization. Appl. Energy 10, 134–141. doi:10.1016/j.apenergy.2012.05.039
Rasheed, M., Javaid, N., Ahmad, A., Khan, Z. A., Qasim, U., and Alrajeh, N. (2015). An efficient power scheduling scheme for residential load management in smart homes. Appl. Sci. 5, 1134–1163. doi:10.3390/app5041134
Sahand, G., Amin, R., Mojtaba, J., Ali, A., Li, L., and Zhang, J. (2019). Risk-constrained demand response and wind energy systems integration to handle stochastic nature and wind power outage. IET Energy Sys. Int. 1, 114–120. doi:10.1049/iet-esi.2018.0022
Setlhaolo, D., and Xia, X. (2015). Optimal scheduling of household appliances with a battery storage system and coordination. Energy Build. 94, 61–70. doi:10.1016/j.enbuild.2015.02.051
Setlhaolo, D., Xia, X., and Zhang, J. (2014). Optimal scheduling of household appliances for demand response. Elec. Power Syst. Res. 116, 24–28. doi:10.1016/j.epsr.2014.04.012
Shafie-Khah, M., Kheradmand, M., Javadi, S., Azenhad, M., de Aguiarc, J. L. B., Castro-Gomes, J., et al. (2016). Optimal behavior of responsive residential demand considering hybrid phase change materials. Appl. Energy, 163, 81–92. doi:10.1016/j.apenergy.2015.11.013
Sheng, S., and Sun, X. (2014). An economic dispatching strategy of peak load shifting by wind farm and pumped storage plant. Power Syst. Technol. 38, 2484–2489 [in Chinese, with English summary]. doi:10.13335/j.1000-3673.pst.2014.09.027
Sigrist, L., Lobato, E., and Rouco, L. (2013). Energy storage systems providing primary reserve and peak shaving in small isolated power system: an economic assessment. Int. J. Electr. Power Energy Syst. 53, 675–683. doi:10.1016/j.ijepes.2013.05.046
Wang, K., Yao, J., Yao, L., Yang, S., and Yong, T. (2014). Survey of Research on flexible loads scheduling technologies. Autom. Electr. Power Syst. 38, 127–135 [in Chinese, with English summary]. doi:10.7500/AEPS20140422005
Wang, Z., Liu, M., and Xie, M. (2019). Decentralized saddle-point dynamics solution for optimal power flow of distribution networks with high photovoltaic penetration. Proc. CSEE 39, 459–468+643 [in Chinese, with English summary]. doi:10.13334/j.0258-8013.pcsee.171395
Wei, W., Chen, Y., Liu, F., Mei, S. W., Tian, F., and Zhang, X. (2015). Stackelberg game based retailer pricing scheme and EV charging management in smart residential area. Power Syst. Technol. 39, 134–139 [in Chinese, with English summary]. doi:10.13335/j.1000-3673.pst.2015.04.010
Wei, Z., Yu, S., Sun, G., Sun, Yi., Yuan, Y., and Wang, D. (2013). Concept and development of virtual power plant. Autom. Electr. Power Syst. 37, 1–9 [in Chinese, with English summary]. doi:10.3390/app5041134
Xu, Z., Hu, Z., Song, Y., Zhang, H., and Chen, X. (2014). Coordinated charging strategy for PEV charging stations based on dynamic time-of-use tariffs. Proc. CSEE 34, 3638–3646. doi:10.13334/j.0258-8013.pcsee.2014.22.008
Yang, X., Dong, D., Li, X., Ma, X., Di, N., and Jia, X. (2018). Active power coordinated control strategy of peak load shifting for energy storage system in business park. Power Syst. Technol. 42, 2551–2561. doi:10.13335/j.1000-3673.pst.2017.2098
Yi, Z., Xu, Y., Zhou, J., Wu, W., and Sun, H. (2020). Bi-level programming for optimal operation of an active distribution network with multiple virtual power plants. IEEE Trans. Sustain. Energy 11, 2855–2869. doi:10.1109/TSTE.2020.2980317
Zahid, U., Geev, M., Felician, C., and Yim, F. (2019). Comprehensive review of VPPs planning, operation and scheduling considering the uncertainties related to renewable energy sources. IET Energy Sys. Int. 1, 147–157. doi:10.1049/iet-esi.2018.0041
Zhang, G., Wang, X., and Jiang, C. (2018). Stackelberg game based coordinated dispatch of virtual power plant considering electric vehicle management. Autom. Electr. Power Syst. 42, 48–55 [in Chinese, with English summary]. doi:10.7500/AEPS20170607005
Keywords: distribution systems, distributed generations, energy storage devices, flexible load, demand response, virtual power plants, bi-level dispatch model
Citation: Luo F, Yang X, Wei W, Zhang T, Yao L, Zhu L and Qian M (2020) Bi-Level Load Peak Shifting and Valley Filling Dispatch Model of Distribution Systems With Virtual Power Plants. Front. Energy Res. 8:596817. doi: 10.3389/fenrg.2020.596817
Received: 20 August 2020; Accepted: 19 October 2020;
Published: 11 December 2020.
Edited by:
Yue Zhou, Cardiff University, United KingdomCopyright © 2020 Luo, Yang, Wei, Zhang, Yao, Zhu and Qian. This is an open-access article distributed under the terms of the Creative Commons Attribution License (CC BY). The use, distribution or reproduction in other forums is permitted, provided the original author(s) and the copyright owner(s) are credited and that the original publication in this journal is cited, in accordance with accepted academic practice. No use, distribution or reproduction is permitted which does not comply with these terms.
*Correspondence: Wei Wei, weiw@tju.edu.cn
 Fengzhang Luo
 Xin Yang1
  Wei Wei