 Yu Shan1,2†
 Maoning Lin1,2†
 Fangfang Gu3Shuxin Ying4Xiaoyi Bao1,2Qiongjun Zhu1,2Yecheng Tao1,2
 Zhezhe Chen1,2
 Duanbin Li1,2
 Wenbin Zhang1,2
 Guosheng Fu1,2*
 Min Wang1,2*
- 1Department of Cardiology, Sir Run Run Shaw Hospital, College of Medicine, Zhejiang University, Hangzhou, Zhejiang, China
- 2Key Laboratory of Cardiovascular Intervention and Regenerative Medicine of Zhejiang Province, Hangzhou, China
- 3Department of Cardiology, The Affiliated Huzhou Hospital (Huzhou Central Hospital), College of Medicine, Zhejiang University, Huzhou, Zhejiang, China
- 4Department of Endocrinology and Metabolism, Sir Run Run Shaw Hospital, College of Medicine, Zhejiang University, Hangzhou, Zhejiang, China
Aims: Stress hyperglycemia ratio (SHR), an emerging indicator of critical illness, exhibits a significant association with adverse cardiovascular outcomes. The primary aim of this research endeavor is to evaluate the association between fasting SHR and contrast-induced acute kidney injury (CI-AKI).
Methods: This cross-sectional study comprised 3,137 patients who underwent coronary angiography (CAG) or percutaneous coronary intervention (PCI). The calculation of fasting SHR involved dividing the admission fasting blood glucose by the estimated mean glucose obtained from glycosylated hemoglobin. CI-AKI was assessed based on elevated serum creatinine (Scr) levels. To investigate the relationship between fasting SHR and the proportion of SCr elevation, piecewise linear regression analysis was conducted. Modified Poisson’s regression analysis was implemented to evaluate the correlation between fasting SHR and CI-AKI. Subgroup analysis and sensitivity analysis were conducted to explore result stability.
Results: Among the total population, 482 (15.4%) patients experienced CI-AKI. Piecewise linear regression analysis revealed significant associations between the proportion of SCr elevation and fasting SHR on both sides (≤ 0.8 and > 0.8) [β = -12.651, 95% CI (−23.281 to −2.022), P = 0.020; β = 8.274, 95% CI (4.176 to 12.372), P < 0.001]. The Modified Poisson’s regression analysis demonstrated a statistically significant correlation between both the lowest and highest levels of fasting SHR and an increased incidence of CI-AKI [(SHR < 0.7 vs. 0.7 ≤ SHR < 0.9) β = 1.828, 95% CI (1.345 to 2.486), P < 0.001; (SHR ≥ 1.3 vs. 0.7 ≤ SHR < 0.9) β = 2.896, 95% CI (2.087 to 4.019), P < 0.001], which was further validated through subgroup and sensitivity analyses.
Conclusion: In populations undergoing CAG or PCI, both lowest and highest levels of fasting SHR were significantly associated with an increased occurrence of CI-AKI.
Introduction
Coronary artery disease (CAD) imposes a significant global disease burden and stands as a prominent contributor to human mortality on a global scale (1, 2). Recently, with the widespread application of interventional techniques such as coronary angiography (CAG) and percutaneous coronary intervention (PCI) in the diagnosis and treatment of CAD, there has been a significant improvement in the clinical prognosis of patients with CAD (3–6). However, accompanying this advancement are a series of related complications that cannot be overlooked due to their impact on patient health (7, 8).
CAG and PCI critically depend on the utilization of iodinated intravascular contrast agents to facilitate vessel and chamber imaging. However, it should be noted that contrast agents utilized in CAG and PCI procedures may give rise to a complication known as contrast-induced acute kidney injury (CI-AKI) (9, 10). This condition is characterized by the acute impairment of renal function caused by the administration of iodinated contrast agents and is currently considered the third principal contributor to iatrogenic renal dysfunction (11). Defined by the European Society of Urogenital Radiology (ESUR), CI-AKI is characterized as an elevation in serum creatinine (Scr) levels exceeding 44.2 µmol/L (0.5 mg/dL) or 25% from baseline within 72 hours post-administration of contrast media (12). The incidence of CI-AKI can vary depending on the diagnostic criteria, study population, and preventive measures employed. Current research has shown that risk factors such as diabetes, anemia, baseline renal insufficiency, severity of heart failure, contrast agent dosage, and type of contrast agent are associated with the occurrence of CI-AKI (13–15). Given that CI-AKI can prolong hospital stay, increase healthcare costs, and potentially lead to more severe complications, early identification of these risk factors is of paramount importance in the timely identification and mitigation of CI-AKI.
Pre-procedural glucose levels have garnered recognition as a risk factor contributing to CI-AKI (14). However, relying solely on blood glucose levels may not fully reflect the acute hyperglycemic state, as they could also be influenced by chronic glucose levels. Recently, one study has reported a novel biomarker, the stress hyperglycemia ratio (SHR), which is considered a superior prognostic indicator for critical illness compared to absolute hyperglycemia (16). SHR is calculated based on admission blood glucose (ABG) and glycosylated hemoglobin A1c (HbA1c) levels (16). In contrast to ABG levels, SHR has the ability to quantify the extent of the relative increase in glycemic levels from chronic glycemia over a period of 8 to 12 weeks. Current research has demonstrated that SHR can serve as a significant predictor for cardiovascular and cerebrovascular diseases, as well as respiratory tract infections (17–20). Moreover, meal timing is associated with blood glucose levels, and considering that some patients may have already eaten when experiencing ischemic symptoms while others may experience symptoms before meals, utilizing fasting blood glucose (FBG) to calculate fasting SHR may provide a more accurate reflection of the extent of acute stress-induced hyperglycemia, with previous research reporting its predictive value for cardiovascular diseases (21, 22). Nevertheless, the correlation between CI-AKI and fasting SHR remains unclear. Therefore, the primary focus of this study encompassed an examination of the association between fasting SHR and the incidence of CI-AKI among individuals subjected to CAG or PCI.
Methods
Study population
At Sir Run Run Shaw Hospital and its consortium of affiliated medical hospitals, this retrospective cross-sectional cohort study was employed. The study process strictly adhered to the principles outlined in the Declaration of Helsinki, ensuring rigorous ethical standards were maintained throughout. Prior to the initiation of the study, the independent Ethics Committee of Sir Run Run Shaw Hospital granted thorough approval for this study under the reference number 20220228-30, validating the ethical integrity of the research process.
Figure 1 illustrates the flowchart depicting the process of patient screening. From September 2008 to November 2019, a cumulative number of 3137 patients experienced CAG or PCI and met the following diagnostic criteria: (1) patients > 18 years; (2) patients diagnosed with stable CAD or non-CAD. (3) patients with documented baseline HbA1c and FBG; (4) patients with recorded baseline Scr levels and measurements taken within 72 hours post-contrast exposure; (5) patients with exhaustive baseline data. The exclusion criteria comprised the following: (1) In addition to the current procedure, patients had undergone multiple exposure to contrast agents; (2) patients exhibiting profound cardiac insufficiency, characterized by New York Heart Association Grade III/IV or a left ventricular ejection fraction (LVEF) below 40%; (3) patients who were experiencing hemodialysis treatment or diagnosed with established end-stage renal dysfunction, those afflicted by autoimmune diseases, or those exhibiting active malignant tumors; and (4) pregnant or lactating individuals during hospitalization.
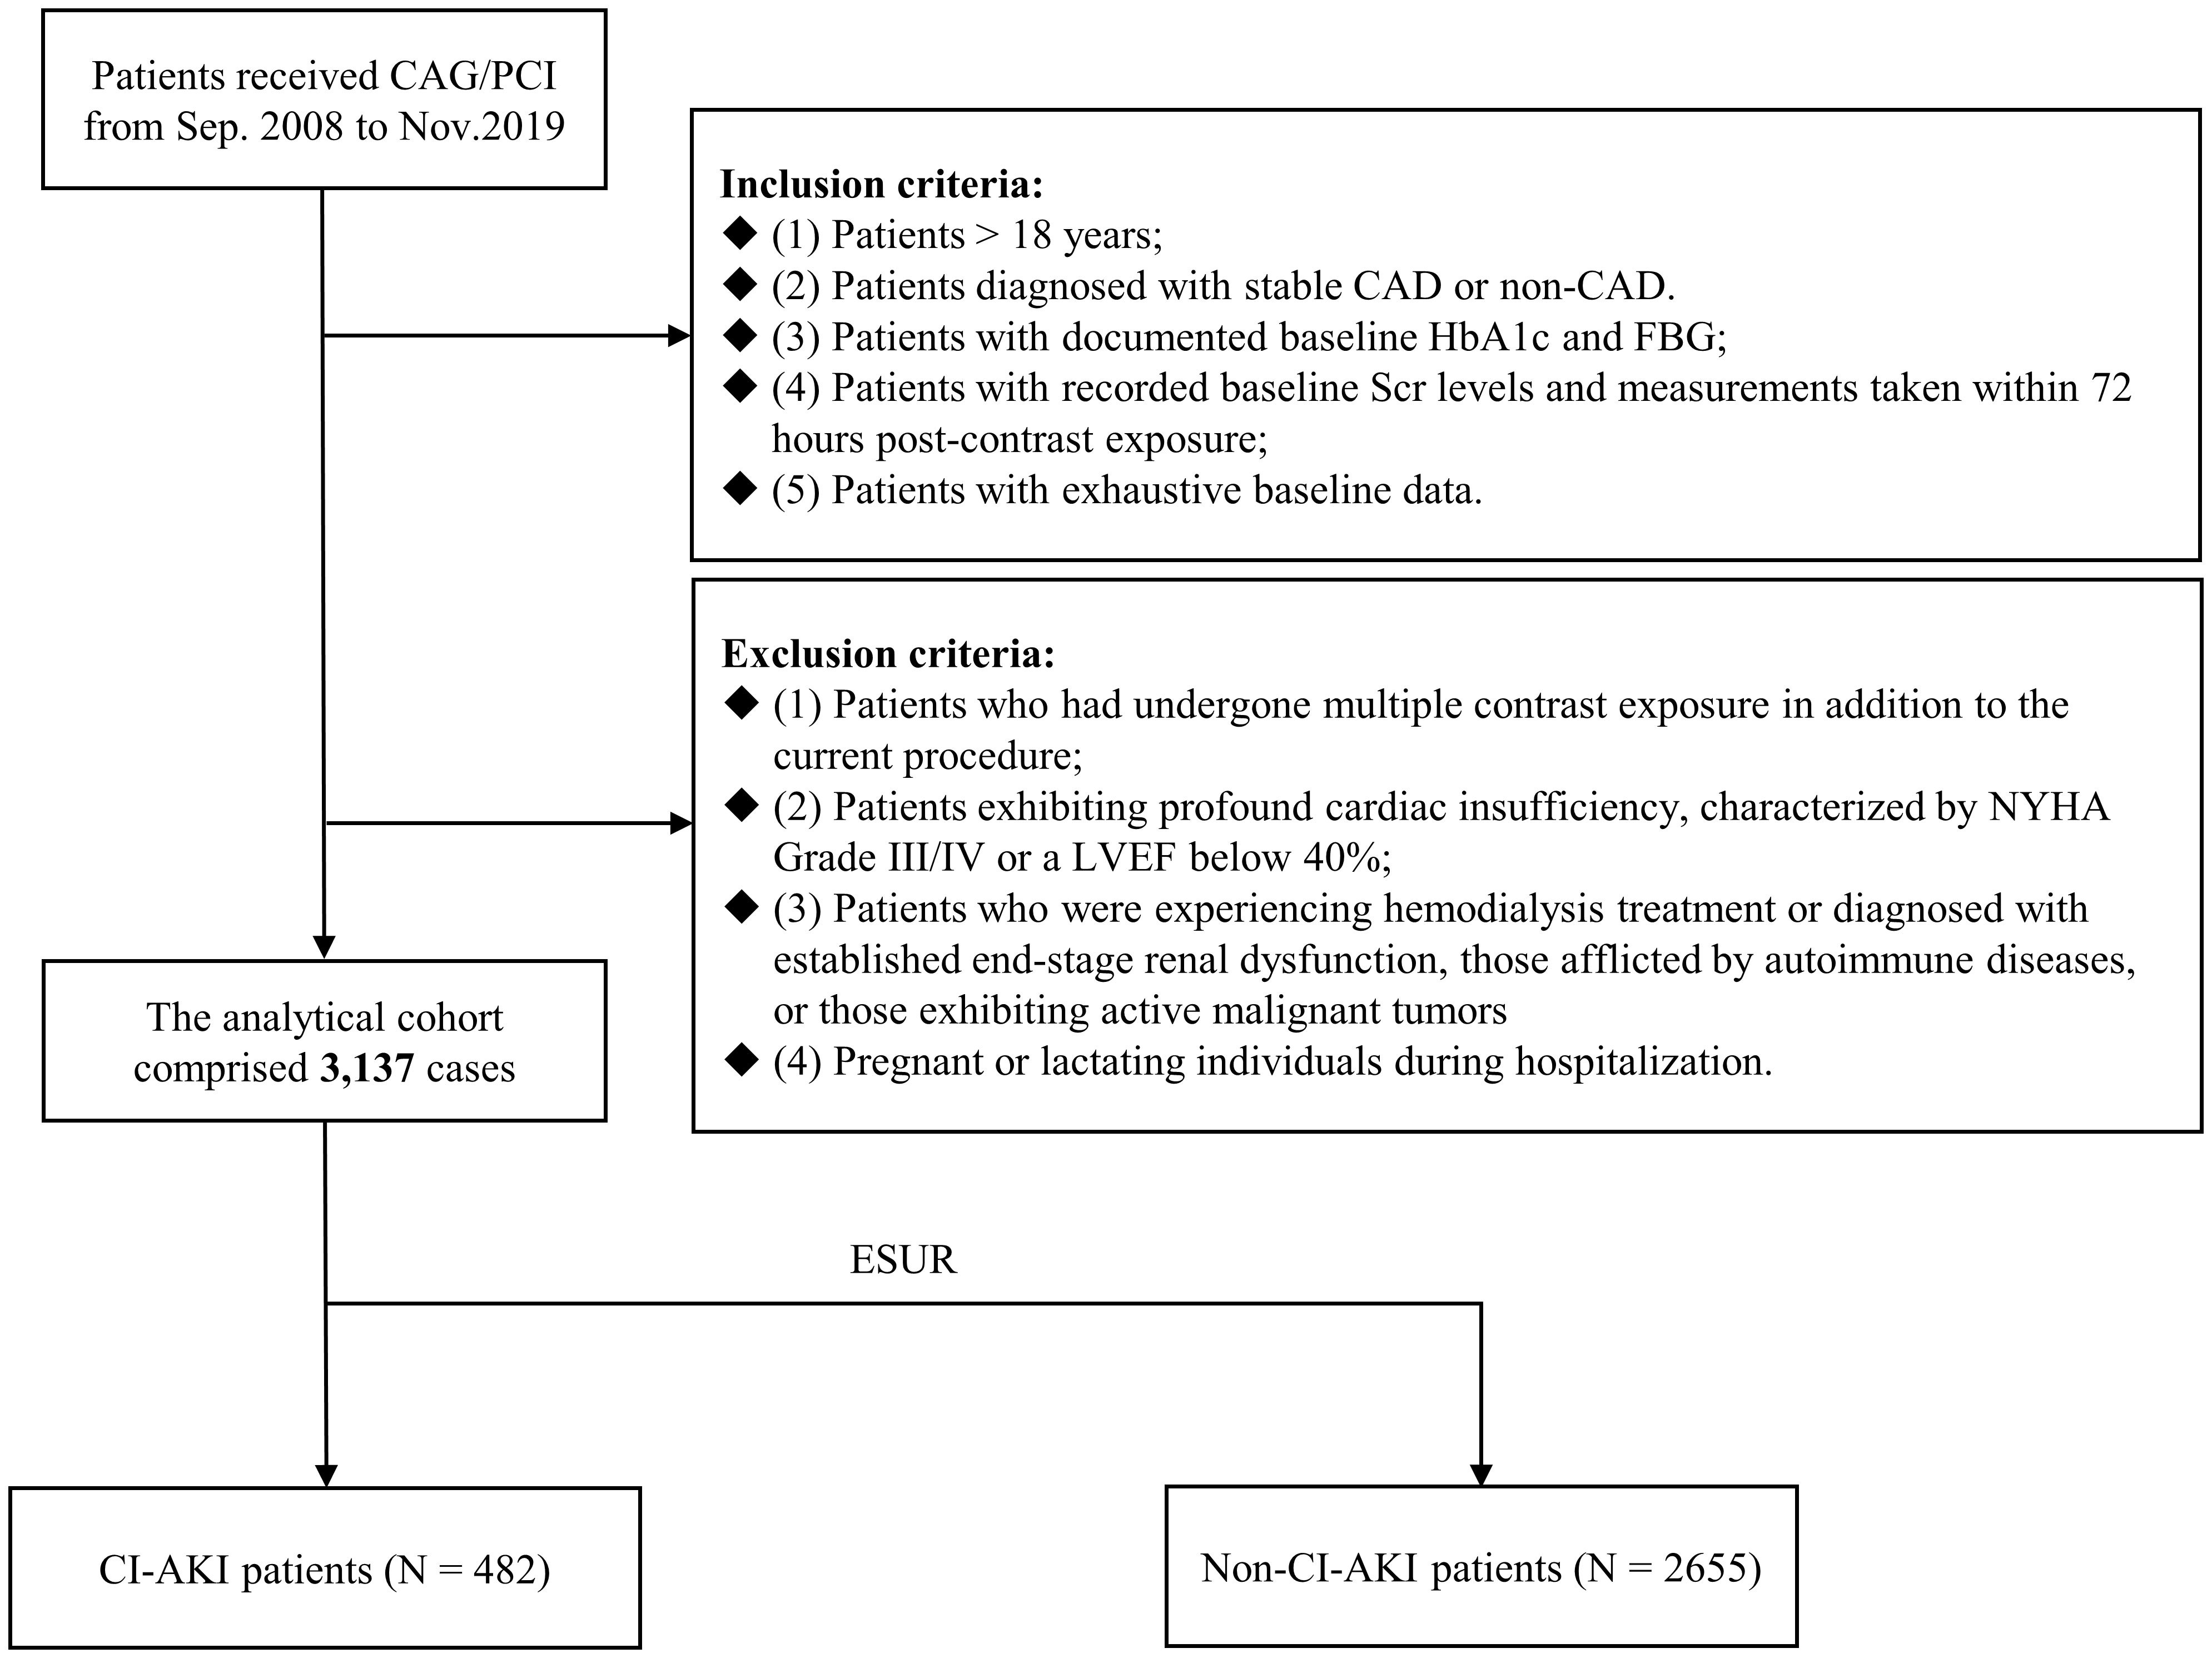
Figure 1 Flowchart of patient enrollment. CAG, coronary angiography; PCI, percutaneous coronary intervention; CAD, coronary artery disease; HbA1c, glycosylated hemoglobin A1c; FBG, fasting blood glucose; Scr, serum creatinine; NYHA, New York Heart Association; LVEF, left ventricular ejection fraction; CI-AKI, contrast-induced acute kidney injury.
Data collection
Upon hospital admission, baseline characteristics including age, sex, LVEF, average heart rate, recent medication usage, and past medical conditions were queried and recorded by trained research coordinators from participating hospitals. Detailed documentation of the specific features pertaining to CAG or PCI was meticulously performed postoperatively. Within a 24-hour period following hospital admission, venous blood samples for the assessment of HbA1c levels and other laboratory parameters were meticulously obtained from the cubital vein. Additionally, following a minimum fasting period of 8 hours, FBG levels were measured through the collection of venous blood samples following an overnight fast. The baseline Scr concentration was determined through biochemical testing upon admission. Subsequently, following exposure to the contrast medium, postoperative Scr concentration was measured on a minimum of three occasions within a 72-hour period, with the highest recorded value being documented.
Definitions
The average glucose levels were estimated from HbA1c, employing the subsequent formula: estimated average glucose level (mmol/L) = 1.59 x HbA1c (%) – 2.59 (23). Fasting SHR is calculated as FBG at admission (mmol/L)/estimated average glucose level (mmol/L) (16). The fasting SHR was partitioned into two distinct segments based on a threshold of 0.8 (SHR ≤ 0.8 and SHR > 0.8). Furthermore, a meticulous categorization strategy was employed to further stratify fasting SHR into five discrete groups, each defined by equal intervals of 0.2 (cut-off points: < 0.7, 0.7-0.9, 0.9-1.1, 1.1-1.3, ≥ 1.3).
As per the guidelines established by ESUR, CI-AKI is defined as a rise in Scr level exceeding 44.2 µmol/L (0.5 mg/dl) or a 25% increment from the individual’s baseline value, occurring within a timeframe of 72 hours subsequent to the administration of contrast agents, and other causes of renal insufficiency should also be excluded (12).
Statistical analysis
Categorical variables were reported as counts with corresponding percentages, and their comparisons were performed using either the Chi-square test or Fisher’s exact test. Continuous variables were represented by their mean value accompanied by the standard deviation (SD), and if they followed a normal distribution, Student’s t-test was utilized for evaluation. Conversely, for continuous variables that did not exhibit a normal distribution, their description included the median value coupled with the interquartile range, and they were subjected to analysis utilizing the Mann-Whitney U-test.
The restricted cubic spline (RCS) model was utilized to visually represent the correlation between fasting SHR and CI-AKI. It is apparent that the relative risk of CI-AKI significantly increases with both high and low fasting SHR values when fasting SHR around 0.8 was used as the reference point. Therefore, fasting SHR was divided into two segments based on a threshold value of 0.8 for conducting piecewise linear regression analysis with the aim of investigating the linearity trend on both ends of fasting SHR (SHR ≤ 0.8 and SHR > 0.8). By incorporating age, gender (male or female), estimated glomerular filtration rate (eGFR), hypertension, type of contrast agent (isotonic or hypotonic), volume of contrast, LVEF, C-reactive protein (CRP) (< 5, 5-10, or ≥ 10mg/L), and medications (administration of statin, furosemide injection and dopamine) (yes or no) as covariates, the multivariable regression analysis effectively controlled for potential significant predictors, with these included factors having been substantiated by previous research (24). Subsequently, employing equal interval categorization, the fasting SHR was divided into five groups, and a modified Poisson’s regression analysis was conducted to determine the adjusted relative risk (aRR) of fasting SHR for the occurrence of CI-AKI. Similar covariates as mentioned above were utilized for adjusting the aRR as well. Moreover, a comprehensive exploratory analysis was performed by stratifying the population into subgroups based on diabetes (yes or no) and HbA1c levels (≤ 6.0% or > 6.0%). This subgroup analysis was conducted using a modified Poisson’s regression model with same covariates mentioned above. In the end, to assess the soundness of the result, two sensitivity analyses were conducted, involving the exclusion of patients who experienced hypoglycemia throughout the initial assessment period and those who encountered a hyperglycemic crisis at the beginning of the study.
A statistically significant result was established based on a two-tailed P-value < 0.05. The manipulation and evaluation of data were conducted utilizing the SPSS software, specifically version 23.0 developed by IBM, with its origin in Chicago, Illinois. Additionally, the analysis also involved the utilization of R version 4.1.2 (developed in Vienna, Austria).
Results
Baseline characteristics
Within the study, a cohort comprising 3137 individuals who experienced either CAG or PCI was included. Table 1 provides an overview of the primary characteristics relating to baseline demographics and clinical variables.
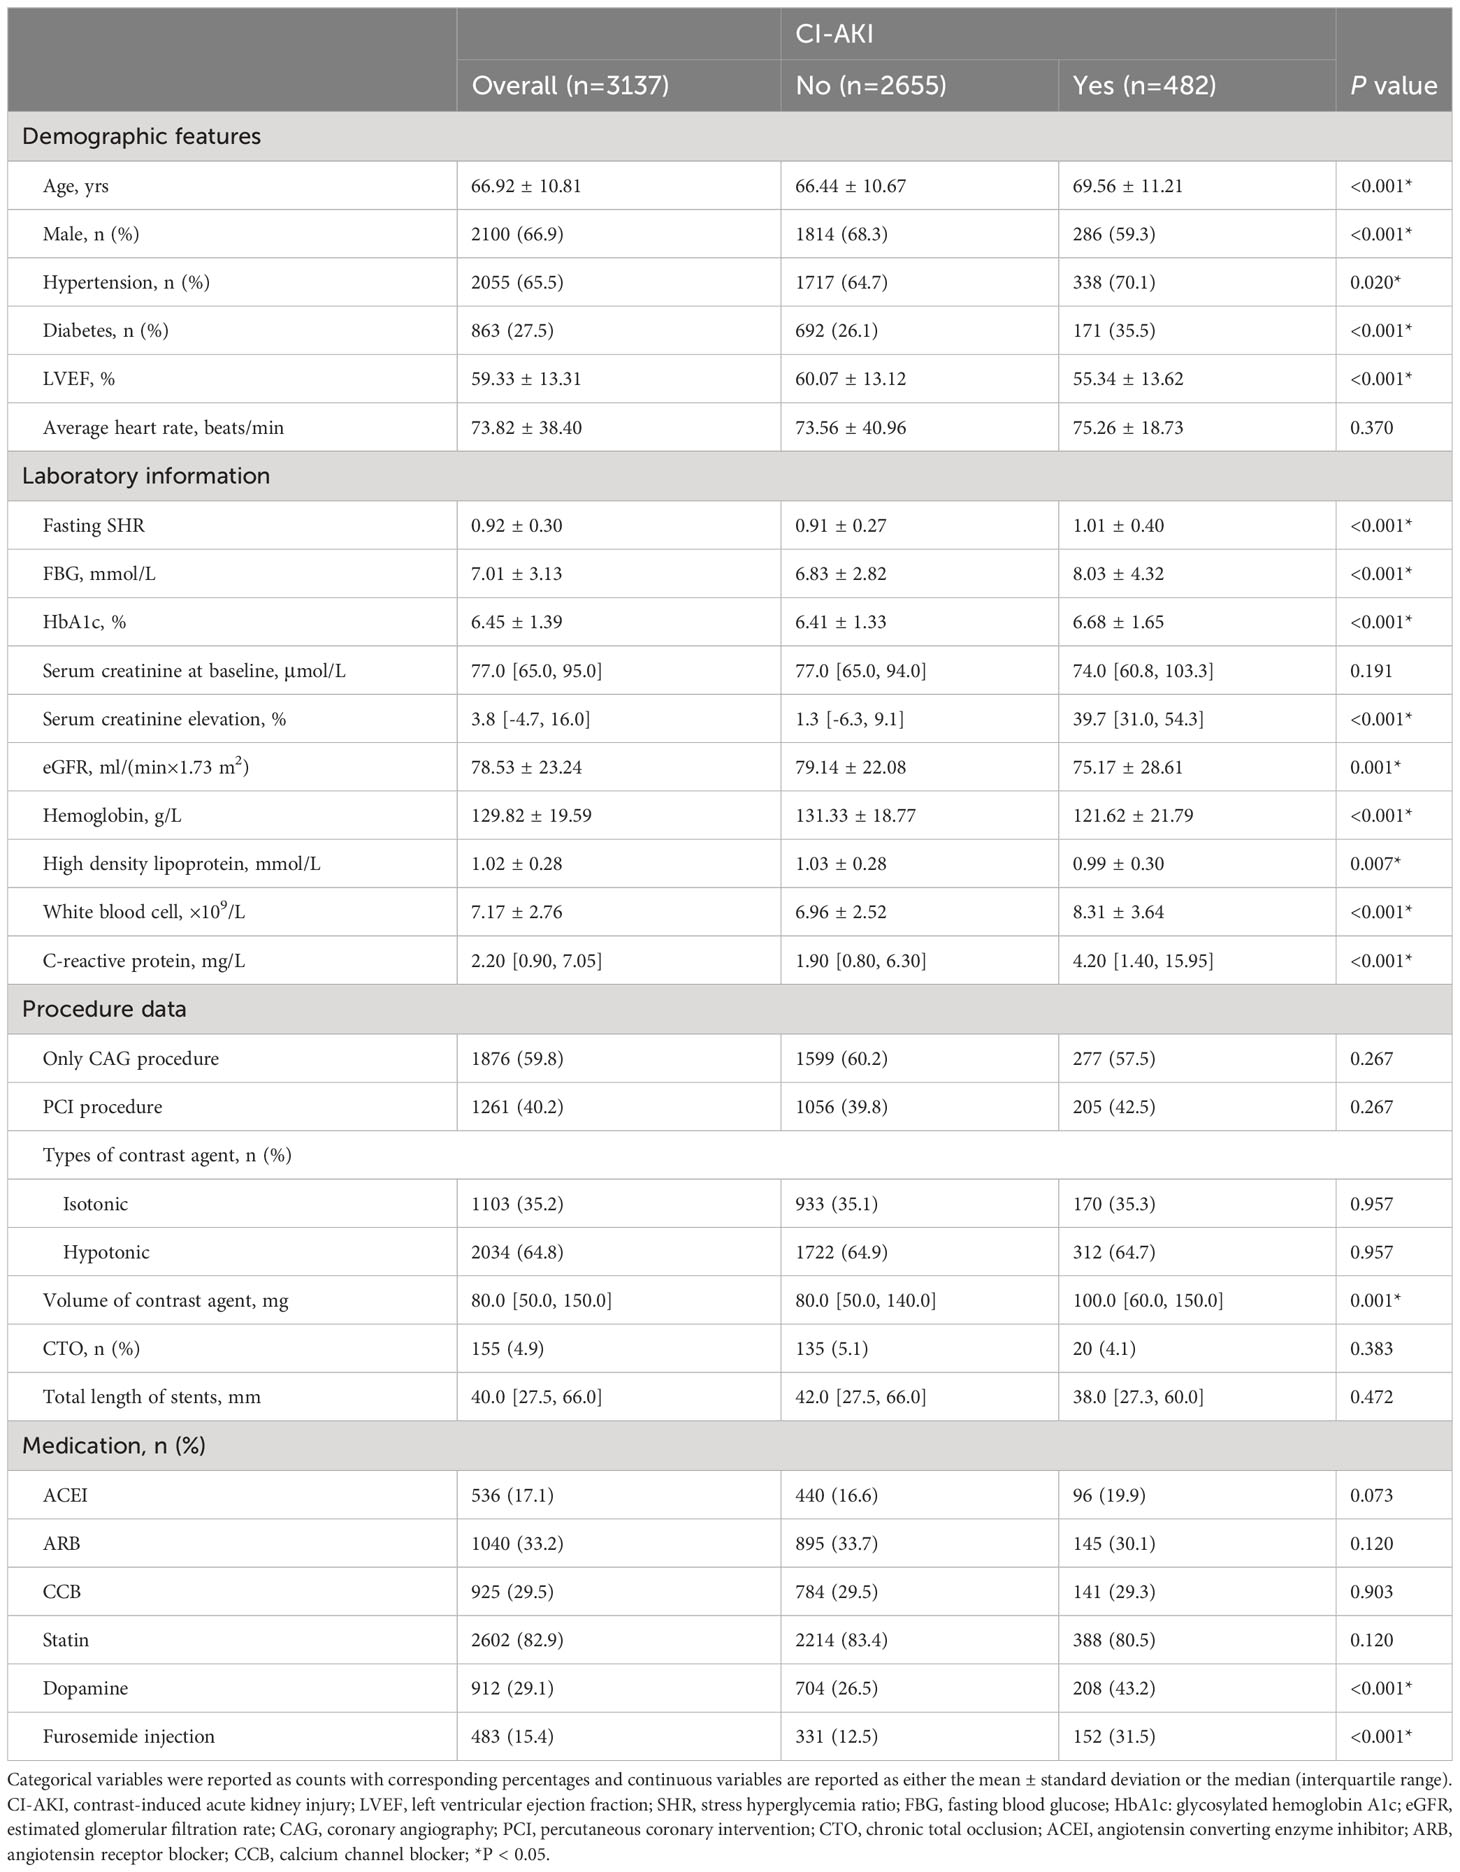
Table 1 Baseline characteristics of the two groups.
The study cohort had an average age of 66.92 ± 10.81 years, with males representing 66.9% of the participants. Among this population, a notable subset of 482 subjects experienced CI-AKI following CAG or PCI. In the cohort of patients with CI-AKI, there was a higher prevalence of hypertension (70.1% vs. 64.7%, P = 0.020) and diabetes (35.5% vs. 26.1%, P < 0.001), accompanied by a lower proportion of individuals receiving furosemide injection (12.5% vs. 31.5%, P < 0.001) and dopamine (26.5% vs. 43.2%, P < 0.001). Furthermore, these patients exhibited lower levels of hemoglobin (121.62 ± 21.79 g/L vs. 131.33 ± 18.77g/L, P < 0.001), baseline LVEF (55.34 ± 13.62% vs. 60.07 ± 13.12%, P < 0.001), and baseline eGFR, along with higher levels of fasting SHR (1.01 ± 0.40 vs. 0.91 ± 0.27, P < 0.001), FBG (8.03 ± 4.32mmol/L vs. 6.83 ± 2.82 mmol/L, P < 0.001), and white blood cell (8.31 ± 3.64×10⁹/L vs. 6.96 ± 2.52×10⁹/L, P < 0.001). Nevertheless, no significant distinctions were observed regarding the average heart rate or the proportions of patients using calcium channel blocker (CCB), angiotensin converting enzyme inhibitor (ACEI), angiotensin receptor blocker (ARB), and statin between the two groups.
Association between fasting SHR and proportion of Scr elevation
The study presents the results of the multivariable piecewise linear regression analysis (Table 2), which included calculation of the β coefficient and its 95% confidence interval (CI), for both sides of fasting SHR (SHR ≤ 0.8 and SHR > 0.8). After comprehensive adjustment, the analysis revealed a significantly negative correlation between fasting SHR and the proportion of SCr elevation when fasting SHR ≤ 0.8 [β = -12.651, 95% CI (−23.281 to −2.022), P = 0.020]. Conversely, a significant positive relationship emerged when the fasting SHR was > 0.8 [β = 8.274, 95% CI (4.176 to 12.372), P < 0.001].
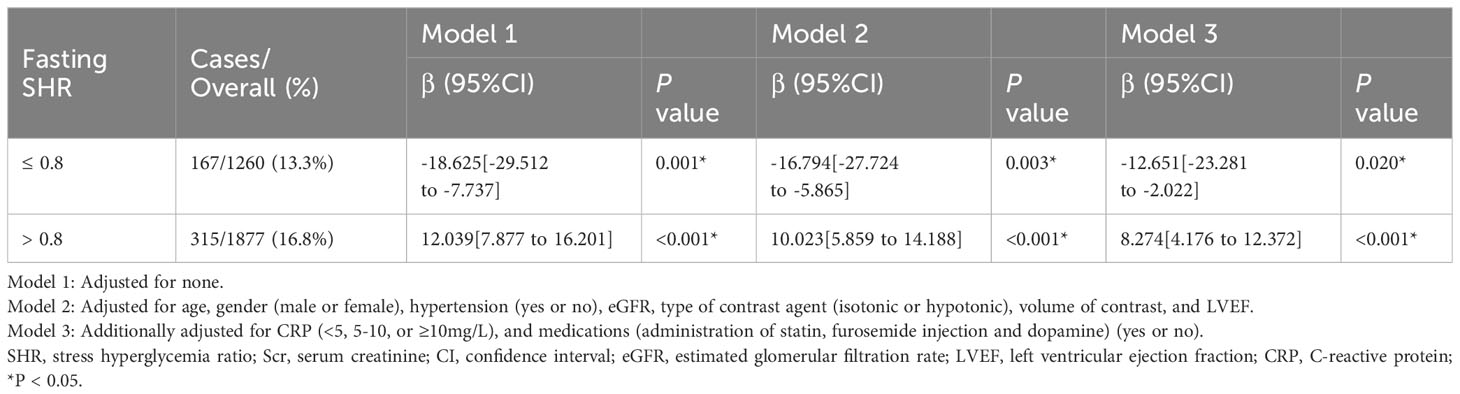
Table 2 Piecewise linear regression analysis of fasting SHR with the proportion of SCr elevation.
The association of the fasting SHR with CI−AKI
The study cohort underwent categorization into five groups, employing equally spaced intervals of the fasting SHR value (Predefined cut-off points: < 0.7, 0.7-0.9, 0.9-1.1, 1.1-1.3, ≥ 1.3). Based on the graphical representation depicted in Figure 2, the group exhibiting a fasting SHR value ranging from 0.7 to 0.9 demonstrates the lowest occurrence of CI-AKI, with an increasing occurrence of CI-AKI as the fasting SHR value deviates in either direction. Additionally, Figure 2 demonstrates a statistically significant J-shaped non-linear relationship between fasting SHR and CI-AKI, as ascertained utilizing the RCS modeling approach (P-value indicating non-linearity < 0.001), even after adjusting for other confounding factors. Notably, a significant reduction in the relative risk of CI-AKI was observed when the fasting SHR was approximately 0.8.
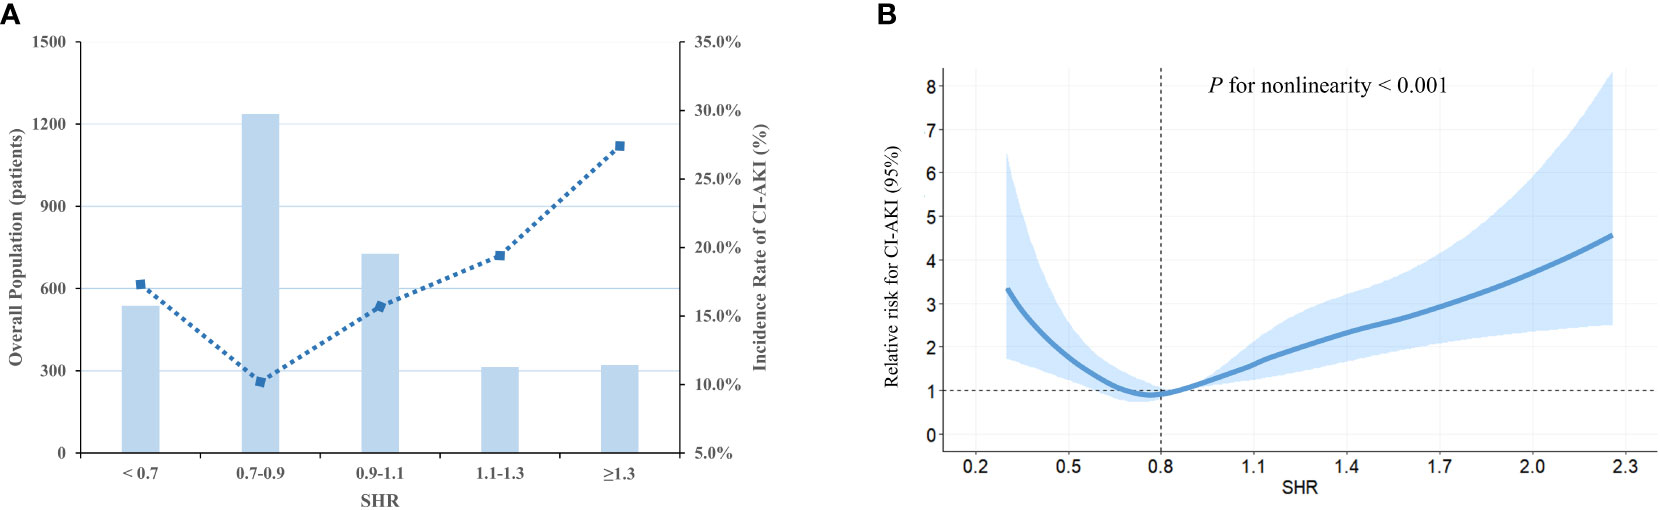
Figure 2 The population distribution histogram and RCS curve. (A) Distribution of population and the incidence of CI-AKI based on fasting SHR categories. The changing trend in the incidence of CI-AKI is illustrated by the blue dashed line. The bar plots presented the distribution of the population across different categories of fasting SHR. Left axis, population count (patients); right axis, incidence of CI-AKI (%). (B) RCS analysis is employed to investigate the non-linear relationship between fasting SHR and CI-AKI. The relative risk of fasting SHR for CI-AKI is represented by the solid blue line, while the shaded area surrounding the line represents the 95% CI of the curve. SHR, stress hyperglycemia ratio; CI-AKI, contrast-induced acute kidney injury; RCS, restricted cubic spline; CI, confidence interval.
Subsequently, a modified Poisson’s regression analysis was utilized to assess and model the relationship between fasting SHR and CI-AKI, with the second category (0.7 ≤ SHR < 0.9) serving as the reference group (refer to Table 3 for detailed results). After conducting multivariable adjustment for potential confounders and employing multiple model analyses, a significant association was observed between the low level of fasting SHR and the incidence of CI-AKI [(SHR < 0.7 vs. 0.7 ≤ SHR < 0.9) β = 1.828, 95% CI (1.345 to 2.486), P < 0.001]. Furthermore, there was also a significant association between the higher level of fasting SHR and the occurrence rate of CI-AKI [(0.9 ≤ SHR < 1.1 vs. 0.7 ≤ SHR < 0.9) β = 1.623, 95% CI (1.220 to 2.158), P = 0.001; (1.1 ≤ SHR < 1.3 vs. 0.7 ≤ SHR < 0.9) β = 2.082, 95% CI (1.456 to 2.975), P < 0.001; (SHR ≥ 1.3 vs. 0.7 ≤ SHR < 0.9) β = 2.896, 95% CI (2.087 to 4.019), P < 0.001].
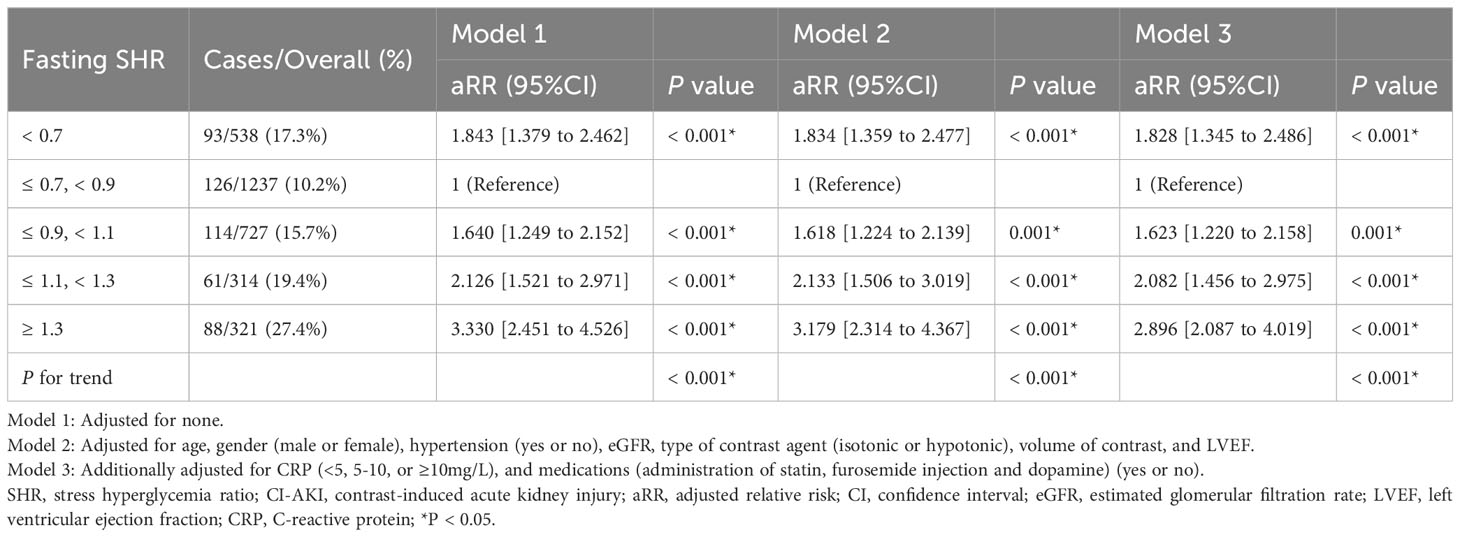
Table 3 Modified Poisson’s regression analysis of fasting SHR categories with CI-AKI.
Subgroup analysis and sensitivity analysis
Following adjustment for confounding factors, an exploration was undertaken to ascertain the robustness of the correlation between fasting SHR and the occurrence of CI-AKI by stratifying individuals according to the presence of diabetes and HbA1c levels (Tables 4, 5). Subgroup analyses demonstrated a strong association between both the lowest and highest levels of fasting SHR and a higher rate of CI-AKI regardless of whether patients had comorbid diabetes or not. Moreover, in both the HbA1c ≤ 6% and HbA1c > 6% subgroups, a significant correlation between the lowest and highest levels of fasting SHR and the incidence of CI-AKI was also identified. These findings were consistent with the primary outcomes observed within the overall population. Within Figure 3, the application of the RCS model visually represents the association between fasting SHR and CI-AKI across different subgroups.
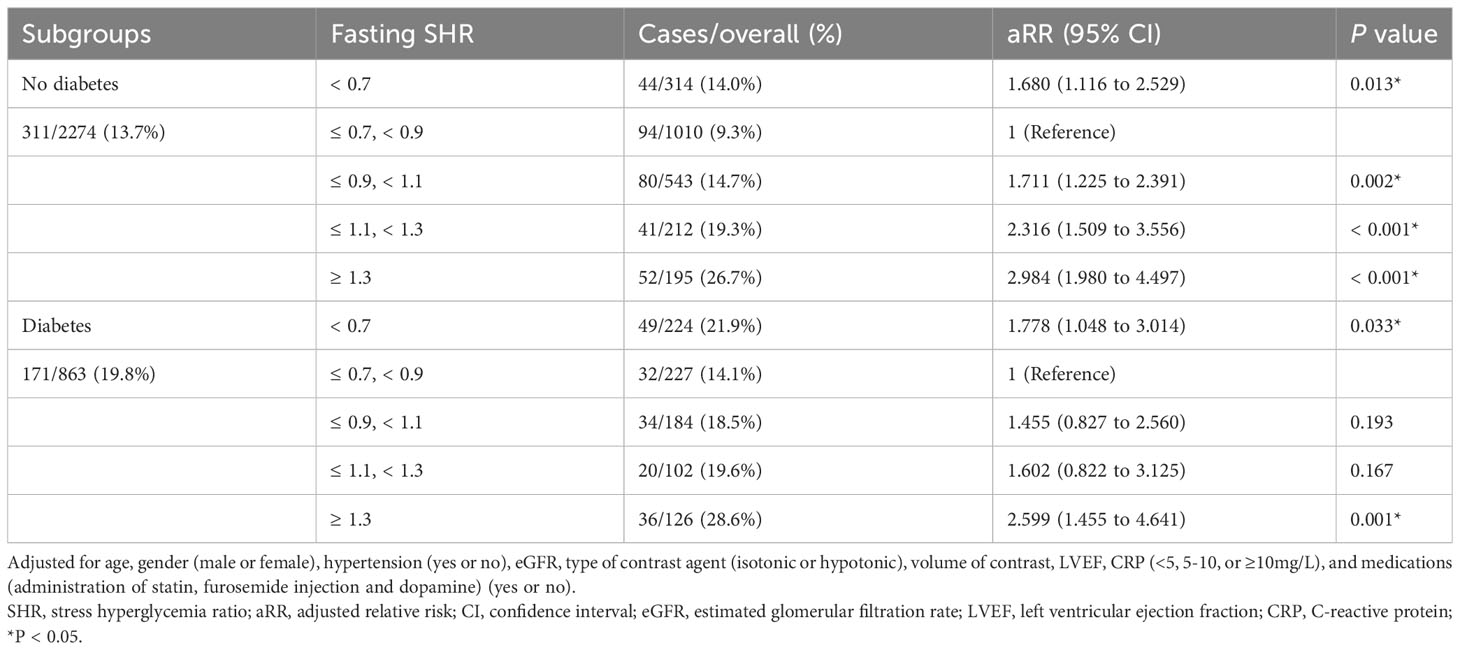
Table 4 Subgroup analysis according to stratification of diabetes.
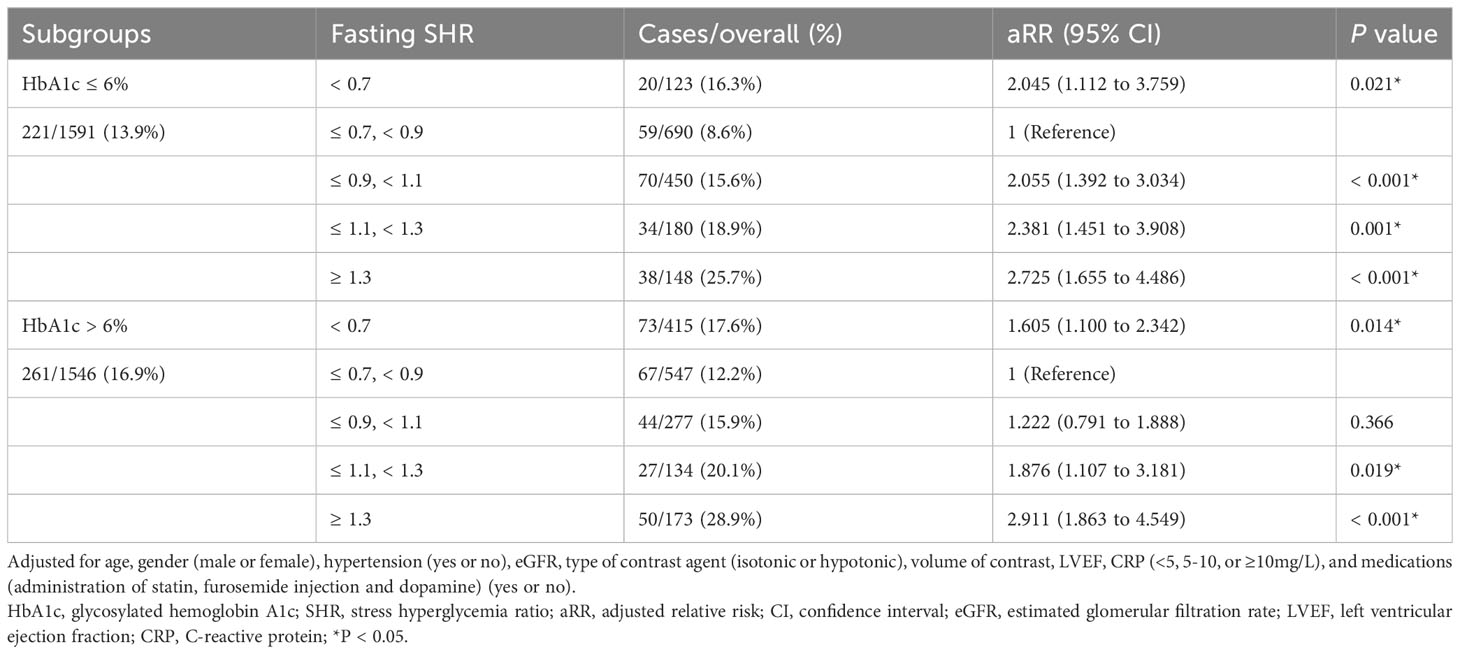
Table 5 Subgroup analysis according to stratification of HbA1c levels.
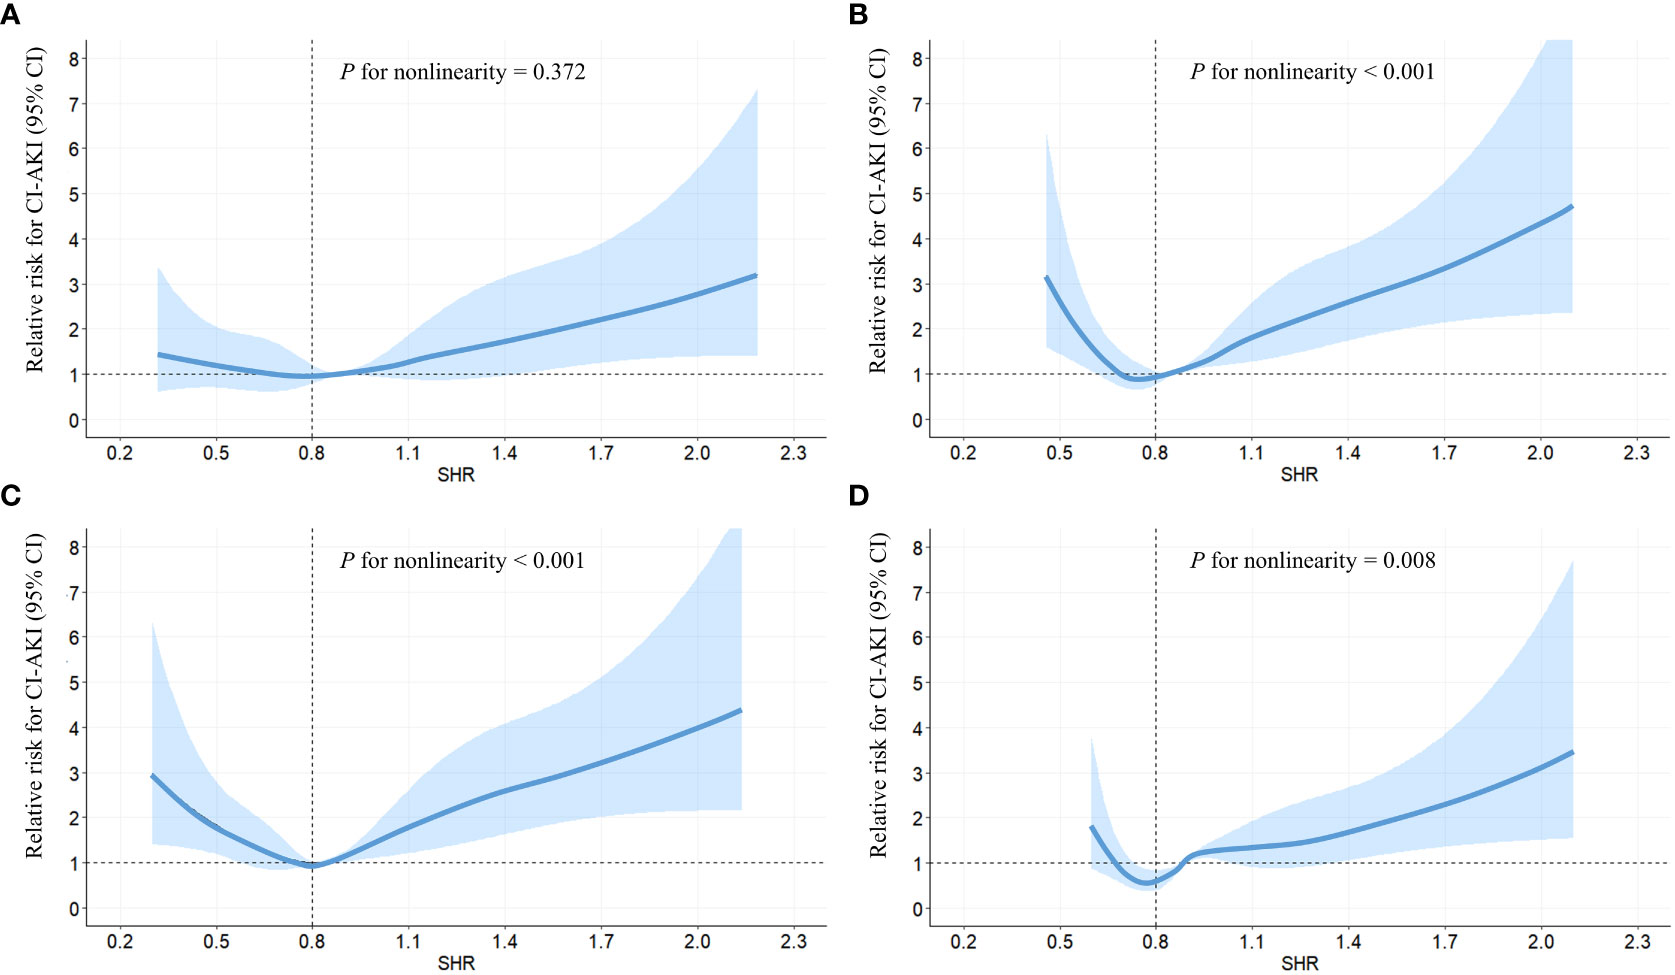
Figure 3 RCS analyses between fasting SHR and CI-AKI in different subgroups. RCS analyses were performed by stratifying the population into subgroups based on diabetes (yes (A) or no (B)) and HbA1c levels (> 6.0% (C) or ≤ 6.0% (D)); The relative risk of fasting SHR for CI-AKI is represented by the solid blue line, while the shaded area surrounding the line represents the 95% CI of the curve. CI-AKI, contrast-induced acute kidney injury; CI, confidence interval; RCS, restricted cubic spline; SHR, stress hyperglycemia ratio.
To assess the soundness of the study outcomes, two sensitivity analyses were conducted, including the exclusion of patients who experienced hypoglycemia throughout the initial assessment period and those who encountered a hyperglycemic crisis at the beginning of the study. Consistently, in both sensitivity analyses, a strong and statistically significant correlation was identified between the uppermost and lowermost ranges of fasting SHR and an elevated incidence of CI-AKI (Supplementary Tables 1, 2). Furthermore, the RCS modeling visually portrays the non-linear correlation between fasting SHR and CI-AKI in both sensitivity analyses (Supplementary Figure 1), aligning consistently with the findings observed in the overall population.
Discussion
The study demonstrated that within the cohort of individuals undergoing CAG or PCI, both the lowest and highest levels of fasting SHR exhibited a significant correlation with an increased incidence of CI-AKI. Importantly, this correlation was observed irrespective of whether the patients had diabetes or HbA1c > 6%.
Diabetes and preoperative blood glucose levels are now recognized as independent risk factors for CI-AKI (14, 24). However, previous studies have suggested that daily glycemic fluctuations (glycemic variability) may pose a greater risk for adverse cardiovascular events compared to sustained hyperglycemia (25, 26). Therefore, the glycemic variability is an important aspect that requires close attention. The ABG level alone cannot fully reflect the acute elevation of glucose upon hospital admission, as it is also influenced by the long-term glucose, especially in poorly controlled diabetic patients. Several studies have suggested that SHR may be a reliable biomarker for critical illness (16, 27). SHR is determined through the division of the ABG by the average glucose level obtained from HbA1c, which theoretically quantifies the relative glycemic rise compared to chronic glycemia over the past 8-12 weeks. Given the extensive utilization of glucose and HbA1c testing in clinical practice, coupled with the straightforward nature of SHR calculation, it is evident that SHR can be employed as a valuable tool for delivering prognostic information to hospitalized patients.
Several studies have already demonstrated the correlation between SHR and major adverse cardiovascular and cerebrovascular events (MACCE) (28–31). Yang reported that a high level of SHR might be an effective predictor for the incidence of MACCE after PCI (31). However, it is worth noting that this study might have overlooked the potential impact of low SHR levels on the incidence of MACCE. Additionally, the study did not consider the possibility of a non-linear relationship between SHR and the incidence of MACCE. According to Robert’s finding (16), the SHR has the potential to be a superior biomarker in predicting critical illnesses as compared to absolute high blood glucose levels. However, it is plausible that this study might neglect the potential correlation between the SHR calculated at lower blood glucose levels and patient prognosis. the SHR might potentially serve as a superior biomarker compared to absolute high blood glucose, but this study might disregard the relationship between SHR at lower blood glucose concentrations and patient prognosis. Therefore, in contrast to previous research that primarily categorized SHR based on quartiles or quintiles (27, 29, 32, 33), this extensive-scale study not only implemented more meticulous and specific categorizations but also accounted for the non-linear association between CI-AKI and SHR, as well as the influence of lower levels of SHR on CI-AKI. Additionally, meal timing also exerts an influence on ABG. In clinical practice, it is observed that certain patients may have already eaten when experiencing ischemic symptoms, while others may manifest symptoms prior to meals. Consequently, we postulated that the calculation of fasting SHR using FBG and HbA1c can more accurately reflect the degree of acute stress-induced hyperglycemia. According to our research findings, it is recommended that physicians pay more attention to patients with lower or higher fasting SHR values and take measures to prevent the occurrence of CI-AKI. For instance, in the case of diabetic patients, it is advisable to use a rational hypoglycemic regimen, avoiding excessive intensification of hypoglycemic medications that may cause a significant decrease in blood glucose levels. Additionally, informing preoperative patients about the importance of adhering to a balanced diet and avoiding excessive food consumption can prevent drastic fluctuations in blood glucose levels. Lastly, enhancing perioperative blood glucose monitoring can assist physicians in better understanding the dynamic changes in patients’ blood glucose levels. Furthermore, as shown in Table 1, a lower proportion of furosemide injection was observed in our study, which may be attributed to the fact that furosemide injection was not included in routine hydration therapy at our study center. Therefore, furosemide injection was only administered to patients with relevant comorbidities such as oedema and hypertension.
The association between high level fasting SHR and CI-AKI can be elucidated through several mechanisms. Firstly, stress hyperglycemia may engender increased stress responses, encompassing mitochondrial dysfunction, oxidative stress, endoplasmic reticulum stress, thereby collectively precipitating a cascade of pathological alterations within renal tissue, ultimately culminating in renal dysfunction and an escalated susceptibility to CI-AKI (34–39). Secondly, the equilibrium between nitric oxide (NO) bioavailability and the accumulation of reactive oxygen species (ROS) in endothelial cells may be disrupted by stress hyperglycemia, which may cause endothelial dysfunction and subsequently induce CI-AKI (40–42). Additionally, stress hyperglycemia may also stimulate the advanced glycation end products (AGEs), leading to microvascular damage and subsequent renal glomerulosclerosis, which may further increase the occurrence of CI-AKI (43, 44). The mechanisms underlying how low levels of fasting SHR contribute to CI-AKI are still unclear. Nevertheless, it remains within the realm of reasoned speculation to provide plausible explanations. From the calculation formula of fasting SHR, patients with low fasting SHR values are often associated with lower blood glucose levels. Previous studies have reported that under hypoglycemic conditions, sympathetic adrenal activation leads to increased levels of adrenaline and noradrenaline, which subsequently cause hemodynamic changes. Additionally, it can also induce endothelial dysfunction, elevate inflammation levels, and increase levels of tissue plasminogen activator and aldosterone. These factors collectively increase the risk of systemic atherosclerosis, including renal artery sclerosis, which may partly explain the association between low fasting SHR levels and increased incidence of CI-AKI (45–47). Furthermore, some patients with low fasting SHR values may also exhibit higher levels of HbA1c. This may indicate poor glycemic control in these patients during routine times, but hypoglycemic episodes occur before CAG/PCI procedure. Such patients display significant glycemic fluctuations, which previous studies have shown could impair vascular endothelial function, increase inflammation levels, and subsequently cause renal artery injury leading to CI-AKI (48, 49).
There are several limitations to this study that should be acknowledged. Firstly, the calculation of fasting SHR requires patients to obtain blood glucose values in a fasting state, which may not be practical for patients with day-surgery or those presenting with acute coronary syndrome and undergoing urgent PCI. Therefore, fasting SHR may not be applicable for such patients. Then, the retrospective nature of this study introduces unavoidable biases, highlighting the urgent need for a prospective study with a large sample size to provide robust support for our results. Furthermore, it is important to acknowledge that the possibility of selection bias cannot be entirely eliminated as our study only included participants who had simultaneous measurements of FBG and HbA1c levels. Lastly, it should be emphasized that this study solely encompassed the Chinese population, thus necessitating further investigation to ascertain the generalizability of these findings to other populations in different countries.
Conclusion
In populations undergoing CAG or PCI, both lowest and highest levels of fasting SHR were significantly associated with an increased occurrence of CI-AKI.
Data availability statement
The original contributions presented in the study are included in the article/Supplementary Material. Further inquiries can be directed to the corresponding authors.
Ethics statement
The studies involving humans were approved by the Ethics Committee of Sir Run Run Shaw Hospital, Zhejiang University (20220228-30). The studies were conducted in accordance with the local legislation and institutional requirements. Written informed consent for participation was not required from the participants or the participants’ legal guardians/next of kin in accordance with the national legislation and institutional requirements.
Author contributions
YS: Writing – original draft, Writing – review & editing. ML: Conceptualization, Data curation, Writing – original draft. FG: Supervision, Writing – review & editing. SY: Validation, Writing – review & editing. XB: Writing – review & editing. QZ: Writing – review & editing. YT: Writing – review & editing. ZC: Writing – review & editing. DL: Writing – review & editing. WZ: Writing – review & editing. GF: Writing – review & editing. MW: Writing – review & editing.
Funding
The author(s) declare financial support was received for the research, authorship, and/or publication of this article. This study received financial support from the National Natural Science Foundation of China, grant number 81800212.
Conflict of interest
The authors declare that the research was conducted in the absence of any commercial or financial relationships that could be construed as a potential conflict of interest.
Publisher’s note
All claims expressed in this article are solely those of the authors and do not necessarily represent those of their affiliated organizations, or those of the publisher, the editors and the reviewers. Any product that may be evaluated in this article, or claim that may be made by its manufacturer, is not guaranteed or endorsed by the publisher.
Supplementary material
The Supplementary Material for this article can be found online at: https://www.frontiersin.org/articles/10.3389/fendo.2023.1300373/full#supplementary-material
Abbreviations
CAD, Coronary artery disease; CAG, coronary angiography; PCI, percutaneous coronary intervention; CI-AKI, contrast-induced acute kidney injury; ESUR, European Society of Urogenital Radiology; Scr, serum creatinine; SHR, stress hyperglycemia ratio; ABG, admission blood glucose; HbA1c, glycosylated hemoglobin A1c; FBG, fasting blood glucose; LVEF, left ventricular ejection fraction; SD, standard deviation; eGFR, estimated glomerular filtration rate; CRP, C-reactive protein; RCS, restricted cubic spline; aRR, adjusted relative risk; CCB, calcium channel blocker; ACEI, angiotensin converting enzyme inhibitor; ARB, angiotensin receptor blocker; CI, confidence interval; MACCE, major adverse cardiovascular and cerebrovascular events; NO, nitric oxide; ROS, reactive oxygen species; AGEs, advanced glycation end products.
References
1. Piccolo R, Giustino G, Mehran R, Windecker S. Stable coronary artery disease: revascularisation and invasive strategies. Lancet (London England) (2015) 386(9994):702–13. doi: 10.1016/S0140-6736(15)61220-X
2. Virani SS, Alonso A, Aparicio HJ, Benjamin EJ, Bittencourt MS, Callaway CW, et al. Heart disease and stroke statistics-2021 update: A report from the American heart association. Circulation (2021) 143(8):e254–743. doi: 10.1161/CIR.0000000000000950
3. Hakeem A, Uretsky BF. Role of postintervention fractional flow reserve to improve procedural and clinical outcomes. Circulation (2019) 139(5):694–706. doi: 10.1161/CIRCULATIONAHA.118.035837
4. Mentias A, Sarrazin MV, Saad M, Panaich S, Kapadia S, Horwitz PA, et al. Long-term outcomes of coronary stenting with and without use of intravascular ultrasound. JACC Cardiovasc Interventions (2020) 13(16):1880–90. doi: 10.1016/j.jcin.2020.04.052
5. Räber L, Ueki Y. Outcomes of intravascular ultrasound-guided percutaneous coronary intervention in the United States. JACC Cardiovasc Interventions (2020) 13(16):1891–3. doi: 10.1016/j.jcin.2020.06.031
6. Zhao S, Chen Y, Wang Q, Zhu B, Wei Z, Wang Z, et al. Benefits of successful percutaneous coronary intervention in chronic total occlusion patients with diabetes. Cardiovasc Diabetol (2022) 21(1):271. doi: 10.1186/s12933-022-01708-0
7. Harolds JA. Quality and safety in health care, part XXXIX: complications from the PCI procedure. Clin Nucl Med (2018) 43(9):672–3. doi: 10.1097/RLU.0000000000002025
8. James MT, Ghali WA, Knudtson ML, Ravani P, Tonelli M, Faris P, et al. Associations between acute kidney injury and cardiovascular and renal outcomes after coronary angiography. Circulation (2011) 123(4):409–16. doi: 10.1161/CIRCULATIONAHA.110.970160
9. James MT, Har BJ, Tyrrell BD, Faris PD, Tan Z, Spertus JA, et al. Effect of clinical decision support with audit and feedback on prevention of acute kidney injury in patients undergoing coronary angiography: A randomized clinical trial. Jama (2022) 328(9):839–49. doi: 10.1001/jama.2022.13382
10. McCullough PA, Choi JP, Feghali GA, Schussler JM, Stoler RM, Vallabahn RC, et al. Contrast-induced acute kidney injury. J Am Coll Cardiol (2016) 68(13):1465–73. doi: 10.1016/j.jacc.2016.05.099
11. Li JH, He NS. Prevention of iodinated contrast-induced nephropathy. Chin Med J (2011) 124(23):4079–82.
12. Stacul F, van der Molen AJ, Reimer P, Webb JA, Thomsen HS, Morcos SK, et al. Contrast induced nephropathy: updated ESUR Contrast Media Safety Committee guidelines. Eur Radiol (2011) 21(12):2527–41. doi: 10.1007/s00330-011-2225-0
13. Seeliger E, Sendeski M, Rihal CS, Persson PB. Contrast-induced kidney injury: mechanisms, risk factors, and prevention. Eur Heart J (2012) 33(16):2007–15. doi: 10.1093/eurheartj/ehr494
14. Stolker JM, McCullough PA, Rao S, Inzucchi SE, Spertus JA, Maddox TM, et al. Pre-procedural glucose levels and the risk for contrast-induced acute kidney injury in patients undergoing coronary angiography. J Am Coll Cardiol (2010) 55(14):1433–40. doi: 10.1016/j.jacc.2009.09.072
15. Yuan Y, Qiu H, Hu XY, Luo T, Gao XJ, Zhao XY, et al. Risk factors of contrast-induced acute kidney injury in patients undergoing emergency percutaneous coronary intervention. Chin Med J (2017) 130(1):45–50. doi: 10.4103/0366-6999.196578
16. Roberts GW, Quinn SJ, Valentine N, Alhawassi T, O'Dea H, Stranks SN, et al. Relative hyperglycemia, a marker of critical illness: introducing the stress hyperglycemia ratio. J Clin Endocrinol Metab (2015) 100(12):4490–7. doi: 10.1210/jc.2015-2660
17. Chu H, Huang C, Tang Y, Dong Q, Guo Q. The stress hyperglycemia ratio predicts early hematoma expansion and poor outcomes in patients with spontaneous intracerebral hemorrhage. Ther Adv Neurological Disord (2022) 15:17562864211070681. doi: 10.1177/17562864211070681
18. Huang YW, An YH, Yin XS, Li ZP. Association of the stress hyperglycemia ratio and clinical outcomes in patients with cardiovascular diseases: a systematic review and meta-analysis. Eur Rev Med Pharmacol Sci (2022) 26(24):9258–69. doi: 10.26355/eurrev_202212_30679
19. Liu B, Chen Y, Yu L, Zhou M. Stress hyperglycemia ratio is associated with systemic inflammation and clinical outcomes in diabetic inpatients with pneumonia on admission. J Diab (2023) 15(7):545–56. doi: 10.1111/1753-0407.13398
20. Zhang Y, Song H, Bai J, Xiu J, Wu G, Zhang L, et al. Association between the stress hyperglycemia ratio and severity of coronary artery disease under different glucose metabolic states. Cardiovasc Diabetol (2023) 22(1):29. doi: 10.1186/s12933-023-01759-x
21. Cui K, Fu R, Yang J, Xu H, Yin D, Song W, et al. The impact of fasting stress hyperglycemia ratio, fasting plasma glucose and hemoglobin A1c on in-hospital mortality in patients with and without diabetes: findings from the China acute myocardial infarction registry. Cardiovasc Diabetol (2023) 22(1):165. doi: 10.1186/s12933-023-01868-7
22. Fu R, Cui K, Yang J, Xu H, Yin D, Song W, et al. Fasting stress hyperglycemia ratio and in-hospital mortality after acute myocardial infarction in patients with different glucose metabolism status: Results from China acute myocardial infarction registry. Diabetes Res Clin Practice (2023) 196:110241. doi: 10.1016/j.diabres.2023.110241
23. Nathan DM, Kuenen J, Borg R, Zheng H, Schoenfeld D, Heine RJ. Translating the A1C assay into estimated average glucose values. Diabetes Care (2008) 31(8):1473–8. doi: 10.2337/dc08-0545
24. Silver SA, Shah PM, Chertow GM, Harel S, Wald R, Harel Z. Risk prediction models for contrast induced nephropathy: systematic review. BMJ (Clinical Res ed) (2015) 351:h4395. doi: 10.1136/bmj.h4395
25. Nusca A, Lauria Pantano A, Melfi R, Proscia C, Maddaloni E, Contuzzi R, et al. Glycemic variability assessed by continuous glucose monitoring and short-term outcome in diabetic patients undergoing percutaneous coronary intervention: an observational pilot study. J Diabetes Res (2015) 2015:250201. doi: 10.1155/2015/250201
26. Xia J, Xu J, Hu S, Hao H, Yin C, Xu D. Impact of glycemic variability on the occurrence of periprocedural myocardial infarction and major adverse cardiovascular events (MACE) after coronary intervention in patients with stable angina pectoris at 6months follow-up. Clin Chim Acta; Int J Clin Chem (2017) 471:196–200. doi: 10.1016/j.cca.2017.06.014
27. Xu W, Yang YM, Zhu J, Wu S, Wang J, Zhang H, et al. Predictive value of the stress hyperglycemia ratio in patients with acute ST-segment elevation myocardial infarction: insights from a multi-center observational study. Cardiovasc Diabetol (2022) 21(1):48. doi: 10.1186/s12933-022-01479-8
28. Mi D, Li Z, Gu H, Jiang Y, Zhao X, Wang Y, et al. Stress hyperglycemia is associated with in-hospital mortality in patients with diabetes and acute ischemic stroke. CNS Neurosci Ther (2022) 28(3):372–81. doi: 10.1111/cns.13764
29. Wei QC, Chen YW, Gao QY, Ren KD, Liu YB, He F, et al. Association of stress hyperglycemia with clinical outcomes in patients with ST-elevation myocardial infarction undergoing percutaneous coronary intervention: a cohort study. Cardiovasc Diabetol (2023) 22(1):85. doi: 10.1186/s12933-023-01812-9
30. Yang J, Zheng Y, Li C, Gao J, Meng X, Zhang K, et al. The impact of the stress hyperglycemia ratio on short-term and long-term poor prognosis in patients with acute coronary syndrome: insight from a large cohort study in Asia. Diabetes Care (2022) 45(4):947–56. doi: 10.2337/dc21-1526
31. Yang Y, Kim TH, Yoon KH, Chung WS, Ahn Y, Jeong MH, et al. The stress hyperglycemia ratio, an index of relative hyperglycemia, as a predictor of clinical outcomes after percutaneous coronary intervention. Int J Cardiol (2017) 241:57–63. doi: 10.1016/j.ijcard.2017.02.065
32. Abdu FA, Galip J, Qi P, Zhang W, Mohammed AQ, Liu L, et al. Association of stress hyperglycemia ratio and poor long-term prognosis in patients with myocardial infarction with non-obstructive coronary arteries. Cardiovasc Diabetol (2023) 22(1):11. doi: 10.1186/s12933-023-01742-6
33. Zhou Y, Liu L, Huang H, Li N, He J, Yao H, et al. 'Stress hyperglycemia ratio and in-hospital prognosis in non-surgical patients with heart failure and type 2 diabetes. Cardiovasc Diabetol (2022) 21(1):290. doi: 10.1186/s12933-022-01728-w
34. Couto SMF, da Fonseca CD, Watanabe M, de Fátima Fernandes Vattimo M. Protection of coenzyme Q10 against contrast-induced acute kidney injury in male diabetic rats. Diabetol Metab Syndrome (2021) 13(1):69. doi: 10.1186/s13098-021-00689-6
35. DeFronzo RA, Reeves WB, Awad AS. Pathophysiology of diabetic kidney disease: impact of SGLT2 inhibitors. Nat Rev Nephrol (2021) 17(5):319–34. doi: 10.1038/s41581-021-00393-8
36. Jha JC, Ho F, Dan C, Jandeleit-Dahm K. A causal link between oxidative stress and inflammation in cardiovascular and renal complications of diabetes. Clin Sci (London Engl 1979) (2018) 132(16):1811–36. doi: 10.1042/CS20171459
37. Paneni F, Beckman JA, Creager MA, Cosentino F. Diabetes and vascular disease: pathophysiology, clinical consequences, and medical therapy: part I. Eur Heart J (2013) 34(31):2436–43. doi: 10.1093/eurheartj/eht149
38. Peng J, Li X, Zhang D, Chen JK, Su Y, Smith SB, et al. Hyperglycemia, p53, and mitochondrial pathway of apoptosis are involved in the susceptibility of diabetic models to ischemic acute kidney injury. Kidney Int (2015) 87(1):137–50. doi: 10.1038/ki.2014.226
39. Xu L, Zhou Y, Wang G, Bo L, Jin B, Dai L, et al. The UDPase ENTPD5 regulates ER stress-associated renal injury by mediating protein N-glycosylation. Cell Death Disease (2023) 14(2):166. doi: 10.1038/s41419-023-05685-4
40. Kanwar YS, Sun L, Xie P, Liu FY, Chen S. A glimpse of various pathogenetic mechanisms of diabetic nephropathy. Annu Rev Pathol (2011) 6:395–423. doi: 10.1146/annurev.pathol.4.110807.092150
41. Lee TF, Tommasi S, Bersten A, Heilbronn LK, Sotgia S, Zinellu A, et al. Does hyperglycemia affect arginine metabolites in critically ill patients? A prospective cohort and in vitro study. Diabetol Metab Syndrome (2023) 15(1):68. doi: 10.1186/s13098-023-01035-8
42. Prabhakar S, Starnes J, Shi S, Lonis B, Tran R. Diabetic nephropathy is associated with oxidative stress and decreased renal nitric oxide production. J Am Soc Nephrol JASN (2007) 18(11):2945–52. doi: 10.1681/ASN.2006080895
43. Busch M, Franke S, Rüster C, Wolf G. Advanced glycation end-products and the kidney. Eur J Clin Invest (2010) 40(8):742–55. doi: 10.1111/j.1365-2362.2010.02317.x
44. Tuleta I, Frangogiannis NG. Diabetic fibrosis. Biochim Biophys Acta Mol basis Disease (2021) 1867(4):166044. doi: 10.1016/j.bbadis.2020.166044
45. Connelly KA, Yan AT, Leiter LA, Bhatt DL, Verma S. Cardiovascular implications of hypoglycemia in diabetes mellitus. Circulation (2015) 132(24):2345–50. doi: 10.1161/CIRCULATIONAHA.115.015946
46. Hanefeld M, Duetting E, Bramlage P. Cardiac implications of hypoglycaemia in patients with diabetes - a systematic review. Cardiovasc Diabetol (2013) 12:135. doi: 10.1186/1475-2840-12-135
47. Lee YL, Chen BK, Lin KD, Su RW, Lee MY, Hsiao PJ, et al. The impact of severe hypoglycemia on renal impairment in type 2 diabetes. Diabetes Res Clin Practice (2015) 108(3):448–55. doi: 10.1016/j.diabres.2015.02.028
48. Cavalot F. Do data in the literature indicate that glycaemic variability is a clinical problem? Glycaemic variability and vascular complications of diabetes. Diab Obes Metab (2013) 15(Suppl 2):3–8. doi: 10.1111/dom.12140
Keywords: fasting stress hyperglycemia ratio, contrast-induced acute kidney injury, serum creatinine elevation, coronary angiography, diabetes
Citation: Shan Y, Lin M, Gu F, Ying S, Bao X, Zhu Q, Tao Y, Chen Z, Li D, Zhang W, Fu G and Wang M (2023) Association between fasting stress hyperglycemia ratio and contrast-induced acute kidney injury in coronary angiography patients: a cross-sectional study. Front. Endocrinol. 14:1300373. doi: 10.3389/fendo.2023.1300373
Received: 23 September 2023; Accepted: 30 November 2023;
Published: 13 December 2023.
Edited by:
Lingfang Zeng, King’s College London, United KingdomReviewed by:
Amirmohammad Khalaji, Tehran University of Medical Sciences, IranClaudio Proscia, Liverpool Heart and Chest Hospital NHS Trust, United Kingdom
Copyright © 2023 Shan, Lin, Gu, Ying, Bao, Zhu, Tao, Chen, Li, Zhang, Fu and Wang. This is an open-access article distributed under the terms of the Creative Commons Attribution License (CC BY). The use, distribution or reproduction in other forums is permitted, provided the original author(s) and the copyright owner(s) are credited and that the original publication in this journal is cited, in accordance with accepted academic practice. No use, distribution or reproduction is permitted which does not comply with these terms.
*Correspondence: Min Wang, wangminsyf30508@zju.edu.cn; Guosheng Fu, fugs@zju.edu.cn
†These authors have contributed equally to this work and share the first authorship