Science and scientists from children’s point of view: comparison and gender outlooks among 2011 and 2021 primary school student drawings
 Giuliana D’Addezio
 Neva Besker
- 1Istituto Nazionale di Geofisica e Vulcanologia (INGV), Rome, Italy
- 2CINECA, HPC Department, Rome, Italy
This article explores the evolving perceptions of science and scientists from the unique perspective of Italian primary school children by comparing students’ drawings from two distinct periods, 2011 and 2021. A notable research gap exists in understanding how the perceptions of science and scientists among primary school children have evolved over time and if it is different for gender and grade level. The methodology involves a qualitative analysis of drawings examining the presence, the number and gender of depicted scientists, stereotypes, scientific topics, inventions, tools, location, and accompanying speech bubbles. The statistical analysis emphasizes the differences between how girls and boys represent science and scientists. From the data, a generally positive picture of the work of scientists emerges, as well as a great level of confidence in the potential of science. Notably, while the prevailing image of a scientist is still predominantly male, the 2021 dataset demonstrates a significant increase in depictions of female scientists, primarily drawn by girls, signaling an increased sense of belonging and potential for girls to pursue careers in science. Environmental and health-related scientific themes have gained prominence, accompanied by an increase in inventive ideas. The data highlights the children’s awareness of pressing global issues, such as climate change and healthcare, caused by Covid emergency. Furthermore, the results contribute to evaluate how science showed itself over ten years, if it has led to an effective shared science and a less stereotyped image, also encouraging gender equality.
1 Introduction
Starting in 2005, the Istituto Nazionale di Geofisica e Vulcanologia (INGV), the Italian Institute of Geophysical Research, projected the creation of calendars designed for schools and realized with drawings from a contest for primary school children. Each year, schools enthusiastically participate by sending in pupil’s drawings on specific themes, which change each year and are selected as part of the Earth science subjects (D’Addezio, 2020).
Involving primary school children in this project may bring them closer to science and give them the opportunity to investigate their perspective on the Earth, science, the environment, and sustainable behavior. Indeed, children’s artwork may provide insights into their feelings and thoughts about the world and how it works. Drawing is an important activity for children since it encourages their imagination and represents an amazing way of displaying emotions.
Researchers in many areas have studied children’s drawings because the way children depict a topic provides information about their feelings and thoughts (Crook, 1985; Thomas and Silk, 1990). Many authors in the field of education have been focusing on children’s drawings (Cherney et al., 2006; Farokhi and Hashemi, 2011). The use of art as a tool for teaching and learning science is described and discussed in the literature (Katz, 2017). For example, artwork has been used to investigate learning strategies (van der Veen, 2012) and to analyze children’s volcanic risk awareness (Brasini et al., 2020) and their perceptions of the environment (Günindi, 2012).
In this paper, we present and compare the results of two sets of drawings collected for two different competitions for the INGV school calendar. The competitions, promoted in a ten-year range, had a similar and comparable main topic: children’s vision of science and scientists. The analysis highlights differences, similarities, and convergences; whether boys and girls have the same perception of scientists, and their relationship to science and technology; whether stereotypical images of science and scientists persist, or whether something is changing; whether there is a gap between children’s perceptions and scientists’ reality, and how this gap can be closed; and whether anything has changed in the last 10 years.
2 Previous studies and background
The Draw-A-Scientist Test (DAST), asking students to “draw a picture of a scientist,” has been used extensively in research to assess children’s stereotypical views of scientists and to track changes in those views over time (Chambers, 1983; Maoldomhnaigh and Hunt, 1988; Newton and Newton, 1992, 1998; She, 1998; Fung, 2002). The first DAST study on children’s visual images of scientists was developed by Chambers (1983) and identified seven indicators that consistently appeared in students’ drawings of scientists: (a) lab coat, (b) eyeglasses, (c) facial hair, (d) symbols of research (scientific instruments and laboratory equipment), (e) symbols of knowledge (books, filing cabinets), (f) technology, and (g) relevant captions such as formulae and the “eureka” syndrome. Chambers analyzed more than 4,800 drawings by students aged 5 to 11 in the United States and Canada over an 11-year period beginning in 1966.
A-Scientist-Checklist DAST-C (Finson et al., 1995) and the DAST-Rubric (Farland-Smith, 2012) have been created with different stereotypical indicators to systematically collect the stereotypical characteristics depicted in children’s drawings of scientists. A modified version of the DAST test was used by others, using a combination of DAST and surveys (Rodari, 2007; Losh et al., 2008) or adapting the DAST indicators to contemporary society (Ruiz-Mallén and Escalas, 2012; Bozzato et al., 2021).
Regarding investigations on the perception of scientists in Europe, Rodari (2007) examined a European sample of nearly 1,000 drawings. Children do not consider science an exclusively male job (but this tendency decreases as they grow older); consequently, they do not think that to succeed in this job, a woman has to relinquish her femininity. In that work, chemistry is the science most represented, followed by biology, with drawings of animals and plants, medicine and pharmacy, and astronomy. Crazy male scientists are present. A small but encouraging percentage of drawings expresses a resolute appreciation for science as a carrier of progress and a problem solver. Two main fields where this beneficial view of science operates are health and the environment.
Ruiz-Mallén and Escalas (2012) analyzed the perceived image of scientists in Catalonia, Spain, using 236 drawings of children and adolescents. They concluded that Catalan children have a stereotypical image of scientists and suggest that interaction between children and young scientists needs to be promoted to encourage children to understand the work of scientists better, develop confidence in science, and generate interest in scientific careers. Similar conclusions were reached by Christidou et al. (2012), who analyzed hundreds of drawings made by Greek children and young people for a competition held as part of the 2007 Researchers’ Night.
Limiting their study to Italian cases, Di Benedetto (2009) examined 1,300 drawings from 72 classes from Italian primary and secondary schools. They noticed that scientists and chemists often wear white coats, badges, and glasses and are depicted together with tubes, microscopes, or other lab equipment, while astronomers are often represented observing the stars. In drawings of scientists and chemists, there is some degree of disorder and confusion, dangerous elements are present, and the scientist looks like he is confused; on the contrary, astronomers look contemplative. On the one hand, some stereotypes seem to survive, and on the other hand, a new trend appears. Scientists wear fashionable T-shirts and listen to music like ordinary people. They seem to go out of their labs and live less eccentric lives. An analysis of the perceived image of science, scientists, and inventions was conducted in 2011 using drawings made by children for the INGV calendar competition held in Italian primary schools. The analysis highlighted a persistent gender stereotype perception in drawing scientists, even with signals of innovation (Rubbia et al., 2015).
Bozzato et al. (2021) studied 686 drawings of Italian primary school students and found that children typically depicted scientists as male, with positive facial expressions, often wearing coats, engaged in scientific work, working indoors, in solitary, and surrounded by scientific instruments. The participants tended to draw scientists corresponding to their biological sex, boys who participated made greater use of stereotypical indicators.
Children’s perceptions of science and scientists are likely to be influenced by a range of social and cultural factors (Brotman and Moore, 2008). Focusing on elementary school students is the period when science topics are included in children’s curricula in Italy, the possibility of being exposed to the stereotype of the scientist through teachers’ attitudes, scientist representation in the schoolbooks (Elgar, 2004), and media portrayals is increasing. Examining the stereotypical views that children hold about scientists could be the first indicator of an impact on individuals’ academic career choices (Master et al., 2021). In particular, gender and ethnic stereotypes or prejudice may influence the sense of belonging, a potent psychological motivator, and therefore, may influence the interest in the field (Brickhouse, 1998; Chemers et al., 2011; Archer and DeWitt, 2015; Bian et al., 2017). Children need to have role models in science books (Blumberg, 2008; Pienta and Smith, 2012) and in real life. Students with negative attitudes toward science and scientists may be deterred from pursuing these subjects and academic pathways.
3 School calendars as image datasets
The title of the 2011 calendar competition was “Scienziato anche io! La Scienza e gli scienziati visti dai bambini”: I’m a scientist too! Science and scientists from the point of view of children.
As part of the competition, children were asked to create a drawing, choosing from three suggestions: (1) How do you imagine a scientist and how do you imagine the daily activities of a researcher?, (2) What invention do you consider the most important among all you know?, (3) If you were a scientist, what would you invent?
For the 2021 competition, we proposed the title: “La Scienza in crescita, immaginare la scienza del Futuro”: Growing Science, let us imagine the science of the Future. Within this theme, we asked children to develop the following topics: (1) How do you imagine a scientist’s life?, (2) How do you imagine daily research activities in the future?, (3) What tools do researchers work with?, (4) If you were a scientist, what would you invent? The themes provide the opportunity for a wide range of interpretations and allow teachers to easily integrate the proposed competition into the school program.
For the 2011 calendar, 884 drawings were collected between March and June 2010 and sent by 39 schools distributed throughout 21 Italian Provinces. The competition for the 2020–2021 calendar started just before the COVID-19 pandemic, during which, Italian schools were forced to adopt distance learning. Despite these exceptional conditions, 31 schools, homogeneously distributed in 25 Italian Provinces proposed the competition to the students and submitted 332 drawings. We chose the most significant drawings for each competition and included them in the calendars (Figures 1, 2). Considering the scholastic year, the 2021 calendar was realized within 16 months, from September 2020 to December 2021. The graphic designs of the calendars were developed and realized by the INGV Laboratorio Grafica e Immagini, Graphics and Images Laboratory (Riposati et al., 2020). Each graphic project was inspired by the theme of the competition and realized considering the heterogeneity of the drawings, using different techniques, colors, and subjects, but always focusing on the children’s work. The participating schools received educational materials produced by INGV and copies of the calendars. The latter were also distributed to the schools participating in INGV projects and events.
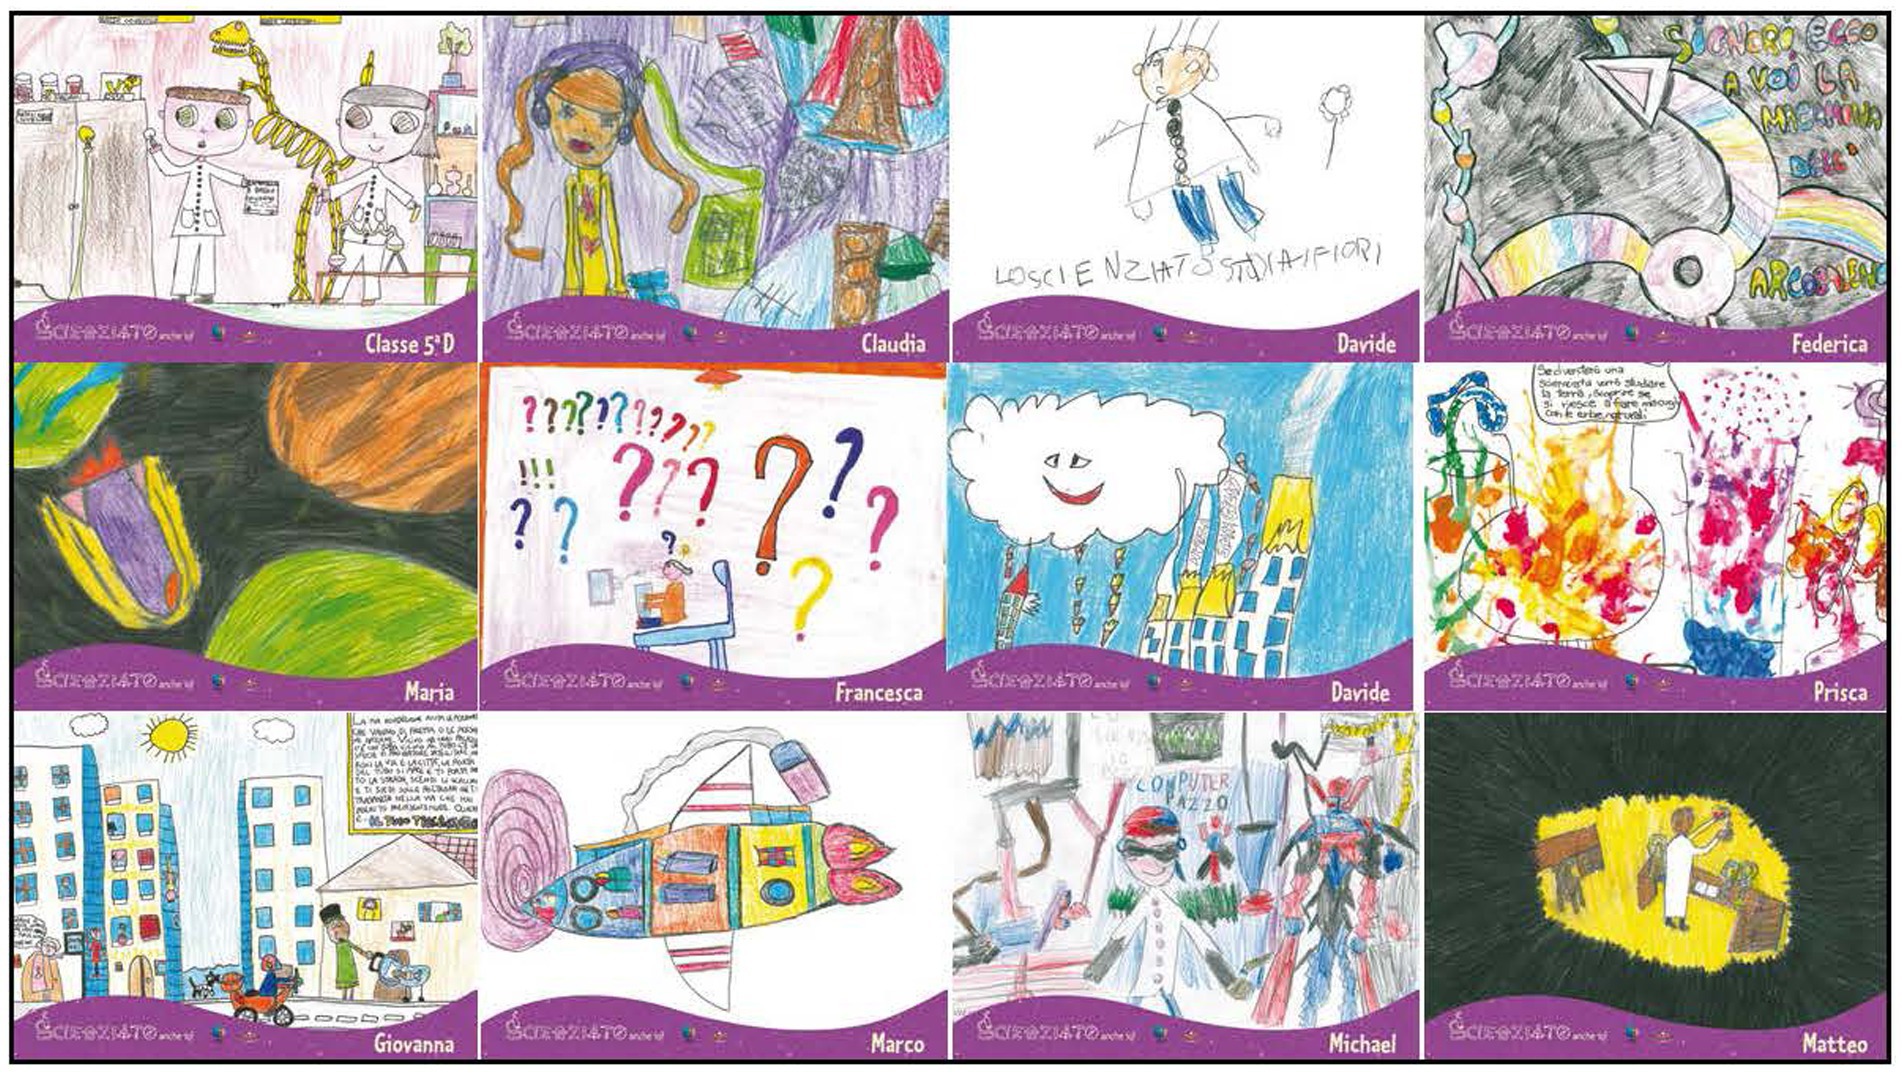
Figure 1. Ensemble of the 2011 calendar awarded drawings.
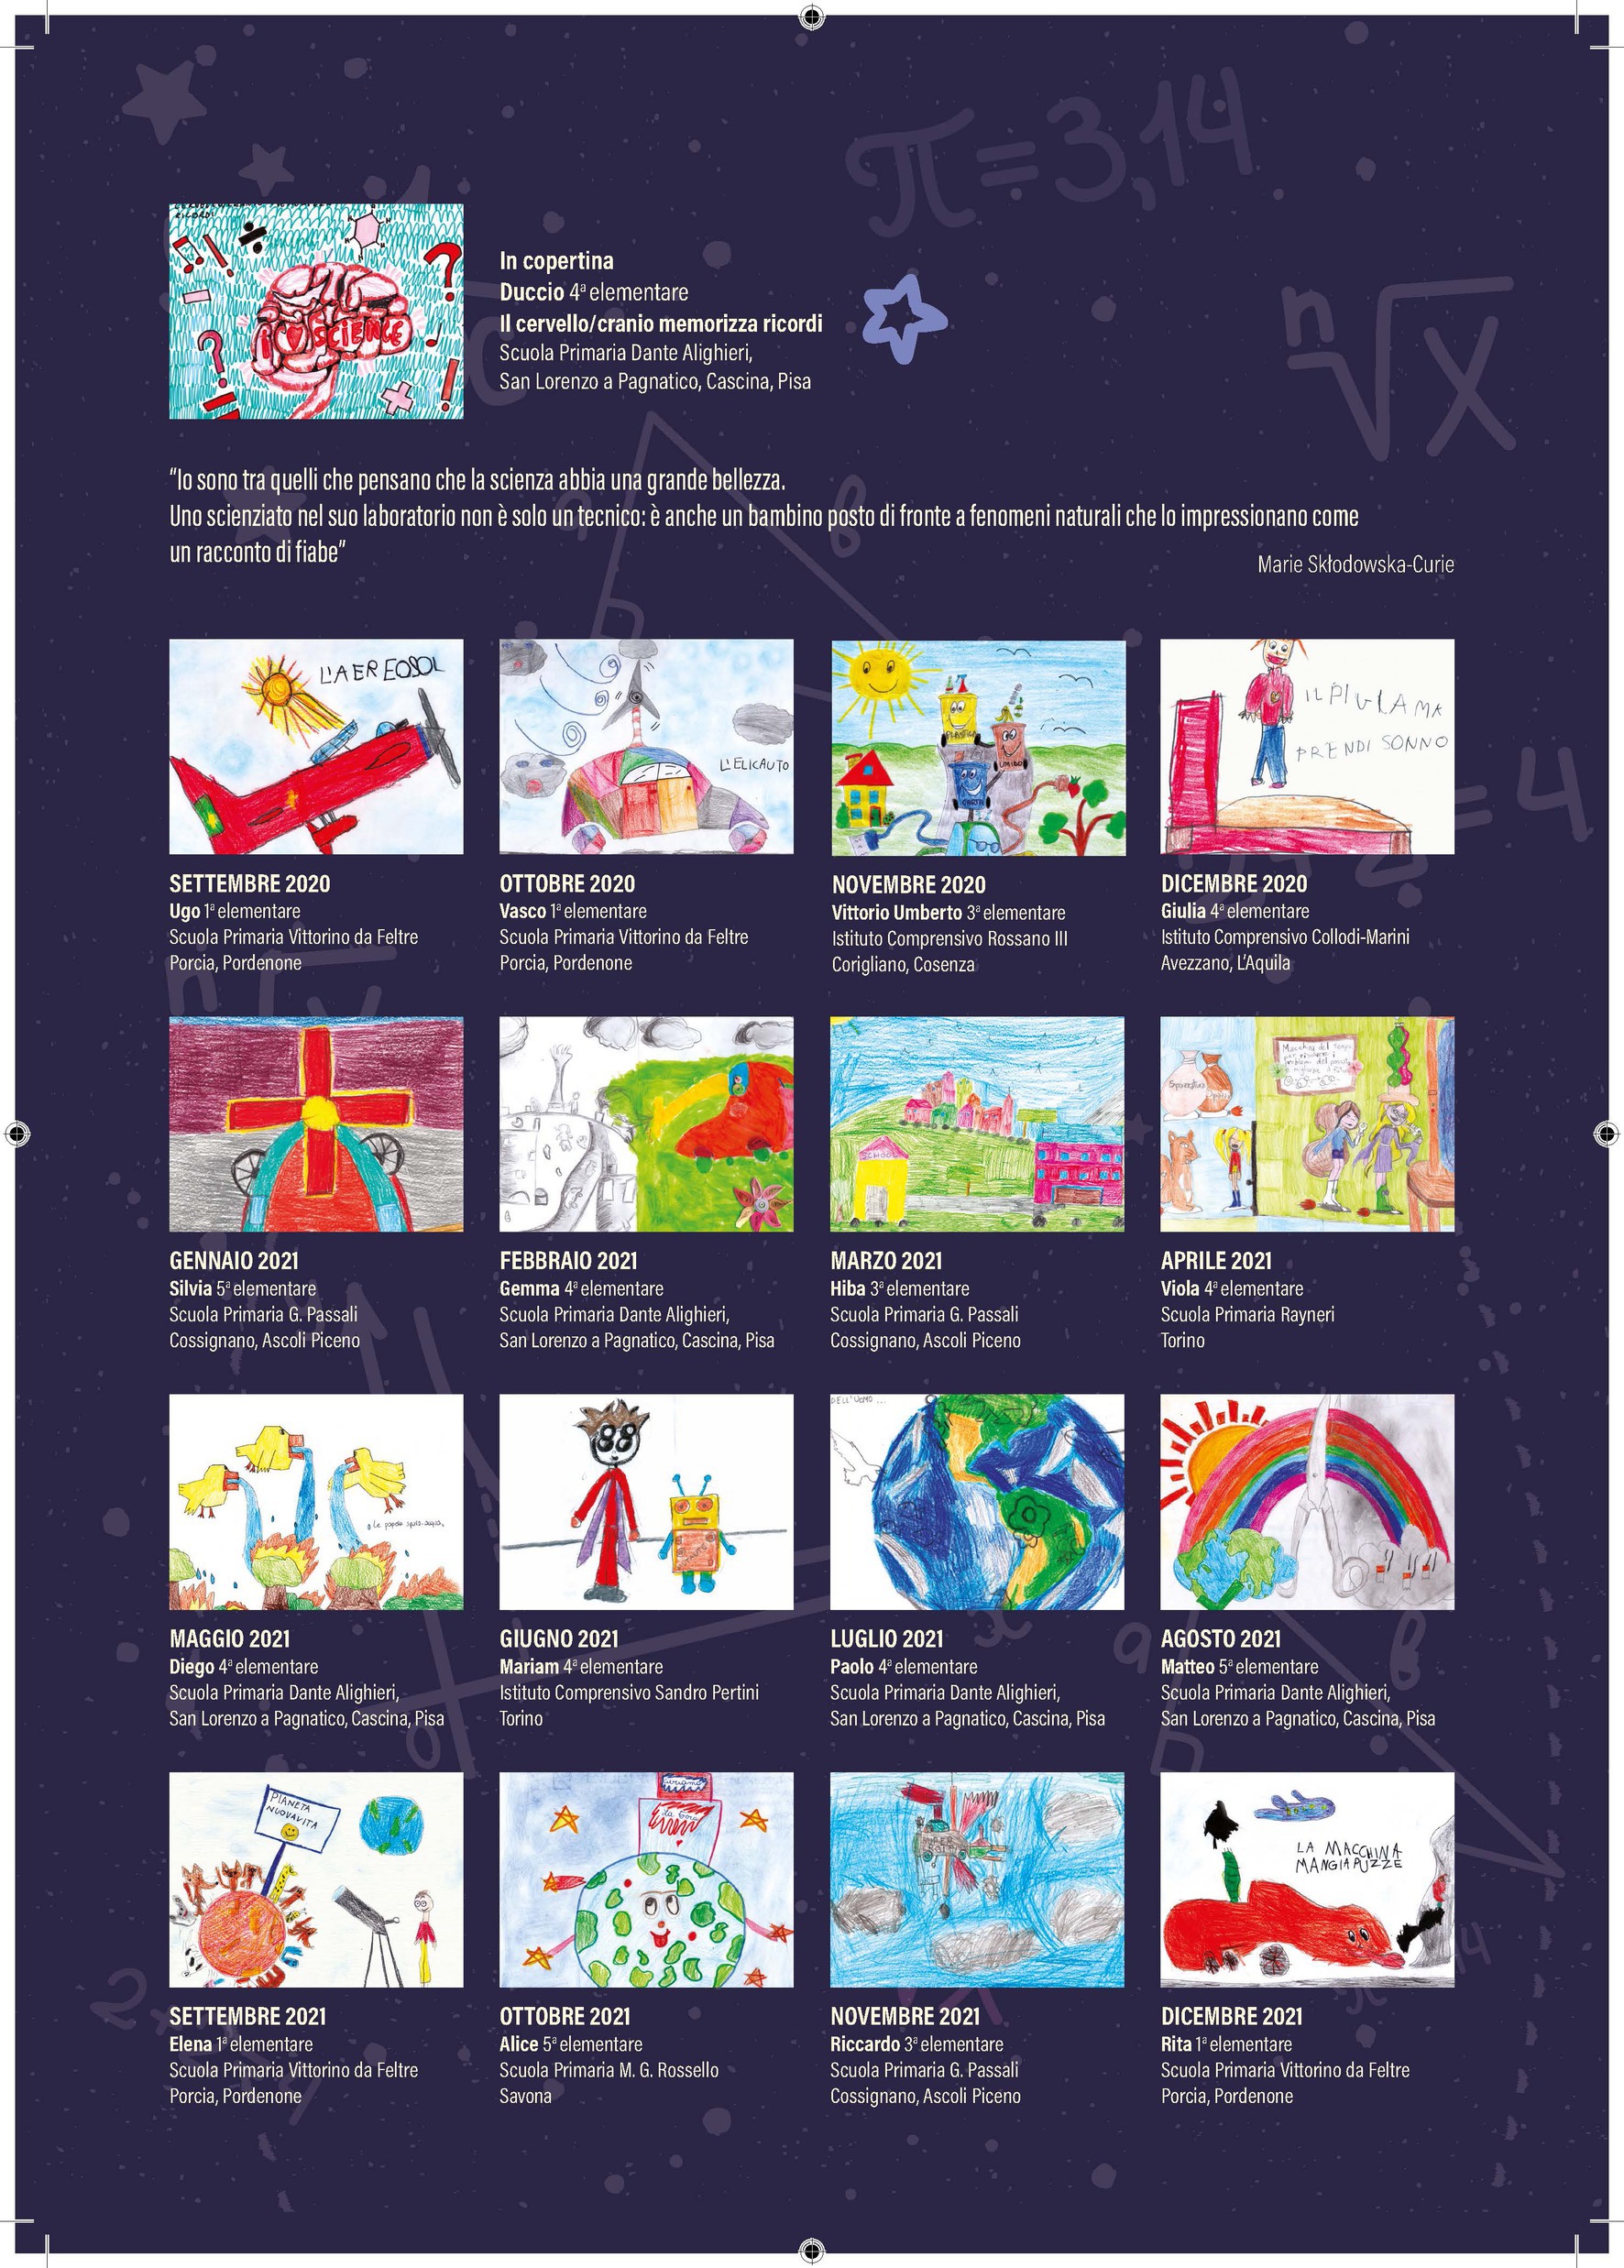
Figure 2. Back cover of the 2020–2021 calendar with the thumbnails of awarded drawings.
A preliminary analysis of the perceived image of science, scientists, and inventions was conducted using 200 drawings from the 2011 calendar competition (Rubbia et al., 2015). In this work, we analyze the entire 2011 dataset and perform an investigation with the same approach on the 2021 dataset to compare the results. Percentages were calculated and the summary statistics are discussed below. The gender dimension displayed in the 2011 and 2021 datasets was considered for both the artists and the drawn scientists.
4 Classification scheme
We approach the study following Rubbia et al. (2015), improving and adapting the analysis to the available data. Drawings were coded and the values were stored in two different Excel data sheets. We indicate the two datasets as the 2011 and 2021 calendar competitions. For both data sheets, we defined the same classification scheme synthesized in Table 1. The variable “0” was used to consider those drawings for which the code interpretation was too problematic or when the variable to code was not present in the drawing. We started with the drawing’s progressive identification number, school name, and location and then proceeded with information about the drawing’s creator’s first name, age, and gender. We coded the presence of the portrayed scientists, including an indicator of the scientist’s gender and age and the number of scientists portrayed in the single drawing. The portrayed scientists were also classified to analyze the presence of stereotypes. The variables were adopted from Rubbia et al. (2015): if the scientist wears a white coat or glasses or has crazy/untidy hair. Then, variables were expanded during the classification processes to include the following: if the scientist is groomed or if an explosion or a dangerous element is illustrated in the drawing, it is a stereotyped physicist or physician.
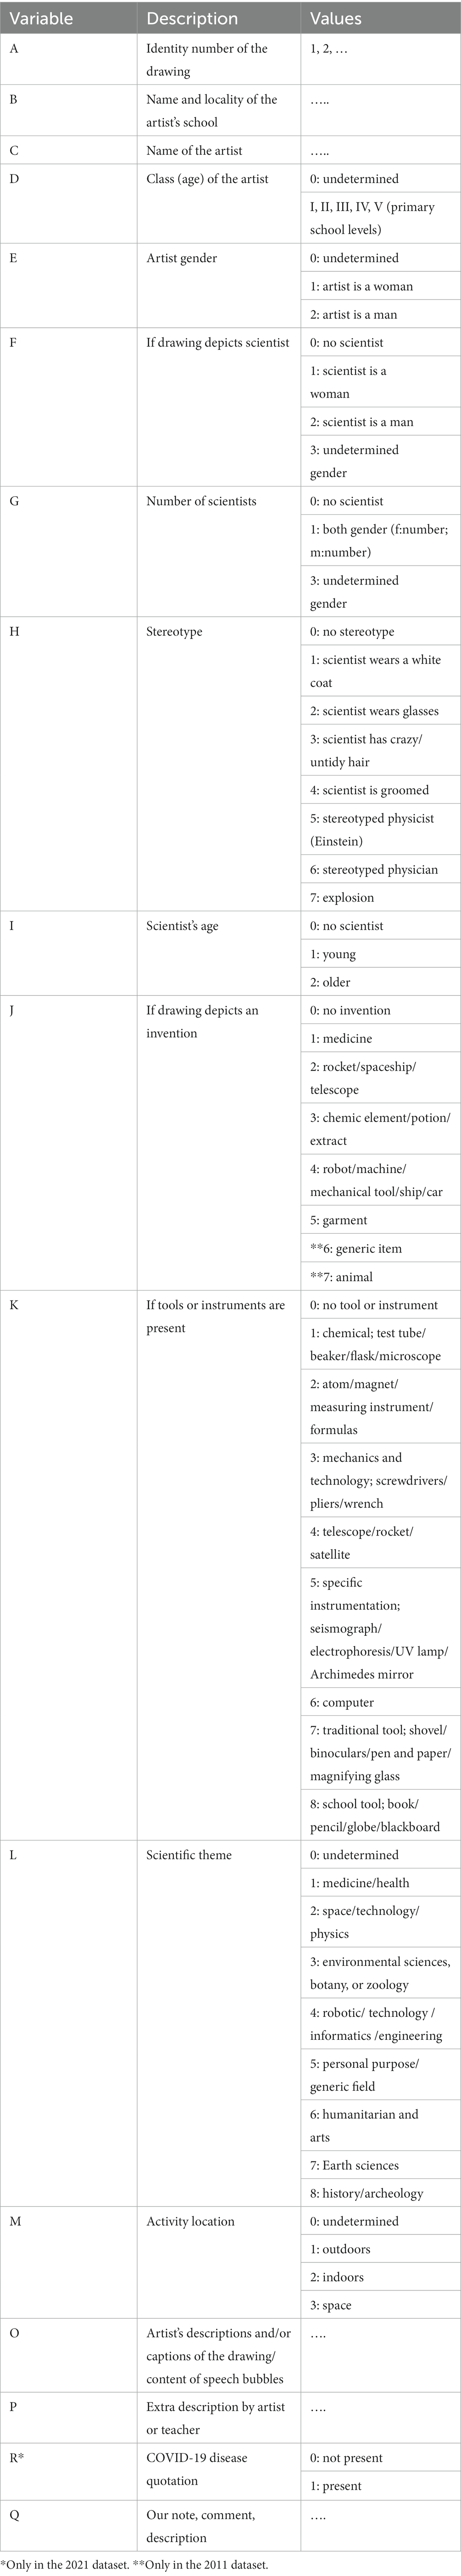
Table 1. Drawing classification scheme.
To analyze drawings featuring an invention, we defined the categories of inventions as follows: medicine; rocket/spaceship/telescope; chemical element/potion/extract; robot/machine/mechanical tool/ship/car; and garment. For the 2011 dataset, we introduced two further categories: generic item and animal. We also coded whether the drawing included research tools and/or an instrument, classified as chemical equipment (test tube, beaker, flask, microscope); measuring instruments and symbols/formulas related to atoms or magnetism; space items such as telescope, rocket, or satellite; specific instrumentation like a seismograph, electrophoresis, UV lamp, or Archimedes mirror; computers, which were coded as a separate category; traditional tools such as a shovel, binoculars, pen and paper, magnifying glass; and finally, tools referring to the school environment (book, pen, pencil, globe, blackboard).
To analyze the science domain most represented, we classified the drawings within scientific themes: medicine and health; space and physics; environmental science, including botany and zoology; robotic and technology, informatics and engineering; earth sciences; history and archeology; humanitarian and arts. We also defined a category to group drawings with a subject that was too generic or with personal purpose and field.
We considered it important to take into consideration the activity location and picture background, i.e., if the depiction is situated outdoors, indoors, or in space.
Finally, other categories were included: the presence of speech bubbles, captions and descriptions, and comments about the drawing, e.g., Awarded= if was chosen for the calendar.
5 Data analysis
The 884 drawings collected for the 2011 calendar competition and the 332 drawings of the 2021 calendar competition were made by 6–10-year-olds. In total, 83% of the 2011 drawings and 84% of the 2021 drawings were made by children between 8 and 10 years old; for the latter dataset, up to 40% were made by children aged 9 years (Figure 3).

Figure 3. Artist age distributions for the 2011 and 2021 competitions. In both datasets, 1% of the drawings have no age indication.
The creators of the drawings were equally distributed for gender in both datasets: 49% girls and 50% boys and 51% girls and 48% boys for the 2011 and 2021 datasets, respectively. In both datasets, the age distributions between girls and boys are similar to the general distributions shown in Figure 3 (see also Table 2). The number of drawings is significantly different but statistically consistent in both datasets. Regarding the drawing techniques, pencils, permanent markers, and pastels are widely used in both datasets. A few pictures are painted with tempera and others have special features, like multi-material collages, pop-up effects, or gold powder, mainly created by girls. Many drawings use the comic strips technique, whereby speech bubbles are used to give descriptions of the inventions, particularly in boys’ creations.
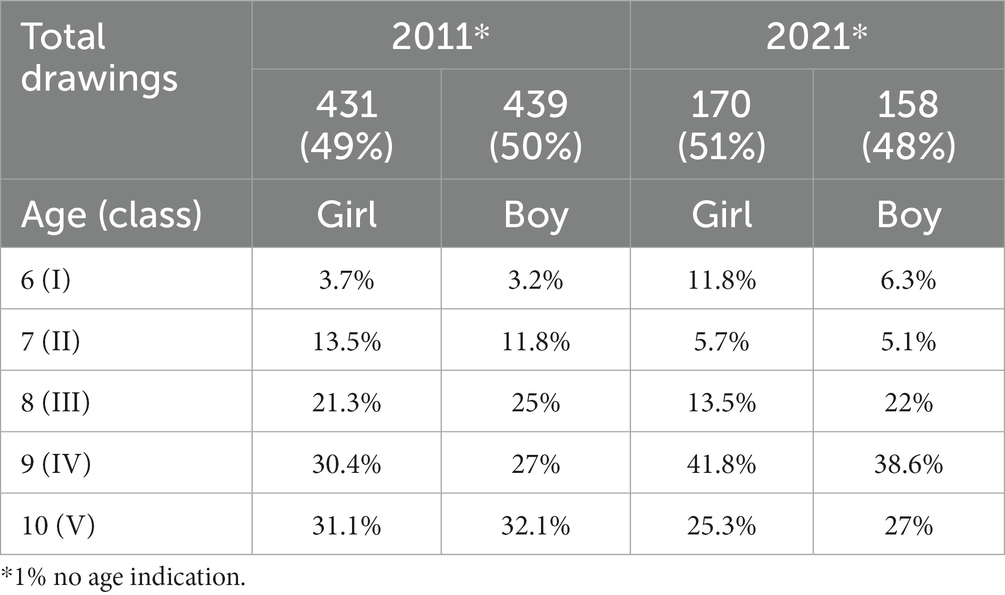
Table 2. Artist age and gender distribution in the 2011 and 2021 datasets.
5.1 Drawings depicting scientists
Table 3 summarizes the results obtained from the statistical analysis performed in both the 2011 and 2021 calendar competition datasets. Looking at the 2011 results, 67.8% of the 884 drawings depict a scientist, drawn by girls and boys with equal percentages. Scientist gender could not be determined in 6.7% of the drawings. In 58.3% of drawings, the depicted scientists are male scientists, and in 29.2%. they are female scientists; drawings depicting both genders account for 5.5%. In total, 53.5% of girls drew female scientists and 32.3% drew male scientists, whereas 84.7% of boys drew male scientists and 4.8% drew female scientists. Furthermore, 7.4% of girls drew both male and female scientists, compared to 3.7% of boys. Of the 591 drawings with scientists, 79 (13.4%) depict more than one scientist (up to 6). Of these, 54% were drawn by girls. In 7.3% of drawings, scientists are presented as well-groomed; of these, 93% were drawn by girls. In 83% of the drawings with scientists, the depicted scientist is young, in 17%, the scientist is older, and in 1.5% of drawings, there are both young and older scientists. Boys and girls depicted young scientists with similar percentages, at 48.2% and 51.8%, respectively. Boys drew 60.7% of the drawings depicting older scientists.

Table 3. Comparison between drawings depicting scientists in 2011 and 2021 datasets.
Considering the age distribution of drawings including female and male scientists (Figures 4A,B), girls draw a female scientist in 26.5% of the drawings depicting scientists, with frequencies increasing with age. Boys draw female scientists in only 2.3% of drawings portraying scientists, mainly at ages 7 and 9. For boys ten years old draw 0 female scientists. (Figure 4A). Girls drew male scientists in 16% of the total drawings with scientists, showing higher frequencies between the ages of 8 and 9. Boys drew a male scientist in 41.5% of the drawings, and frequencies generally increased with age (Figure 4B).
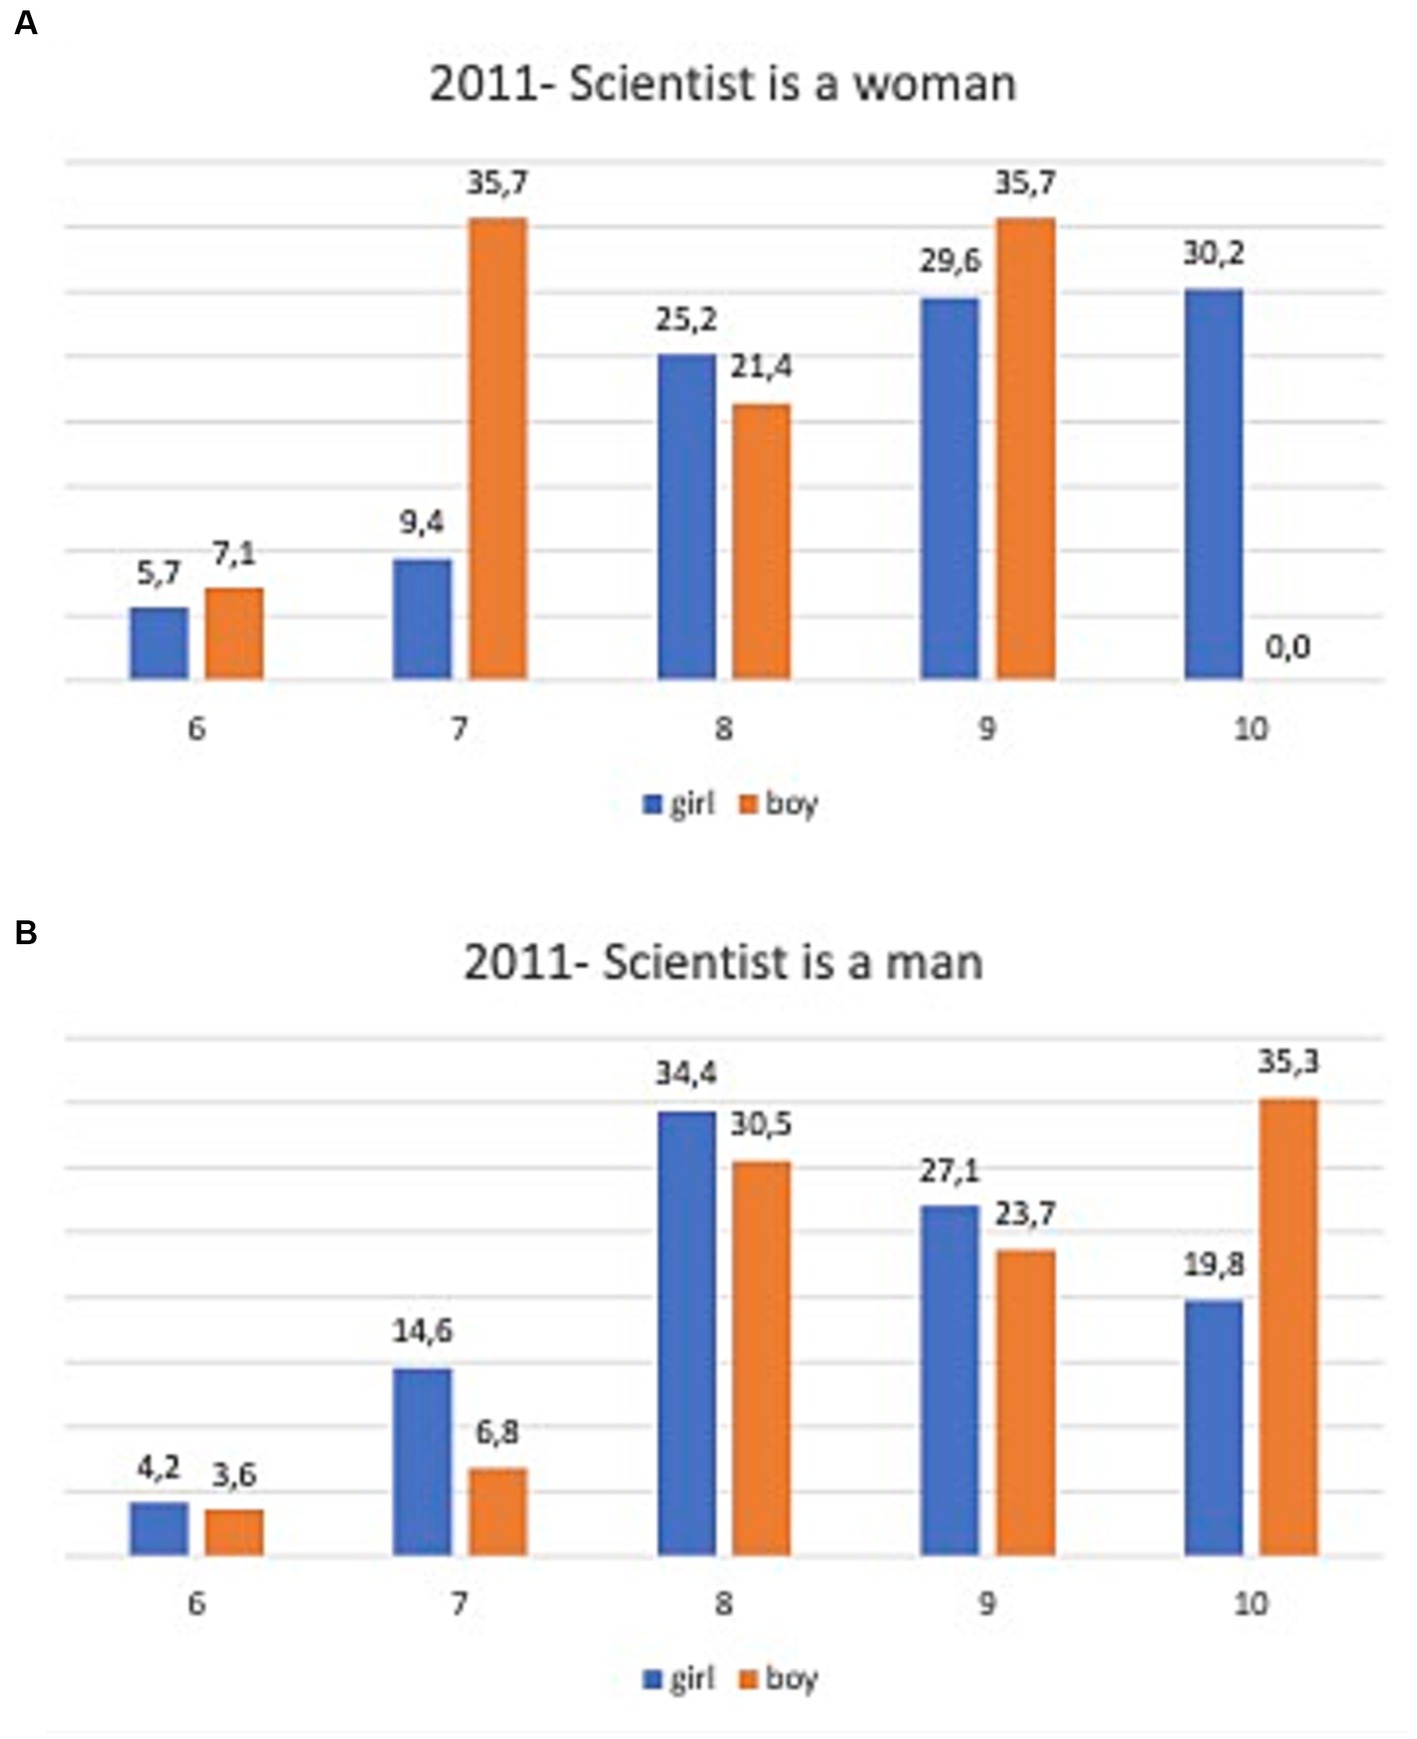
Figure 4. (A) Artist age frequency distribution of the 2011 drawings depicting female scientists, and (B) in drawings depicting male scientists.
We performed a similar analysis on the 2021 dataset (Table 3). In total, 44.7% of the 332 drawings depicted a scientist; 56.1% were drawn by girls and 43.8% were drawn by boys. Scientist gender could not be determined in 1.4% of the drawings. In 55.4%, the depicted scientists are male scientists, and in 36.5%, they are female scientists; drawings depicting both genders account for 6.8%. In total, 62.2% drew female scientists and 29.3% drew male scientists, whereas 90.6% of boys drew male scientists and 4.7% drew female scientists. Furthermore, 8.5% of girls drew both male and female scientists, compared to 4.7% of boys. Of the 148 drawings with scientists, 27 (18.2%) depict more than one scientist (up to 5; Table 3). Of these, 67% were drawn by girls. In 14.2% of drawings with scientists, the scientists are presented as well-groomed; 85.7% of these were drawn by girls.
In 87.6% of the drawings with scientists, the depicted scientist is young, whereas in 12.4%, the scientist is older, and in 8.2% of drawings, there are both young and older scientists (Table 3). Of the drawings depicting young scientists, 56.7% were drawn by girls, and of the drawings depicting older scientists, 55.6% were drawn by boys.
Figure 5 shows the age distribution of drawings with female and male scientists. Girls drew a female scientist in 34.9% of the drawings depicting scientists, with the highest frequencies at age 9 (Figure 5A). Boys draw female scientists in only three drawings, which is insufficient to make an assessment. Girls draw male scientists in 16.4% of the total number of drawings with scientists, showing higher frequencies at the age of 9. Boys draw a male scientist in 39.7% of the drawings with scientists, also showing higher frequencies at the age of 9 (Figure 5B).

Figure 5. (A) Artist age frequency distribution of the 2021 drawings depicting female scientists, and (B) in drawings depicting male scientists.
5.2 Image of stereotyped scientist
Table 4 summarizes the results obtained from the statistical analysis of the presence of stereotyped scientists in both the 2011 and 2021 datasets. We coded stereotypes as described in Table 1. In 63.8% of the 2011 drawings with scientists, stereotypes are present; of these, 52.2% have multiple stereotypes. Boys and girls drew scientists with stereotypes with similar percentages, at 51.3% and 48.7%, respectively. The most represented stereotype is the lab coat, at 45%, followed by crazy/untidy hair, at 25.9%, and eyeglasses at 21.2%. Explosions feature in 3.7% of drawings with stereotypes and 2.9% depict an “Einstein-like scientist.” Except for crazy/untidy hair, 22% of drawings featuring this stereotype having been drawn by girls and 30% by boys, girls and boys drew stereotypes with similar percentages (Table 4). In the 2021 dataset, 58.8% of the drawings with scientists present stereotypes; of these, 52.2% include more than one stereotype. Boys and girls drew stereotyped scientists with similar percentages, at 51.2% and 48.8%, respectively.
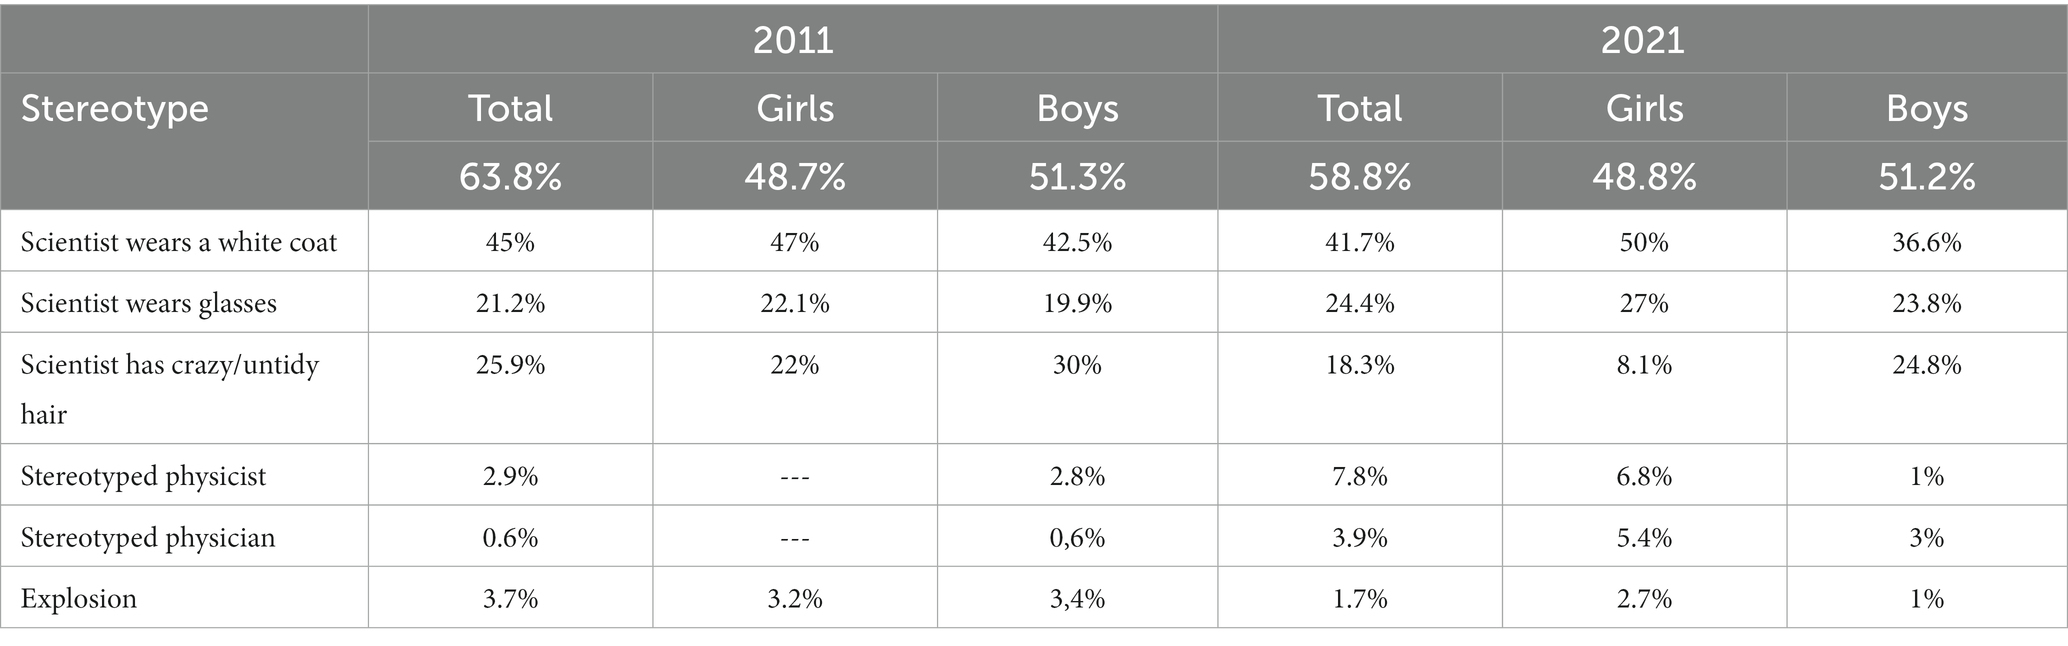
Table 4. Frequency distribution of stereotypes in 2011 and 2021 datasets.
Similar to the 2011 dataset, in the 2021 dataset, the most represented stereotype is the lab coat, with a percentage of 41.7%, followed, in this dataset, by eyeglasses, at 24.4%, and then by crazy/untidy hair, at 18.3% (Table 4). The percentage of drawings featuring “Einstein-like scientists” is 7.8%. In total, 50% of girls’ drawings depict scientists wearing lab coats, whereas for boys, the percentage decreases to 36.6%. An even wider difference between girls and boys emerges for the frequency of the inclusion of the crazy/untidy hair stereotype, at 8.1% for girls and 24.8% for boys (Table 4).
5.3 What would children invent?
Analyzing the 2011 competition dataset, we coded 528 drawings with inventions, alone or in which the invention is clearly the main focus of the drawing, which accounts for 59.7% of the total drawings. Of these, 46.9% were designed by girls and 53.1% by boys. In total, 4.4% of the drawings with inventions include more than one invention in the same drawing. The most common category of invention is that of the robot/machine/mechanical tool/ship/car, which appears in 68.4% of the drawings with inventions. Boys are credited with inventing these items in 72.7% of cases (Table 5). For girls, this percentage drops to 63.3%. The percentages relating to the other categories are much lower (Table 5). Among these, the most represented is the generic item category, accounting for 10.2%, which incorporates inventions of a personal nature that realize dreams or fulfill special requirements and/or satisfy personal tastes (Figure 1). Girls contributed the most to this category, with a percentage of 12.9%, compared to the boys’ percentage of 7.6%. The chemical category is present with a percentage of 8.8. 10.9% of girls and 6.9% of boys depicted the chemical category (Table 5).

Table 5. Inventions distribution in the 2011 and 2021 datasets.
In the 2021 dataset, there are 261 drawings with inventions, accounting for 78.9% of the total drawings. Among these, 47.9% were designed by girls and 52.1% by boys. In 4.2% of these drawings, there is more than one invention presented. The results are shown in Table 5. In the 2021 dataset, there are no drawings belonging to the generic item and object animal categories. The most represented invention category, accounting for 67.6% of the inventions, is that of the robot/machine/mechanical tools/ship/car, invented by boys in 70.7% of the drawings with inventions. For girls, this percentage drops to 63.8%. The second most represented invention, accounting for 15.1%, is the category of medicine, with similar percentages between girls and boys, at 14.6% and 15.7%, respectively. The COVID-19 vaccine is the most frequently invented medicine, which, in the period the drawings were made, had yet to be developed by the scientific community. The category rocket/spaceship/telescope is represented in 7.4% of the drawings with inventions, with a slightly higher frequency in boys’ drawings, at 7.9%, compared to girls’ drawings, at 6.9%.
We also noted that 12.1% of the drawings made between February and May 2020 have a clear reference to COVID-19, e.g., quotes, images of the virus, and masks, in girl’s drawings with a percentage of 55%, slightly higher than boy’s 45%.
5.4 Tools of science
In the 2011 dataset, 55.4% of the drawings depict “tools” of science, i.e., instruments and devices being used by scientists or enriching the representation, drawn by girls 48.4% and by boys 51.6%. In 33.7% of these drawings, more than one tool is depicted. The results are shown in Table 6. With a percentage of 40.4%, the most common tools fall into the chemical category: test tube/beaker/flask/microscope, noticeably more remarkable in the girl’s drawing, 45%, concerning the boys, 37.7%. The second most represented tool is the computer, accounting for 14.3%, followed by mechanics and technology, i.e., screwdrivers/pliers/wrench, accounting for 14%. Looking at the gender distribution, we can observe significant differences between girls and boys: the computer category is still the second most represented in girls’ drawings, accounting for 15.6%, while for boys’ drawings, it accounts for 11.1%. The second most represented tools in boys’ drawings are mechanics and technology-related, at 19.3%. For girls, the percentage of drawings with the mechanics and technology related tools is 9.6%. In third position for both girls and boys is the category related to space tools, i.e., telescope/rocket/satellite, accounting for 11.7% and 12.6%, respectively (Table 6).
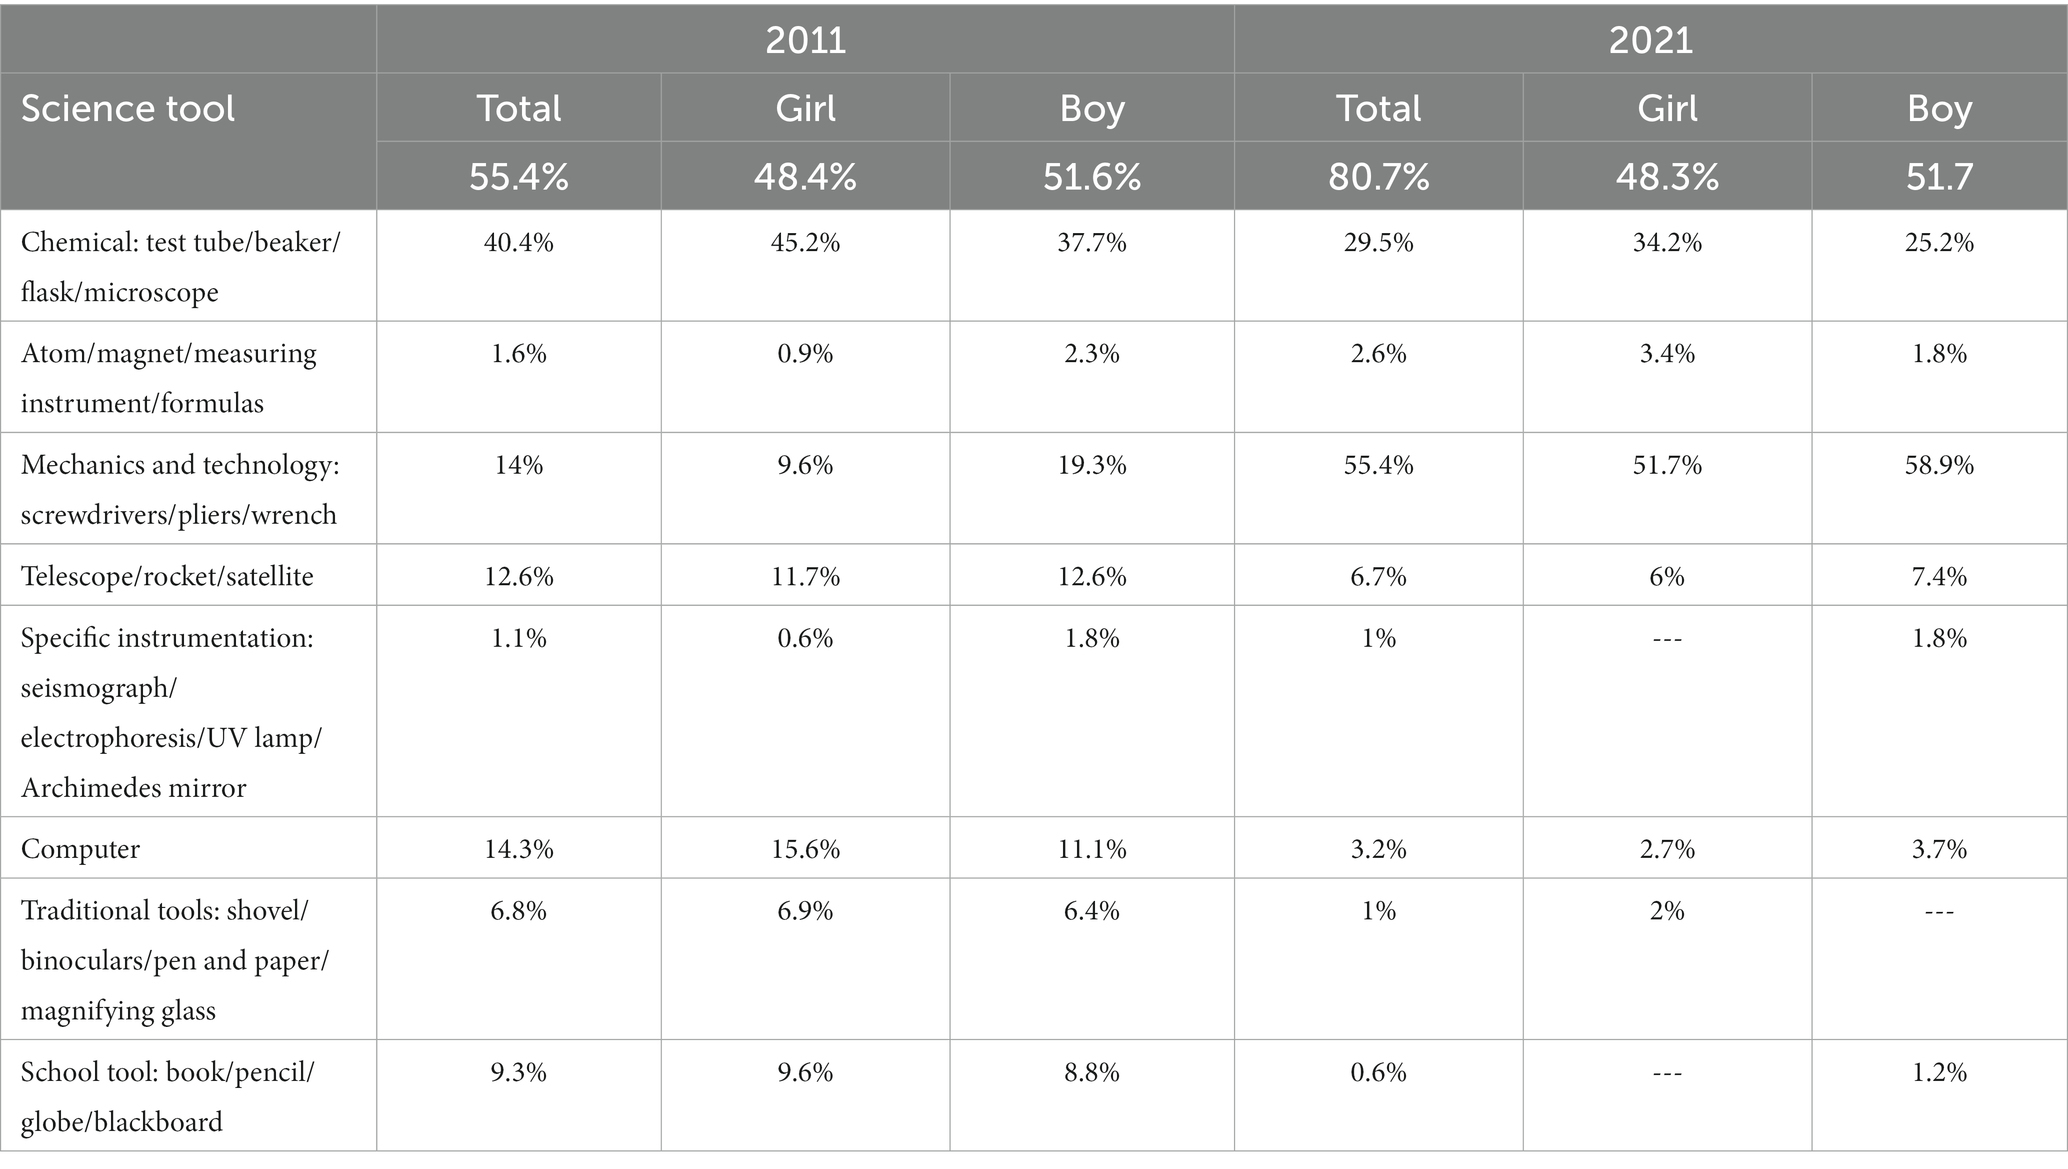
Table 6. Science tools in the drawings of the 2011 and 2021 datasets and tools distribution.
Drawings depicting “tools” of science in the 2021 dataset account for 80.7%, with 48.3% drawn by girls and 51.7% by boys. In 12% of these drawings, there is more than one tool depicted. Table 6 shows the results. With a percentage of 55.4%, the most common tool category is mechanics and technology, i.e., screwdrivers/pliers/wrench; Of these 55.4% were depicted by girls and 58.9% were depicted by boys. Second place is the chemical category, i.e., test tube/beaker/flask/microscope, accounting for 29.5%, with a greater frequency in girls’ drawings, at 34.2%, than in boys’ drawings, at 25.2%. The other categories showed much lower rates, with no significant differences between girls’ and boys’ drawings.
5.5 Scientific theme
In 84.8% of the 2011 dataset drawings, it was possible to define a main subject or science domain, which we coded as a scientific theme in Table 1. Table 7 reports the results. The most represented theme is related to the personal and generic sphere, accounting for 49.9%, such as rocket shoes or a rainbow machine (Federica’s drawing in Figure 1). In particular, the percentage is referred to the amount of drawings with the the specific theme and not to the total of female o male drawings. The second most represented theme is robotics and engineering, accounting for 17.2%. The percentage is referred to the amount of drawings with the robots and not to the total of female o male drawings. Themes regarding the environment are present in 13.1% of the drawings, with a slight difference between its frequency in girls’ and boys’ drawings, at 12.1% and 13.5%, respectively. Notably, for boys, the third most represented theme in the drawings is related to the space domain, 20.6%.
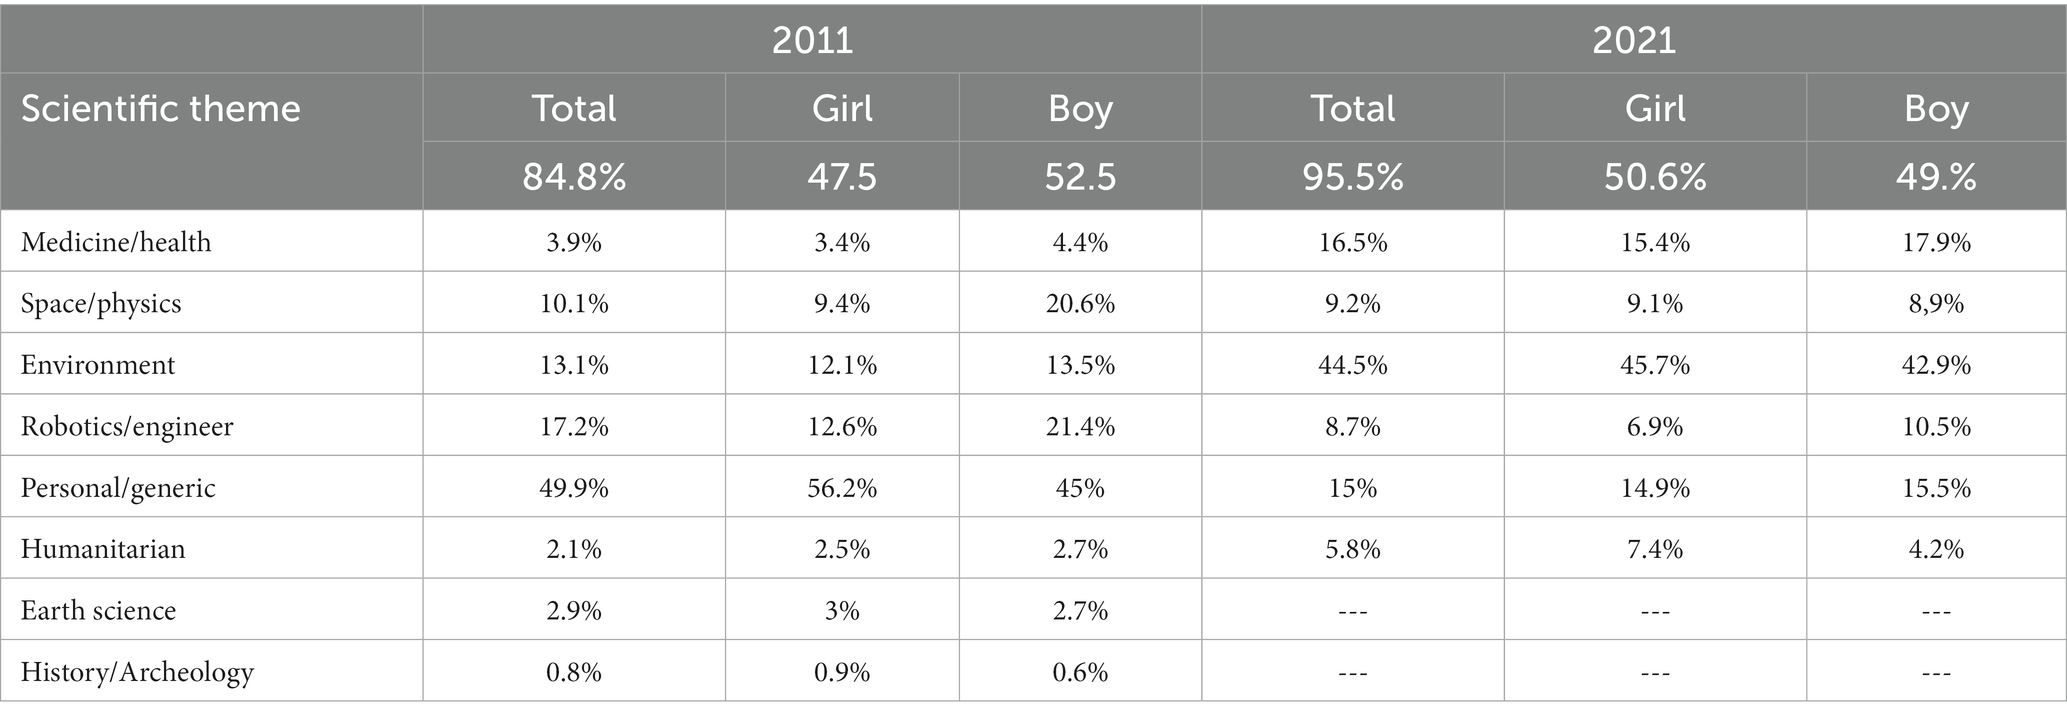
Table 7. Distribution of 2011 and 2021 dataset scientific themes.
In 95.5% of the 2021 drawings, we identified a scientific theme. As shown in Table 7, the most represented themes are related to the environment, accounting for 44.5%, followed by health and medicine, accounting for 16.5%, with slight differences in frequency between girls’ and boys’ drawings. Girls’ drawings focus a little more on the environmental subjects, featuring in 45.7% of girls’ drawings compared to 42.9% of boys’ drawings, and humanitarian subjects, at 7.4% compared to 4.2%. Boys’ drawings are slightly more focused on subjects related to medicines/health than girls’, 17.9% compared to 15.4% (Table 7).
5.6 Location
We analyzed the activity location and the context of the drawings. In the 2011 dataset, 38.6% of drawings present an outdoor setting, 55.3% depict an indoor space, and 6.1% are situated in space. The percentages between girls and boys are very similar. Boys’ drawings are located somewhat more frequently outdoors, accounting for 38.2%, than girls’ drawings, accounting for 37%, and the space setting is featured in 7.1% of boys’ drawings and 6% of girls’ drawings (Figure 6).
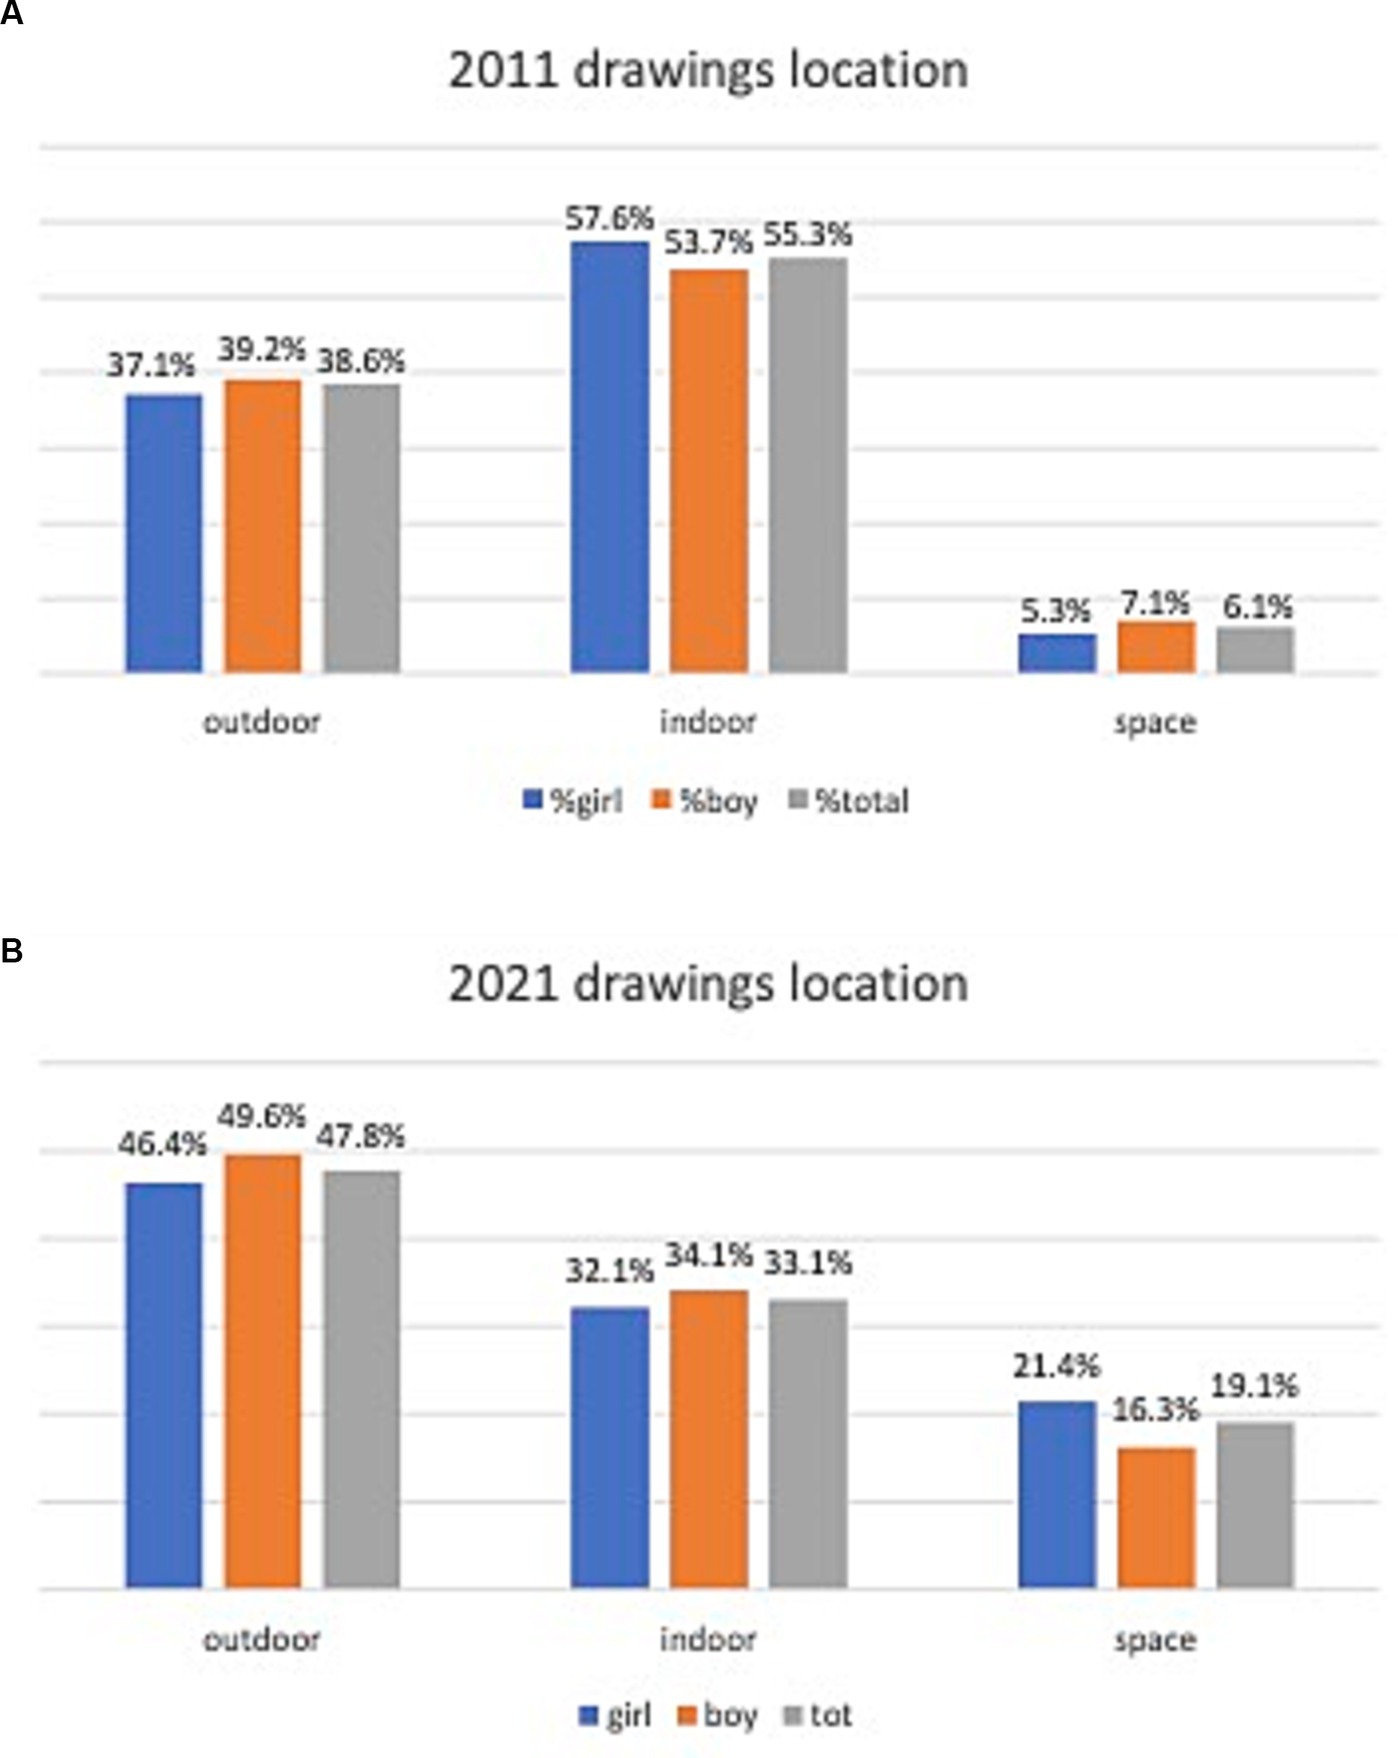
Figure 6. Drawings activity, location, and context (A) 2011 dataset and (B) 2021 dataset.
In the 2011 dataset, 38.6% of drawings represent an outdoor setting, 55.3% indoors and 6.1% in space. The percentages between girls and boys are very similar. Boys locate somewhat more frequently outdoors, 39.2%, as for the girls is 37.1%, and in the space setting, boys 7.1%, girls 6.1% (Figure 6).
5.7 Comments in drawings
Some children enriched their drawings with descriptions, a title, or comments. Descriptions include the name of an invention (“pesodino”: scales for dinosaurs), the explanation of the invention or how it works (the time machine), or thoughts or dialogs between the drawn characters. Comments that describe the scene of the drawing are present in 63.4% of drawings in the 2011 dataset. Of these, 24.7% present comments using speech balloons. In the 2021 dataset, 75.3% of drawings present comments, and 21.6% use speech balloons. The frequency of comments in boys’ and girls’ drawings is similar.
To visualize word frequency in the children’s comments, we scaled text to represent values associated with words in the world cloud using the free Flourish app (Seligman, 2013. Flourish. New York, NY: Simon and Schuster). By default, the word cloud does not show the 100 most common words in English, like “the” and “if.” The world limit option is set to 250 and controls the maximum number of words to be visualized.
As shown in Figure 7, some words are well represented in both years, like “science,” “scientist,” “invent/invention,” “the machine” (e.g., time-machine), “car,” “planet,” “robot,” “pollution,” “earth,” “fly/flying” (e.g., flying car), “discover,” “study,” “create,” “transform,” “energy,” “good,” “help,” “solar,” “plant,” “future,” “world,” “moon.” There are some words that are more represented in the 2011 dataset, such as “kid,” “laboratory,” “experiment,” “succeed,” “automated,” and “magic,” and other new words presented in the 2021 dataset, some of which correlate to the pandemic situation, like “cure,” “solve,” “coronavirus,” “problem,” “vaccinate,” “sick,” “garbage,” “plastic,” and “technology”.
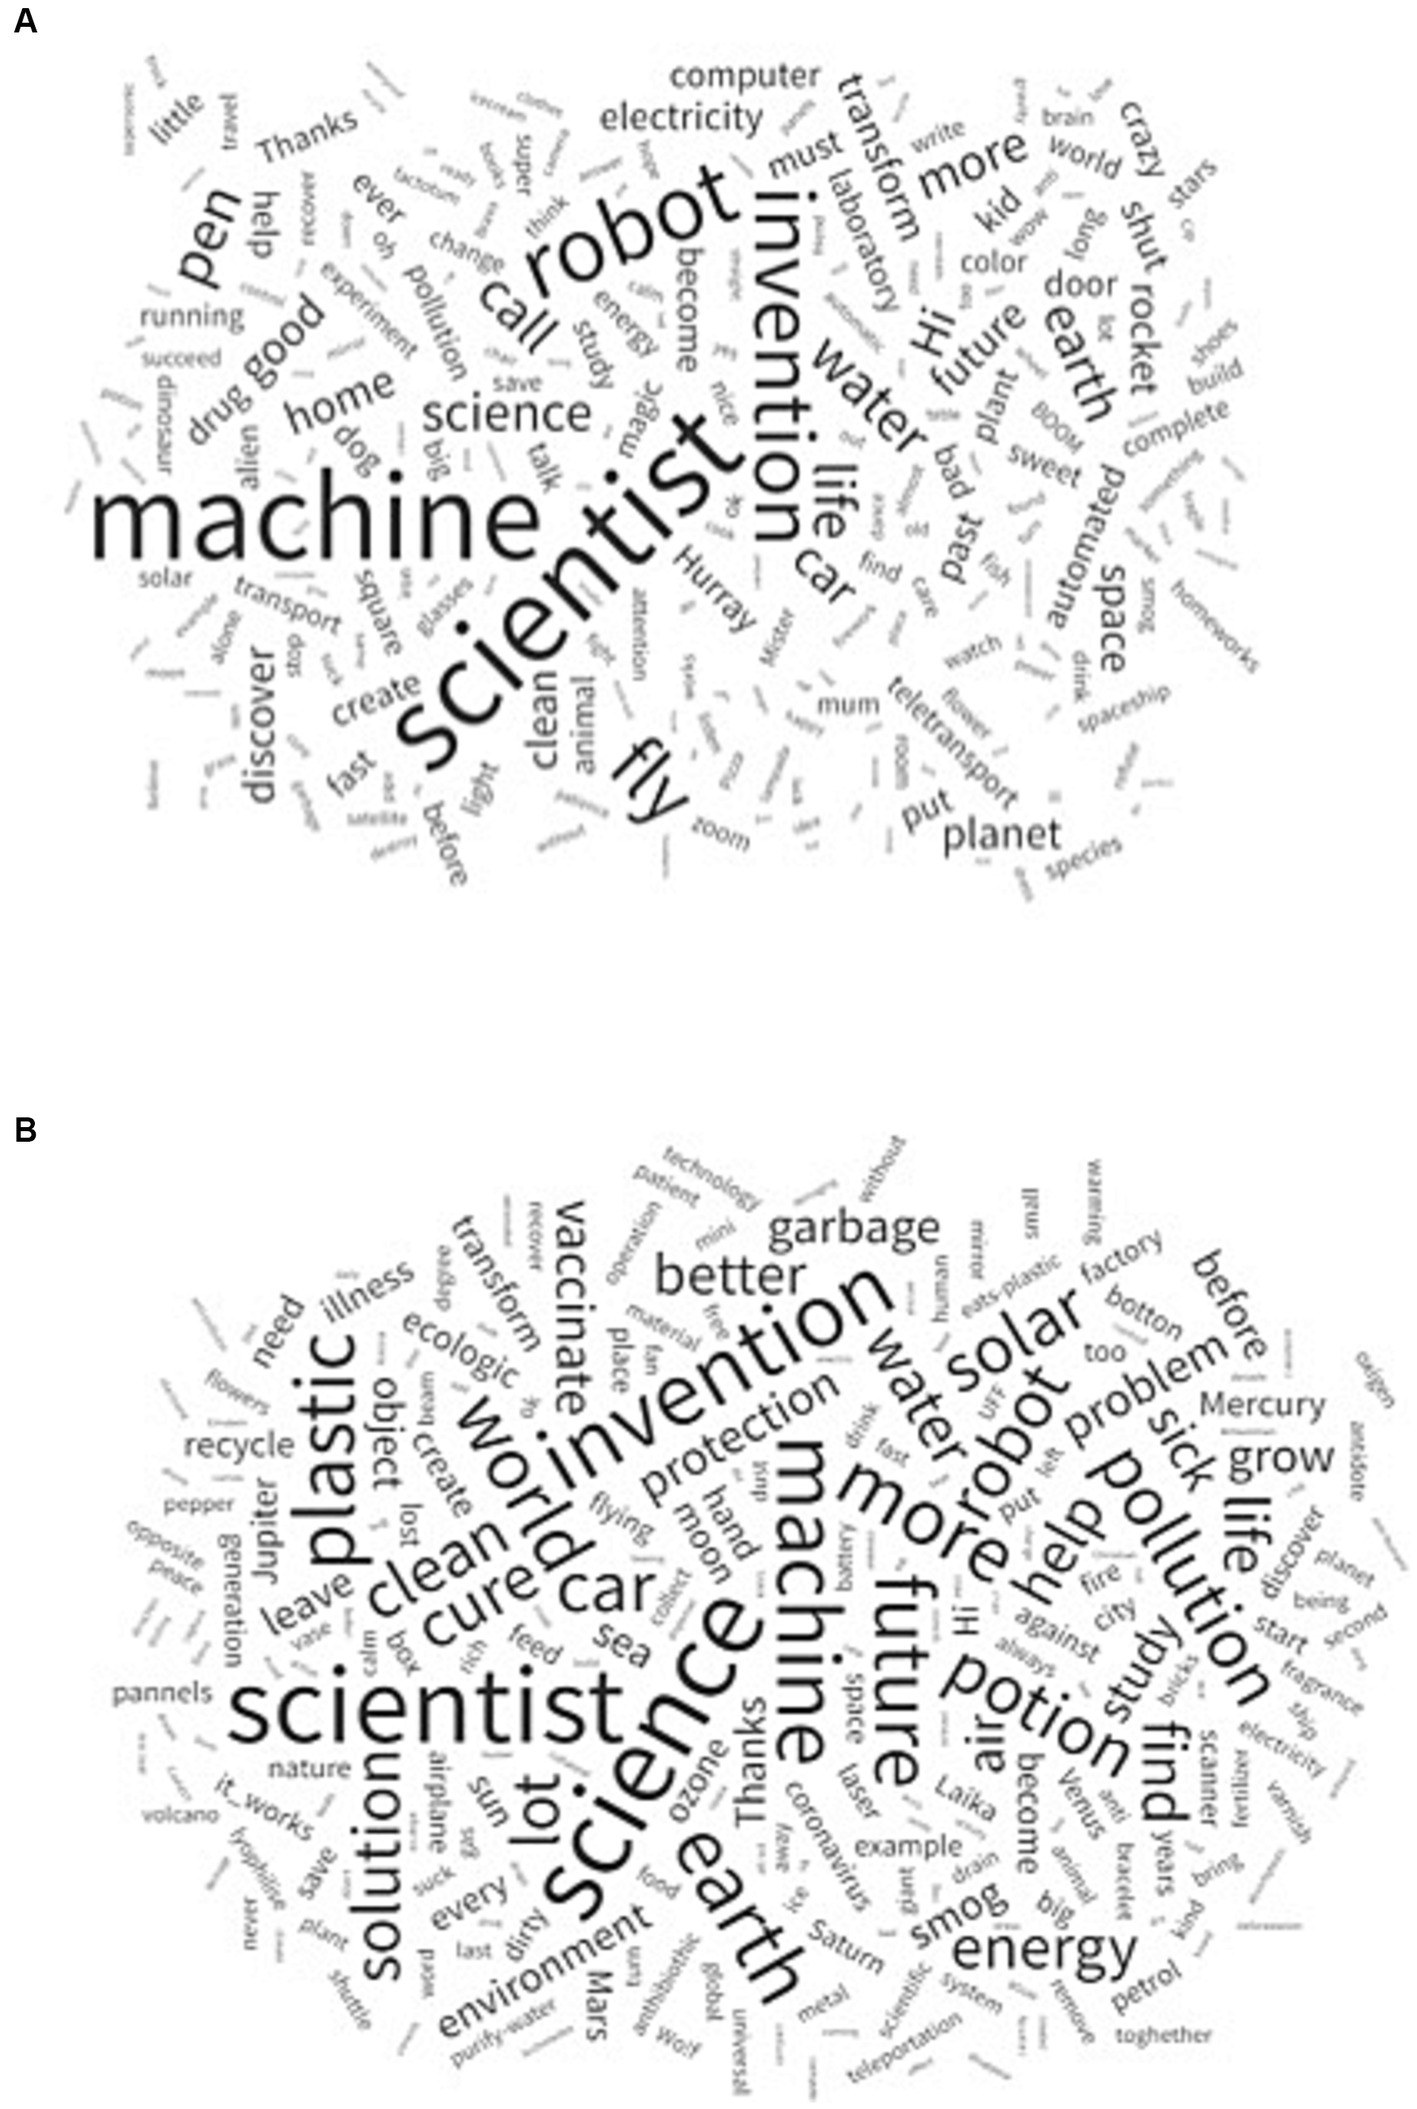
Figure 7. Visualization of the most common words in the children’s comments in the (A) 2011 competition and (B) 2021 competition.
6 Result and discussion: 2011 vs. 2021 databases with a focus on girls vs. boys
In our reference sets of images, artists were boys and girls with similar percentages. Most (83 and 84% in the 2011 and 2021 datasets, respectively) were 8–10 years old. They were sufficiently skilled in drawing the human figure with its proper details. Pupils belonging to the same class may have copied from one another and/or may have followed the suggestions of the teachers. In this sense, we find repeated subjects and similar drawings within the same classes. According to the imagery of the pupils, the scientists drawn were mainly male, 58.3% of the 2011 dataset drawings and 55.4% of the 2021 dataset. Male scientists were drawn by both boys (84.7% in 2011 and 90.6% in 2021) and girls (32.3% in 2011 and 29.3% in 2021). The percentage of drawn female scientists is 29.2% in the 2011 dataset and increases to 36.5% in 2021 (Table 3). Generally, female scientists drawn by boys are depicted alongside a male scientist, sometimes acting as an assistant. Female scientists were drawn by girls with a significant increase in the 2021 database (Table 3). Considering the habit of depicting a male scientist as an element of a stereotyped scientist image, we may consider this increase a sign of improvement.
The scientists depicted are mainly young for both datasets; scientists are depicted as older more frequently by boys in the 2011 database, and in the 2021 dataset, the gender percentage is similar, both for young and older scientists. Despite the presence of images of stereotyped older scientists, the decreasing percentage of drawings depicting this category represents a sign of improvement.
The image of the stereotyped scientist, as defined in Table 1, is present with a percentage of 63.8% in the 2011 dataset and is somewhat less so in the 2021 dataset, at 58.8%; in both datasets, girls depict fewer stereotyped scientists (Table 4).
First of all, scientists are depicted as wearing a white coat in both datasets (Table 4), and this has been confirmed as the archetypal stereotype over the years. The other results differ significantly between the two datasets and with respect to the artist’s gender. In the 2011 dataset, the second most common stereotype is the disheveled-looking scientist with crazy/untidy hair, which is depicted in 25.9% of drawings, mainly by boys. Third, 21.2% of the scientists are depicted wearing glasses, featuring in a higher percentage of boys’ drawings. Following this, explosions are depicted in 3.7% of drawings, with a slight gender difference, and, in some cases, are described using the typical ‘bang’ and ‘boom’ used in comics (Table 4).
In the 2021 dataset, as the second most common stereotype, the scientist wears glasses in 24.4% of cases, with similar frequency in the drawings of girls and boys. The third stereotype is the disheveled-looking scientist with crazy/untidy hair, which was mainly drawn by boys, perhaps because they tend to present the scientist as the protagonist and hero of the comics.
In both datasets, the scientists are sometimes presented in magical contexts or along with the description “mad scientist.” They are usually depicted indoors in rooms that resemble laboratories. In some cases, they are portrayed together with their inventions or explaining the invention. Frequently, children of both genders represent themselves as a scientist engaged in solving problems, experimenting, inventing, or making. A modest but significant decrease in the stereotype frequencies can be noted in the 2021 datasets. Here, girls drew a higher percentage of scientists wearing lab coats compared to boys, whereas for the boys, we registered a higher percentage of scientists with crazy or untidy hair.
Concerning the inventions, illustrations with an invented item in the 2011 and 2021 database are 59.7% and 78.9% of the drawings, respectively, and with a fairly similar percentage between girls and boys (Table 5). In both datasets, the most represented category of invention is robots, for example, to help with housekeeping or homework; rockets and space vehicles; time machines; ecological and smart cars; and fictional machines, in which the children’s imaginations run wild. This category reaches the percentages of 68.4% and 67.6% in the 2011 and 2021 datasets, respectively (Table 5). In both datasets, this category is featured in over 70% of boys’ drawings, which is higher than in girls’ drawings, featuring in around 63%. As for the depicted scientists, the other results differ significantly between the two datasets. In the 2011 dataset, the second most represented category of invention, accounting for 10.2%, is the generic category, which incorporates drawings for which interpretation was too problematic or too vague, such as a fantasyland or a giant vortex. In third position is the category of chemical or potion or natural extract. The percentages of drawings depicting both these categories are noticeably higher in girls’ drawings (Table 5).
In second position in the 2021 dataset, accounting for 15.1% of drawings, is the medicine category. The percentage is referred to the amount of drawings with the specific category and not to the total of female o male drawings.. From this emerges how, in the 2021 calendar competition, children were focused on health problems, as they found themselves living in an entirely exceptional health situation due to the COVID-19 lockdown. In fact, at that time, a vaccine’s development was the main goal of worldwide scientific research (Figure 8). Third for the 2021 dataset is the rocket and spaceship category, at 7.4%, depicted in 7.9% of boys’ drawings with inventions. As for the 2011 dataset, in third position among girls’ inventions is the chemical or potion or natural extract category, which features more frequently in girls’ drawings than in boys’ (Table 5). This may be because, in the Italian media, chemistry and biochemistry researchers are more often played by women (i.e., in advertisements regarding health and beauty).
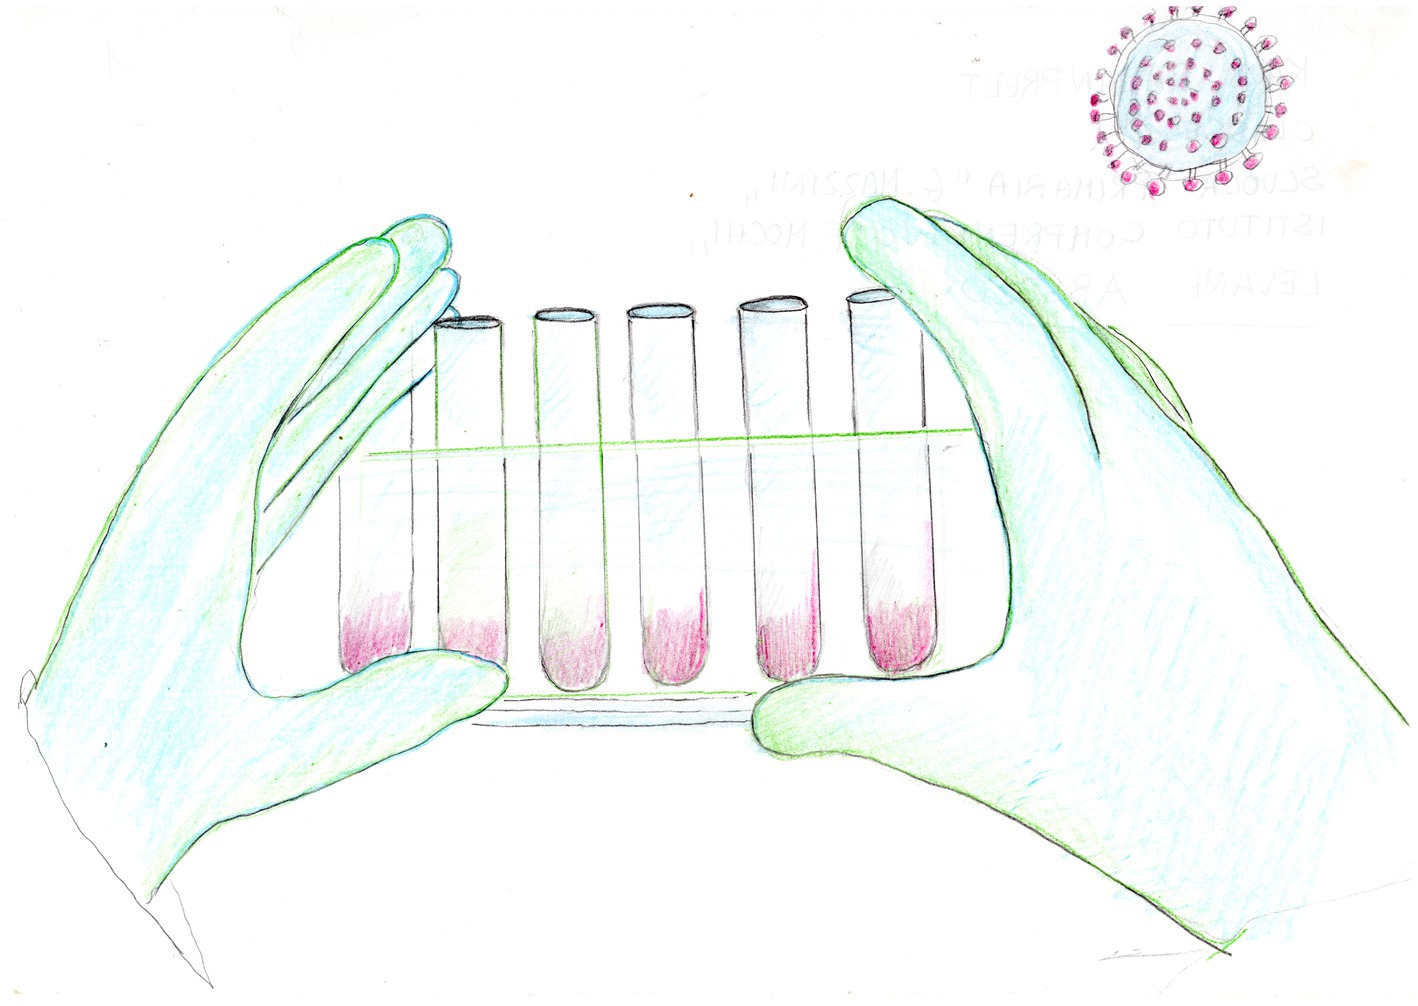
Figure 8. Drawing depicting the invention of the COVID19 vaccine (author Kaur class IV).
In our datasets, lab tools and technology tools are present, in 55.4% of the drawings in the 2011 dataset and in 80.7% of the 2021 dataset drawings. Children represent themselves as users of these tools to solve problems and improve the world. We define “tools” of science as instruments, utensils, or devices used by the scientists depicted or used to enrich the representation (Table 1). In both datasets, boys’ and girls’ drawings present science tools with similar percentages (Table 6).
The general results differ significantly between the two datasets. Accounting for 40.4%, the chemical category is by far the most represented in the 2011 dataset, in both girls’ and boys’ drawings, at 45.2% and 37.7%, respectively. Following this, accounting for 14.3%, is the computer category, and depicted slightly less frequently, at 14%, is the mechanics and technology category. Computers were included in a higher percentage of girls’ drawings than boys’, at 15.6% and 11.1%, respectively. For mechanics and technology, significantly more boys (19.3%) than girls (9.6%) depicted this category. Therefore, with 12.6% rocket and similar devices are present, with balanced gender percentages (Table 6). Mechanics and technology is the most represented category in the 2021 dataset, at 55.4%, also with a higher percentage for boys, at 58.9%, than for girls, at 51.7%. We registered a significant difference in the two datasets with respect to this category for both genders, with this category featuring in a higher percentage of girls’ drawings. The second tool is chemical, at 29.5%, which we observe in a higher percentage of girls’ drawings, at 34.2% than in boys’ drawings, at 25.2%. This is connected to the stronger presence of medical inventions in the 2021 dataset, as described above. The other categories are either not present or have no significant percentages (Table 6).
Concerning the scientific theme, we considered the scientific field that could be deduced from the drawing. According to the detected categories of Table 1, we coded 84.8% of 2011 dataset drawings and 95.5% of 2021 dataset drawings, with similar gender percentages (Table 7). Significant differences are detectable between the two datasets with respect to the scientific theme on which the drawing is focused. For 49.9% of the 2011 drawings, either there is no main scientific theme, they are too generic, or they regard personal needs or desires, Different meaning. The percentage is referred to the amount of drawings with the no main theme and not to the total of female o male drawings. The same category in the 2021 dataset ranks third and has similar gender percentages. In the 2021 drawings, the first scientific theme, accounting for 44.5%, is the environment, with slightly higher percentages among girls. The environment ranks third in the 2011 datasets, as second is the robotic and engineering category, at 17.2%, which is featured in 21.4% of boys’ drawings. Second in the 2021 dataset is the medicine and health category, which, as already mentioned, is connected to the COVID-19 pandemic. For this analysis, we outline the change in the focus of themes (i.e., medicine, environment, and humanitarian) in the 2021 dataset with respect to the 2011 dataset, in which the focus was mainly on personal needs and desires. This evidences a significant grooving of children’s sensibility related to community and society needs, as observed worldwide (Global Humanitarian Overview report, 2023).
Scientists are depicted working in groups in both datasets, accounting for 5.7% and 6.8% of drawings in the 2011 and 2021 datasets, respectively. Girls depicted scientists working in groups significantly more than boys, suggesting girls assumed research to be cooperative work.
Concerning the comments added to drawings, as shown in Figure 7, some words are well represented in both years. “Science” and “scientist” are the main words in both datasets, as well as “invention,” “the machine” (e.g., time-machine), “the car,” “planet,” “robot,” “pollution,” “earth,” “fly” (e.g., the flying car), “discover,” “study,” “create,” “transform,” “energy,” “good,” “help,” “solar,” “plant,” “future,” “world,” and “moon.” These concepts describe what the scientist is working on (invention, energy), which theme their activity belongs to (the time machine, the flying car, robot, pollution, green energy), and how they are working (discover, study, solve, invent, create, transform, and help). Some words are more represented in the 2011 dataset, such as “kid,” “laboratory,” “experiment,” “succeed,” “automated,” and “magic.” Some new words in 2021 are correlated to the pandemic situation, like “cure,” “solve,” “coronavirus,” “problem,” “vaccinate,” and “sick,” while others are correlated with an increased awareness of the environment and the causes of pollution or the solutions to environmental issues, like “garbage,” “plastic,” “ozone,” “pollution,” “recycle,” “ecologic,” and “solar.” Stereotypical words that are associated with an explosion, like “BOOM,” or that describe the scientist, like “mad,” are more represented in the 2011 dataset, while others, like “potion,” are more present in the 2021 dataset.
7 General remarks
In this work, we analyzed drawings from two calendar competitions focused on primary school students’ perceptions of science and scientists. We observed similarities and significant differences in the 10 years that separate the datasets. Even if the scientist is still generally depicted as a man, we outlined a significant increase in female scientists in the 2021 dataset. Female scientists were drawn by girls, a sign that they feel a sense of belonging and are aware of their potential to be a scientist. This trend may positively impact girls’ perceptions of their future, possibilities, and aspirations. Abundant research has demonstrated gender bias in many demographic groups but has yet to experimentally investigate how this impacts the choice of an academic career (Berra et al, 2020).
Moreover, female scientists are portrayed as good-looking and well-dressed women. These results are aligned with what emerged in a study by Bozzato et al. (2021). The image of a “mad scientist” is still present, mainly in relation to male scientists. More specifically, what emerges in our datasets is that boys more frequently drew an older “mad scientist” with crazy hair, involved in an individual activity.
The percentage of inventions in the 2021 dataset showed an indicative increase, possibly reflecting greater confidence in the potential benefit of science. Concerning inventions, children are, first of all, technologists. Boys drew inventions more than girls, and the two datasets show no particular differences. Several wide-ranging inventions impact the environment, which is indicative of the ambition to act against climate change and pollution. Many are fantastic and complex inventions involving water and waste recycling systems, ecological fuel-powered machines, and machines for producing alternative and sustainable energy, sometimes accompanied by detailed explanations of how they work. It should be noted that the environmental themes show an increase from 13% of drawings in 2011 to more than 44% in 2021. This result might be a clear sign of a significant positive implementation over the years of awareness of climate change in the younger generation. We observed this sign in the children’s comments, too (i.e., garbage pollution, plastic, ecologic, solar, energy, recycle, and environment; Figure 8). This can be seen as a positive sign regarding how scientists have been able to efficiently transmit scientific data over the years, both to society and in relation to the mass media. Many inventions fantasize about space and time travel, featuring rockets and spaceships, probably suggested by the recurring images in cartoons and films. These inventions feature in a higher percentage of the drawings in the 2021 dataset; children may have perceived this target as more feasible due to the advances in space technologies. In the 2021 dataset, pupils created their drawings during the COVID-19 health emergency. This situation affected the theme of the drawing, mainly because they chose to include the vaccine against the virus as an invention, as well as including related terms in comments (i.e., “cure,” “sick,” “vaccinate,” “coronavirus”; Figure 8).
The inventions that realize dreams or fulfill special requirements and satisfy personal tastes, such as a ‘cloud’ that shoots ice cream (Davide’s drawing in Figure 1) or “fall asleep” pajamas (Giulia’s drawing in Figure 2), appear together with inventions for a better quality of life or social as “ducks shoot water” to put out fires (Diego’s drawing in Figure 2), or those that help in the field of caring for humans, such as a “transporting tube for older people” (Giovanna’s drawing in Figure 1).
Since the competition was promoted by INGV, a scientific institution dealing with Earth science research and real-time seismic and volcanic surveillance, some drawings refer to volcanoes, usually depicted during eruption, and, less frequently, to earthquakes. For example, in the 2011 dataset, inventions include a “shock-globe” that does not shake if an earthquake strikes and “anti-seismic shoes.” In the 2021 dataset, to avoid the destruction caused by an earthquake, children invented wheels to put under buildings, elastic concrete, and anti-tsunami fans.
Children situated their drawings mainly outdoors in 2021. Moreover, in 2021, we recorded a remarkable increment concerning the drawings situated in space, observed mainly for girls (from 6 to 21.4%). The achievements of Samantha Cristoforetti, European Space Agency astronaut and first European commander of ISS, might have influenced young girls to reach for the stars.
Finally, through the children’s drawings, we had the great privilege of briefly seeing into their amazing world. What emerges is a colorful and busy world, full of young scientists, who are confident in the power of science and technology, engaged in inventing devices to make us happy, to travel in space and time, and to solve the Earth’s problems. Science is perceived as a powerful tool capable of handling humanity’s continuous challenges.
8 Considerations, Strengths and Limitations, and Future Perspectives
The present study represents the first comparison in ten years of drawings of scientists created by primary school children distributed along the entire Italian territory, which is a significant and unique contribution. We performed the statistical analysis aware that manual coding implied interpretation and judgment on the part of the coder, as well as that statistics methods are true on average, are best applicable to quantitative data, and errors are possible in statistical decisions.
We do not have data on the cultural and social environment of the children or data on diversity (different summative traits, different origins, disabilities) to take into account in our analysis, as well as many factors of influence such as teachers, curricula, cultural and other variables. The themes proposed for both calendar competitions were open enough, allowing teachers to include them in the school curriculum and allowing broad participation. However, this could be a limitation because we do not know how the teachers presented the project and whether there were gender biases or indications on the subject. We do not know whether school textbooks were used, whether they show stereotypes, and if or how they have changed, although there have been no substantial changes in school curricula in the last ten years. Moreover, we know that drawings were done in the classroom, but more context information could help us comprehend the differences and the introduced biases. In the future, to overcome some of these limitations and to have information on the proposition of the topic and the context, we would like to introduce simple questionnaires designed for teachers, outlining how the competition topic was presented. However, children draw what they know in their style. They draw spontaneously with the interaction of perception functions, sensibility, emotions and motor function, adding the factor of the social experience. The analysis of other calendar contests on different topics may provide the possibility to better comprehend if the positive trend that we have observed continues. Based on the amount of data the database is extensive, with widespread participation from schools throughout Italy, making it a robust and homogeneous dataset. The study considered and compared a wide spectrum of variables, from the representation of researchers, the presence of stereotypes, gender diversity to the scientific field. This method not only provides us with insights into the scientist and any potential stereotypes but also offers information about the scientific topics chosen by the children, the scientist’s working environment, the tools used in the research work (ranging from basic items like magnifying glasses to computers and more specialized equipment like distillers and electrophoresis) and whether science is perceived as an individual or group process for them.
Moreover, we have insights on current and urgent scientific topics such as COVID, viruses, environment and ecology. In our study, girl students associate women with science much more frequently than they did in the earlier decade. As gender equity is critical to the advancement of science in society, we consider this as a positive outcome. More generally, we observed in the changing of the main focus of the inventions, i.e. Environment and Humanity in the most recent dataset, a significant grooving of children’s sensibility related to community and society needs and a clear sign of a positive implementation over the years of awareness in the new generation of climate change. Finally, children, in their increasingly technological inventions, show closer confidence in the potential benefit of science in their everyday lives. These observations may be considered as positive indicators in societal attitude towards science and scientists and the increasing recognition of the importance of scientific knowledge and its cultural significance.
Data availability statement
The raw data supporting the conclusions of this article will be made available by the authors, without undue reservation.
Author contributions
GD’A conceived the research, organized the database, and performed the statistical analysis. NB supported the statistical analysis and performed the comments investigation. All authors contributed to the article and approved the submitted version.
Funding
The 2021-2022 edition of the INGV calendar benefited from the contribution of the NET 2021 Project, funded by the European Commission to promote the European Researchers’ Night (GD’A n. 955459).
Acknowledgments
The authors wish to thank the colleagues of the INGV Laboratorio di Grafica e Immagini for their contribution to the calendar creation and Sabina Vallati for their support in scanning the drawings.
Conflict of interest
The authors declare that the research was conducted in the absence of any commercial or financial relationships that could be construed as a potential conflict of interest.
Publisher’s note
All claims expressed in this article are solely those of the authors and do not necessarily represent those of their affiliated organizations, or those of the publisher, the editors and the reviewers. Any product that may be evaluated in this article, or claim that may be made by its manufacturer, is not guaranteed or endorsed by the publisher.
Supplementary material
The Supplementary material for this article can be found online at: https://www.frontiersin.org/articles/10.3389/feduc.2023.1179179/full#supplementary-material
References
Archer, L., and DeWitt, J. (2015). “Science aspirations and gender identity: lessons from the ASPIRES project” in Henriksen, E., Dillon, J., Ryder, J. (eds). Understanding student participation and choice in science and technology education (Dordrecht: Springer Netherlands), 89–102.
Berra, M., and Cavaletto, G. M. (2020). Overcoming the STEM gender gap: From school to work. Ital. jou. soc. edu. 12, 1–21. doi: 10.14658/PUPJ-IJSE-2020-2-1
Bian, L., Leslie, S.-J., and Cimpian, A. (2017). Gender stereotypes about intellectual ability emerge early and influence children’s interests. Science 355, 389–391. doi: 10.1126/science.aah6524
Blumberg, R. L. (2008). The invisible obstacle to educational equality: gender bias in textbooks. Prospects 38, 345–361. doi: 10.1007/s11125-009-9086-1
Bozzato, P., Fabris, M. A., and Longobardi, C. (2021). Gender, stereotypes and grade level in the draw-a-scientist test in Italian schoolchildren. Int. J. Sci. Educ. 43, 2640–2662. doi: 10.1080/09500693.2021.1982062
Brasini, F., Modonesi, D., Camassi, R., Ercolani, E., Pessina, V, Todesco, M, et al. (2020) “L’eruzione immaginaria. Un’indagine sulla rappresentazione del rischio vulcanico nella fantasia dei bambini.”
Brickhouse, N. W. (1998) in International handbook of science education. eds. K. Tobin and B. Fraser (New York: Kluw)
Brotman, J. S., and Moore, F. M. (2008). Girls and science: a review of four themes in the science education literature. J. Res. Sci. Teach. 45, 971–1002. doi: 10.1002/tea.20241
Chambers, D. W. (1983). Stereotypic images of the scientist: the draw-a-scientist test. Sci. Educ. 67, 255–265. doi: 10.1002/sce.3730670213
Chemers, M. M., Zurbriggen, E. L., Syed, M., Goza, B. K., and Bearman, S. (2011). The role of efficacy and identity in science career commitment among underrepresented minority students: efficacy and identity in science career commitment. Aust. J. Soc. Issues 67, 469–491. doi: 10.1111/j.1540-4560.2011.01710.x
Cherney, I. D., Seiwert, C. S., Dickey, T. M., and Flichtbeil, J. D. (2006). Children’s drawings: a mirror to their minds. Educ. Psychol. 26, 127–142. doi: 10.1080/01443410500344167
Christidou, V., Hatzinikita, V., and Samaras, G. (2012). The image of scientific researchers and their activity in Greek adolescents’ drawings. Public Understand Sci 21, 626–647. doi: 10.1177/0963662510383101
Crook, C. (1985). “Knowledge and appearance” in Visual order: The nature and development of pictorial representation. ed. M. N. H. V. Freeman (Cambridge, England: Cambridge University Press), 248–265.
D’Addezio, G. (2020). 10 years with planet earth: the essence of primary school children’s drawings. Geosci Commun 3, 443–452. doi: 10.5194/gc-3-443-2020
Elgar, A. G. (2004). Science textbooks for lower secondary schools in Brunei: issues of gender equity. Int. J. Sci. Educ. 26, 875–894. doi: 10.1080/0950069032000138888
Farland-Smith, D. (2012). Development and field test of the modified draw-a-scientist test and the draw-a-scientist rubric: development and field test of mDAST. Sch. Sci. Math. 112, 109–116. doi: 10.1111/j.1949-8594.2011.00124.x
Farokhi, M., and Hashemi, M. (2011). The analysis of children’s drawings: social, emotional, physical, and psychological aspects. Procedia. Soc. Behav. Sci. 30, 2219–2224. doi: 10.1016/j.sbspro.2011.10.433
Finson, K. D., Beaver, J. B., and Cramond, B. L. (1995). Development and field test of a checklist for the draw-A-scientist test. Sch. Sci. Math. 95, 195–205. doi: 10.1111/j.1949-8594.1995.tb15762.x
Fung, Y. Y. H. (2002). A comparative study of primary and secondary school students’ images of scientists. Res. Sci. Technol. Educ. 20, 199–213. doi: 10.1080/0263514022000030453
Global Humanitarian Overview (2023) [EN/AR/ES/FR] (no date) ReliefWeb. Available at: https://reliefweb.int/report/world/global-humanitarian-overview-2023-enaresfr (Accessed 27 February 2023).
Günindi, Y. (2012). Environment in my point of view: analysis of the perceptions of environment of the children attending to kindergarten through the pictures they draw. Procedia. Soc. Behav. Sci. 55, 594–603. doi: 10.1016/j.sbspro.2012.09.541
Katz, P. (2017) Drawing for science education: An international perspective. Rotterdam: SensePublishers.
Losh, S. C., Wilke, R., and Pop, M. (2008). Some methodological issues with ‘draw a scientist tests’ among young children. Int. J. Sci. Educ. 30, 773–792. doi: 10.1080/09500690701250452
Maoldomhnaigh, M. Ó., and Hunt, Á. (1988). Some factors affecting the image of the scientist drawn by older primary school pupils. Res. Sci. Technol. Educ. 6, 159–166. doi: 10.1080/0263514880060206
Master, A., Meltzoff, A. N., and Cheryan, S. (2021). Gender stereotypes about interests start early and cause gender disparities in computer science and engineering, PNAS, 118, e2100030118. doi: 10.1073/pnas.2100030118
Newton, D. P., and Newton, L. D. (1992). Young children’s perceptions of science and the scientist. Int. J. Sci. Educ. 14, 331–348. doi: 10.1080/0950069920140309
Newton, L. D., and Newton, D. P. (1998). Primary children’s conceptions of science and the scientist: is the impact of a National Curriculum breaking down the stereotype? Int. J. Sci. Educ. 20, 1137–1149. doi: 10.1080/0950069980200909
Pienta, R. S., and Smith, A. M. (2012). “Women on the margins” in Hickman, H., Porfilio, B.J. (eds). Constructing knowledge (Rotterdam: SensePublishers), 33–47.
Riposati, D., D’Addezio, G., di Laura, F., Misiti, V., and Battelli, P. (2020). Graphic design and scientific research – the National Institute of geophysics and volcanology (INGV) experience. Geosci Commun 3, 407–425. doi: 10.5194/gc-3-407-2020
Rodari, P. (2007). Science and scientists in the drawings of European children. J. Sci. Commun. 6:C04. doi: 10.22323/2.06030304
Rubbia, G., D’Addezio, G., Marsili, A., and Carosi, A. (2015). Science and scientists from a child’s point of view: an overview from drawings. Geol. Soc. Spec. Pub. 419, 161–170. doi: 10.1144/sp419.11
Ruiz-Mallén, I., and Escalas, M. T. (2012). Scientists seen by children: a case study in Catalonia, Spain. Sci. Commun. 34, 520–545. doi: 10.1177/1075547011429199
Seligman, M. E. P. (2013) Flourish: A visionary new understanding of happiness and well-being. New York, NY: Simon & Schuster.
She, H.-C. (1998). Gender and grade level differences in Taiwan students’ stereotypes of science and scientists. Res. Sci. Technol. Educ. 16, 125–135. doi: 10.1080/0263514980160203
Thomas, G. V., and Silk, A. (1990) An introduction to the psychology of children’s drawings. New York, NY: New York University Press.
Keywords: children drawings, perception of science, gender divergence, statistical analysis, science stereotype
Citation: D’Addezio G and Besker N (2024) Science and scientists from children’s point of view: comparison and gender outlooks among 2011 and 2021 primary school student drawings. Front. Educ. 8:1179179. doi: 10.3389/feduc.2023.1179179
Edited by:
Alex Hay-Man Ng, Guangdong University of Technology, ChinaReviewed by:
Oktian Fajar Nugroho, Universitas Esa Unggul, IndonesiaCarla Morais, University of Porto, Portugal
Copyright © 2024 D’Addezio and Besker. This is an open-access article distributed under the terms of the Creative Commons Attribution License (CC BY). The use, distribution or reproduction in other forums is permitted, provided the original author(s) and the copyright owner(s) are credited and that the original publication in this journal is cited, in accordance with accepted academic practice. No use, distribution or reproduction is permitted which does not comply with these terms.
*Correspondence: Giuliana D’Addezio, giuliana.daddezio@ingv.it