Eye-tracking measures as indicators for a local vs. global view of data
 Saskia Schreiter
 Markus Vogel
- Institute for Mathematics and Computer Science, Heidelberg University of Education, Heidelberg, Germany
Comparing data distributions is a fundamental activity in statistics and a motivating learning opportunity in schools to initiate statistical thinking. Research has shown that many students tend to perceive a data distribution as a collection of individual values rather than as a conceptual entity that has certain features such as center, spread, and shape. These difficulties are reflected in students’ tendency to focus on local details of the distribution (so-called local view of data) instead of referring to differences between the distributions as a whole (so-called global view of data). While many authors refer to school students’ conceptions and difficulties related to their view of data, there is, to the best of our knowledge, no empirical study that investigated their actual viewing behavior (local vs. global) when comparing distributions. The central assumption of this study is that specific eye-tracking measures constitute indicators for the perceiving and processing of local vs. global distributional features. For this purpose, hypotheses for differences in certain eye-tracking measures (fixation count, saccade amplitude, and saccade direction) between students with a local and global view of data were theoretically derived and empirically investigated using a methodological combination of eye-tracking and stimulated recall interviews. We analyzed data of 25 sixth-grade students who each completed four items on distributional comparisons. The results showed strong positive inter-item correlations for all eye-tracking measures, indicating high internal consistency in participants’ gaze behavior across all items. Based on the analysis of the eye-tracking stimulated recall interviews, we split our sample into those students who perceived and processed global features in half or more of the items (global view) and those below that threshold (local view). In line with our theoretically derived hypotheses, students with a global compared to a local view of data had on average significantly fewer fixations, longer saccade amplitudes, and a higher relative number of horizontal saccades. These results suggest that eye-tracking can assist in identifying students’ conceptions and difficulties related to a local vs. global view of data. Implications for school practice and further research are discussed.
1. Introduction
Comparing data distributions is a fundamental activity in statistics (Ben-Zvi, 2004; Burrill and Biehler, 2011). In school, distribution comparisons provide motivating and challenging learning opportunities to initiate statistical thinking already before formal procedures of inferential statistics are known (Konold and Higgins, 2003; Frischemeier, 2019). There is a growing body of research that uses the context of distributional comparison to examine students’ conceptions of data distributions and how they relate to their data-based decisions regarding distributional comparison (e.g., Gal et al., 1989; Watson and Moritz, 1999; Ben-Zvi and Arcavi, 2001; Bakker and Gravemeijer, 2004; Ben-Zvi, 2004; Pfannkuch et al., 2004; Frischemeier, 2019). The results of these studies have shown that many students struggle with understanding a data distribution as a whole, as an entity that has many features such as center, spread, and shape. These difficulties are reflected in students’ tendency to focus on local details of the distributions (so-called local view of data; Bakker and Gravemeijer, 2004; Ben-Zvi, 2004) without attending to the differences between the two distributions as a whole (so-called global view of data, Bakker and Gravemeijer, 2004; Ben-Zvi, 2004).
While many authors refer to differences in school students’ view of data, there is, to the best of our knowledge, no empirical evidence that the perception and processing of local vs. global distributional features can be differentiated based on their specific viewing patterns. Using a combination of eye-tracking and stimulated recall interviews, the present study focuses on students’ visual attention and associations with their statistical thinking as they compare distributions and make a data-based decision. The central assumption of this study is that specific eye-tracking measures (fixation count, saccade amplitude, and saccade direction) constitute indicators for the perceiving and processing of local vs. global distributional features. The theoretical associations between those eye-tracking measures and students’ statistical thinking are outlined in the following and empirically investigated in the present study.
2. Theoretical background
2.1. Perspectives on data distributions: Local vs. global view
When comparing distributions, several information processing processes are involved, such as perceiving and interpreting features within distributions and putting them in relation between distributions. The distinction between global features that relate to the distribution as a whole (e.g., center, spread, and shape) and local features that refer to single or multiple data points of the distribution (e.g., extreme values and outliers) has been documented and discussed (e.g., Bakker and Gravemeijer, 2004; Ben-Zvi, 2004). These features (local and global) can be approached formally (e.g., calculating the arithmetic mean as a measure of center or the interquartile range as a measure of spread), but also in more exploratory and visual ways (e.g., visually estimating the mean or determining intervals with high density). When comparing two or more distributions, features have to be put in relation between the distributions, adding further relative insights such as regarding disjoint edge values (values that are present in one of the distributions and absent from the other), and common edge values (the first and last common values of the two distributions; Ben-Zvi, 2004).
An overview of global and local features of distributions that can be considered when comparing data distributions is provided in Table 1. This framework is based on Bakker and Gravemeijer (2004) and has been adapted for the purpose of this study with an explicit focus on visually determinable features of distributions. The structure of the framework can be read upward and downward (cf. Bakker and Gravemeijer, 2004): In the upward perspective (local view of data), students typically see the distribution as a collection of individual data points from which they can determine the mean, range, or quartiles, for example. However, this does not necessarily imply that students view these characteristics as measures of center and spread or as representatives of a group (Konold and Pollatsek, 2004). Therefore, it is important that students also develop the downward perspective (global view of data), which is considered essential for statistical data analysis (Ben-Zvi, 2004; Konold et al., 2015). In this perspective, students view data with a notion of distribution as a conceptual entity on its own that has many features such as center, spread/density, and shape. Statistical experts can easily combine the two perspectives (Bakker and Gravemeijer, 2004).
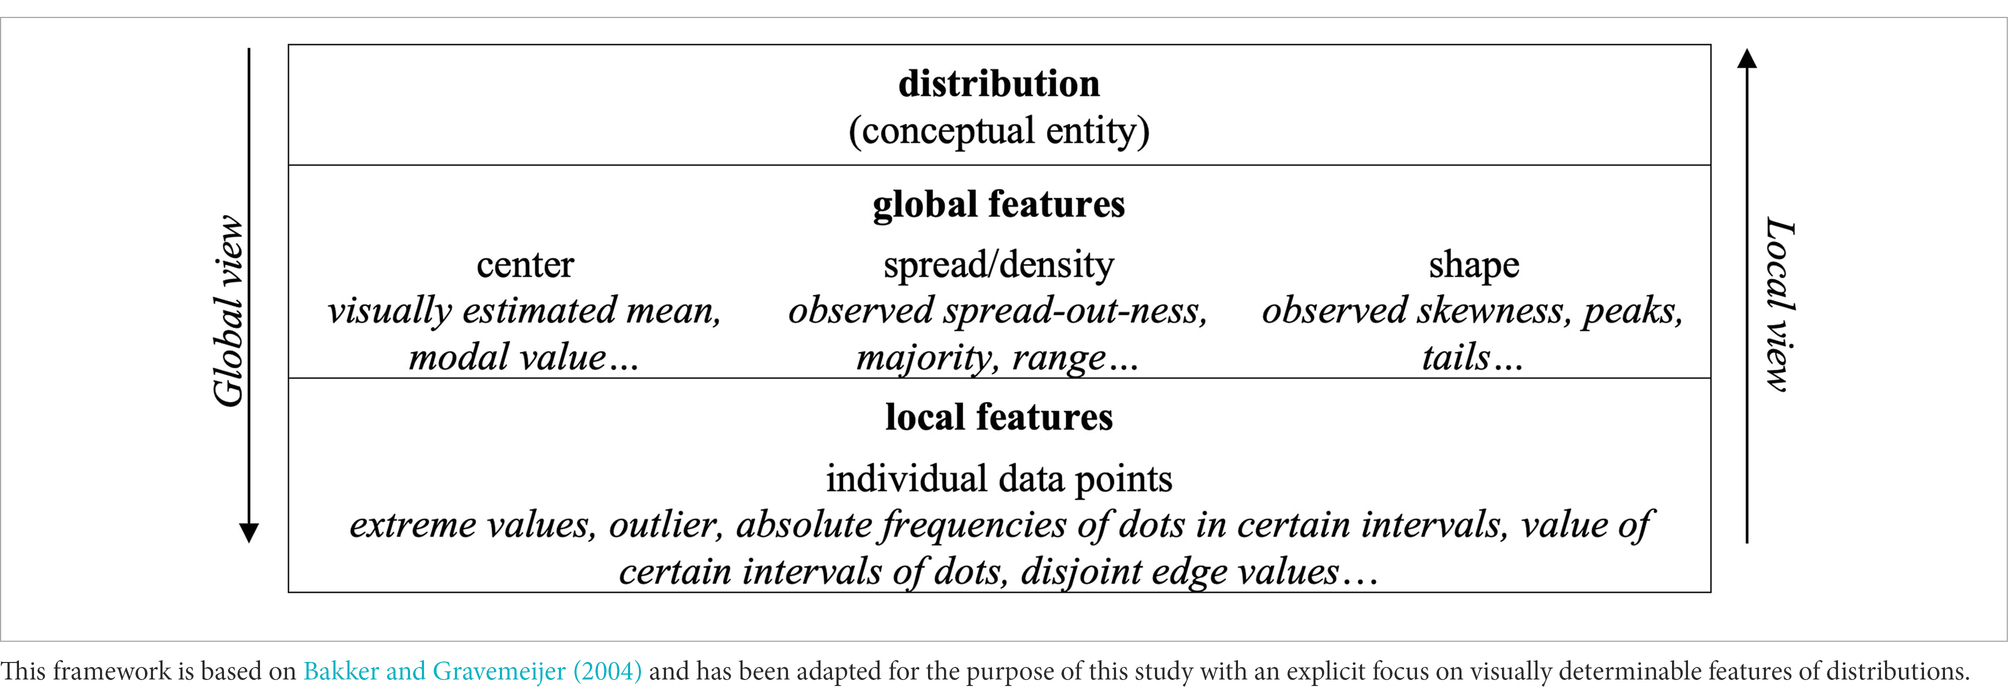
Table 1. Perspectives on data distributions: Local vs. global view.
Students’ difficulties in understanding a distribution as a whole have been repeatedly documented in research and seem to remain even after instruction in statistics (Ben-Zvi and Arcavi, 2001). For example, students who have already learned to determine formal measures such as the mean and median do not use them when comparing distributions (e.g., Konold et al., 1997; Watson and Moritz, 1999). Even among undergraduate students, difficulties to interpret and compare the variability between two dot plots seem to persist (Lyford, 2017). Instead, students often stick to local additive strategies, also when group sizes are unequal or visual inspection could lead to a straightforward answer (Gal et al., 1989). When comparing data distributions that are represented as dot plots, local strategies repeatedly reported for students include counting and comparing absolute frequencies of dots in certain intervals or calculating and comparing the value of certain intervals of dots (Gal et al., 1989; Watson and Moritz, 1999; Schnell and Büscher, 2015). Likewise, Konold et al. (2015) identified four general perspectives that students from elementary to high school use in working with data. In addition to a global aggregate perspective, these include regarding data as pointers (to the event or context from which the data came), as case values (that provide information on the value of individual cases), and as classifiers (that give information about the frequency of cases that are combined into a new unit).
However, a number of informal strategies that students use to compare groups have been shown and interpreted as steps from a local to a more global view of data. For example, learners use informal terms such as “bumps,” “clumps” or “hills” to describe and compare the shape of distributions (e.g., Cobb et al., 2003; Bakker and Gravemeijer, 2004). Konold et al. (2002) and Frischemeier (2019) described how students build ranges in the middle of distributions, so-called “modal clumps”, that can be seen as pre-concepts for both center and spread. Bakker and Gravemeijer (2004) demonstrated that students divide distributions into three groups (of low, middle, and high values), which can be interpreted as informal reasoning about density.
While many studies focused on students’ statistical reasoning involved in the comparison of data distributions, little is known about the underlying perceptual and attentional processes that guide students in choosing or dismissing features. Theoretically derived associations between specific patterns in students’ gaze behavior and their statistical thinking are outlined in the following.
2.2. Eye-tracking for investigating students’ mathematical thinking
Numerous studies in mathematics education research have shown that eye-tracking has the potential to provide new insights into students’ mathematical thinking and learning (for an overview, see Lilienthal and Schindler, 2019; Strohmaier et al., 2020). However, existing research does not cover all mathematical topics in the same depth. The field of statistics, for example, was identified as a domain with rarely any eye-tracking studies (Strohmaier et al., 2020), although aspects of visualization and mental representations play a vital role in this domain. There are just a few very recent studies that used eye-tracking technology to study students’ strategies and difficulties when interpreting and comparing statistical graphs such as histograms (e.g., Boels et al., 2019; Lyford and Boels, 2022). Eye-tracking is a suitable method to obtain information about visual attention and cognitive processing while students are solving problems, especially when visual strategies are involved (e.g., Andrà et al., 2009; Klein et al., 2018; Malone et al., 2020). A major advantage of the eye-tracking method is that students’ solution processes can be observed without interrupting them (e.g., Inglis and Alcock, 2012; Obersteiner and Tumpek, 2016). Furthermore, cognitive processes in mathematical thinking are often complex and may occur unconsciously. Nevertheless, these processes are reflected in students’ eye movements (e.g., Ott et al., 2018; Schindler and Lilienthal, 2019).
The most used eye-tracking measures are derived from fixations and saccades. A fixation is a period of time during which the eye remains relatively still on a visual stimulus and information can be absorbed (Holmqvist and Andersson, 2017). Saccades are periods where the eye moves very fast, lasting less than 100 ms (Holmqvist and Andersson, 2017). The amount of attention to specific objects is often measured by the number of fixations on these objects (e.g., Andrá et al., 2015; Schindler and Lilienthal, 2019). Furthermore, in their systematic review on eye-tracking in mathematics education research Strohmaier et al. (2020, p. 17) found that saccade amplitude is “used as an indicator for local (short saccades) compared to global (long saccades) strategies in information retrieval (Inglis and Alcock, 2012; Stolińska et al., 2014; Klein et al., 2018) and information integration (Godau et al., 2014).” Saccade direction is interpreted as indicative of search strategy (Poole and Ball, 2005) or the strategy of how a diagram is read (Klein et al., 2018). In addition, Khalil (2005) found that experts in comparison to novice data analyzers show more horizontal and less vertical search movements when visually inspecting and comparing graphs. This was also related to the observation that experts tend to use more global comparison methods whereas novices tend to use more local methods to compare data distributions.
It is important to consider that while eye-tracking data is rich in information, it is also complex and not always unambiguously interpretable (e.g., Schindler and Lilienthal, 2019; Strohmaier et al., 2020). Therefore, it is recommended for eye-tracking research to formulate clear hypotheses about the expected eye movement patterns based on theory and previous studies, rather than taking an exploratory approach (Orquin and Holmqvist, 2017). In addition, a methodological triangulation with other research methods, such as stimulated recall interviews, is recommended (e.g., Wyss et al., 2021). In an eye-tracking stimulated recall interview, participants are asked to retrospectively describe their own thoughts based on a video sequence of their eye movements (Hyrskykari et al., 2008). Visualizing eye movements serves as a memory aid to recall own actions and thoughts and has proven to be an effective method to stimulate reflection of internal cognitive processes (e.g., van Gog et al., 2005; Schreiter et al., 2022).
2.3. Eye-tracking measures as indicator for a local vs. global view of data
Students with a local compared to a global view of data allocate their attention on individual data points instead of viewing the distribution as a whole (e.g., Bakker and Gravemeijer, 2004; Ben-Zvi, 2004). Building on the above-illustrated theoretical associations between eye-tracking measures and cognitive processes (cf. 2.2), the aim of the present study is to explore students’ visual attention and related statistical thinking when comparing data distributions. Table 2 provides an overview of the above-introduced eye-tracking measures, their definitions (according to Holmqvist and Andersson, 2017), their theoretically derived interpretations (cf. 2.2), and their relevance for the research interest of this study. As the distributions presented in the study items consist of a high number of individual data points, students with a local compared to a global view of data should show a higher number of fixations, indicating that more attention is paid to the individual data points that make up the distribution (e.g., Schindler and Lilienthal, 2019). Saccade amplitude is interpreted as an indicator of local (short saccades) compared to global (long saccades) strategies in information retrieval (Strohmaier et al., 2020). Saccade direction is used as indicative of search strategy (Poole and Ball, 2005) or the strategy of how a diagram is read (Klein et al., 2018). To perceive global features such as center, spread, and shape, the distribution needs to be viewed as a whole. For the distributions shown in the items of this study (see Figure 1), this should result in longer saccade amplitudes and more saccades in the horizontal direction.
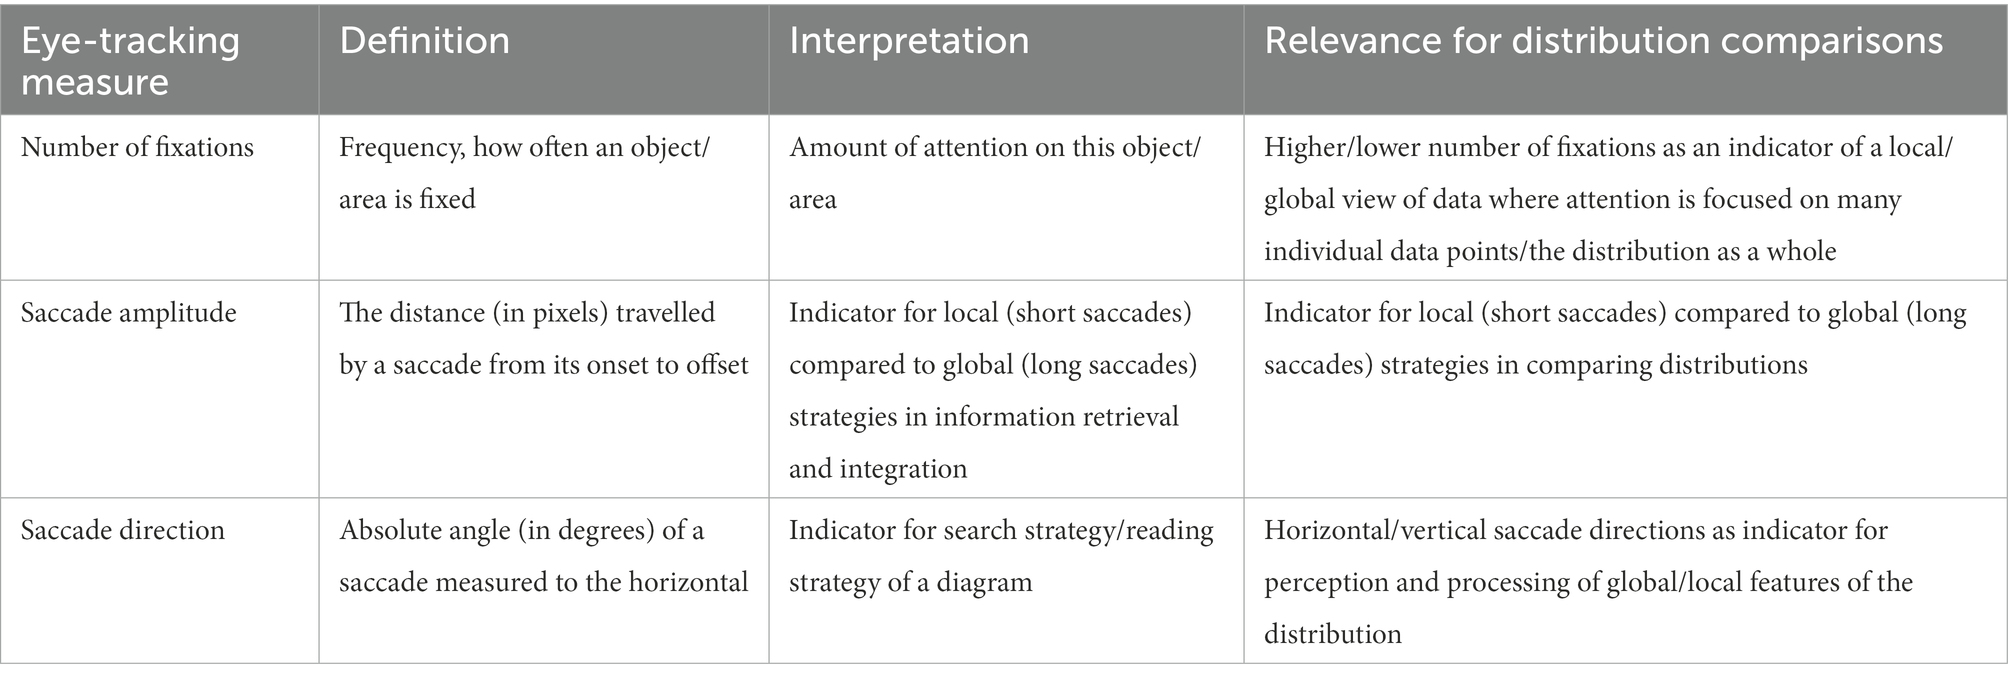
Table 2. Eye-tracking measures, definitions, interpretations, and potential relevance for distribution comparisons.
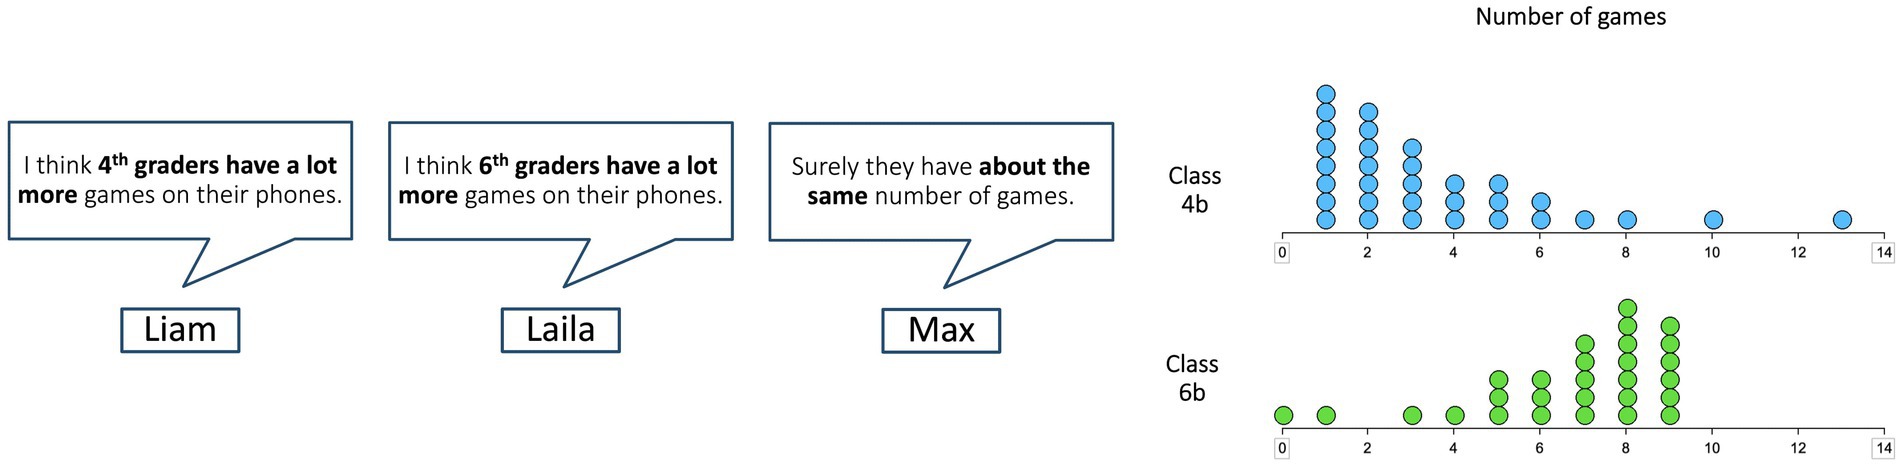
Figure 1. Sample item. Participants (N = 25) were shown three assumptions of children (left) before and after they analyzed and compared the distributions (right). Eye-tracking data were collected only while the distributions were presented.
3. The present study
The present study focused on students’ visual attention and associations with their statistical thinking (operationalized in this study as the perception and processing of local vs. global distributional features). Four items were constructed that involve a comparison of data distributions and require a data-based decision. We chose a methodological combination of eye-tracking and stimulated recall interviews—an approach that was shown to be effective to give insights into students’ visual attention and related cognitive processes. The following research questions were addressed:
RQ1: Which distributional features (local vs. global) do students perceive and process?
RQ2: Can the perception and processing of local vs. global distributional features (local vs. global view of data) be distinguished based on specific eye movement measurements?
Based on the theoretical considerations presented in chapter 2.3, we hypothesized that students with a global view compared to a local view of data have fewer fixations (H1), longer saccade amplitudes (H2), and a higher relative number of horizontal saccades (H3).
Moreover, we assume that it is more time consuming to focus attention on many individual data points compared to the distribution as a whole. Therefore, we expect that a local compared to a global view of data is characterized by longer total viewing times (i.e., the average time needed by the students to complete a task) (H4).
The following sections provide details on the design of the study setup and the quantitative and qualitative analysis used to investigate our hypotheses.
4. Methods
4.1. Sample
The sample consisted of N = 25 6th-grade students (56% female) from two German secondary schools. On average, participating students were 11.6 years old (SD = 0.57). The schools were of type Gymnasium, the highest track of secondary education in the German school system. According to their curriculum, students had been formally introduced to determine specific local distributional features (e.g., maximum, minimum) and global features of center (e.g., arithmetic mean), but not yet to determine measures of spread that are typically not introduced until grades 7/8. Students were recruited through their mathematics teachers, who agreed to participate in the study with their class. Participation was voluntary, all students had normal or correct-to-normal vision.
4.2. Material
Four items on distribution comparisons were developed for the purpose of this study. An example item is presented in Figure 1 (translated from the original German into English). All items include authentic comparison situations: data from a hypothetical survey regarding the topic “games on smartphone” are presented and compared between different groups of school students. In each item, participants are first presented with three assumptions of children and then they are shown data from the survey (cf. Figure 1). All tasks include an explicit request to draw a conclusion from the data presented in the task. Participants are asked to compare the samples and decide to which of the previously presented assumptions (in the example item: Liam, Laila, or Max, cf. Figure 1) the data fit. Features in which the distributions differ (such as center, spread, or shape) were varied between the items. In addition, the sample sizes (equal/unequal) were varied, so that one item with very different sample sizes was used, two items with slightly different sample sizes, and one item with equal sample sizes. Students were explicitly given the information of sample sizes before each item. This variation was chosen to test whether students might switch flexibly between local and global strategies depending on certain characteristics of the distribution comparison. For example, while comparing absolute frequencies of dots in certain intervals or comparing the value of certain intervals of dots are valid local strategies to compare samples of equal sizes, it is incorrect to do so when sample sizes are unequal. A pilot study was conducted with N = 20 grade 6 students to assess the comprehensibility of the items and study procedure.
4.3. Procedure
The study was conducted in the children’s schools. An environment to which the students were used should help reduce anxiety and nervousness. Participants received instructions and the four items were presented in randomized order on a 24-inch computer screen (Fujitsu B24T-7 LED, 1920 × 1,080 pixels). An example item was used to explain the study procedure to all participants in advance. The average distance from the participant to the monitor was around 60 cm. No chin rest was used as the system allows high quality of measurement accuracy even with smaller head movement. While participants worked on the tasks (which took an average 75.36 s per item, SD = 73.03), their eye movements were recorded with a monitor-based eye-tracker (Tobii pro fusion). The eye-tracker captured gaze data with a sampling frequency of up to 120 Hz and an average accuracy of 0.74° (SD = 0.47°). Before each task, a 9-point calibration was performed to achieve optimal recording of the eye-tracking data (Holmqvist and Andersson, 2017).
An eye-tracking stimulated recall interview was conducted directly following each task. Conducting eye-tracking stimulated recall interviews is an effective research method to investigate students’ cognitive processes by asking them to retrospectively describe their own thoughts and actions as precisely as possible based on a video of their own gaze movements (Schindler and Lilienthal, 2019). The core idea of eye-tracking stimulated recall interviews is to provide reflection-aiding stimuli (van Gog et al., 2005). For the interviews, we used the videos recorded by Tobii pro lab software (Tobii Pro, 2014). Eye movements were displayed by a red dot and lines connecting gaze points. During the interview, the interviewer showed a positive and interested attitude in the children’s descriptions without judging them. Both the interviewer and student could pause in the video, for example, if a participant wanted to describe in more detail the thoughts associated with a particular scene. For the recording of the interviews, Open Broadcaster Software (OBS)1 was used, which recorded image screen contents including sound, so that the videos of the gaze movements with the corresponding comments of the participants were available for the analysis.
4.4. Data and statistical analyses
4.4.1. Eye-tracking data
Analysis of the eye-tracking data was conducted with Tobii pro lab software. In each item, two areas of interest (AOIs) were created covering the two data distributions.
An I-VT algorithm (Salvucci and Goldberg, 2000) was used to detect fixations and saccades within the AOIs. Using the Tobii I-VT fixation filter (Tobii Pro AB, 2014), eye movements were classified either as part of a fixation if the velocity is below the threshold of 30°/s, or as part of a saccade if the velocity is equal or higher than this threshold. To determine the saccadic measures (saccade amplitude and saccade direction), raw gaze data were analyzed. Only saccades that have the immediately preceding and consecutive fixations within the same AOI were considered for the analysis. Saccades that start in one AOI and end in the other AOI are called transitions (Holmqvist and Andersson, 2017), and provide information about how distributional features (local or global) are put in relation between the two distributions. These saccades were not considered, as they are not relevant to the research interest of this study. Saccade direction was defined as the absolute angle of a saccade (in degrees) measured to the horizontal and calculated based on the coordinates of the immediately preceding and consecutive fixations using basic trigonometry (cf. Holmqvist and Andersson, 2017, p. 440f). Saccades were classified as horizontal if this angle was between 0° and |44|° and classified as vertical if it was between |45|° and |90|°.
One recording of one participant had to be excluded due to data loss, as the eye-tracker lost track of the participants’ eye.
4.4.2. Eye-tracking stimulated recall interview
Conducting eye-tracking stimulated recall interviews is an effective method to get insights into students’ mathematical thinking (cf. 2.2). In this study, this methodological approach was used to gain insight into the statistical thinking of students regarding the perception and processing of local and global distributional features. A mixed-methods approach was used to analyze the data. The videos of the interviews contained the gaze movements with the corresponding comments of the participants and were coded both deductively and inductively using qualitative content analysis (Rädiker and Kuckartz, 2019). Table 3 shows sample screenshots of gaze plots, related excerpts from students’ comments, and assigned categories. As the focus of the research presented here was on students’ statistical thinking while comparing data distributions, the coding procedure only referred to the process until the distribution comparison decision was made. The decision of the participants was not included in the data analysis presented here.
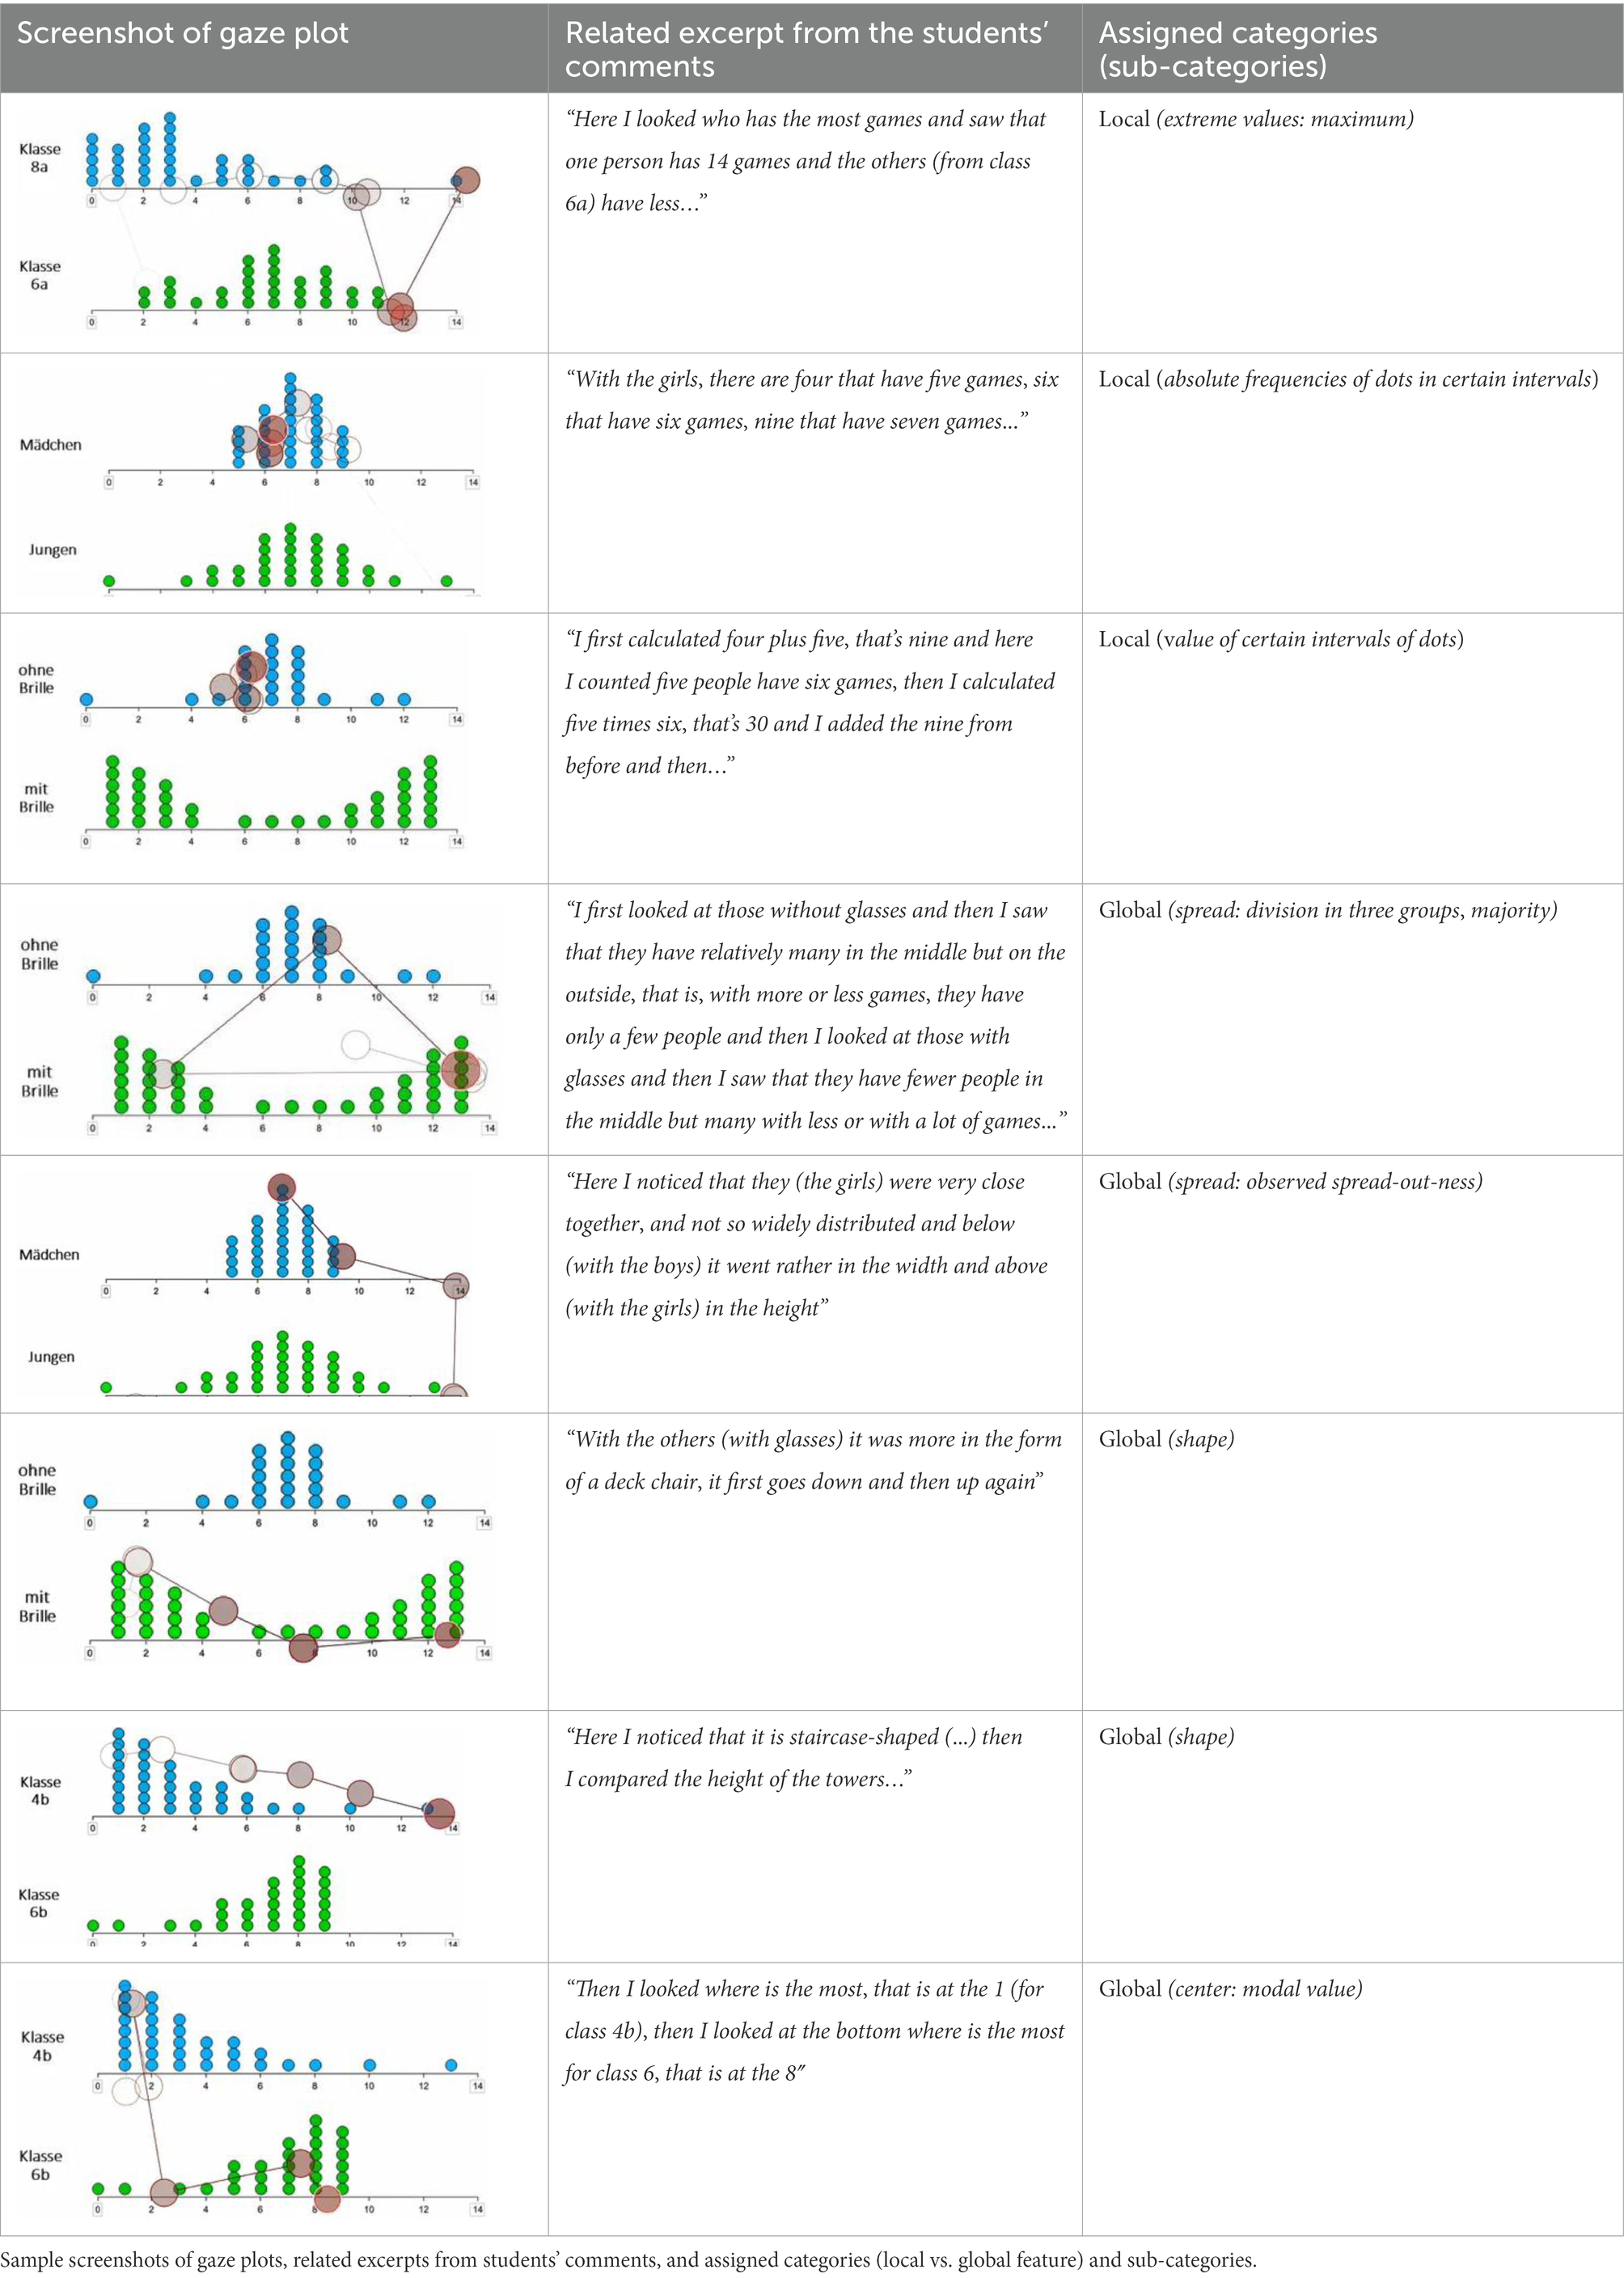
Table 3. Analysis of the eye-tracking stimulated recall interviews.
In total, 98 videos were coded. Two videos were excluded due to technical problems with screen recording.
The transcripts were coded by two raters with high interrater reliability (Cohen’s kappa = 0.87). The assigned codes were integrated into a quantitative data set to examine differences in viewing behavior (fixation count, saccade amplitude, and saccade direction) between students who perceived and processed predominantly local features compared to students who perceived and processed predominantly global features.
5. Results
5.1. Visual attention when comparing data distributions
In this study, specific eye-tracking measures were captured giving insight into students’ visual attention when comparing data distributions. Table 4 displays mean scores and standard deviations for the number of fixations, saccade amplitudes, and relative number of horizontal saccades (within AOIs), as well as for the total viewing time (i.e., the average time needed by the students to complete a task). High standard deviations indicate high interindividual differences in gaze behavior between participants. To measure to what degree the viewing behavior of participants is interrelated across all four items used in this study, inter-item Pearson’s correlations were calculated. The results show strong positive inter-item correlations for all eye-tracking measures, indicating high internal consistency in participants’ gaze behavior across all items (Table 4). This implies that although the participating students show very different gaze behavior among themselves, the same child remains relatively constant across items. Thus, the collected eye-tracking measures appear to be comparable across the four items considered in this study.
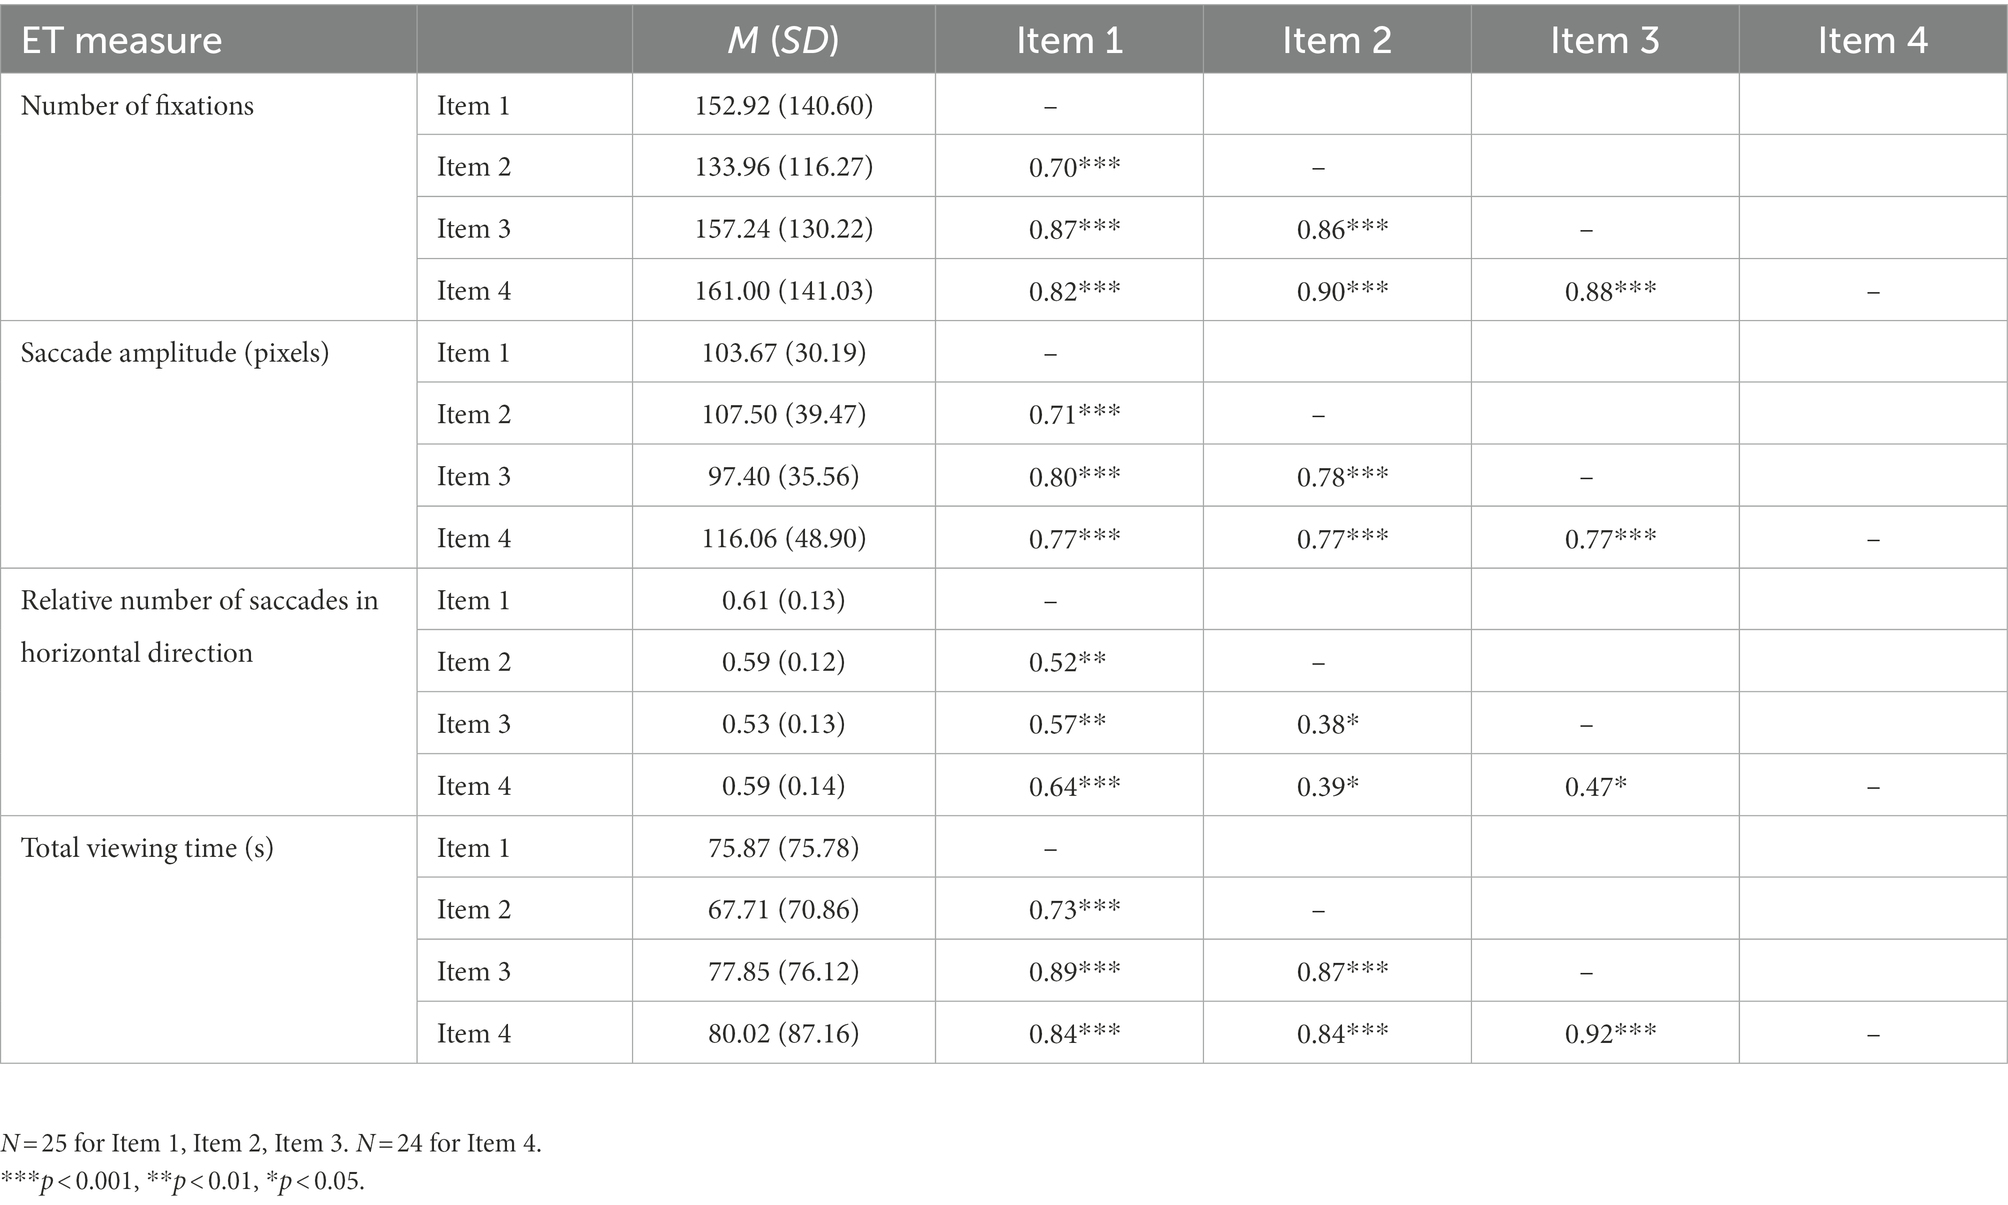
Table 4. Means, standard deviations, and inter-item Pearson’s correlations for eye-tracking measures.
5.2. Statistical thinking when comparing data distributions
To gain information on students’ statistical thinking with regard to the perception and processing of global and local distributional features, we analyzed the eye-tracking stimulated recall interviews in a qualitative manner. The results showed that out of the 25 participants, eight students did not consider global features in any of the four items, two students considered at least one global feature in one of the items, three students in two of the items, three students in three of the items, and nine students in all four items. Thus, the vast majority of the students (68%) did either not consider global features in any of the items or in all four items. This showed that most students stayed relatively constant in their comparison strategy across all items. The students who did not consider any global characteristics across all items are to be classified as problematic in this context. These students remained with local strategies (e.g., comparing absolute frequencies of dots in certain intervals or comparing the value of certain intervals of dots), even if sample sizes are unequal, which is an incorrect strategy in these cases.
Regarding global features, students’ utterances were assigned to the three categories center, spread/density, and shape. The category spread/density was often assigned as students divided the distributions into three groups (of low, middle, and high values) or identified and compared areas with particularly many dots (so-called modal clumps). Sometimes, students also referred to range and compared how “spread out” or how “close together” the data points of the distribution are. The category center was mainly assigned to students who identified and compared the modal values of the two distributions. Only once the category was assigned to a student who visually estimated and compared the means of both distributions. Regarding shape, students’ utterances were very different, comparing the shape of the distributions for example to stairs that go up and down or to a deckchair (first down, then up again). Sometimes students also chose mathematical terms such as “symmetrical” or “triangle shaped” to describe the distributions’ shapes.
5.3. Eye-tracking measures as indicators for a local vs. global view of data
The central assumption of this study was that the perception and processing of local vs. global features can be distinguished using specific eye-tracking measures. To test this assumption, we split our sample into those students who perceived and processed at least one global feature in at least half of the items (from now on referred to as students with a global view) and those students below that threshold (from now on referred to as students with a local view). Subsequently, two-tailed t-tests were calculated to test whether students with a local and global view differed with respect to the collected eye-tracking measures. The results show significant group differences with high effect sizes for all collected eye-tracking measures (Table 5).
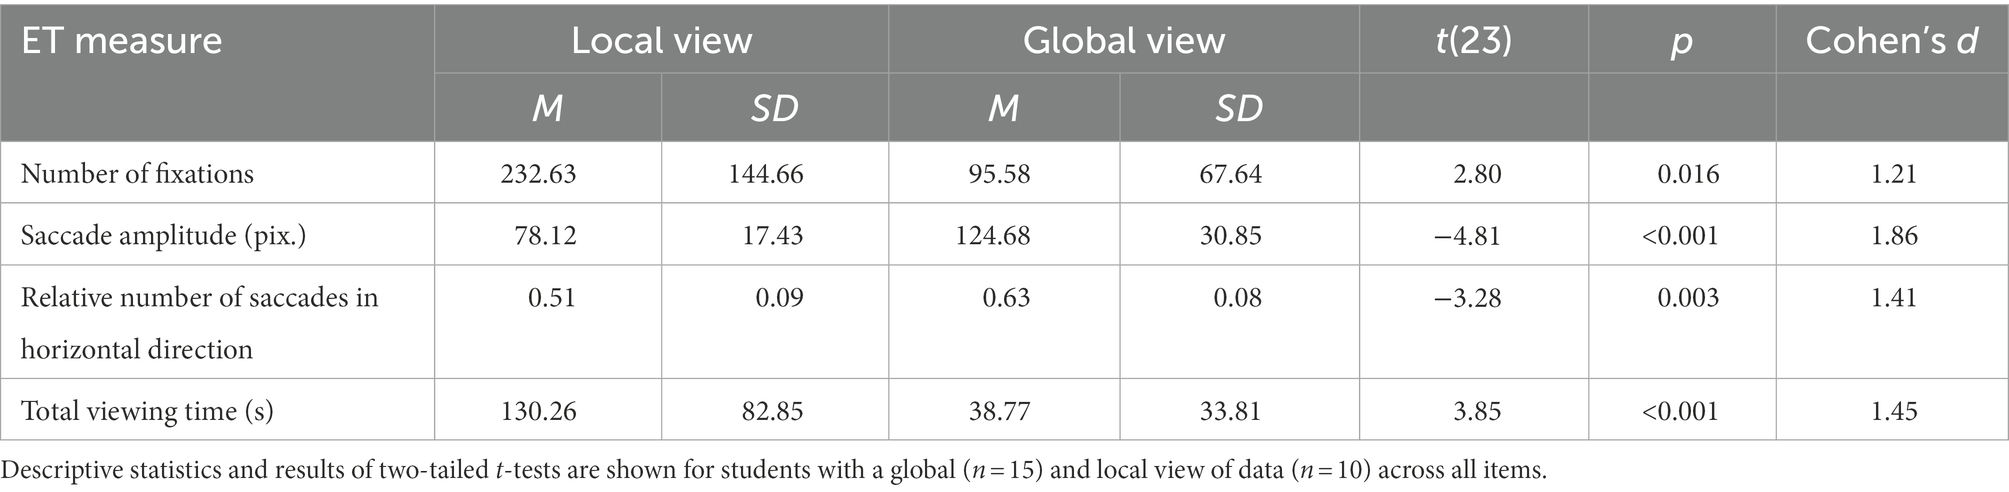
Table 5. Descriptive statistics and t-test results for eye-tracking measures of students with a local vs. global view of data.
The empirical data confirmed all of our theoretically derived hypotheses: students with a global compared to a local view of data showed on average significantly fewer fixations (H1), longer saccade amplitudes (H2), and a higher relative number of horizontal saccades (H3). These group differences consistently showed high effect sizes. In line with our expectations, significant group differences also emerged at the total viewing time. Students with a global view of data needed less than half the time to draw a data-based decision regarding the distribution comparison compared to students with a local view of data (cf. Table 5). However, there was a strong positive correlation between total viewing time and the number of fixations (r = 0.905, p < 0.001), which is why these measurements cannot be considered independent of each other.
6. Discussion
This study investigated students’ visual attention and statistical thinking while comparing data distributions. The central assumption was that specific eye-tracking measures constitute indicators for the perception and processing of local and global distributional features (local vs. global view of data). In accordance with recommendations for the methodological approach of eye-tracking studies (e.g., Orquin and Holmqvist, 2017, see chapter 2.2), we theoretically derived hypotheses for differences in certain eye-tracking measures (fixation count, saccade amplitude, and saccade direction) between students with a local and global view of data and empirically investigated these using a methodological combination of eye-tracking and stimulated recall interviews.
With regard to the first research question, we analyzed which distributional features (local vs. global) students perceived and processed. The findings of the eye-tracking stimulated recall interviews revealed that most of the students did either not consider global features in any of the items or in all four items. Thus, students showed a certain consistency in their statistical thinking across all items. An essential characteristic of statistical data analysis is that it is mainly about describing global features of data distributions (e.g., Bakker and Gravemeijer, 2004; Ben-Zvi, 2004). Against this background, students who did not consider any or only rarely considered global characteristics across all items are to be classified as problematic. These students remained with local strategies (e.g., comparing absolute frequencies of dots in certain intervals), even if sample sizes are unequal, which is an incorrect strategy in these cases. These findings are in line with existing research that described students’ difficulties in understanding a distribution as a whole which seem to persist even after instruction in statistics (e.g., Konold et al., 1997; Watson and Moritz, 1999; Ben-Zvi and Arcavi, 2001). In their study, Gal et al. (1989, p. 6) found that “many students blindly added even when groups were of unequal sizes (…) even when a visual inspection of the data could lead to a straightforward decision.” Similar observations can be reported for many students that participated in this study. Before each item, students were explicitly given the information of sample sizes (which was unequal in three of four items). Nevertheless, students who chose local strategies in one item mostly sticked to them with the other items.
However, several students also used global features, such as center, spread/density, or shape to compare distributions. For example, students divided the distributions into three groups (of low, middle, and high values) or identified and compared areas with particularly many data points (so-called modal clumps). Similar strategies were observed in other studies (e.g., Konold et al., 2002; Bakker and Gravemeijer, 2004; Frischemeier, 2019) and interpreted as informal reasoning about spread and density. Sometimes, students also referred to range and used informal terms such as “spread out” or “close together” to describe the distributions. Regarding features of the center, students mostly compared the modal values of the two distributions, while a visual estimation of the arithmetic mean was hardly performed. Moreover, students also used informal terms such as “stair-case shaped” or more formal terms such as “symmetric” and “triangle-shaped” to describe and compare the shape of distributions. Similar attempts to describe a distribution’s shape were also observed in previous studies (e.g., Cobb et al., 2003; Bakker and Gravemeijer, 2004) and interpreted as steps from a local to a more global view of data.
To address our second research question, we investigated whether the perception and processing of local vs. global distributional features (local vs. global view of data) could be distinguished based on specific eye movement measures. Eye-tracking has proven to be an effective method to obtain information about students’ visual attention and cognitive processing while solving problems, especially when visual strategies are involved (e.g., Klein et al., 2018; Schindler and Lilienthal, 2019; Malone et al., 2020). We first wanted to check if the collected eye-tracking measures are comparable across the four items considered in this study. The analysis of the collected eye-tracking measures indicated high interindividual differences between the participants. These were evident for all four items. At the same time, results showed strong positive inter-item correlations for all eye-tracking measures, indicating high internal consistency in participants’ gaze behavior across all items. Consequently, although the participating students show very different gaze behavior among themselves, one and the same child remains relatively constant across items. Thus, the collected eye-tracking measures appear to be comparable across the four items.
Based on the analysis of the eye-tracking stimulated recall interviews, the sample was split into those students who perceived and processed global features in half or more of the items (global view) and those below that threshold (local view). In line with our theoretically derived hypotheses, students with a global compared to a local view of data on average had significantly fewer fixations (H1), longer saccade amplitudes (H2), and a higher relative number of horizontal saccades (H3). All group differences consistently showed high effect sizes. These results suggest that eye-tracking data can assist in identifying students’ conceptions and difficulties related to a local vs. global view of data. While many authors refer to school students’ conceptions and difficulties related to their view of data, this is, to the best of our knowledge, the first empirical study that investigated their actual viewing behavior in relation to their local vs. global strategies when comparing distributions. Understanding which features students attend their visual attention on and what is happening in students’ minds while they are visually focusing these features may provide further insights into how task design and instruction should be structured to guide students from a local to a global view on data, which is considered an important goal of statistics education (Ben-Zvi and Arcavi, 2001). Furthermore, the results of this study can provide an initial basis for the potential of eye-tracking as a diagnostic tool for detecting students’ conceptions and difficulties in distributional comparison.
As expected, significant group differences also emerged for total viewing time. Students with a global view of data took less than half the time to make a data-based decision regarding the distributional comparison than students with a local view of data. However, as the total viewing time is strongly correlated with the number of fixations, these measurements cannot be considered independent.
6.1. Limitations and implications for further research
We would like to emphasize that the findings of this study should be considered in the
light of some limitations.
The results and statistics of the study must be interpreted in light of the relatively small sample size. Potential influencing factors (e.g., age and topic-specific pre-knowledge) on students’ gaze behavior and on their performance in perceiving and processing local and global distributional features were not considered and should be investigated in future studies. It would also be interesting to study whether the presented eye-tracking measures can be applied to other data visualizations as indicators of a local and global view of data.
In addition, we only differentiated between students that perceived at least one global feature in half or more of the items (global view) and those students below that threshold (local view). However, also within these groups, students showed large differences. For example, within the group of global viewers, the performance of a student who only compared the modal values of the two distributions can be classified as less high than that of a student who considered several global features of center, spread/density, and shape and related them to each other. Future research should therefore examine performance differences within the groups of local and global viewers in more detail. This could include the number of global/local features considered, their statistical nature (center, spread/density, shape), and a distinction as to whether the perceived local/global features are put in relation or considered in isolation to make a decision regarding the distributional comparison.
6.2. Conclusion and future directions
The present study should be seen as a first step toward enhancing our understanding
of students’ visual attention and associated statistical thinking when comparing data distributions. The collected empirical data supported our theoretically derived hypotheses, showing that students with a global compared to a local view of data had significantly fewer fixations, longer saccade amplitudes, and a higher relative number of horizontal saccades. These results suggest that eye-tracking can assist in identifying students’ conceptions and difficulties related to a local vs. global view of data. Future research is necessary to study performance differences in students’ statistical thinking in more detail, including potential influencing factors on the part of students. Furthermore, the results of this study could serve as a starting point for future research that investigates the potential of eye-tracking as a diagnostic tool that can be used in teacher training or in school practice to detect and learn about students’ conceptions and difficulties in distributional comparison.
Data availability statement
The raw data supporting the conclusions of this article will be made available by the authors, without undue reservation.
Ethics statement
Ethical review and approval was not required for the study on human participants in accordance with the local legislation and institutional requirements. Written informed consent to participate in this study was provided by the participants’ legal guardian/next of kin.
Author contributions
Both authors listed have made a substantial, direct and intellectual contribution to the work, and approved it for publication.
Funding
This study was carried out as part of the graduate school “DiaKom” funded by the Ministry of Science, Research, and the Arts in Baden-Wuerttemberg, Germany.
Acknowledgments
We would like to thank all students and their teachers for participating in and supporting this study.
Conflict of interest
The authors declare that the research was conducted in the absence of any commercial or financial relationships that could be construed as a potential conflict of interest.
Publisher’s note
All claims expressed in this article are solely those of the authors and do not necessarily represent those of their affiliated organizations, or those of the publisher, the editors and the reviewers. Any product that may be evaluated in this article, or claim that may be made by its manufacturer, is not guaranteed or endorsed by the publisher.
Footnotes
References
Andrà, C., Arzarello, F., Ferrara, F., Holmqvist, K., Lindström, P., Robutti, O., et al. (2009). “How students read Mathematical Representations: An eye tracking study.” in Proceedings of the 33rd Conference of the International Group for the Psychology of Mathematics Education (Vol. 2). Aristotle University of Thessaloniki & University of Macedonia, Thessaloniki, Greece. eds M. Tzekaki, M. Kaldrimidou, & C. Sakonidis, 49–56
Andrá, C., Lindström, P., Arzarello, F., Holmqvist, K., Robutti, O., and Sabena, C. (2015). Reading mathematics representations: an eye-tracking study. Int. J. Sci. Math. Educ. 13, 237–259. doi: 10.1007/s10763-013-9484-y
Bakker, A., and Gravemeijer, K. P. E. (2004). “Learning to reason about distribution” in The challenge of developing statistical literacy, reasoning and thinking. eds. D. Ben-Zvi and J. Garfield (Netherlands: Springer), 147–168. doi: 10.1007/1-4020-2278-6_7
Ben-Zvi, D. (2004). Reasoning about variability in comparing distributions. Stat. Educ. Res. J. 3, 42–63. Available at: https://www.academia.edu/5736781/Reasoning_about_variability_in_comparing_distributions
Ben-Zvi, D., and Arcavi, A. (2001). Junior high school students’ construction of global views of data and data representations. Educ. Stud. Math. 45, 35–65. doi: 10.1023/A:1013809201228
Boels, L., Bakker, A., and Drijvers, P. (2019). “Eye tracking secondary school students’ strategies when interpreting statistical graphs” in Proceedings of the 43rd Conference of the International Group for the Psychology of Mathematics Education (Vol. 2). Pretoria, South Africa. eds. M. Graven, H. Venkat, A. Essien and P. Vale, 113-120.
Burrill, G., and Biehler, R. (2011). “Fundamental statistical ideas in the school curriculum and in training teachers” in Teaching statistics in school mathematics – Challenges for teaching and teacher education. eds. C. Batanero, G. Burrill, and C. Reading (Dordrecht: Springer), 57–69.
Cobb, P., McClain, K., and Gravemeijer, K. (2003). Learning about statistical Covariation. Cogn. Instr. 21, 1–78. doi: 10.1207/S1532690XCI2101_1
Frischemeier, D. (2019). Primary school students’ reasoning when comparing groups using modal clumps, medians, and hatplots. Math. Educ. Res. J. 31, 485–505. doi: 10.1007/s13394-019-00261-6
Gal, I., Rothschild, K., and Wagner, D. A. (1989). “Which group is better? The development of statistical reasoning in elementary school children” in Meeting of the Society for Research in Child Development (Kansas City, MO) https://eric.ed.gov/?id=ED315270
Godau, C., Wirth, M., Hansen, S., Haider, H., and Gaschler, R. (2014). From marbles to numbers—estimation influences looking patterns on arithmetic problems. Psychology 05, 127–133. doi: 10.4236/psych.2014.52020
Holmqvist, K., and Andersson, R. (2017). Eye Tracking: A Comprehensive Guide to Methods, Paradigms, and Measures. 2nd Edn. Lund, Sweden: Lund Eye-Tracking Research Institute.
Hyrskykari, A., Ovaska, S., Majaranta, P., Räihä, K.-J., and Lehtinen, M. (2008). Gaze path stimulation in retrospective think-aloud. J. Eye Mov. Res. 2, 1–18. doi: 10.16910/jemr.2.4.5
Inglis, M., and Alcock, L. (2012). Expert and novice approaches to Reading mathematical proofs. JRME 43, 358–390. doi: 10.5951/jresematheduc.43.4.0358
Khalil, K. A. I. (2005). Expert-novice Differences: Visual and Verbal Responses in a Two-Group Comparison Task [Master’s thesis]. University of Massachusetts: Amherst, MA, USA. Available at: https://scholarworks.umass.edu/theses/2428
Klein, P., Viiri, J., Mozaffari, S., Dengel, A., and Kuhn, J. (2018). Instruction-based clinical eye-tracking study on the visual interpretation of divergence: how do students look at vector field plots? Phys. Rev. Phys. Educ. Res. 14:10116. doi: 10.1103/PhysRevPhysEducRes.14.010116
Konold, C., and Higgins, T. L. (2003). “Reasoning about data” in A research companion to principles and standards for school mathematics. eds. J. Kilpatrick, W. G. Martin, and D. Schifter (Reston, VA: National Council of Teachers of Mathematics), 193–215.
Konold, C., Higgins, T., Russell, S. J., and Khalil, K. (2015). Data seen through different lenses. Educ. Stud. Math. 88, 305–325. doi: 10.1007/s10649-013-9529-8
Konold, C., and Pollatsek, A. (2004). “Conceptualizing an average as a stable feature in a Noisy process” in The challenge of developing statistical literacy, reasoning and thinking. eds. D. Ben-Zvi and J. Garfield (Netherlands: Springer), 169–199. doi: 10.1007/1-4020-2278-6_8
Konold, C., Pollatsek, A., Well, A., and Gagnon, A. (1997). “Students analyzing data: research of critical barriers” in Research on the role of Technology in Teaching and Learning Statistics: Proceedings of the 1996 IASE round table conference University of Granada, Spain. eds. J. Garfield and G. Burrill (Voorburg, The Netherlands: International Statistical Institute), 151–167.
Konold, C., Robinson, A., Khalil, K., Pollatsek, A., Well, A., Wing, R., et al. (2002). “Students use of modal clumps to summarize data.” in Developing a Statistically Literate Society: Proceedings of the Sixth International Conference on Teaching of Statistics, Cape Town, South Africa, 7-12 July 2002. eds. B. Philips (Voorburg, Netherlands: International Assoc. for Statistical Teaching), 1–6.
Lilienthal, A. J., and Schindler, M. (2019). “Eye tracking research in mathematics education: A PME literature review.” in Proceedings of 43rd Conference of the International Group for the Psychology of Mathematics Education (Vol 4). Pretoria, South Afrika. eds. M. Graven, H. Venkat, A. Essien, and P. Vale, 62.
Lyford, A. J. (2017). Investigating undergraduate student understanding of graphical displays of quantitative data through machine learning algorithms. Doctoral dissertation, University of Georgia. Available at: https://getd.libs.uga.edu/pdfs/lyford_alexander_j_201705_phd.pdf
Lyford, A., and Boels, L. (2022). “Using machine learning to understand students’ gaze patterns on graphing tasks.” in Bridging the Gap: Empowering & Educating Today’s Learners in Statistics. Proceedings of the 11th International Conference on Teaching Statistics (ICOTS11 2022), Rosario, Argentina. eds. S. A. Peters, L. Zapata-Cardona, F. Bonafini, & A. Fan (International Association for Statistical Education), 1–6.
Malone, S., Altmeyer, K., Vogel, M., and Brünken, R. (2020). Homogeneous and heterogeneous multiple representations in equation-solving problems: an eye-tracking study. J. Comp. Assist. Learn. 781–798. doi: 10.1111/jcal.12426
Obersteiner, A., and Tumpek, C. (2016). Measuring fraction comparison strategies with eye-tracking. ZDM 48, 255–266. doi: 10.1007/s11858-015-0742-z
Orquin, J. L., and Holmqvist, K. (2017). Threats to the validity of eye-movement research in psychology. Behav. Res. Methods 50, 1645–1656. doi: 10.3758/s13428-017-0998-z
Ott, N., Brünken, R., Vogel, M., and Malone, S. (2018). Multiple symbolic representations: the combination of formula and text supports problem solving in the mathematical field of propositional logic. Learn. Instr. 58, 88–105. doi: 10.1016/j.learninstruc.2018.04.010
Pfannkuch, M., Budgett, S., Parsonage, R., and Horring, J. (eds.) (2004). Comparison of data plots: Building a pedagogical framework. Paper presented at ICME-10, TSG11: Research and development in the teaching and learning of probability and statistics. Online available at: https://iase-web.org/Conference_Proceedings.php?p=ICME_10_2004.
Poole, A., and Ball, L. J. (2005). “Eye tracking in human-computer interaction and usability research: current status and future prospects” in Encyclopedia of human-computer interaction. ed. C. Gahoui (Hershey, Pa: IGI Global), 211–219.
Rädiker, S., and Kuckartz, U. (2019). Analyse qualitativer Daten mit MAXQDA. Springer Fachmedien Wiesbaden. doi: 10.1007/978-3-658-22095-2
Salvucci, D. D., and Goldberg, J. H. (2000). “Identifying fixations and saccades in eye-tracking protocols” in Proceedings of the 2000 symposium on eye tracking research & applications ETRA ’00 ed. A. T. Duchowski (New York, NY: ACM), 71–78.
Schindler, M., and Lilienthal, A. J. (2019). Domain-specific interpretation of eye tracking data: towards a refined use of the eye-mind hypothesis for the field of geometry. Educ. Stud. Math. 101, 123–139. doi: 10.1007/s10649-019-9878-z
Schnell, S., and Büscher, C. (2015). “Individual concepts of students comparing distributions” in Proceedings of the Ninth Congress of the European Society for Research in Mathematics Education, Charles University in Prague, Faculty of Education; ERME, Feb 2015, Prague, Czech Republic. eds. K. Krainer and N. Vondrová, 754–760.
Schreiter, S., Vogel, M., Rehm, M., and Dörfler, T. (2022). Die Rolle des Wissens angehender Mathematiklehrkräfte beim Diagnostizieren schwierigkeitsgenerierender Aufgabenmerkmale. Erkenntnisse aus Eye-Tracking Stimulated Recall Interviews. J. Math.-Didakt. 43, 101–133. doi: 10.1007/s13138-022-00203-z
Stolińska, A., Andrzejewska, M., Błasiak, W., Pęczkowski, P., Rosiek, R., Rożek, B., et al. (2014). “Analysis of saccadic eye movements of experts and novices when solving text tasks” in New Technologies in Science Education. eds. M. Nodzyńska, P. Cieśla, and K. Różowicz (Cracow: Pedagogical University of Cracow), 21–29.
Strohmaier, A. R., MacKay, K. J., Obersteiner, A., and Reiss, K. M. (2020). Eye-tracking methodology in mathematics education research: a systematic literature review. Educ. Stud. Math. 104, 147–200. doi: 10.1007/s10649-020-09948-1
Tobii Pro, A. B0. (2014). Tobii Pro lab (version 1.162.32461 (x64)) [computer software]. Danderyd, Sweden: Tobii Pro AB.
van Gog, T., Paas, F., van Merriënboer, J. J. G., and Witte, P. (2005). Uncovering the problem-solving process: cued retrospective reporting vs. concurrent and retrospective reporting. J. Exp. Psychol. Appl. 11, 237–244. doi: 10.1037/1076-898X.11.4.237
Watson, J. M., and Moritz, J. B. (1999). The beginning of statistical inference: comparing two data sets. Educ. Stud. Math. 37, 145–168. Available at: http://www.jstor.org/stable/3483313
Keywords: comparing distributions, local and global views of data, statistical thinking, eye-tracking, stimulated recall interviews
Citation: Schreiter S and Vogel M (2023) Eye-tracking measures as indicators for a local vs. global view of data. Front. Educ. 7:1058150. doi: 10.3389/feduc.2022.1058150
Edited by:
Maike Schindler, University of Cologne, GermanyReviewed by:
Achim J. Lilienthal, Örebro University, SwedenJodi Asbell-clarke, Technical Education Research Centers, United States
Lonneke Boels, Utrecht University, Netherlands
Copyright © 2023 Schreiter and Vogel. This is an open-access article distributed under the terms of the Creative Commons Attribution License (CC BY). The use, distribution or reproduction in other forums is permitted, provided the original author(s) and the copyright owner(s) are credited and that the original publication in this journal is cited, in accordance with accepted academic practice. No use, distribution or reproduction is permitted which does not comply with these terms.
*Correspondence: Saskia Schreiter, ✉ schreiter@ph-heidelberg.de