Study of 3-D velocity structure characteristics in Dadu river Houziyan reservoir area at different impoundment stages
 Zhenggang Yang1,2
  Junxing Cao1* Yuchuan Wu2 Juan Qin3* Huibao Huang4 Xingzhong Du2 Mingxing Yang5
  Jianchao Wu6
- 1College of Geophysics, Chengdu University of Technology, Chengdu, China
- 2Power China Guiyang Survey Design and Research Institute Co., Ltd., Guiyang, China
- 3Chongqing Earthquake Agency, Chongqing, China
- 4Guodian Dadu River Basin Hydropower Development Co., Ltd., Chengdu, China
- 5School of Resource and Environment Engineering, Guizhou Institute of Technology, Guiyang, China
- 6Hubei Key Laboratory of Earthquake Early Warning, Institute of Seismology, China Earthquake Administration, Wuhan, China
High-resolution three-dimensional VP, VS and VP/VS images in the Houziyan Reservoir Area were obtained by using Fast Marching Tomography Package (FMTOMO) with the travel time data from 6330 seismic events monitored by the Houziyan Reservoir Seismic Network. This analysis yielded the 3-D velocity structure, including longitudinal wave velocity (VP), shear wave velocity (VS), and the ratio of longitudinal and shear wave velocity (VP/VS) at different impoundment stages. The data changes at various impoundment times, depths of sections, and directions of profiles were analyzed to obtain these results. The final findings demonstrate the following results: 1) Through tomographic analysis, it was determined that the underground velocity structure in the Houziyan reservoir area was anisotropic before impoundment. 2) The area of high wave velocity increases in stage 1, stage 3, and stage 4. The area of low wave velocity increases in stage 2, especially in depth, indicating significant changes in the underground velocity structure at different impoundment stages. 3) Compared to the changes in underground velocity structures in other reservoirs after impoundment, the Houziyan reservoir exhibited a unique pattern. 4) In general, the underground velocity structure displayed an overall increasing trend after impoundment. However, it also exhibited instances of decreasing velocity, reflecting continuous dynamic adjustments to the underground velocity structure after impoundment. These conclusions highlight the impact of impoundment in the reservoir area on the underground velocity structure and provide scientific theoretical support for seismic risk assessment following impoundment in the reservoir area.
1 Introduction
Since the initiation of ‘The Development of the Western Region in China’ and ‘Electricity Transmission from West to East’ more than 2 decades ago, numerous reservoirs have been constructed in Western China. As China advances swiftly towards its goals of ‘Peak Carbon Dioxide Emissions’ and ‘Carbon Neutrality,’ the hydropower industry, a vital component of energy transformation, is expected to flourish (Fang et al., 2010; Li et al., 2022; Liu et al., 2022; Ma and Nie, 2022). However, the geological conditions in Western China are highly intricate, characterized by the presence of complex geological structures at high altitudes. Consequently, artificial projects such as reservoir dam construction and reservoir impoundment have elevated the risk of seismic activity (Su et al., 2020; Dou et al., 2022; Guo et al., 2022; Liu et al., 2023). Reservoir-induced seismicity (RIS) is a distinctive form of seismic activity that occurs within a defined timeframe in or around reservoir areas, primarily triggered by the processes of reservoir impoundment and drainage (Li et al., 2004; Rinaldi et al., 2020). To date, approximately 130 confirmed cases of RIS have been reported worldwide (Van Eijs et al., 2006; Basbous et al., 2022; Zheng et al., 2022). Despite most RIS events having low magnitudes, they can be highly destructive, causing damage to nearby dams and structures and even giving rise to secondary disasters like landslides and collapses, posing a threat to downstream safety (Che et al., 2009; Zhang et al., 2019). Consequently, RIS plays a crucial role not only in hydraulic and hydroelectric engineering research but also in the realms of seismology, regional structural stability, and environmental engineering geology research (Gaucher et al., 2015; Chang et al., 2022; Chen, 2022).
The impounded water level is a pivotal factor in triggering RIS events. Scholars widely concur that the likelihood of an earthquake induced by a high dam and a large storage reservoir is higher. Numerous studies have demonstrated a significant increase in the frequency of small and medium seismic activities around reservoirs following impoundment. Changes in reservoir water levels often serve as triggers for earthquakes, with sharp fluctuations in water levels capable of instigating major seismic events. Additionally, both the frequency and magnitude of reservoir-induced earthquakes tend to peak as the reservoir approaches its maximum water level (Liu and Zhang, 2016; Lizurek et al., 2021; Li and Luo, 2022). Research by Simpson has shown that an increase in nearby seismic activity is likely if the water level of a reservoir surpasses its original maximum level. Moreover, the occurrence of earthquakes is closely linked to the rate of change in the reservoir water level: seismic activity decreases when the rate is stable but surges when the rate changes (Simpson and Negmatullaev, 1981). Generally, seismic activity increases with rising water levels and decreases with falling water levels. However, in some cases, water levels exhibit a negative correlation with seismic activity, with induced earthquakes occurring after drainage. Prior to significant RIS events, small seismic enhancements, akin to ‘foreshocks,’ are often observed. Increased seismic activity typically follows a peak in water levels or a sudden change in the rate of water injection into the reservoir. Based on the timing of impoundment and earthquake occurrence, reservoir-induced earthquakes can be categorized as ‘fast response type earthquakes’ or ‘delayed response type earthquakes’. The elastic stress resulting from the water load leads to pore compression in the bottom rocks of the reservoir, causing an increase in pore pressure and a reduction in rock strength, which in turn triggers fast-response type earthquakes. In the case of delayed response types, their activity and lag time are associated with the diffusion of pore water pressure (Simpson et al., 1988). Research has indicated that the mechanism of reservoir-induced seismicity comprises reservoir load and pore pressure diffusion categories, with reservoir load mechanisms typically leading to fast responses and pore pressure diffusion mechanisms tending to induce delayed responses (Kinscher et al., 2023). A variety of factors, including the duration of the impoundment process and variations in geological configurations, can influence the lag time of each reservoir-induced earthquake (Kim et al., 2022).
Research into RIS events has shown that changes in underground media are reflected by tracking the wave velocity ratio in a reservoir area. This phenomenon can be attributed to three key factors: in addition to the aforementioned effects of fluid loading and pore pressure diffusion, another key factor is that the filling of the original ‘dry’ fractured faults with water reduces the frictional resistance of fault activity. Therefore, even small stress disturbances can easily cause rock fracturing. When seismic waves traverse the source area of a future significant earthquake, the transmission speed may fluctuate by a variable percentage, typically ranging from a few to more than ten percent. Changes in the stress state within the source area lead to alterations in the elastic modulus, causing variations in wave velocity (Wang et al., 2021; Bashir et al., 2022; Jin, 2022). Consequently, the study of the three-dimensional velocity structure, wave velocity ratio, and attenuation structure in a reservoir area can provide valuable insights into the subsurface fluid conditions (Xiong et al., 2013; Ersoy et al., 2019).
Seismic tomography is not only a crucial method for detecting transverse inhomogeneous structures in media at various scales within the Earth but also a major technology for constraining the distribution of geophysical parameters, including elastic, non-elastic, heterogeneity, and anisotropy parameters, which influence seismic wave propagation (Rawlinson et al., 2010; Zhao et al., 2016; Tan et al., 2022). Since the mid-1970s, seismic tomography has advanced rapidly and became an indispensable tool in modern seismology (Zhang and Thurber, 2006). In recent years, with increased attention to reservoir earthquakes and the establishment of reservoir seismic networks, seismic tomography has been widely utilized to invert the velocity structure of reservoir areas. Many scholars have gained a more accurate understanding of the fine velocity structures of the upper crust of reservoirs by using seismic tomography to analyze the velocity structure characteristics of seismic waves in a reservoir area, study the impact of reservoir water on crustal structure, and investigate the relationship between seismic activity and the distribution of velocity anomalies. In this paper, we use the Fast Marching Tomography Package (FMTOMO) developed by Rawlinson to invert the three-dimensional velocity structure of a reservoir area (Rawlinson and Sambridge, 2003; Rawlinson and Sambridge, 2004a; Rawlinson and Sambridge, 2004b). FMTOMO addresses the forward problem of travel time prediction through a multi-stage fast marching method based on the Fast Marching Method (FMM) and adjusts model parameters using a subspace inversion scheme to align with data observations. Employing FMTOMO for velocity structure inversion offers several advantages, including the ability to invert and track the travel time of various seismic phases, effectively simulate complex velocity and interface structures, perform velocity structure tomography calculations with combined seismic data from nearby, regional, and remote earthquakes, and simultaneously or separately invert various types of velocity structures, layer interfaces, or source locations.
The Dadu River Houziyan Reservoir Seismic Network in Kangding County, Ganzi Prefecture, Sichuan Province, commenced operations in October 2015. Up to November 2021, we have collected a substantial amount of seismic data from monitoring 6330 seismic events using this network. In this paper, we have used FMTOMO tomography to invert the underground velocity structure of this reservoir at different impoundment stages, enabling us to analyze the temporal and spatial characteristics of the velocity structure in the reservoir area at different impoundment stages, changes in the underground velocity structure due to reservoir impoundment, and the overall impact of impoundment. Furthermore, the data we have collected can provide valuable support for future research into the mechanisms of seismic activity in the Houziyan reservoir area, the influence of reservoir water infiltration on seismic activities and medium properties in the reservoir area, as well as earthquake prevention and disaster reduction efforts, among other aspects.
2 Data and methods
2.1 Structural setting and seismic activities in the reservoir area
The Dadu River Houziyan Hydropower Station was located in an alpine valley region in Kangding County, Sichuan Province, at the southeast tip of the Tibetan Plateau, the southernmost tip of the strong uplift area in northwest Sichuan, with alpines and rivers as the main landform (Tang and Yong, 2012). The Wenchuan-Miaoxian fault zone, trending in a northeast direction, and the Xianshuihe fault and Yuke fault zones, trending in a northwest direction, are developed around the reservoir area. Among them, the seismic activity of the Xianshuihe fault zone is the most intense. The Yuke fault is closer to the dam site. The regional geological structure and seismic geological setting of this reservoir area are very complicated. Seismic hazard analysis shows that this reservoir area is greatly affected by the seismic activities in the Xianshuihe fault zone. The area near the dam site is the main part of the Northwest Sichuan Plateau, which has been lifted to become a component of the Tibetan Plateau since the Quaternary. The faults near the dam site are relatively small in scale, and they are all early to mid-Pleistocene faults, with relatively weak activity and good preservation of the plateau surface. Also, the seismicity near the dam site area is relatively weak, with the maximum magnitude at MS5.7 (which occurred on 30 September 1972, about 19 km away from the site) and a few earthquakes at MS2.0.
There are 8 field observation stations in the Houziyan Reservoir Seismic Network, consisting of short-period seismometers (FSS-3M), seismic data collectors (EDAS-24GN), and other monitoring equipment. The completeness magnitude in the range of the reservoir area is ML0.5, which conforms to the data precision required for this research. The network was put into operation in October 2015. As of November 2021, 6330 earthquakes were monitored within the monitoring range (101.5°–102.5° east longitude, 30.2°–31.2° north latitude), which includes 3 earthquakes with magnitude ML4.0 or higher. See Table 1 for detailed earthquake magnitude statistics. The seismic location method in Sichuan-Yunnan region (Loc3dSB), developed by science and technology special project of earthquake industry ‘Compiling earthquake travel time table in Sichuan-Yunnan Region’, was used to locate the 6330 seismic events in the Houziyan Network, and The Chinese Sichuan-Yunnan three-dimensional velocity model is used for positioning velocity model. There is a total of 27799 Pg travel time data and 23961 Sg travel time data from 6330 earthquakes.

TABLE 1. The statistical table of earthquake magnitudes in the houziyan network (ML).
We have obtained the distribution diagram of epicenters (Figure 1) and the diagram of M-T of reservoir area earthquakes and water level (Figure 2) based on the monitoring data from the Houziyan Reservoir Seismic Network and data on water levels in the reservoir area. The diagrams reveal the following observations: 1) Seismic activity is relatively weak before impoundment. The number of earthquakes significantly increases during the initial impoundment stage, with most of them being weak earthquakes with a magnitude of ML2.0, and only a few are felt earthquakes; 2) During the initial impoundment stage, there is a clear correlation between induced seismic activities increases with the increase of reservoir water levels. However, as the impoundment time lengthens, seismic activities in the reservoir area appear to be influenced by the disturbance of the regional stress field; 3) The epicenters of the earthquakes are generally widely distributed around the reservoir area, particularly near the Xianshuihe fault in the southwest corner of the monitoring area, to the south of the monitoring range, and other areas. Based on the regional geological structure, our analysis indicates the presence of several relatively dense seismic regions (zones) in this area: There is an inclined seismic concentration region (zone) along the Xianshuihe fault, where 15 earthquakes with magnitudes of ML3.0∼3.9 were located, accounting for 60% of earthquakes in the entire monitoring area in that magnitude range. Three earthquakes above ML4.0 were also recorded, representing 100% of earthquakes at ML4.0 and higher. There is an earthquake region (zone) in the upstream area of the dam, which is also a seismic concentration region with magnitudes below ML1.0. Currently, two events have been monitored at ML3.0∼3.9. In the northeast of the dam, near the monitoring boundary area, there is an earthquake region with a few earthquakes, mainly within ML3.0. Currently, one event has been monitored with ML3.0∼3.9. Just below the dam, near the monitoring boundary area, there is an earthquake region with earthquakes mainly within ML3.0. Currently, two events have been monitored with ML3.0∼3.9. There is an earthquake region in the NW-SE direction between the Xianshuihe fault and Yuke fault and a horizontal earthquake region in the downstream area of the dam. Both regions have dispersed earthquakes, mainly within ML3.0. Currently, no event has been monitored with ML3.0 and higher.
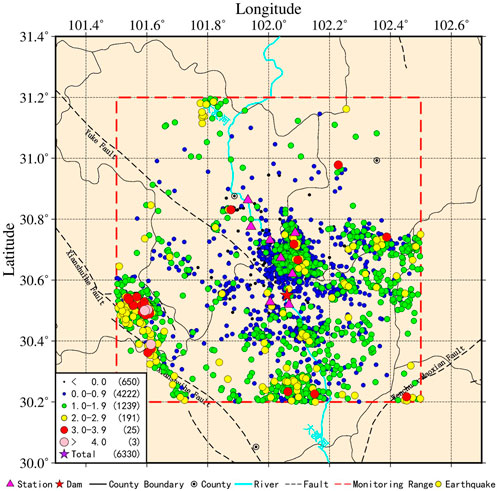
FIGURE 1. The earthquake epicenter distribution in the Houziyan network. The dashed lines represent the latitude and longitude grid.
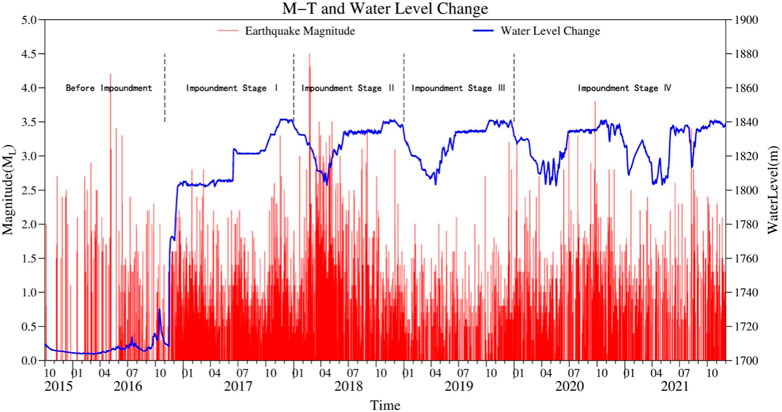
FIGURE 2. The M-T diagram in the reservoir area and water level.
2.2 Data processing
Using the seismic travel time data recorded by the Houziyan Network from October 2015 to November 2021, the three-dimensional velocity structures of VP, VS, and VP/VS in this region were inverted. In order to keep a big enough data volume for the research and guarantee the precision of imaging inversion, according to the monitoring capabilities, station distribution, and waveform recording of the Houziyan Seismic Network, some obviously erroneous travel time data were first removed. Then, earthquakes with ML0.5 or higher recorded by at least four stations simultaneously were selected for inversion. After the data were screened and processed, the inversion ultimately utilized 14,093 Pg travel time data from 2,627 earthquakes and 10,681 Sg travel time data from 2,045 earthquakes. The time distance curves of the Pg and Sg phases are shown in Figure 3. According to the figure, the errors of Pg and Sg travel time dates are respectively within 0.5s and 1.0s.
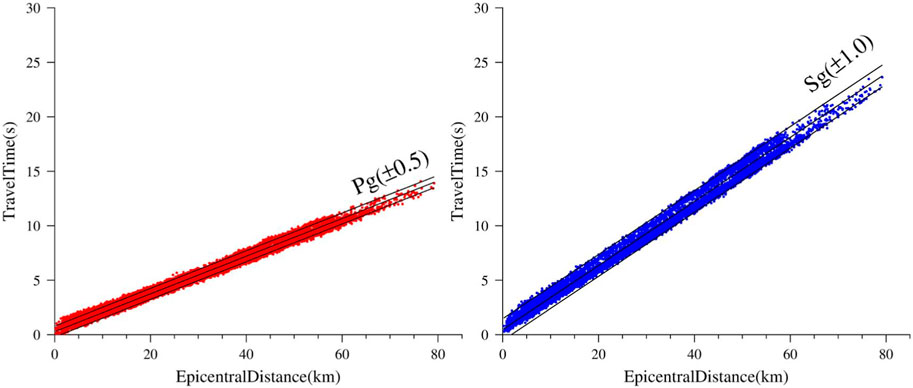
FIGURE 3. Pg and Sg travel time data for inversion.
2.3 Impoundment stage division
To analyze changes of the underground velocity structure at different impoundment stages, the following five stages of the Houziyan reservoir area impoundment period are divided according to the impoundment time, water level cycle, and seismicity (Figure 2; Table 2): before impoundment (10/2015–11/2016), first impoundment stage (12/2016–12/2017), second impoundment stage (01/2018–12/2018), third impoundment stage (01/2019–12/2019), and fourth impoundment stage (01/2020–11/2021). See Figure 2 for details of impoundment stage division and changes in water level. Table 3 shows the number of filtered seismic events and Pg and Sg travel time data used for inversion at different impoundment stages.
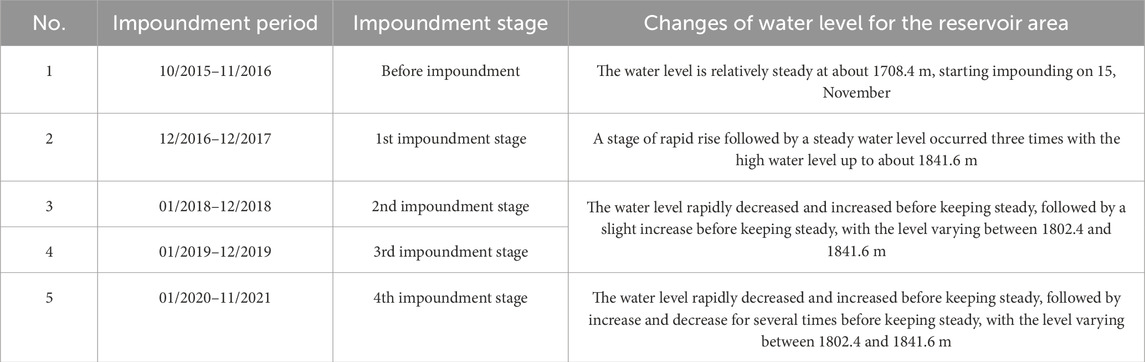
TABLE 2. The statistical table of impoundment stage division and changes of water levels for the dadu river houziyan reservoir area.
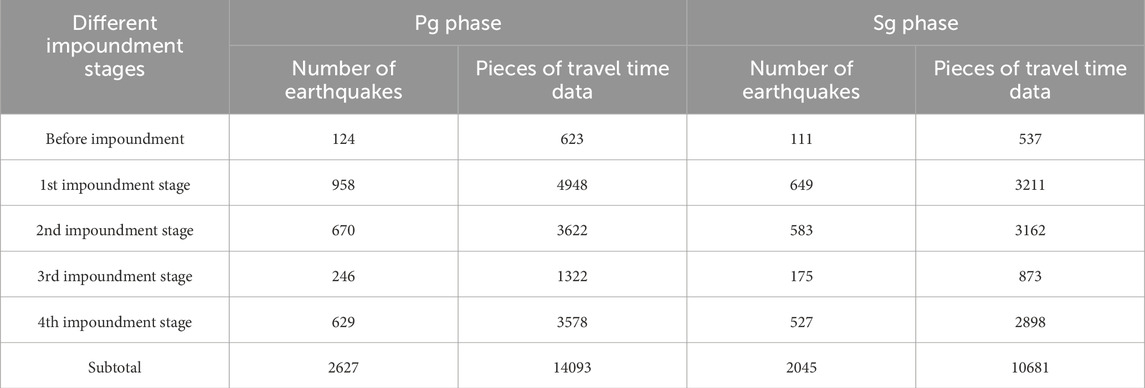
TABLE 3. The statistical table of seismic data volume used for inversion at different impoundment stages.
2.4 FMTOMO tomography
The Fast Marching Tomography Package (FMTOMO) is a tomography software package developed by Rawlinson and Sambridge in 2004 (Rawlinson and Sambridge, 2004a; Rawlinson and Sambridge, 2004b). FMTOMO utilizes the Fast Marching Method (FMM) for predicting travel times in the forward step and employs a subspace inversion scheme to adjust model parameters to fit observed data. In solving the forward problem, FMTOMO relies on the multi-stage Fast Marching Method based on the FMM. The FMM is a grid-based eikonal solver that implicitly tracks the evolution of wavefronts in 3-D layered media. To solve the inverse problem, it requires the adjustment of model parameters in order to satisfy the data, subject to regularization constrains. A common problem with tomographic inversion is that not all model parameters will be well constrained by the data alone. To help combat this problem, several regularization terms are added to the objective function. The damping parameter and smoothing parameter control these regularization terms and govern the trade-off between how well the solution satisfies the data, the proximity of the solution model to the starting model, and the smoothness of the solution model (Rawlinson et al., 2008).
FMTOMO can simultaneously invert one or more types of travel time datasets for variations in wave speed, interface depth, and source location. The initial model parameterization in the FMTOMO program consists of three types of model grids: a velocity grid, an interface grid, and a propagation grid. Interface are represented by a regular grid of points in latitude and longitude, the depths of which can vary, with cubic B-splines used to define a continuous surface. Propagation grid represents a discrete sampling of the velocity fields for implicitly tracking seismic wavefronts to solve the forward problem. To ensure the resolution and precision of inversion results, various model parameterizations are tested before inversion using checkerboard detection plates. These tests help to determine the model parameterization to be used for the final inversion. For the Houziyan network, the following model parameterizations are chosen based on tests involving travel time data, station distribution, and source locations: a velocity grid of 10 km × 10 km × 2.5 km; a propagation grid of 2 km × 2 km × 0.5 km; and an interface grid of 10 km × 10 km (horizontal node spacing 10 km).
The FMTOMO program introduces damping and smoothing coefficients during the inversion process to control the convergence rate of the model solution and to constrain the smoothness of the results. A trade-off analysis of damping coefficients and smoothing coefficients is performed using a compromise curve (see Figure 4) to select suitable values for these coefficients in the inversion process. The analysis indicates that the model is relatively smooth, and the mean square error of relative travel time is small when the damping coefficient is set to 0.5 and the smoothing coefficient to 1.0. Therefore, these coefficients are chosen in the inversion.
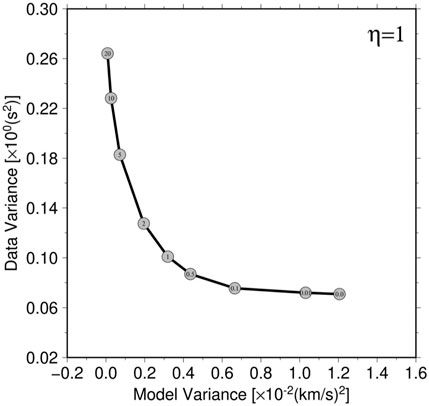
FIGURE 4. The compromise curve.
Reasonable selection of the initial velocity model helps to obtain reliable inversion results. The 1-D P -velocity initial velocity models used as the input model of the 3-D P-wave tomography are mainly the crustal velocity models from experts such as Zhaozhu (Zhao and Zhang, 1987) and are finely adjusted according to trial results of travel time data and research outcomes of other scholars (Zhao et al., 1997; Wang et al., 2002). The initial VP/VS was obtained by fitting the travel-time relation between P waves and S waves. The slope of the fitting line (Figure 5) shows that the average VP/VS of the study area is 1.69. The 1-D S-wave velocity model used as the input model of the 3-D S-wave tomography comes from the P-wave velocity model divided by 1.69. The 1-D initial velocity model was illustrated in Figure 6.
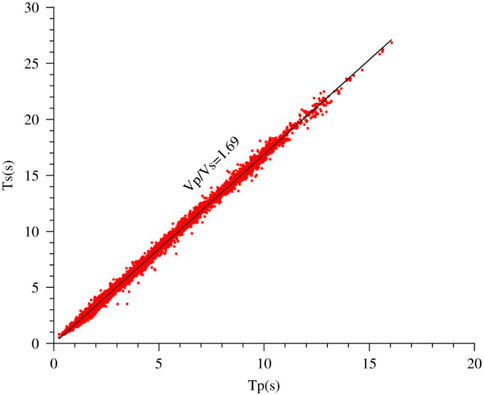
FIGURE 5. The Fitting line of the Ratio of VP/VS Calculated from the Travel Times of P and S Waves.
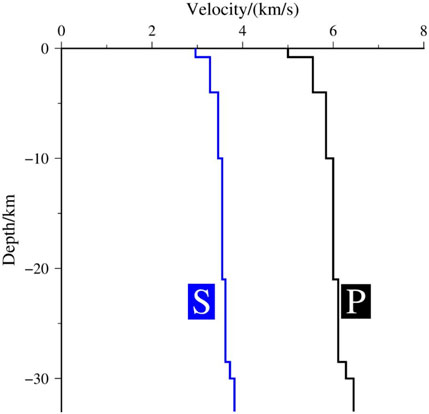
FIGURE 6. The 1-D initial velocity model for inversion.
3 Results
Through FMTOMO tomography inversion, we got the 3-D velocity structure, including values of VP, VS, and VP/VS ratios at different impoundment stages of the Houziyan reservoir area. To better reflect the characteristics of the velocity structure in the reservoir area, the horizontal section result maps including different depths of 1 km, 2 km, 3 km, 4 km, 5 km, 6 km, 8 km, and 10 km and the vertical profile result maps including different directions of 30.50°N, 30.55°N, 30.60°N, 30.65°N, 30.70°N, 30.75°N, 101.95°E, 102.00°E, 102.05°E, 102.10°E, 102.15°E, 102.20°E, WN-ES have been derived, as shown in Figure 7. At each stage, we chose the horizontal section maps with depths of 3 km and 6 km as well as the profile result maps in the directions of 30.65°N and WN-ES to show different wave velocities. All results were referenced in the actual analysis and interpretation.
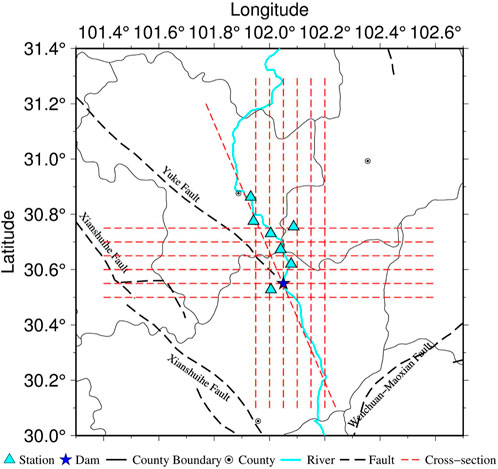
FIGURE 7. The cross-sections profile projections in the horizontal planes.
3.1 Reliability tests
In order to ensure data volume and the reliability of velocity structure tomography results, we examined the distribution of rays in horizontal sections and vertical sections at different water storage stages. The horizontal ray distribution of the P-wave are shown in Figure 8. Meanwhile, we conducted a checkerboard test to assess the degree to which the initial checkerboard pattern could be restored using the data. This allowed us to evaluate the resolution of the data, the impact of model parameterization, and the suitability of damping and smoothing parameters. Firstly, perturbations were added to the initial velocity model and then the perturbed model was used to calculate the theoretic travel times. Subsequently, the synthetic travel times were taken as input data to invert the velocity model when the hypocentral parameters were kept constant. The inversion results after the checkerboard test are shown in Figure 9 and Figure 10. The resolution of the VS tomography is similar to that of VP tomography because of the similar ray coverage and the same model parameterizations and the same damping and smoothing parameter. Thus, the checkerboard test results and ray distribution of VS are not presented here.
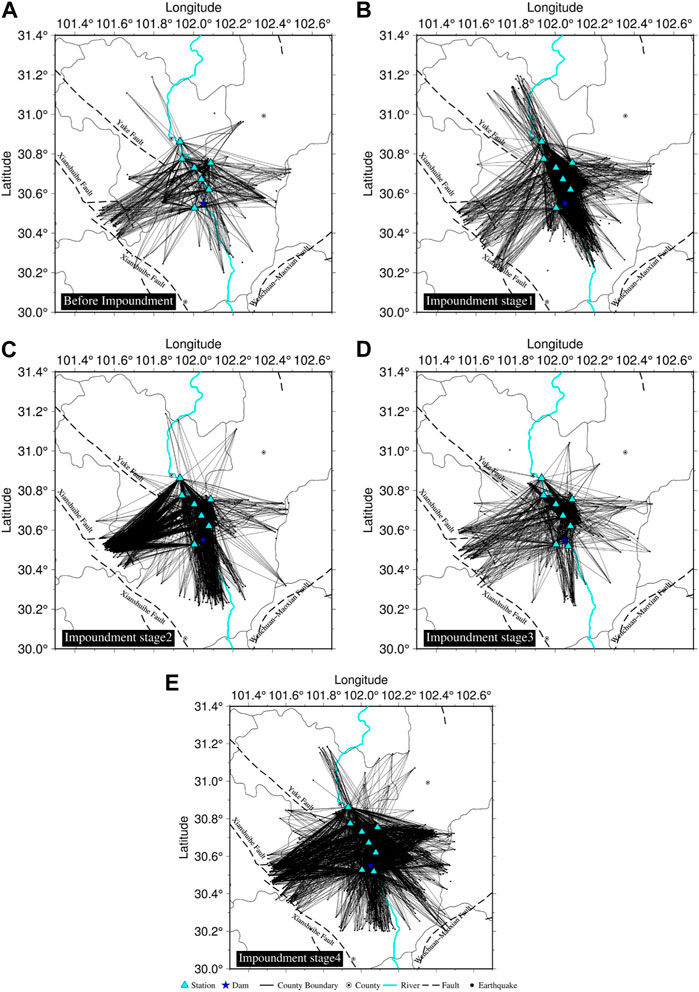
FIGURE 8. The Horizontal Ray Distribution of P-wave in different water storage stages. (A–E) represent before impoundment, impoundment stage 1, impoundment stage 2, impoundment stage 3, and impoundment stage 4 respectively.
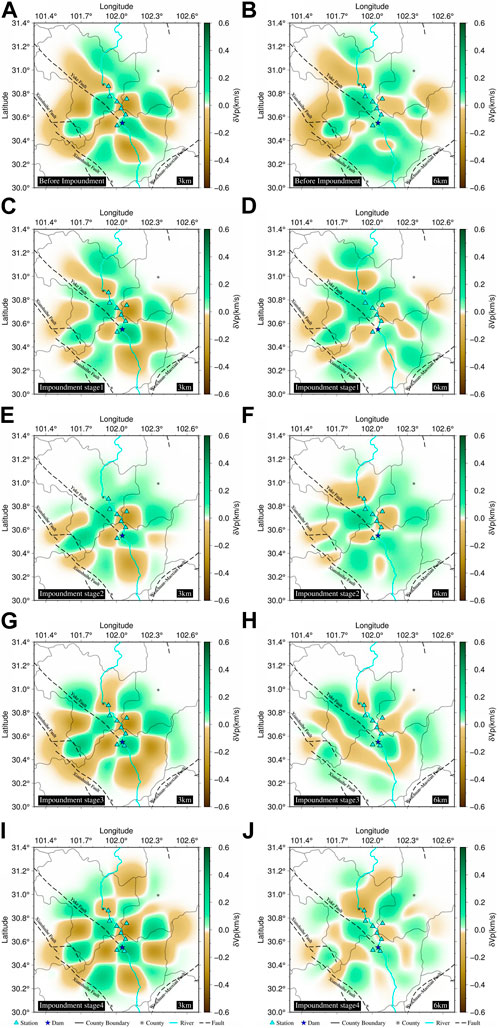
FIGURE 9. The Horizontal Results of Checkerboard test of P-wave in different Water Storage Stages. (A–J) represent before impoundment in 3 km, before impoundment in 6 km, impoundment stage 1 in 3 km, impoundment stage 1 in 6 km, impoundment stage 2 in 3 km, impoundment stage 2 in 6 km, impoundment stage 3 in 3 km, impoundment stage 3 in 6 km, impoundment stage 4 in 3 km, and impoundment stage 4 in 6 km, respectively.
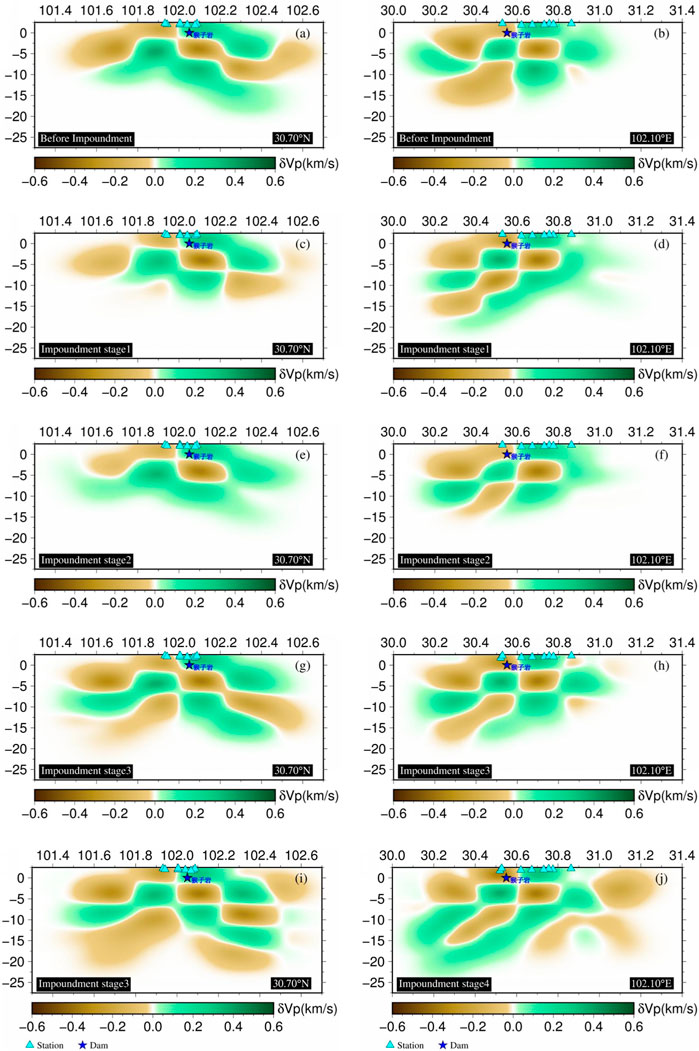
FIGURE 10. The Vertical Results of Checkerboard test of P-wave in different Water Storage Stages. (A–J) represent before impoundment along longitude, before impoundment along latitude, impoundment stage 1 along longitude, impoundment stage 1 along latitude, impoundment stage 2 along longitude, impoundment stage 2 along latitude, impoundment stage 3 along longitude, impoundment stage 3 along latitude, impoundment stage 4 along longitude, and impoundment stage 4 along latitude, respectively.
The results of these tests indicate that, before impoundment, the ray distribution was relatively sparse, resulting in low detection plate resolution. However, after impoundment, the ray distribution density significantly increased, leading to improved resolution. The selected data exhibited high precision and provided dependable results. Overall, the imaging results within the depth range of 1–12 km show good resolution, effectively recovering the velocity model (Figure 10). We notice that although the test result can recover the pattern of the velocity structure at 12 km depth, the resolution decreases beyond 12 km depth. The results of Checkerboard test are consistent with the distribution of earthquake depths. In addition, we can notice that there is a loss of resolution close to the boundaries of the investigated area. Therefore, this article only discusses regions with good resolution.
3.2 Imaging results of VP
According to VP in the section result maps (Figure 11) and profile result maps (Figure 12), there is local lateral heterogeneity before impoundment. The manifestations include that a high wave velocity zone of 5700–6100 m/s appears from the Houziyan dam to the upstream reservoir area and in a 4 km depth area from the surface to underground; overall, the P-wave velocity increases as the depth becomes deeper, with a value of about 5300 m/s at the shallow area of 1 km to about 6100 m/s at the deep area of 10 km.
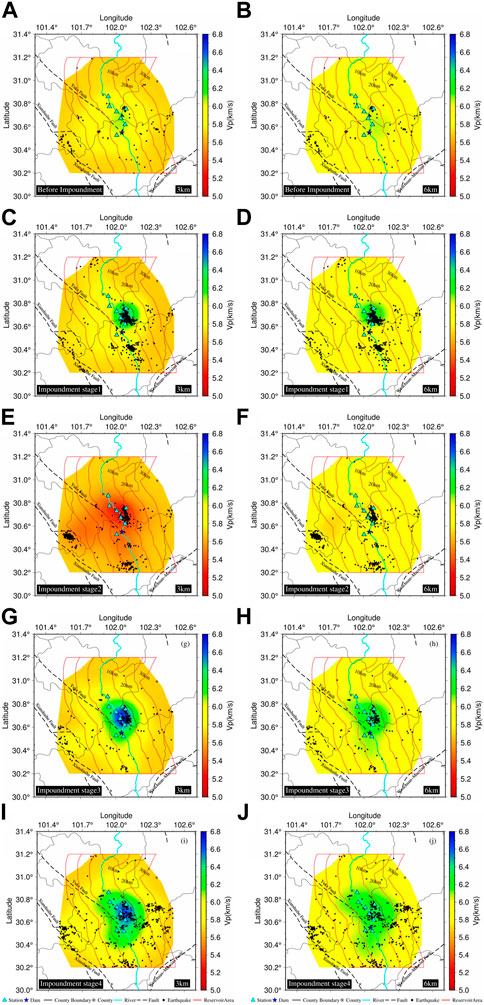
FIGURE 11. The horizontal section maps of VP at different impoundment stages. (A–J) represent before impoundment in 3 km, before impoundment in 6 km, impoundment stage 1 in 3 km, impoundment stage 1 in 6 km, impoundment stage 2 in 3 km, impoundment stage 2 in 6 km, impoundment stage 3 in 3 km, impoundment stage 3 in 6 km, impoundment stage 4 in 3 km, and impoundment stage 4 in 6 km, respectively.
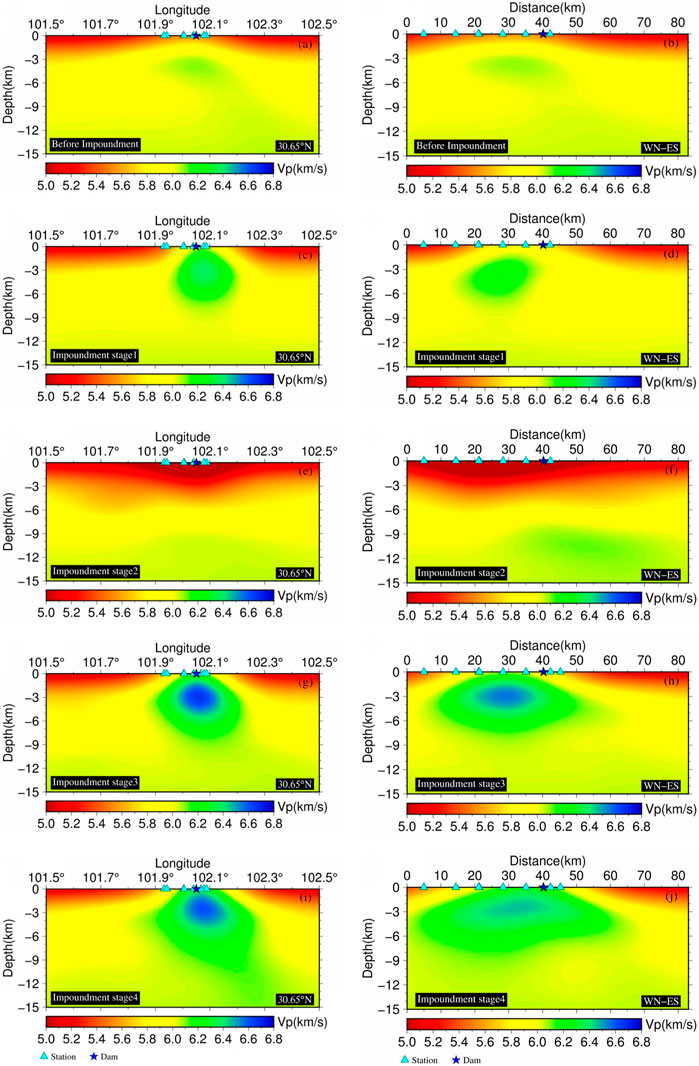
FIGURE 12. The vertical profile maps of VP at different impoundment stages. (A–J) represent before impoundment along longitude, before impoundment along distance, impoundment stage 1 along longitude, impoundment stage 1 along distance, impoundment stage 2 along longitude, impoundment stage 2 along distance, impoundment stage 3 along longitude, impoundment stage 3 along distance, impoundment stage 4 along longitude, and impoundment stage 4 along distance, respectively.
There are local lateral changes in VP from stages 1–4 after impoundment. At stage 1 after impoundment, a high wave velocity zone of 5800–6400 m/s appears from the Houziyan dam to the upstream reservoir area and in a 5 km depth area from the surface to underground; at stage 2, a low wave velocity zone of 5100–5600 m/s appears from the dam to the upstream reservoir area and in a 5 km depth area from the surface to underground. Compared with the cases before and at first stage of impoundment, the original high value zone becomes a low value zone with a variation of 600–800 m/s, which indicates that impoundment has resulted in changes of VP of the underground media and there is dynamic adjustment of underground wave velocity. At stage 3, a high wave velocity zone of 5800–6400 m/s appears from the Houziyan dam to the upstream reservoir area and in a 6 km depth area from the surface to underground; at stage 4, a high wave velocity zone of 6200–6500 m/s appears from the Houziyan dam to the upstream reservoir area and in a 6 km depth area from the surface to underground.
Throughout all impoundment stages except stage 2, VP changes from 5300 m/s at the shallow area of 1 km–6500 m/s at the deep area of 10 km; compared with the case before impoundment, the position of the high wave velocity zone does not change greatly, with the velocity increased by 200–500 m/s. Compared with the cases before and at first stage of impoundment, the original high value zone of VP at stage 2 becomes to a low one with a variation of 300–600 m/s, which indicates that impoundment has resulted in changes of VP of the underground media.
The distribution characteristics of P-wave velocity from different impoundment stages demonstrate the impact of reservoir water on the velocity structure of the upper crust in the reservoir area. Before impoundment, the velocity of the reservoir area to the northeast (upstream of the Houziyan Dam, with the Yuke fault as the boundary) increased slightly, reflecting the influence of regional geological structures on the velocity structure. This characteristic still exists in the first stage of impoundment. In the first stage of impoundment, a large number of small induced earthquakes near the reservoir shore reflect the influence of reservoir water infiltration and its dynamic effects. Changes in gravity before and after impoundment also indicate a significant impact of reservoir water infiltration and load changes on the deformation field of the reservoir area near the shore. The water level of the reservoir has been fluctuating quasi-periodically between 6 and 40 m since 2018. From a physical perspective, this large-capacity, large water-level difference fluctuation will cause changes in the physical structure of the underground medium, such as pore pressure and permeability, making it more conducive to reservoir water infiltration. The low-velocity anomaly distribution in the second stage of impoundment is related to reservoir water erosion and infiltration, a phenomenon consistent with the results of P-wave velocity structure imaging studies conducted by Li Qiang et al. (2009) in the Three Gorges reservoir area (Li et al., 2009). Long-term large fluctuations in reservoir water level will change pore pressure, leading to deeper reservoir water infiltration. Therefore, in the third and fourth stages of impoundment, the area of high-velocity anomalies in the 1–6 km depth layer of the reservoir area and its surroundings increases, and the degree of anomaly change intensifies, reflecting an expanding influence of reservoir water on the velocity structure of this depth layer. This is consistent with the results obtained by Wu Haibo et al. (2018) in their study of the upper crustal velocity structure imaging in the Three Gorges reservoir area (Wu et al., 2018).
3.3 Imaging results of VS
According to VS in the section result maps (Figure 13) and profile maps (Figure 14), there is local lateral heterogeneity before impoundment of the Houziyan reservoir area. The manifestations include that a high wave velocity zone of 3300–3700 m/s appears from the Houziyan dam to the upstream reservoir area and in a 4 km depth area from the surface to underground; overall, the velocity increases as the depth becomes deeper, with a value of about 3300 m/s at the shallow area of 1 km to about 3800 m/s at the deep area of 10 km.
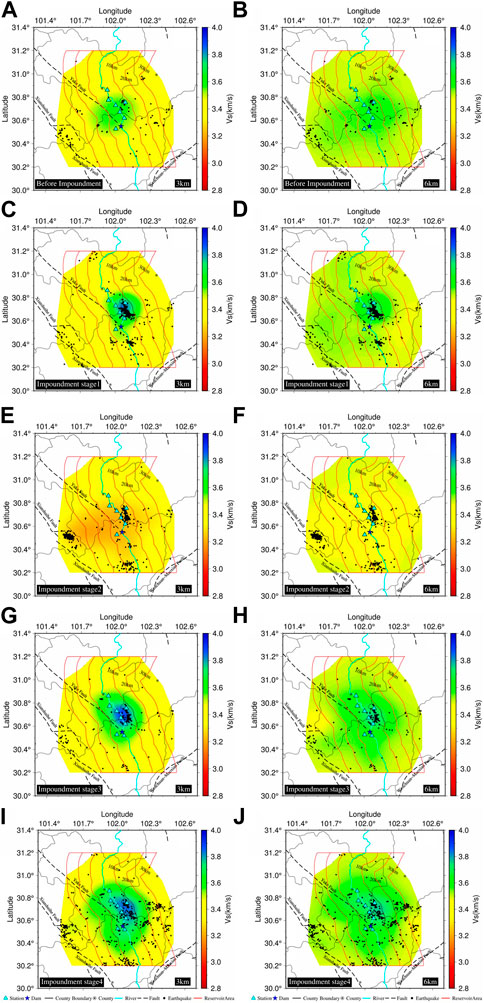
FIGURE 13. The horizontal section maps of VS at different impoundment stages. (A–J) represent before impoundment in 3 km, before impoundment in 6 km, impoundment stage 1 in 3 km, impoundment stage 1 in 6 km, impoundment stage 2 in 3 km, impoundment stage 2 in 6 km, impoundment stage 3 in 3 km, impoundment stage 3 in 6 km, impoundment stage 4 in 3 km, and impoundment stage 4 in 6 km, respectively.
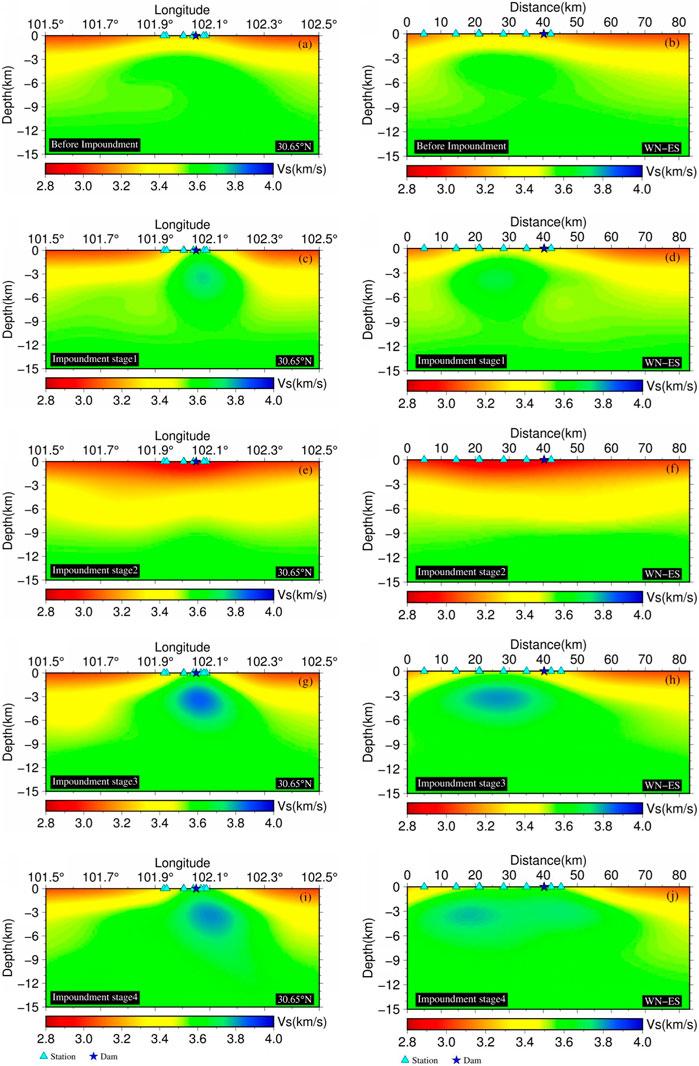
FIGURE 14. The vertical profile maps of VS at different impoundment stages. (A–J) represent before impoundment along longitude, before impoundment along distance, impoundment stage 1 along longitude, impoundment stage 1 along distance, impoundment stage 2 along longitude, impoundment stage 2 along distance, impoundment stage 3 along longitude, impoundment stage 3 along distance, impoundment stage 4 along longitude, and impoundment stage 4 along distance, respectively.
In general, the characteristics of the velocity structure inversion results for P-waves and S-waves are very similar. Similarly, there are local lateral changes in VS from stages 1–4 after impoundment. At stage 1, a high wave velocity zone of 3400–3900 m/s appears from the Houziyan dam to the upstream reservoir area and in a 5 km depth area from the surface to underground; at stage 2, a low wave velocity zone of 3000–3300 m/s appears from the Houziyan dam to the upstream reservoir area and in a 3 km depth area from the surface to underground; at stage 3, a high wave velocity zone of 3400–3900 m/s appears from the Houziyan dam to the upstream reservoir area and in a 5 km depth area from the surface to underground; at stage 4, a high wave velocity zone of 3400–3900 m/s appears from the Houziyan dam to the upstream reservoir area and in a 6 km depth area from the surface to underground.
Throughout all impoundment stages except stage 2, VS changes from about 3300 m/s at the shallow area of 1 km to about 3800 m/s at the deep area of 10 km; compared with the case before impoundment, VS has increased by 100–300 m/s. Compared with the cases before and at the first stage of impoundment, the original high-value zone of VS at stage 2 becomes a low one with a variation of 400–600 m/s, which indicates that impoundment has resulted in changes in the VS of the underground media.
The distribution characteristics of S-wave velocity from different impoundment stages show similar variations to those of P-wave velocity, but with some differences in detail. During the first impoundment stage, S-wave velocity shows a significant increase, with an expanded range of horizontal and depth variations. In the second impoundment stage, S-wave velocity also shows a low anomaly phenomenon, but the depth of the velocity anomaly is shallow, within 3 km. In the third and fourth impoundment stages, the changes in S-wave velocity are consistent with those of P-wave velocity, but the high-velocity anomaly of S-wave (2–5 km) is more pronounced than the deep anomaly of P-wave (1–4 km). The S-wave phenomenon indicates that the influence of reservoir water infiltration on S-wave velocity structure is minimal, but the gravitational effect of the reservoir water is significant, suggesting that water has a relatively small impact on the shear modulus (He et al., 2018).
3.4 Imaging results of VP/VS
According to VP/VS ratios in the section result maps (Figure 15) and profile result maps (Figure 16), there is local lateral heterogeneity before impoundment. A positive anomaly zone between 1.69 and 1.72 appears in the dam and its downstream as well as a 4 km depth area from the surface to underground; a negative anomaly zone between 1.67 and 1.69 appears in the east and west sides of the central reservoir area and a 4 km depth area from the surface to underground. The values of the remaining areas are between 1.68 and 1.70.
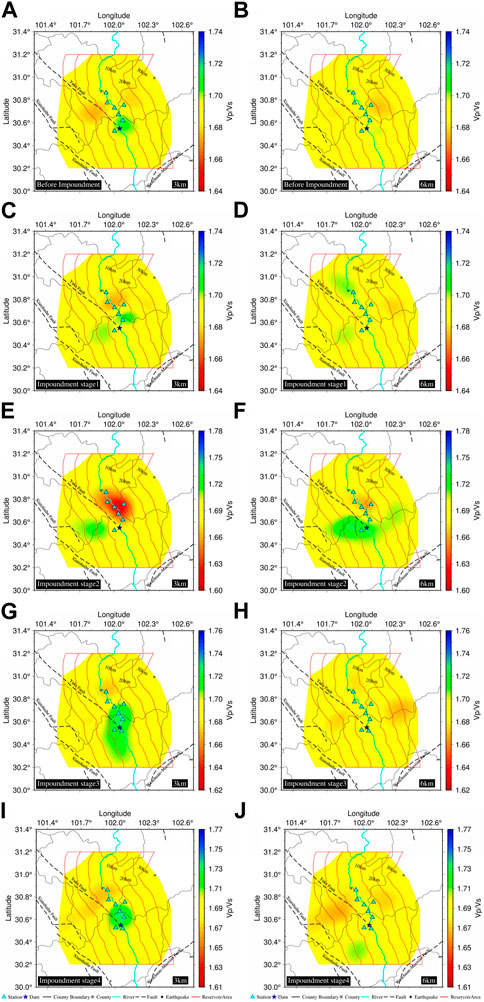
FIGURE 15. The horizontal section maps of VP/VS ratios at different impoundment stages. (A–J) represent before impoundment in 3 km, before impoundment in 6 km, impoundment stage 1 in 3 km, impoundment stage 1 in 6 km, impoundment stage 2 in 3 km, impoundment stage 2 in 6 km, impoundment stage 3 in 3 km, impoundment stage 3 in 6 km,impoundment stage 4 in 3 km, and impoundment stage 4 in 6 km, respectively.
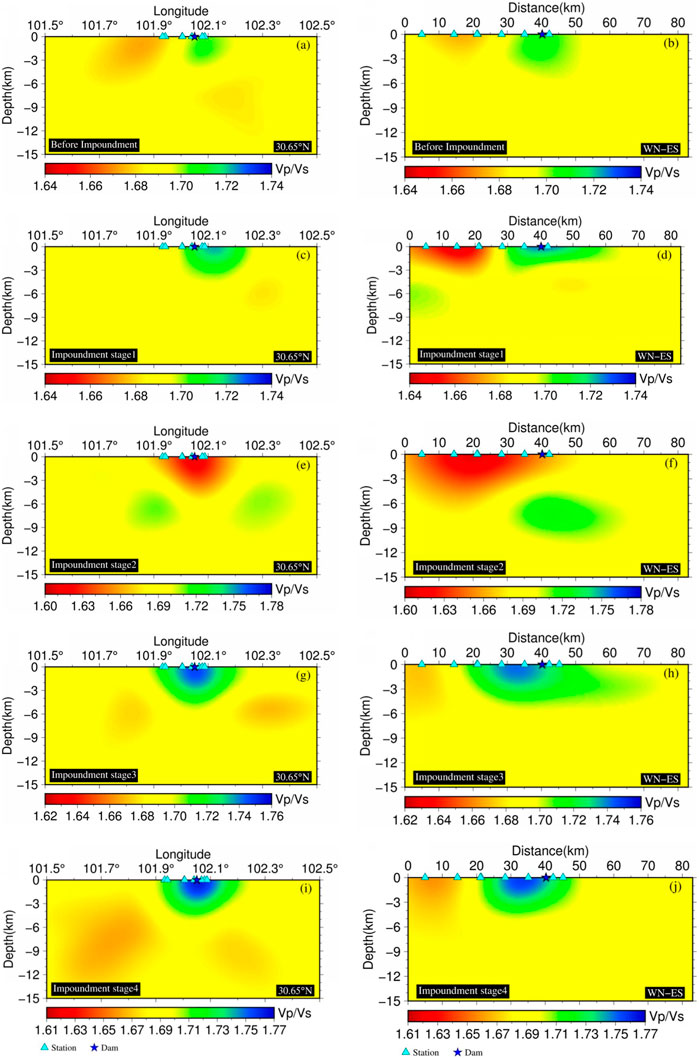
FIGURE 16. The vertical profile maps of VP/VS ratios at different impoundment stages. (A–J) represent before impoundment along longitude, before impoundment along distance, impoundment stage 1 along longitude, impoundment stage 1 along distance, impoundment stage 2 along longitude, impoundment stage 2 along distance, impoundment stage 3 along longitude, impoundment stage 3 along distance, impoundment stage 4 along longitude, and impoundment stage 4 along distance, respectively.
At stage 1, a positive anomaly zone between 1.69 and 1.72 appears in the dam and its downstream as well as a 3 km depth area from the surface to underground; a negative anomaly zone between 1.66 and 1.69 appears in the central reservoir area and a 3 km depth area from the surface to underground. The values of the remaining areas are between 1.68 and 1.70. At the second impoundment stage, there are local lateral changes in VP/VS ratios. The manifestations include that a negative anomaly zone between 1.63 and 1.67 appears in the upstream of the Houziyan dam (northeast of Yuke fault as a dividing line) and a 6 km depth area from the surface to underground; a positive anomaly zone between 1.71 and 1.74 appears in the west of the Houziyan dam (southwest of Yuke fault as a dividing line) and a 2–8 km depth area from the surface to underground. At stage 3, there are local lateral changes in VP/VS ratios. The manifestations include that a negative anomaly zone between 1.66 and 1.68 appears in the tail area of the Houziyan reservoir and a 4 km depth area from the surface to underground; a negative anomaly zone between 1.66 and 1.68 appears in the east and west of the Houziyan dam and a 3–6 km depth area from the surface to underground; a positive anomaly zone between 1.70 and 1.73 appears from the central part of the reservoir to the downstream of the dam and a 4 km depth area from the surface to underground; the values of the remaining areas are between 1.68 and 1.70. At stage 4, there are local lateral changes in VP/VS ratios. The manifestations include that a negative anomaly zone between 1.66 and 1.68 appears in the tail area of the Houziyan reservoir and a 4 km depth area from the surface to underground; a positive anomaly zone between 1.70 and 1.73 appears from the central part of the reservoir to the downstream of the dam and in a 4 km depth area from the surface to underground; and the values of the remaining areas are between 1.68 and 1.70.
Throughout all impoundment stages except stage 2, VP/VS ratios change from about 1.70 at the shallow area of 1 km to about 1.75 at the deep area of 10 km; compared with the case before impoundment, this value does not change significantly, but the range of abnormal horizontal position changes is large, which means the variations of VP and VS are different after impoundment. At stage 2, in a 4 km-deep area from the surface to underground, the values of VP/VS ratios at each side of the Yuke fault are one high and one low, which clearly shows the position and depth of the fault.
The VP/VS velocity structure imaging results show different anomaly features compared to P-wave and S-wave. In the upstream reservoir area, the VP/VS velocity anomaly changes are consistent with P-wave and S-wave, but the anomalies are mainly concentrated at shallow depths, indicating that reservoir impoundment has different effects on VP, VS, and VP/VS. On both sides of the Yuke fault, the VP/VS velocity anomalies show different variations at different impoundment stages. In the southwest of the Yuke fault, the VP/VS velocity anomalies show consistent positive anomalies, while in the northeast of the Yuke fault (upstream of the dam), VP/VS shows both positive and negative anomalies, indicating that the reservoir impoundment does not penetrate the fault, reflecting the inhibitory effect of the fault on the underground velocity structure changes. At the same time, the different impoundment stages exhibit different VP, VS, and VP/VS velocity structure anomaly characteristics, reflecting the dynamic adjustment of the reservoir impoundment’s influence on the underground velocity structure with changes in the reservoir water level.
4 Discussion and conclusion
Through tomography, we have gained insights into the subterranean velocity structure and its variations in the Houziyan reservoir area before and after impoundment, as well as during different impoundment stages. The following conclusions can be drawn through a comprehensive analysis and comparison of the results:
1) Anisotropy in the underground velocity structure is evident in the Houziyan reservoir area before impoundment. Specifically, from the dam to the upstream reservoir area and within a depth range of 4 km from the surface to underground, there is a distinct high wave velocity zone of VP、VS and VP/VS, reflecting the anisotropic nature of the underground velocity structure in the pre-impoundment reservoir area.
2) The area of high wave velocity increases in stage 1, stage 3 and stage 4. The area of low wave velocity increases in stage 2, especially in depth, indicating that impoundment has altered the underground velocity structure. These changes vary significantly across different impoundment stages. Notably, high wave velocity zones of both VP and VS appear from the dam to the upstream reservoir area and extend to a depth of 5 km from the surface to underground in stage 1. Similar high wave velocity zones appear in stages 3 and 4, with depths extending to 6 km from the surface to underground. In contrast, low wave velocity zones of VP and Vs are observed in stage 2, extending from the dam to the upstream reservoir area and to a depth of 5 km from the surface to underground. The influence depth of these changes is greater than that observed before impoundment.
3) The rule of the underground velocity structure changes in the Houziyan reservoir differs from the patterns observed in other reservoirs after impoundment. For instance, at stage 2, low wave velocity zones for VP and Vs are observed from the dam to the upstream reservoir area, reaching a depth of 5 km from the surface to underground. This pattern contradicts the results observed before and during the first stage of impoundment. At stage 2, the values of VP/VS ratios are bounded by the Yuke fault, decreasing in the northeast area of the fault, with a change depth of approximately 4 km from the surface to underground. Conversely, VP/VS ratios increase in the southwest area of the fault, with a change depth ranging from 2 to 6 km. This indicates that the changes in P-wave and S-wave velocities for underground media differ with increased impoundment time. The depth of this fault can be inferred from the value changes on both sides.
4) In general, the underground velocity structure exhibits an overall increasing trend after impoundment, but there are instances of velocity decrease, reflecting the continuous dynamic adjustment of the underground velocity structure following impoundment.
The study of underground velocity structure before and after reservoir impoundment is helpful for us to gain a deeper understanding of the process and extent of reservoir water infiltration. It should be combined with the hydrological conditions and geological structures of the reservoir for detailed analysis. Regarding the anomalies in the second impoundment stage compared to other stages, it is speculated that the relatively less permeation of reservoir water may be due to the rapid rise and fall of the reservoir water level in the early stage of impoundment, and the underground velocity structure is mainly influenced by the gravitational changes of the reservoir water in dynamic adjustment. Currently, due to the lack of detailed hydrological and geological data, more seismic geological data will be used to further improve the research results in the later stage of the study. Overall, there exists a correlation between the underground velocity and reservoir water storage in the Houziyan reservoir area. The changes in the underground velocity structure vary across different impoundment stages, underscoring the influence of reservoir impoundment on the subterranean velocity structure.
Data availability statement
The original contributions presented in the study are included in the article/Supplementary material, further inquiries can be directed to the corresponding authors.
Author contributions
ZY: Investigation, Writing–original draft. JC: Conceptualization, Writing–original draft. YW: Data curation, Writing–review and editing. JQ: Methodology, Writing–review and editing. HH: Formal Analysis, Writing–review and editing. XD: Validation, Writing–review and editing. MY: Resources, Writing–review and editing. JW: Resources, Writing–review and editing.
Funding
The author(s) declare financial support was received for the research, authorship, and/or publication of this article. This research was sponsored by the Key Scientific Research Projects of the Power China Guiyang Survey Design and Research Institute Co., Ltd. (YJ2022-09; DJ-ZDXM-2020-55); Chongqing Technology Innovation and Application Development Project of Chongqing Science and Technology Bureau (CSTB2022TIAD-KPX0197); Guizhou Provincial Science and Technology Projects [QKHJC-ZK(2022)-General 186]. Projects of National Natural Science Foundation of China (No. 41602275 and 41977298); Provincial Key Disciplines of Guizhou Province-Geological Resources and Geological Engineering [ZDXK(2018)001].
Conflict of interest
Authors ZY, YW, and XD were employed by Power China Guiyang Survey Design and Research Institute Co., Ltd.
Author HH was employed by Guodian Dadu River Basin Hydropower Development Co., Ltd.
The remaining authors declare that the research was conducted in the absence of any commercial or financial relationships that could be construed as a potential conflict of interest.
Publisher’s note
All claims expressed in this article are solely those of the authors and do not necessarily represent those of their affiliated organizations, or those of the publisher, the editors and the reviewers. Any product that may be evaluated in this article, or claim that may be made by its manufacturer, is not guaranteed or endorsed by the publisher.
References
Basbous, J., Nemer, T. S., Yehya, A., and Maalouf, E. (2022). Assessing the potential for reservoir induced seismicity from the Bisri dam project in Lebanon. Eng. Geol. 304, 106679. doi:10.1016/j.enggeo.2022.106679
Bashir, Y., Babasafari, A. A., Arshad, A. R. M., Alashloo, S. Y. M., Latiff, A. H. A., Hamidi, R., et al. (2022). Chapter 5-geological reservoir modeling and seismic reservoir monitoring. Seismic imaging methods and applications for oil and gas exploration. Elsevier, 179–285.
Chang, T., Li, B., and Zeng, X. (2022). Prediction and verification of earthquakes induced by the Xiluodu hydropower station reservoir. Earthq. Sci. 35 (5), 387–397. doi:10.1016/j.eqs.2022.10.006
Che, Y., Chen, J., Zhang, L., Yu, J., Liu, C., and Zhang, W. (2009). Study ofthe reservoir-induced hujiaping MS4.1 earthquake inthe three Gorges dam area. Earthq 29 (4), 13. (In Chinese).
Chen, H. (2022). Overview of the seismic input at dam sites in China. Earthq. Sci. 35 (5), 410–425. doi:10.1016/j.eqs.2022.05.006
Dou, T., Cheng, H., Zhang, H., and Shi, Y. (2022). Potential seismicity by impoundment of the baihetan reservoir, xiaojiang fault zone, southwest China. J. Asian Earth Sci. 8, 100106. doi:10.1016/j.jaesx.2022.100106
Ersoy, H., Karahan, M., Gelişli, K., Akgün, A., Anılan, T., Sünnetci, M. O., et al. (2019). Modelling of the landslide-induced impulse waves in the Artvin Dam reservoir by empirical approach and 3D numerical simulation. Eng. Geol. 249, 112–128. doi:10.1016/j.enggeo.2018.12.025
Fang, Y., Wang, M., Deng, W., and Xu, K. (2010). Exploitation scale of hydropower based on instream flow requirements: a case from southwest China. Renew. Sust. Energ. Rev. 14 (8), 2290–2297. doi:10.1016/j.rser.2010.04.012
Gaucher, E., Schoenball, M., Heidbach, O., Zang, A., Fokker, P. A., van Wees, J. D., et al. (2015). Induced seismicity in geothermal reservoirs: a review of forecasting approaches. Renew. Sust. Energ. Rev. 52, 1473–1490. doi:10.1016/j.rser.2015.08.026
Guo, W., Zhao, C., Zuo, K., and Zhao, C. (2022). Characteristics of seismicity before and after impoundment of Baihetan dam in the lower reaches of Jinsha River. Chin. J. Geophys. 65 (12), 4659–4671. (In Chinese). doi:10.6038/cjg2022Q0119
He, L., Sun, X., Yang, H., Qin, J., Shen, Y., and Ye, X. (2018). Upper crustal structure and earthquake mechanism in the xinfengjiang water reservoir, guangdong, China. J. Geophys. Res. Solid Earth 123, 3799–3813. doi:10.1029/2017jb015404
Jin, L. (2022). A hydromechanical-stochastic approach to modeling fluid-induced seismicity in arbitrarily fractured poroelastic media:Effects of fractures and coupling. Tectonophysics 826, 229249. doi:10.1016/j.tecto.2022.229249
Kim, K., Yoo, H., Park, S., Yim, J., Xie, L., Min, K., et al. (2022). Induced and triggered seismicity by immediate stress transfer and delayed fluid migration in a fractured geothermal reservoir at Pohang, South Korea. Int. J. Rock Mech. Min. 153, 105098. doi:10.1016/j.ijrmms.2022.105098
Kinscher, J. L., Broothaers, M., Schmittbuhl, J., de Santis, F., Laenen, B., and Klein, E. (2023). First insights to the seismic response of the fractured Carboniferous limestone reservoir at the Balmatt geothermal doublet (Belgium). Geothermics 107, 102585. doi:10.1016/j.geothermics.2022.102585
Li, L., and Luo, G. (2022). What causes the spatiotemporal patterns of seismicity in the Three Gorges Reservoir area,central China? Earth Planet. Sci. Lett. 592, 117618. doi:10.1016/j.epsl.2022.117618
Li, L., Xu, C., Yao, X., Shao, Bo., Ouyang, J., Zhang, Z., et al. (2022). Large-scale landslides around the reservoir area of Baihetan hydropower station in Southwest China: analysis of the spatial distribution. Nat. Hazards Res. 2 (3), 218–229. doi:10.1016/j.nhres.2022.07.002
Li, Q., Zhao, X., Cai, J. A., Liu, R., Long, G., and An, Y. (2009). P wave velocity structure of upper and middle crust beneath the Three Gorges reservoir dam and adjacent regions. Sci. China Ser. D Earth Sci. 52 (4), 567–578. (In Chinese). doi:10.1007/s11430-009-0047-6
Li, Y., Qin, J., Dong, T., and Liu, L. (2004). Analysis on reservoir induced seismicity at manwan power station on lancang river. Seismol. Geomagnetic Observation Res. 25 (3), 51–57. (In Chinese).
Liu, H., Luo, Y., Feng, W., Wang, Y., Ma, H., and Hu, P. (2023). Site response of ancient landslides to initial impoundment of Baihetan Reservoir (China) based on ambient noise investigation. Soil Dyn. Earthq. Eng. 164, 107590. doi:10.1016/j.soildyn.2022.107590
Liu, X., Ma, J., Du, X., Zhu, S., Li, L., and Sun, D. (2016). Recent movement changes of main fault zones in the Sichuan-Yunnan region and their relevance to seismic activity. Sci. China Earth Sci. 59, 1267–1282. (In Chinese). doi:10.1007/s11430-016-5278-8
Liu, X., Pan, H., Zheng, X., Zhang, X., Lyu, Y., Deng, S., et al. (2022). Integrated emergy and economic evaluation of 8 hydropower plants in Zagunao Basin, Southwest of China. J. Clean. Prod. 353, 131665. doi:10.1016/j.jclepro.2022.131665
Liu, X., and Zhang, Q. (2016). Analysis of the return period and correlation between the reservoir-induced seismic frequency and the water level based on a copula: a case study of the Three Gorges reservoir in China. Phys. Earth Planet. Inter. 260, 32–43. doi:10.1016/j.pepi.2016.09.001
Lizurek, G., Leptokaropoulos, K., Wiszniowski, J., Van. Giang, N., Nowaczyńska, I., Plesiewicz, B., et al. (2021). Seasonal trends and relation to water level of reservoir-triggered seismicity in Song Tranh 2 reservoir,Vietnam. Tectonophysics 820, 229121. doi:10.1016/j.tecto.2021.229121
Rawlinson, N., Hauser, J., and Sambridge, M. (2008). Seismic ray tracing and wavefront tracking in laterally heterogeneous media. Adv. Geophys. 49, 203–273. doi:10.1016/S0065-2687(07)49003-3
Rawlinson, N., Pozgay, S., and Fishwick, S. (2010). Seismic tomography: a window into deep Earth. Phys. Earth Planet. Inter. 178 (3), 101–135. doi:10.1016/j.pepi.2009.10.002
Rawlinson, N., and Sambridge, M. (2003). Seismic traveltime tomography of the crust and lithosphere. Adv. Geophys. 46, 81–198.
Rawlinson, N., and Sambridge, M. (2004a). Wave front evolution in strongly heterogeneous layered media using the fast marching method. Geophys. J. Int. 156, 631–647. doi:10.1111/j.1365-246x.2004.02153.x
Rawlinson, N., and Sambridge, M. (2004b). Multiple reflection and transmission phases in complex layered media using a multistage fast marching method. Geophysics 69 (5), 1338–1350. doi:10.1190/1.1801950
Rawlinson, N., and Urvoy, M. (2006). Simultaneous inversion of active and passive source datasets for 3-D seismic structure with application to Tasmania. Geophys. Res. L. 33, L24313. doi:10.1029/2006gl028105
Rawlison, N., Kool, M. D., and Sambridge, M. (2006a). Seismic wavefront tracking in 3D heterogeneous media:applictions with multiple data classes. Explor. Geophys. 37 (4), 322–330. doi:10.1071/EG06322
Rawlison, N., Reading, A. M., and Kennett, B. L. (2006b). Lithospheric structure of Tasmania from a novel form of teleseismic tomography. J GeoPhys. Res. 111, B02301. doi:10.1029/2005jb003803
Rinaldi, A. P., Improta, L., Hainzl, S., Catalli, F., Urpi, L., and Wiemer, S. (2020). Combined approach of poroelastic and earthquake nucleation applied to the reservoir-induced seismic activity in the Val d’Agri area, Italy. Italy. J. Rock Mech. Geotech. 12 (4), 802–810. doi:10.1016/j.jrmge.2020.04.003
Simpson, D. W., Leith, W. S., and Scholz, C. H. (1988). Two types of reservoir-induced seismicity. B. Seismol. Soc. Am. 78 (6), 2025–2040. doi:10.1785/bssa0780062025
Simpson, D. W., and Negmatullaev, S. K. (1981). Induced seismicity at nurek reservoir, tadjikistan, USSR. B. Seismol. Soc. Am. 71, 1561–1586. doi:10.1785/BSSA0710051561
Su, S., Han, L., and Guo, X. (2020). Study on focal mechanism and stress field before and after the impoundment in the vicinity of the xiluodu reservoir. J. Seismol. Res. 43 (02), 402–411+418. (In Chinese).
Tan, Y., Xing, H., Jin, Z., Wang, J., Pang, S., Guo, H., et al. (2022). Seismogenesis of the 2021 Mw 7.1 earthquake sequence near the northeastern Japan revealed by double-difference seismic tomography. Earth Planet. Sci. Lett. 594, 117738. doi:10.1016/j.epsl.2022.117738
Tang, H., and Yong, W. (2012). Construction technology of inlet gradient section of diversion tunnel on left bank of Houziyan Hydropower Station. Water Resour. Hydropower Eng. 05, 63–66. (In Chinese).
Van Eijs, R. M. H. E., Mulders, F. M. M., Nepveu, M., Kenter, C. J., and Scheffers, B. C. (2006). Correlation between hydrocarbon reservoir properties and induced seismicity in The Netherlands. Eng. Geol. 84 (3–4), 99–111. doi:10.1016/j.enggeo.2006.01.002
Wang, C. Y., Mooney, W. D., Wang, X. L., Wu, J. P., Lou, H., and Wang, F. (2002). Study on 3-D velocity structure of crust and upper mantle in Sichuan-Yunnan region, China. Acta Seismol. Sin. 24 (1), 1–16. doi:10.1007/s11589-002-0042-x
Wang, Q., Campillo, M., Brenguier, F., Lecointre, A., Takeda, T., and Yoshida, K. (2021). Seismic evidence of fluid migration in northeastern Japan after the 2011 Tohoku-Oki earthquake. Earth Planet. Sci. Lett., 563, 116894. doi:10.1016/j.epsl.2021.116894
Wu, H. B., Shen, X. L., Wang, J., Zhao, L., and Chen, J. (2018). Three-dimensional velocity structure of upper crust in the Three Gorges Reservoir area derived from double-difference tomography. Chin. J. Geophys. 61 (7), 2802–2814. doi:10.6038/cjg2018L0345
Xiong, K., Weng, Y., and He, Y. (2013). Seismic failure modes and seismic safety of Hardfill dam. Water Sci. Eng. 6 (2), 199–214.
Ye, X. W., Deng, Z. H., Huang, Y. M., Liu, J. P., Wang, X. N., and Liu, J. (2017). The characteristics of 3D P-wave velocity structure of Middle-upper crust and reservoir water infiltration-diffusion in Xinfengjiang Reservoir of Guandong. Chin. J. Geophys. 60 (9), 3432–3444. (In Chinese).
Zhang, H., and Thurber, C. (2006). Development and applications of double-difference seismic tomography. Pure Appl. Geophys. 163 (2-3), 373–403. doi:10.1007/s00024-005-0021-y
Zhang, L., Lei, X., Liao, W., Li, J., and Yao, Y. (2019). Statistical parameters of seismicity induced by the impoundment of the Three Gorges Reservoir,Central China. Tectonophysics 751, 13–22. doi:10.1016/j.tecto.2018.12.022
Zhao, D., Yu, S., and Liu, X. (2016). Seismic anisotropy tomography:New insight into subduction dynamics. Gondwana Res. 33, 24–43. doi:10.1016/j.gr.2015.05.008
Zhao, Q., Lou, H., and Wang, C. (2011). Teleseismic tomography of deep velocity structure in the eastern edge of Tibetan plateau. CT Theory Appl. 20 (03), 311–320. (In Chinese).
Zhao, Z., Fan, J., and Zheng, S. H. (1997). Precision determination of the crustal structure and hypocentral locations in the Longmenshan thrust nappe belt. Acta Seismol. Sin. 19 (6), 615–622. (In Chinese).
Zhao, Z., and Zhang, R. S. (1987). Primary study of Crustal and upper mantle velocity structure of Sichuan Province. Acta Seismol. Sin. 9 (2), 154–166. (In Chinese).
Keywords: reservoir impoundment, reservoir earthquake, seismic tomography, velocity structure, houziyan reservoir area
Citation: Yang Z, Cao J, Wu Y, Qin J, Huang H, Du X, Yang M and Wu J (2024) Study of 3-D velocity structure characteristics in Dadu river Houziyan reservoir area at different impoundment stages. Front. Earth Sci. 12:1324268. doi: 10.3389/feart.2024.1324268
Received: 19 October 2023; Accepted: 09 February 2024;
Published: 27 February 2024.
Edited by:
Paolo Capuano, University of Salerno, ItalyReviewed by:
Vincenzo Serlenga, National Research Council (CNR), ItalyTamaz Lucka Chelidze, M. Nodia Institute of Geophysics, Georgia
Copyright © 2024 Yang, Cao, Wu, Qin, Huang, Du, Yang and Wu. This is an open-access article distributed under the terms of the Creative Commons Attribution License (CC BY). The use, distribution or reproduction in other forums is permitted, provided the original author(s) and the copyright owner(s) are credited and that the original publication in this journal is cited, in accordance with accepted academic practice. No use, distribution or reproduction is permitted which does not comply with these terms.
*Correspondence: Junxing Cao, caojx@cdut.edu.cn; Juan Qin, 361348862@qq.com