Spatiotemporal dynamics of vegetation in response to climate variability in the Borana rangelands of southern Ethiopia
 Mitiku Adisu Worku
 Gudina Legese Feyisa
 Kassahun Ture Beketie
 Emmanuel Garbolino
- 1Department of Environment and Climate Change, Ethiopian Civil Service University, Addis Ababa, Ethiopia
- 2Center for Environmental Science, Addis Ababa University, Addis Ababa, Ethiopia
- 3Climpact Data Science, Nova Sophia, France
In this paper, we analyze the spatiotemporal dynamics of vegetation and its association with climate variables in the Borana rangelands of southern Ethiopia. Moderate resolution imaging spectroradiometer (MODIS) normalized difference vegetation index (NDVI) data, namely, MODIS/TERRA, MOD09Q1 16-day L3 Global 250 m Version 6 from National Aeronautics and Space Administration (NASA) United States Geological Survey (USGS), and climate data from 2000 to 2018 obtained from the National Meteorological Agency (NMA) of Ethiopia are used to determine the vegetation dynamics both at annual and seasonal timescales. The results indicate that the NDVI varies between .31 and .41, and the study area is dominated by sparse vegetation, especially shrubs and grasslands. The Borana rangelands were previously dominated by open grasslands, perennial herbaceous and woody vegetations, and some encroaching woody vegetations. The NDVI revealed poorer vegetation growth than the vegetation condition index (VCI) between 2000 and 2018, although variations were observed spatiotemporally. Rainfall was more highly variable both at annual and seasonal scales than the temperature during the studied years. The climate variables significantly determined the condition of vegetation, particularly during the growing seasons compared to other periods. A significant strong positive correlation was observed between the NDVI, VCI, and climate variables during the main (Belg) and short (Meher) rainy seasons in the Borana rangelands. The results of this study are beneficial for the development of proper intervention policies and provide information for sustainable rangeland management.
1 Introduction
Vegetation dynamics are controlled both by natural and anthropogenic factors that comprise climate variability and change, grazing pressure due to the increased number of livestock, bush fires (both natural and human-made), and agricultural land expansion driven by population growth (Cheikh et al., 2014). Climate change is primarily caused by the increased concentration of greenhouse gases in the Earth’s atmosphere, which is significantly caused by human activities, as reported by the Intergovernmental Panel on Climate Change (IPCC, 2014). Different economic sectors, such as agriculture, forestry, energy end-use sectors (industry, transportation, and buildings), and many others, are contributing disproportionately toward this increase. The agriculture, forestry, and other land uses (AFOLU) sector is the major factor contributing to the emission of greenhouse gases in Ethiopia, contributing nearly 80% of the total emissions (Ethiopia’s Climate-Resilient Green Economy Strategy (CRGE), 2011; Worku, 2020). Agricultural practices that include both growing crops and livestock raising form the major economic basis in Ethiopia. The population of the country is growing at an alarming rate, which has resulted in the demand for additional agricultural land. This extra land for farming purposes is converted from previously forested and grassland areas, and bushfires are currently commonly observed.
In addition, the lowland areas of Ethiopia dominated by shrubs and grasslands are inhabited by pastoral and agropastoral communities. These areas, on one hand, are overgrazed by the huge number of livestock in the region, while on the other hand, they are threatened by woody plant encroachment. Therefore, it is extremely important to understand how the vegetation dynamics respond to any of these factors in order to address problems associated with them.
There have been different approaches adopted to analyze land cover dynamics. Since the 1970s, numerous studies have used satellite-based land observations to monitor and analyze land surface dynamics. Remotely sensed data provide a synoptic view of the land and a spatiotemporal context (Gu et al., 2007; Cheng, Nnadi & Liou, 2015). Geospatial techniques are used to derive various vegetation indices for the effective analysis of vegetation dynamics using various image processing methods (Dutta et al., 2015). Remotely sensed vegetation indices are effective and suitable for the spatial and temporal monitoring of vegetation conditions (Rousta et al., 2020). According to Liu et al. (2020), commonly used indices for monitoring vegetation conditions include, among others, the normalized difference vegetation index (NDVI), vegetation condition index (VCI), and temperature condition index (TCI) (Liu et al., 2020).
Several studies have been conducted on the dynamics of vegetation using satellite-based remotely sensed data and linked to climate parameters in different areas. To highlight a few papers conducted in Ethiopia, Getahun and Shefine (2015) analyzed climate variability and vegetation dynamics in the north-central areas of the country (Gojjam) from 2000 to 2008 and observed a highly variable NDVI and rainfall during the growing season. Zewdie et al. (2017) also studied the long-term trends in dryland vegetation variability in northwestern Ethiopia (Kaftahumera) from 2000 to 2014 and revealed a significant reduction trend in vegetation until 2009. Similarly, Tadesse et al. (2020) analyzed the long-term dynamics of woodland vegetation in the northwestern lowlands of Ethiopia using Landsat data from 1984 to 2014, finding precipitation to be a significant key factor for woodland vegetation and that the NDVI significantly contributes to climate variability. Wedajo et al. (2019) and Melku et al. (2020) further studied the nexus between climate and vegetation change over the Dhidhessa River and Gojeb River catchments. A strong interaction was found between the climate variables and vegetation greenness in the case of Dhidhessa, while a strong positive increment of the NDVI, which is attributed to rainfall, was observed in the Gojeb River catchment.
Furthermore, Muir et al. (2021) investigated vegetation change using MODIS satellite data over the entire country of Ethiopia, observing declines in the NDVI, with the greatest change during the dry season and concentrated in the northern semi-arid regions of the country. Similarly, Measho et al. (2019) noted a decreasing NDVI at 57.15% and 58.74% of all the pixels, respectively, for the annual main growing seasons in the semi-arid region of Eritrea. Fenetahun et al. (2022) recently estimated the yearly dynamics of biomass production and carrying capacity of the Borana rangelands of southern Ethiopia using NDVI and field-based data, revealing a significant decrease in the biomass production (R2adj = .67) and the NDVI value (R2adj = .47) from 1990 to 2019. Therefore, most of the papers conducted previously in the country, particularly in a similar environment (Wedajo et al., 2019; Melku et al., 2020; Tadesse et al., 2020; Fenetahun et al., 2022), have captured and applied NDVI data from advanced very high-resolution radiometer (AVHRR) sensors. This source can extend data back to the 1980s and hence provide an adequate length of year, but its spatial resolution (8 km by 8 km) is coarser, which makes the observation of detailed land cover challenging. In this study, we intend to analyze vegetation dynamics on a monthly, seasonal, and annual basis, ranging from 2000 to 2018, using relatively high-resolution (250 m x 250 m) multi-temporal MODIS satellite data. We also examine the response of vegetation conditions in relation to local climate variability over the same period. Apart from these few papers, no study has been conducted in the region, even though the information on the nexus between vegetation dynamics and climate variability is crucial to policymakers, practitioners, and the community at large. It is believed that the findings of this paper may provide a basis for developing proper intervention policies and provide information relevant to the sustainable management of rangeland resources in the study area and similar environments.
2 Materials and methods
2.1 Study area
The Borana rangelands are located in the southern parts of the country, stretching approximately from 3030′ N to 5025′ N latitude and 36,040′ E to 39,045’ E longitude. The average elevation range is between 450 m in the west and 2,487 m above mean sea level in the north-central and central areas, as shown in Figure 1. The mean annual temperature of the study area, as reported by Fenetahun et al. (2022), varies between 28°C and 33°C with little seasonal variation, whereas the average annual rainfall is estimated as between 350 mm and 900 mm (Debela et al., 2019), which was later reported between to be 285 mm and 741 mm by Worku et al. (2022). The rainfall received is distributed among the two rainfall periods, namely, Belg (March to May), which accounts for nearly 60%, and Meher (September to November), which accounts for 27% of the total rainfall with high spatial and temporal fluctuations (Gemedo et al., 2006). In between Belg and Meher, constituting the seasons in a year, there exist dry seasons, namely, Bega (December to February) and Kiremt (June to August) (Korecha & Barnston, 2007; Riche et al., 2009).
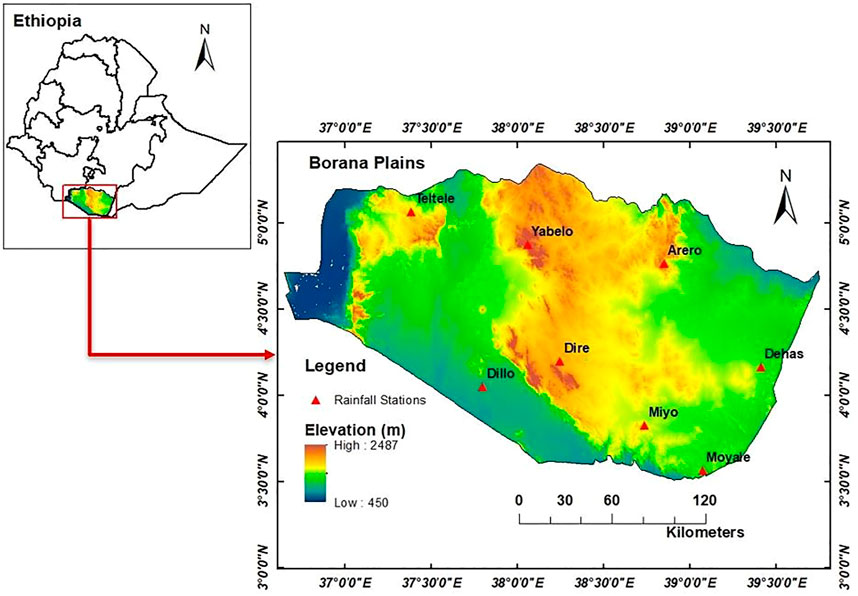
FIGURE 1. Location map of the study area.
The main landcover types of Borana include shrubland, grassland, woodland, cultivated land, exposed surfaces, or bare land. The Borana rangelands are dominated by tropical savanna vegetation, with varying proportions of open grasslands and perennial herbaceous and woody vegetation (Pratt & Gwynne, 1977). The dominant encroaching woody species include Senegalis mellifera, Vachellia reficiens, and Vachellia oerfota (Coppock, 1993; Gemedo et al., 2006), and the bushlands are dominated by Acacia and Commiphora species (Haugen, 1992). Furthermore, the most frequent grass species in the study area include Chrysopogon aucheri (45%), Eragrostis papposa (30%), and Sporobolus pellucidus (25%), as previously reported by Gemedo (2004) and Gemedo et al. (2006).
The population inhabiting the region has long been exclusively pastoral and has recently started practicing small-holder farming. The start of farming practices is a means of coping with climate-related risks, particularly drought. The region is a drought-prone area, and in some cases, this climatic event causes deleterious impacts on the community, livestock, and farm fields.
2.2 Data types and sources
Monthly rainfall and maximum and minimum temperature data for all the stations in the Borana rangelands for the period 2000–2018 were collected from the Ethiopian National Meteorological Agency (NMA) to calculate annual and seasonal means for the climate variables considered. Since station observations are not free from missing values, gridded data with a spatial resolution of 4 km x 4 km were used to fill the data gaps both for rainfall and temperature. The latter data types were also obtained from the NMA and were developed through the enhancing national climate services (ENACTS) initiative that integrates satellite-based data with station observations; hence, the data were made complete and used in the analysis.
Moderate resolution imaging spectroradiometer (MODIS) normalized difference vegetation index (NDVI) data were used in this study. The data exist in various spatial resolutions of 250 m, 500 m, and 1,000 m. It is believed that the data improve our understanding of global dynamics and the processes occurring on the land, in the oceans, and in the lower atmosphere. MODIS is playing a vital role in the development of validated, global, interactive Earth system models able to predict global change accurately (Rousta et al., 2020).
Therefore, the MODIS data product, MOD13Q1, was used for the NDVI. The MODIS-NDVI data from 2000 to 2018 were downloaded from the Land Processes Distributed Active Archive Center (LP-DAAC), which can be accessed from USGS Global Visualization Viewer (http://earthexplorer.usgs.gov).
2.3 MODIS vegetation indices
2.3.1 Normalized difference vegetation index (NDVI)
The NDVI is the most common and useful index for investigating vegetation status. It has been used in different studies in the modern era (Mushore et al., 2019). The basic concept of the NDVI is based on the fact that the internal mesophyll of healthy green leaves highly reflects near-infrared (NIR) radiation, whereas the leaf chlorophyll and other pigments absorb a large proportion of the visible (red) radiation (Broge & Leblanc, 2001). This function of internal leaf structure becomes reversed in the case of unhealthy or water-stressed vegetation. The NDVI is calculated using the following Eq. 1 (Dutta et al., 2015):
where RED and NIR represent spectral reflectance measurements acquired in the visible (red) and near-infrared regions of the spectrum, respectively. Because the pigment in plant leaves (chlorophyll) strongly absorbs visible light (from .4 to .7 μm) for use in photosynthesis and the cell structure of the leaves strongly reflects near-infrared light (from .7 to 1.1 μm), the greener leaves a plant has, the more these wavelengths of light are affected, and hence the higher the NDVI. The NDVI has been used for analyzing changes in vegetation that have been affected by the surrounding environment (Wang et al., 2001).
More recently, MODIS data have been widely used in order to monitor vegetation dynamics (Gu et al., 2007; Swain et al., 2011; Wu et al., 2015). In this study, 439 images from Terra MODIS 16-day composite NDVI with 250 m resolution (MOD09Q1, collection v006), as shown in Table 1, for the period 2000 to 2018 were downloaded from the NASA USGS website by using the Application for Extracting and Exploring Analysis Ready Samples (AppEEARS) software (https://lpdaacsvc.cr.usgs.gov.appeears) (Didan, 2015).
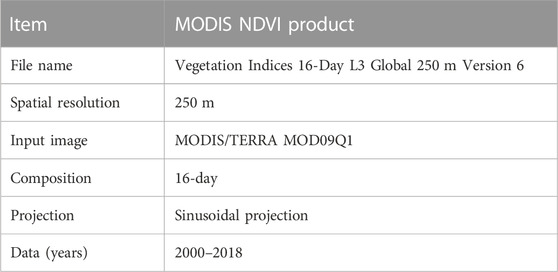
TABLE 1. Specification of the MODIS NDVI product used in this study.
The main advantage of using MODIS data is the high temporal resolution (availability of daily images) and the composite image technology, which enables the creation of 8-day or 16-day composites from the highest quality pixels, that is, free of atmospheric effects such as cloud cover and shadow. The disadvantages of MODIS data are the moderate geometric resolution (250 or 500 m) and the fact that the data are from 2000, so we do not have data for more than two decades (Gulacsi & Kovacs, 2018; Rousta et al., 2020).
The standard values for the NDVI are between −1 and +1. However, the NDVI range for MODIS data was standardized by multiplying with a scale factor of 1/10,000 or .0001, and accordingly, various NDVI scales for different land cover types were determined in this study. The yearly and seasonal average NDVI were then obtained, and the corresponding maps were produced for the Borana rangelands. The NDVI values were categorized into five classes, as shown in Table 2.
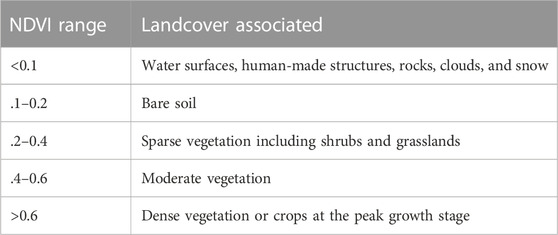
TABLE 2. NDVI classification and land cover and/or drought associated with this study.
2.3.2 Vegetation condition index (VCI)
There have been several NDVI-based vegetation indices that have been proposed with vegetation condition monitoring (Yang et al., 2011). The VCI compares the current NDVI to the range of values observed in the same period in previous years. It is expressed as a percentage and gives an idea of where the observed value is situated between the extreme values (minimum and maximum) in the previous years. Hence, the VCI contains both real-time and historical information about the NDVI. Using the formula to calculate the VCI in Equation (2) results in a number between 0 and 100, where smaller VCI values indicate worse vegetation growth and higher degrees of vegetation dryness (Kogan, 1990; 1995a; b), as the scale indicates in Table 3. Therefore, the formula to calculate the VCI, as given and applied by Kogan (1990), Kogan et al. (2004), Ghaleb et al. (2015), and Wei et al. (2021), is
where NDVIi is the NDVI value of the pixels during a specified time period, and NDVImax and NDVImin are the maximum and minimum NDVI values, respectively, during a specified time period.
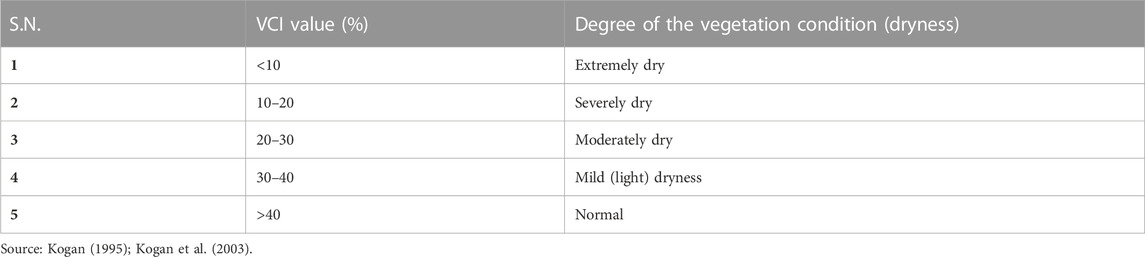
TABLE 3. VCI classification scale.
The VCI assesses changes in the NDVI signal through time due to weather conditions, reducing the influence of geographic (Kogan, 1990) or ecosystem (Kogan, 1995c) variables, including climate, soils, vegetation type, and topography. Lower and higher VCI values indicate bad and good vegetation state conditions, respectively.
2.4 Correlation analysis
In this study, the Pearson’s correlation coefficient (r) was applied in order to determine the linear association between the vegetation indices (NDVI and VCI) and the climate variables on an annual and seasonal basis at the 95% level of confidence. Pearson’s correlation coefficient (r) is given by
where n is the number of observations; x and y are the variables; and
Overall, in this study, both spatial and non-spatial data from different sources were used in order to analyze the dynamics in vegetation and also to see the nexus between vegetation growth and climate variables, particularly rainfall and temperature. Therefore, the correlation of vegetation-based indices and the climate variables was seen, and their significance was also tested in this study. The methodological framework applied in this paper is indicated in Figure 2.
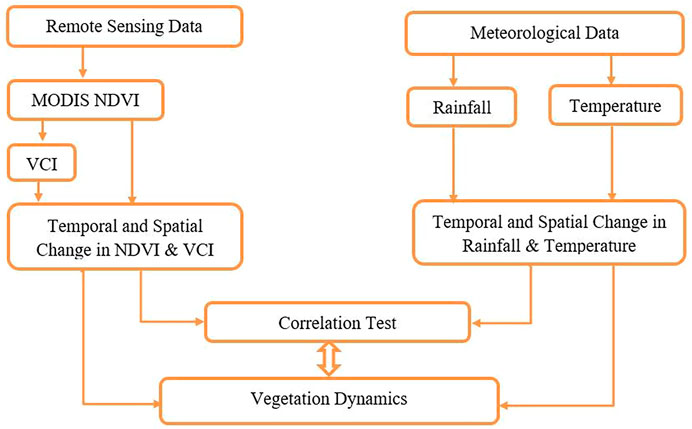
FIGURE 2. Methodological framework of the study.
3 Results
3.1 Annual temporal variations in the NDVI, VCI, and climate variables
The mean NDVI value for the Borana rangelands during the entire period was .36 (Table 4). The mean values vary between .31 between the years 2000 and 2007, when it was the smallest, and .41 in 2003 and 2013, which revealed the highest NDVI values (Figure 3A). The results revealed that the study area is covered by sparse vegetation, while the dominant vegetation types are shrubs and grasslands. Regarding the VCI, an NDVI-based vegetation index, the study area exhibited a mean VCI value of 40.65% (Table 4), which signifies normal vegetation conditions. However, some years (including 2000, 2001, 2005, 2007, 2008, 2009, and 2016) showed light dryness of vegetation. The period after 2009 showed better vegetation conditions than the period ahead. A relatively poor vegetation condition (VCI = 30%) was observed in 2007, while on the contrary, a better vegetation condition was observed in 2013 in the Borana rangelands, as shown in Figure 3B.
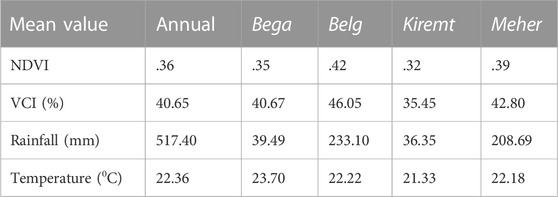
TABLE 4. Annual and interannual mean values of vegetation indices and climate variables (2000–2018).
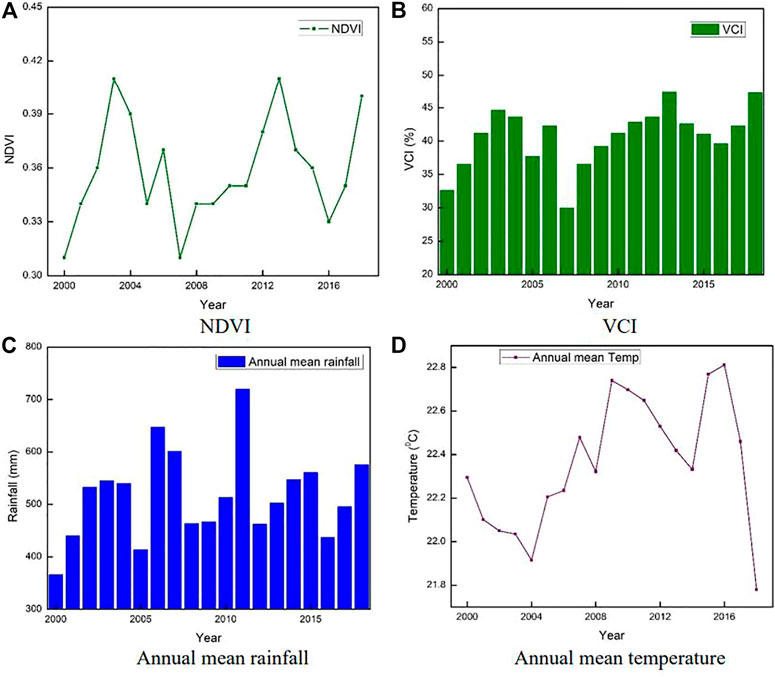
FIGURE 3. Annual mean variations in (A) the NDVI, (B) the VCI, (C) rainfall, and (D) temperature (2000–2018).
Average annual rainfall of 517.40 mm was observed in the study area over the studied years, with the year 2000 found to be the driest (366.22 mm) and 2011 the wettest, with a mean rainfall close to 720 mm. Hence, 2011 received rainfall equivalent to almost twice that of the driest year (2000) (Figure 3C). Unlike rainfall, the temperature was characterized by low-level variability in the Borana rangelands over the studied period, with a mean of 22.36°C and a range of 1.03°C. Therefore, a more or less similar temperature condition has prevailed over the study area and a slight variation was observed in the latter years, as shown in Figure 3D.
3.2 Interannual temporal variations of the NDVI, VCI, and climate variables
Table 4 provides the seasonal summary of all variables considered in this study. Regarding the NDVI, its mean value is smaller during Kiremt (June to August), which is 0.32, followed by Bega (December to February), with an NDVI equal to .35. The mean value becomes relatively better during Belg (March to May), which is the main rainy season, when the NDVI = 0.42. The other index, VCI, shows that the vegetation condition is characterized by mild (light) dryness during Kiremt (VCI = 36.35%), whereas during the remaining seasons, it looks normal and even better during Belg.
The climate variables, particularly rainfall and temperature, were also seen at a seasonal scale in the Borana rangelands. Belg is the wettest season with a mean rainfall of 233 mm, followed by Meher with 209 mm, which favors vegetation greenness during these seasons. On the other hand, the Kiremt and Bega seasons were the driest seasons, where the mean rainfall observed was 36 mm and 39 mm, respectively. Rainfall is highly variable on a seasonal basis, and the deviation between the wettest and driest season was 197 mm. Contrary to the rainfall, the seasonal variation of mean temperature was lesser. The Bega season was warmer (23.7°C), followed by Belg (22.22°C), whereas Kiremt was relatively cooler (21.33°C) than the rest of the seasons. The seasonal temperature deviation between the extreme values in the Borana rangelands was 2.37°C, which is much higher than the annual deviation.
The seasonal trends of the NDVI, VCI, and climate variables are also depicted in Figure 4A. The NDVI varies from one year to the other: the Belg NDVI is the highest, followed by the Meher NDVI. Keeping in mind some exceptional years, the NDVI during Kiremt falls below the NDVI during the other seasons. The Belg VCI is better than other seasons, followed by Meher, while Kiremt relatively exhibits lesser VCI values (Figure 4B). Although the Meher rainfall exceeds that of Belg in some years, in summary, Belg rainfall is the highest in the Borana rangelands (Figure 4C). However, the mean rainfall during Kiremt and Bega in the study area remains among the lowest during all the individual years. Finally, as shown in Figure 4D, the mean temperature trend for Bega is the highest over the studied years, followed by Belg. For the entire study period, the mean temperature during Kiremt is the lowest compared to the other seasons, which implies seasonal temperature variability.
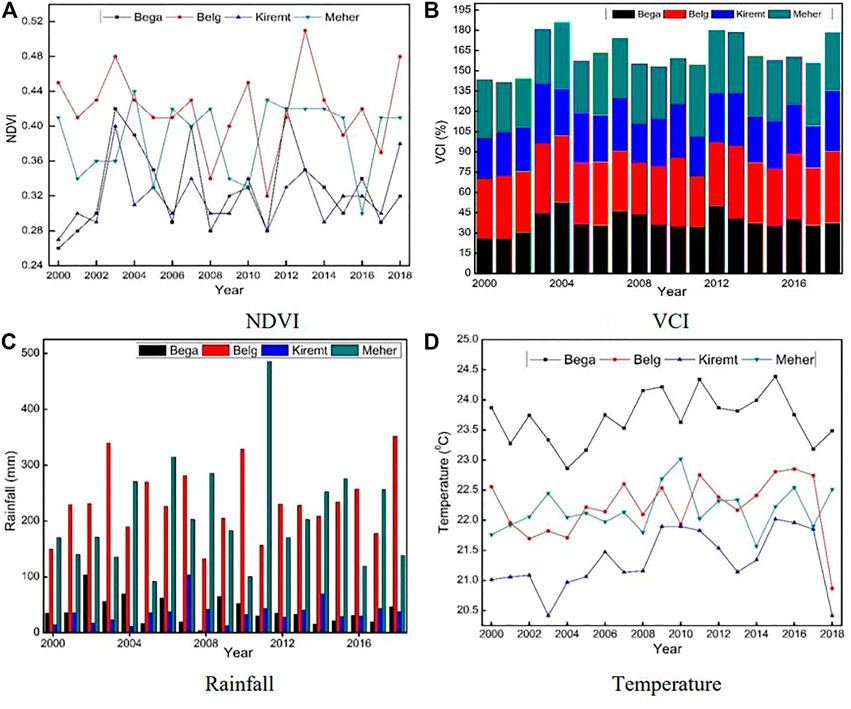
FIGURE 4. Seasonal NDVI (A), VCI (B), rainfall (C), and temperature (D) from 2000 to 2018.
3.3 Spatial annual and interannual variability in the NDVI and climate variables
3.3.1 Annual NDVI change
Figure 5 shows the annual spatial change of the NDVI from 2000 to 2018 in the study area. The land cover is classified into five classes: surface water, barren land, sparse vegetation (shrubs and grasslands), moderate vegetation, and dense vegetation. The western extreme region of the study area (“Lake Chew Bahir,” the southern extension of the Ethiopian Rift Valley) is characterized by its lower vegetation cover (NDVI <.1) during the entire period. The second lowest level of NDVI (.1–.2) was seen in the southwestern areas along the Ethiopia–Kenya border, particularly in 2000, 2005, 2007, 2009, 2014, 2016, and 2017. On the other hand, dense vegetation is only found in some pockets or very remote areas, as can be seen in Figure 5. The region is dominantly covered with sparse vegetation, especially shrubs and grasslands, during almost all of the years. However, in some years, including 2003, 2004, 2012, 2013, and 2018, vegetation greenness increased and the region’s areas were covered with moderate vegetation, where the mean NDVI ranges between .4 and .6.
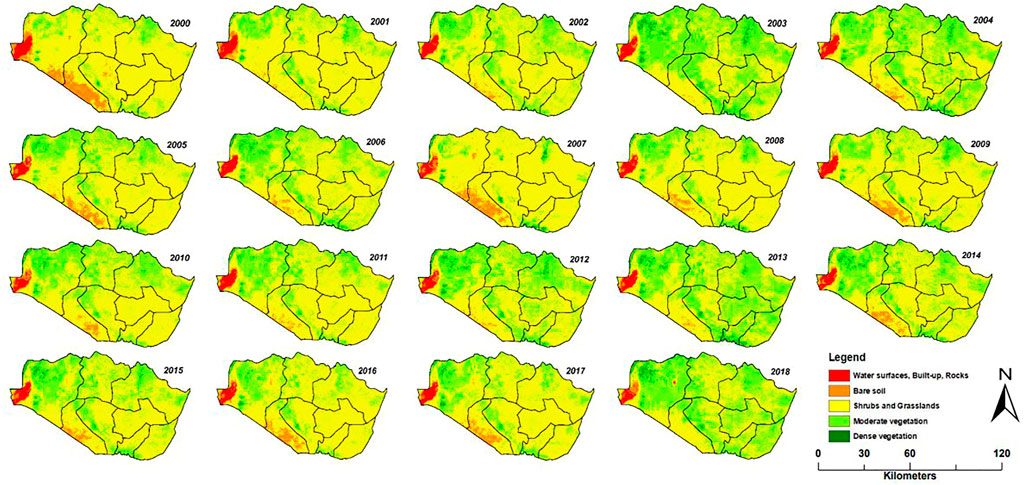
FIGURE 5. Annual mean NDVI change in the Borana rangelands from 2000 to 2018.
3.3.2 Seasonal (wet and dry) NDVI change
The mean NDVI maps for two dry seasons, namely, Bega (December to February) and Kiremt (June to August), were produced for the entire period. The Bega season is characterized by a low NDVI, as expected, since the study area and the entire area of Ethiopia, except for smaller areas in the northeastern region, remain dry during this season. Some years, including 2003, 2007, 2012, and 2016 (Figure 6A), show vegetation greenness, and the vegetation types observed during these years were not of a woody kind but rather temporary (herbaceous) plants that last for only a few months. The dominant land cover type is shrubs and grasslands in the areas of the study region. Similar to the annual case, the western and southwestern areas are characterized by water features, as well as barren land during the Bega season. During Kiremt, the region is characterized by a low NDVI, especially in the western and southwestern areas, in an almost regular pattern. There were also some years (2003 and 2018) during which sparse and moderate vegetation dominated the region (Figure 6B).
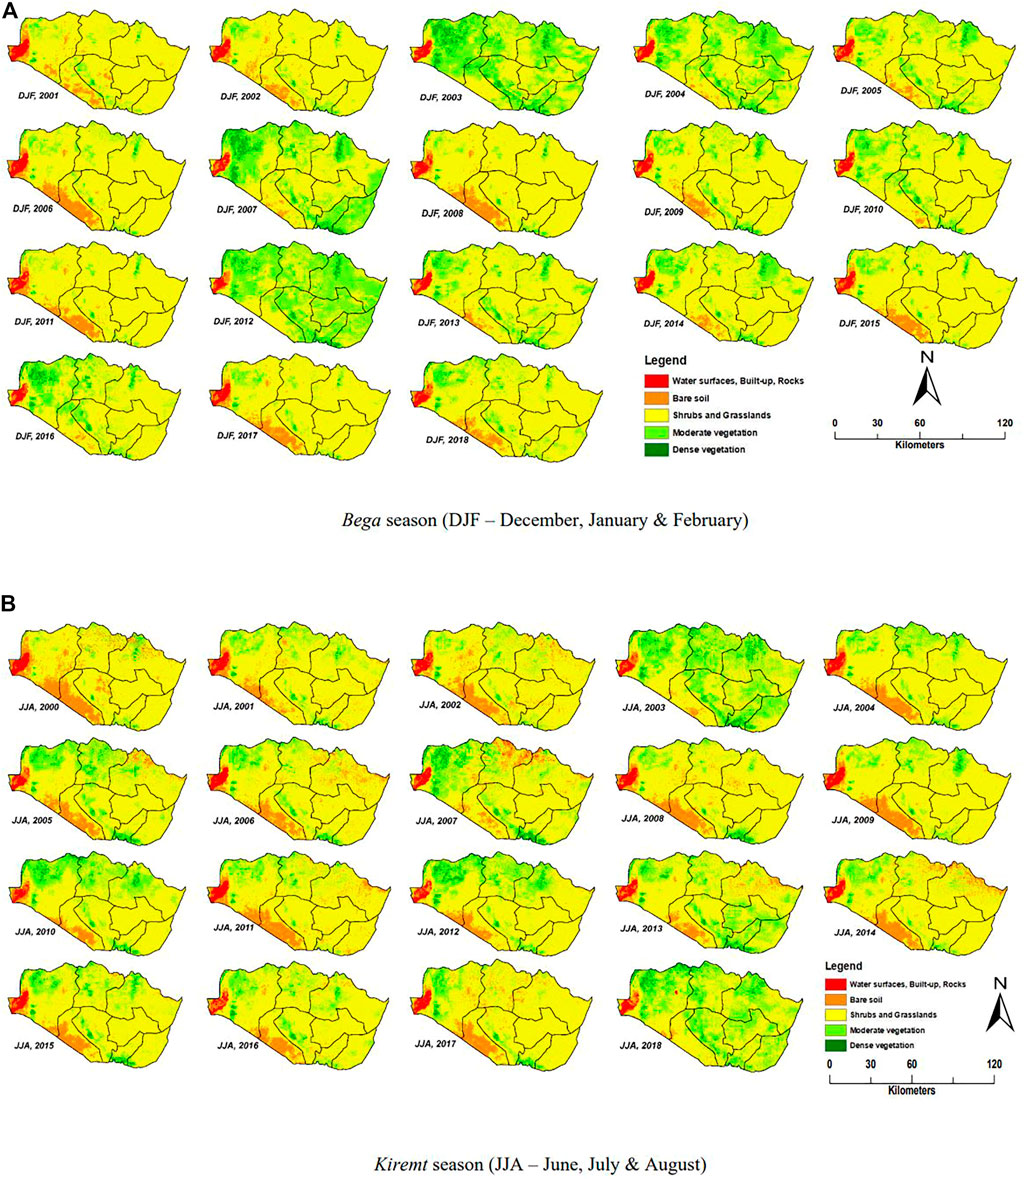
FIGURE 6. Dry season NDVI change from 2001 to 2018: (A) Bega; (B) Kiremt.
During the wet seasons, particularly Belg (March to May), the region receives much of the rainfall, and vegetation greenness increases, except for some areas in the extreme western and southwestern areas, as shown in Figure 7A. The green vegetation that dominantly covers the entire rangeland does not last long and begins to fade away as the intensity of rainfall decreases in the area. These vegetations are herbaceous plants that start to dry when the rain stops. A similar kind of vegetation greenness, but with a lesser level, was observed in the study area during the other short rainy season, Meher (September to November). In the Meher season, moderate to dense vegetation is mainly observed for most of the years, following the rain received in this part of the country, as observed in Figure 7B. Therefore, climate variables determine the condition of vegetation, which can either be greenness or dryness in a particular region.
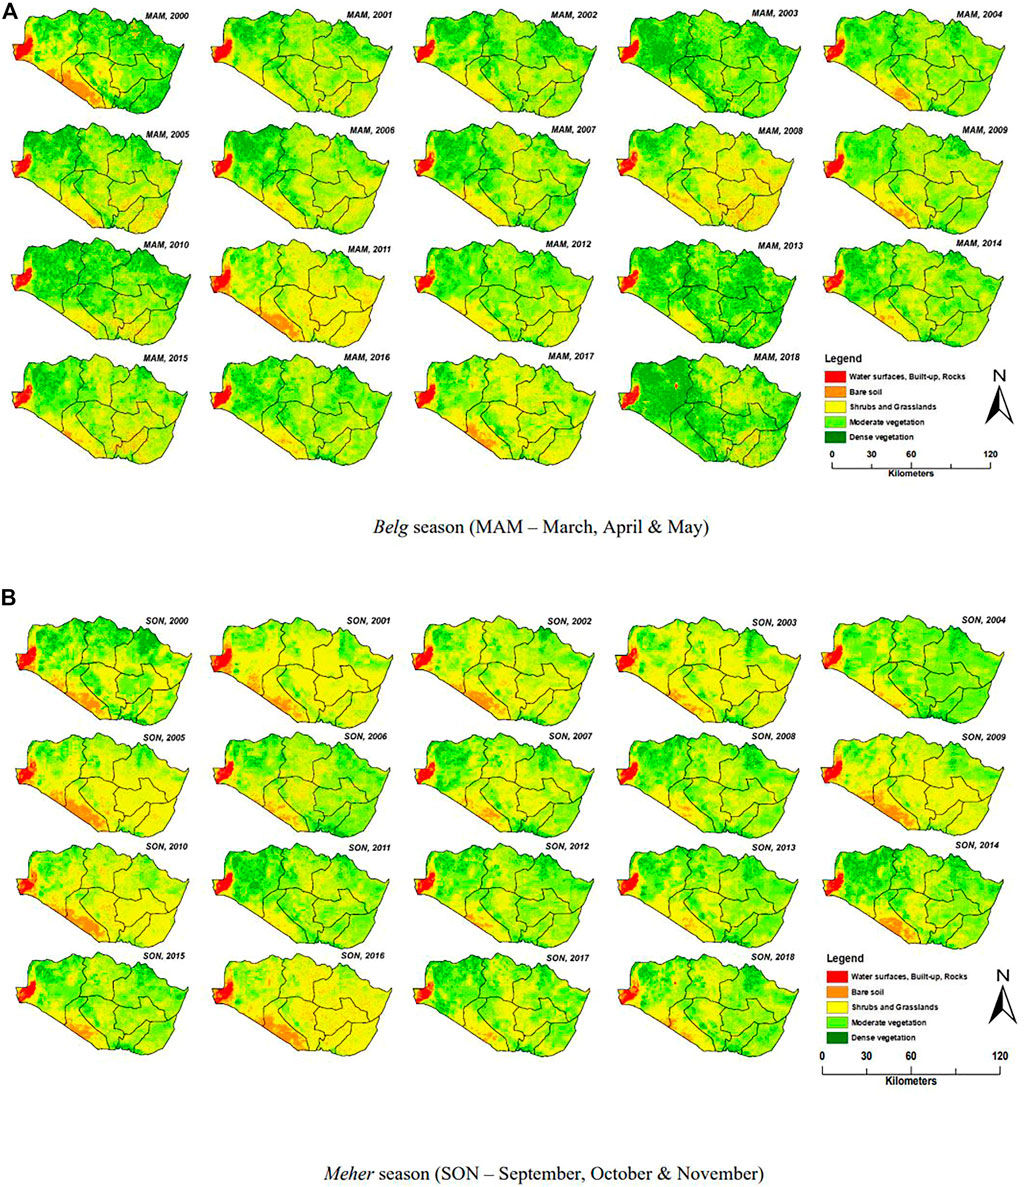
FIGURE 7. Wet season NDVI change from 2000 to 2018: (A) Belg; (B) Meher.
3.3.3 Climate variability
The mean annual rainfall varies significantly across the study region, with the northeastern areas receiving better rainfall (exceeding 800 mm), while the southwestern areas are drier, and only about 300 mm per year is received in the areas along the Ethiopia–Kenya border (Figure 8A). The rest of the places obtained an average rainfall. Concerning the mean annual temperature, the southeast and southwest areas were warmer than the northern, north-central, and northeastern areas (Figure 8B). Hence, a temperature range of about 5.7°C was noted between these extreme temperature zones in the Borana rangelands. Overall, both rainfall and temperature vary spatially at an annual scale during the studied years in the Borana rangelands, but the degree of variability is higher for rainfall.
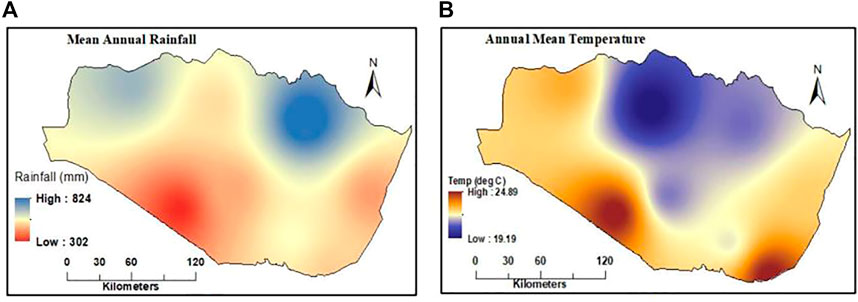
FIGURE 8. Spatial variability of mean annual rainfall (A) and temperature (B): the spatial maps produced were the result of the inverse distance weighted interpolation technique derived from the data source points (station) both for rainfall and temperature.
Rainfall also varies from one season to the next in a year. The Belg rainfall dominantly falls over the northeastern and the northwestern areas (>300 mm) and drops toward the southwest (∼130 mm). However, during the shortest rainfall season, Meher, much of the rain occurs over the northeastern region. Therefore, the northeastern regions received relatively excess rainfall during both the Belg and Meher seasons. Bega is the driest season in the region, as well as in the entire country, and the region received only a minimum seasonal rainfall that occurs over the northwest parts. On the contrary, Kiremt rainfall (June to August) occurs in the northeast and decreases toward the south, southwest, and southeast. However, during this particular season, most parts of the country, except the study region and the far northeast areas of Ethiopia, obtain their maximum rainfall in the year.
Unlike rainfall, the spatial distribution of temperature during all seasons shows similarity. The northern, north-central, and northeastern areas were characterized by average minimum temperature, and the southwestern and southeastern regions were characterized by maximum temperature. Low-level variability was observed where the Bega was warmer than the rest of the seasons, as shown in Figure 9.
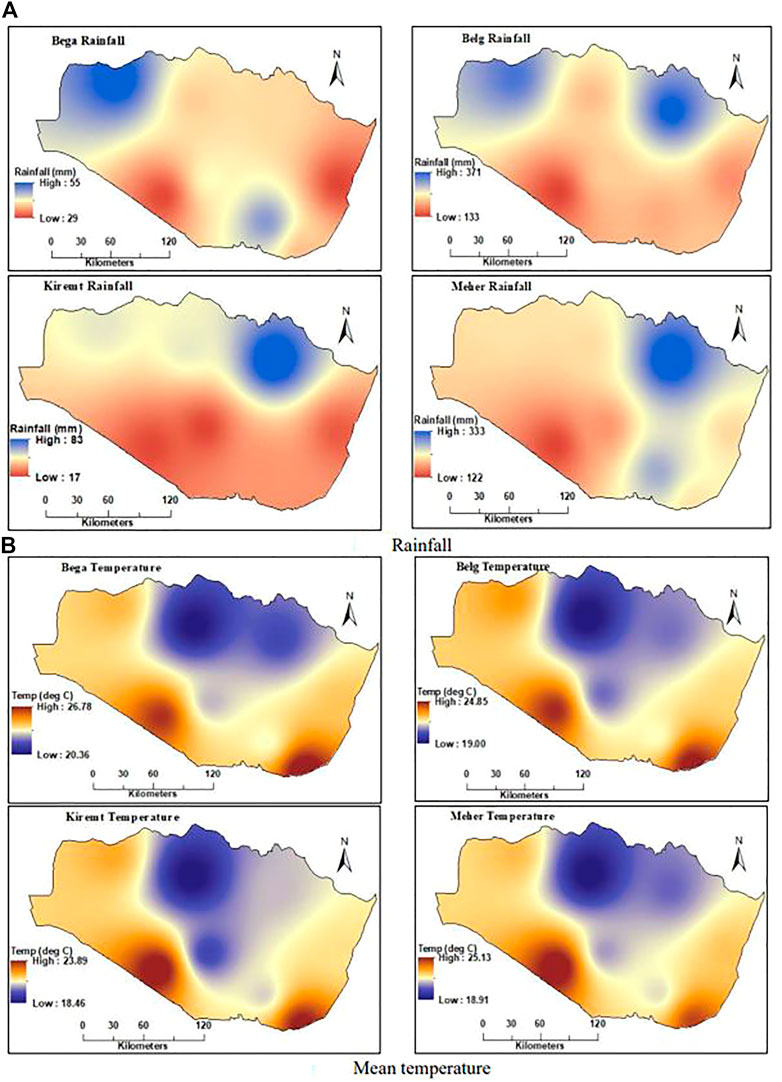
FIGURE 9. Spatial variability of rainfall (A) and temperature (B) across different seasons.
3.4 Nexus between the vegetation indices and climate variables
We tested the correlation between the NDVI and VCI with the two important climate variables, i.e., rainfall and temperature, using Pearson’s correlation coefficient, and the significance was tested at the 95% confidence level. The results revealed that the mean annual rainfall has a weak positive correlation both with NDVI and VCI, whereas the mean annual temperature has a moderate positive correlation with the NDVI and a weak positive correlation with the VCI. In both cases, the correlation was not statistically significant (p-value > 0.05). Seasonally, Bega rainfall has a weak positive correlation with both vegetation indices, while Kiremt rainfall has a very weak positive correlation. Since both the Bega and Kiremt seasons are identified as dry seasons, vegetation greenness and an increase in the NDVI and VCI values were not expected in the study area. However, the wet seasons, Belg and Meher, had a strong positive correlation with the NDVI and VCI that was statistically significant (p-value < 0.05), as shown in Table 5. This implies that the Borana rangelands are characterized by considerable vegetation greenness only during the rainy seasons, while one does not observe better a vegetation condition when the dry period takes over.
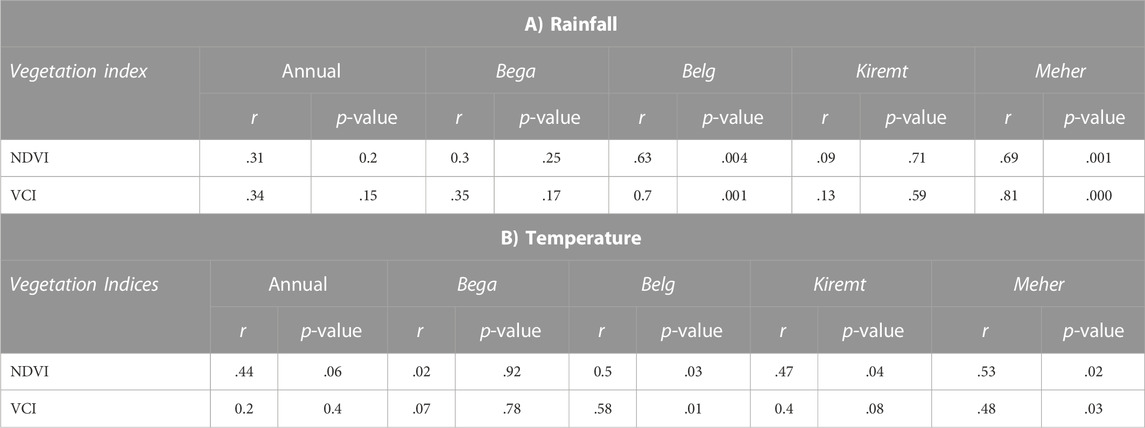
TABLE 5. Correlation between NDVI, VCI, and climate variables [A) rainfall; B) temperature].
The correlation coefficient again indicates that the vegetation indices have a moderate positive correlation with the Kiremt temperature and a very weak positive correlation with the Bega season temperature, and this shows highly similar characteristics with rainfall. The temperature during Belg and Meher is significantly correlated (p-value < 0.05) with the NDVI and VCI, showing in all cases a moderate positive correlation (Table 5). The degree of association between the vegetation indices and the climate variables is higher for rainfall than temperature, which indicates that rainfall determines vegetation greenness more than temperature in the Borana rangelands.
4 Discussion
The Borana rangelands are one of the areas in the country characterized by a low NDVI, implying poor vegetation conditions. Sparse vegetation, especially bushes and grasslands, covers most parts of the region, whereas dense vegetation with better NDVI values are confined to some pocket areas inaccessible to human interference. The NDVI value varies at temporal and spatial scales in the rangelands of Borana, and some years are characterized by better vegetation conditions, while others by worse. The VCI, unlike the NDVI, exhibited near normal conditions but only identified mild dryness during some years. On the other hand, both showed similarity in the identification of periods of dryness and greenness vegetation conditions. In a study recently conducted by Fenetahun et al. (2022), both biomass production and NDVI values decreased from 1990 to 2019 and the observed biomass production was not in a good condition in the Borana rangelands of southern Ethiopia. Kourouma et al. (2021) found overlapping years of severe dryness conditions over Ethiopia that had significant impacts on crops. Measho et al. (2019) also observed a decreasing slope of the NDVI both at annual and seasonal timescales in the semi-arid region of Eritrea, whereas Melkamu (2019) observed a dynamic change in vegetation cover from 1986 to 2016 in all seasons in the Andassa watershed of the Blue Nile Basin, Ethiopia.
The Borana rangelands are characterized by four distinct seasons, each of 3 months’ duration. The NDVI maps were prepared based on the seasonal distribution observed in the study area. Bega and Kiremt are the dry seasons in the study area, and the NDVI values for these seasons were below the annual averages. During the drier seasons, the region is characterized by its poor vegetation since the shortage of rainfall and lack of soil moisture is responsible for the poor vegetation commonly observed. The western extreme area of the Borana rangelands is characterized by its very low NDVI, i.e., a proportion of a water feature (Chew-Bahir) and the southwestern areas across the Ethiopia–Kenya border was mainly uncovered by any type of vegetation (hence bare soil) for most of the years. This result is consistent with Muir et al. (2021), who observed cumulative declines in the NDVI, with the greatest change in the dry season in the arid areas of northern Ethiopia. The findings of Getahun and Shefine (2015) are consistent with the current findings in that climate variability is extremely common during the short rainy season and continues to affect the vegetation condition in Gojjam (north-central areas of Ethiopia).
The Borana rangelands are characterized by moderate vegetation conditions, particularly during Belg, the main rainy season. Most of the vegetation types are herbaceous and seasonal plants that start to dry when the rain stops. Meher is the other season when the vegetation condition looks better for the second time in a year. The degree of greenness during this time is lower than that of Belg. However, during both rainy periods, the NDVI change is observed from year to year and place to place, following the intensity and distribution of rainfall in the study area. Getahun and Shefine (2015) observed a highly variable NDVI and rainfall during the growing season in Gojjam, similar to the present study. Tadesse et al. (2020) found high spatial and temporal dynamics of woodland vegetation in the semi-arid areas of the northwestern parts of Ethiopia. In addition, Kalisa et al. (2019) noted higher seasonal variability of the NDVI during the short compared to the long rainy season in Eastern Africa between 1982 and 2015, and this supports what we have found in the current study.
The vegetation condition of the Borana rangelands, based on the VCI during different seasons, indicates that the Kiremt season has mild dryness, while there are near normal conditions of vegetation during the rest of the seasons. Although the NDVI during Bega is below average, the VCI during the same season exhibited an above average vegetation condition. Both indices suggest the similar nature of the vegetation during the wet seasons and the dry seasons in the study area.
An inadequate amount of rainfall is obtained in the Borana rangelands, which is mainly distributed during the two wet seasons. This determines the condition of vegetation growth in the region, although internal variation exists between different geographical locations. Overall, the mean annual rainfall received in the Borana rangelands is at its maximum in the northeastern areas, followed by the northwestern areas, and decreases toward the southwestern areas on an annual basis. The areas receiving relatively better rainfall are attached to the foothills of the highlands in the north, and the influence of topography on climate variables is one of the most significant in the case of Ethiopia, among other factors. Seasonally, the rainfall received during Belg follows a similar pattern to that of the annual rainfall but the Meher rainfall is concentrated in the northeastern regions. Vegetation greenness was commonly observed during these wet seasons in most of the years under study. It should be noted that the green vegetation observed during these seasons are herbaceous plants, following the rainy periods, and these plants covering most of the areas start dying by the time the amount of rainfall obtained starts decreasing. An increase in the NDVI was supported by the observed increase in precipitation in the northern counties of Taiwan (Tsai & Yang, 2016). Measho et al. (2019) further observed a significant positive correlation between the growing season NDVI and precipitation in the semi-arid region of Eritrea from 2000 to 2017. The same characteristics were observed in Ethiopia (Liou & Mulualem, 2019), in Ningxia, China (He et al., 2020), and in Inner Mongolia between 2002 and 2019 (Hao et al., 2021).
Temperature, unlike rainfall, is less variable in the Borana rangelands. The mean annual temperature observed is more or less similar to that observed during Belg and Meher. However, relatively, Bega and Kiremt are seasons of extreme temperature conditions, with Bega being the warmest season and Kiremt being the coolest season. The mean temperature at an annual scale is the lowest in the north-central region and increases toward the southeastern and southwestern regions. These regions are characterized both by lower elevation and being devoid of vegetation, which likely contributes to the warmer conditions prevailing. The reason is that vegetation regulates the warmer temperature of a place through sequestering carbon. With minor variations, the spatial distribution of seasonal temperature looks similar to the annual pattern in the Borana rangelands. Hence, the response of vegetation cover toward temperature fluctuation is not higher, unlike rainfall in this semi-arid region. Hao et al. (2021) observed that vegetation growth in drier areas is controlled by precipitation and solar radiation more than other climatic factors. Furthermore, as reported by He et al. (2020), the sensitivity of vegetation toward climatic variables shows significant seasonal variation.
We found a positive correlation between MODIS vegetation indices and climate variables in this study. Weak correlation was observed between the NDVI and VCI for rainfall at an annual basis and during the drier seasons. On the contrary, a significant strong positive correlation exists between these indices and the rainy seasons. Therefore, in this study, both the NDVI and VCI are strongly influenced by Belg and Meher rainfall, and the influence is significant. Tadesse et al. (2020) observed precipitation as a significant factor for woodland vegetation and as having a positive correlation with the NDVI. In addition, a strong positive correlation has been found between the NDVI and seasonal rainfall in most years from 2000 to 2008 (Getahun & Shefine, 2015). Similar observations have been made by several authors in their respective studies (Jiang et al., 2019; Kalisa et al., 2019; Wedajo et al., 2019; Zhang et al., 2020).
The mean annual temperature is moderately associated with the NDVI but weakly associated with the VCI (not statistically significant). Both the Belg and Meher temperatures are moderately correlated with the NDVI and VCI. In this case, the degree of influence of the temperature during Belg and Meher over the mean NDVI and VCI is moderate. In this study, the Kiremt temperature was found to significantly influence the vegetation condition in the study area more than rainfall. Muir et al. (2021) noted the larger effects of temperature on the NDVI, which is consistent with the present study, particularly during Belg and Meher. In contrast to this paper, a negative correlation was found between temperature and NDVI in Gojjam (Getahun & Shefine, 2015), in Nigeria (Igbawua et al., 2016), and in the Dhidhessa River Basin of Ethiopia (Wedajo et al., 2019). On the other hand, Zewdie et al. (2017) and Melku et al. (2020) associated the declining patterns of vegetation dynamics in northwestern Ethiopia and the Gojeb River catchment of the Omo-Gibe Basin, Ethiopia, respectively, with increasing pressure from human activities, apart from the effects of natural factors.
5 Conclusion
This research was conducted to analyze vegetation dynamics at spatiotemporal scales and its nexus with climate variables in the Borana rangelands of southern Ethiopia. Both the NDVI and VCI showed the Borana rangelands are dominated by sparse vegetation, especially shrubs and grasslands, during the entire study period. The vegetation condition (greenness or dryness) varies from one region to another across the study area, and it is highly influenced by climate variability and change. Climate variables are strongly associated with the NDVI and VCI, particularly during the growing seasons, namely, Belg and Meher. During the growing seasons, both rainfall and temperature are strongly associated with the NDVI and VCI (statistically significant), whereas during Bega and Kiremt, the correlation coefficient exhibited weak to moderate association (not significant). Therefore, the vegetation dynamics in the Borana rangelands are strongly influenced by climate variability. The findings of this study provide a clear picture of the influence of climate variability on the vegetation condition under an annual and seasonal timescale. Hence, the results are beneficial for the development of proper intervention policies and provide information relevant to sustainable rangeland management in the study area.
Data availability statement
The data analyzed in this study are subject to the following licenses/restrictions: The meteorology data used to support the findings of this study are available from the corresponding author upon request. Requests to access these datasets should be directed to adismite2011@gmail.com.
Author contributions
MW conceptualized the paper and was also involved in the literature review, data collection, analysis, and paper writing. GF and KB were involved in the literature review, data analysis, and paper writing. EG was involved in the literature review and paper writing. All authors read and approved the final manuscript for publication.
Acknowledgments
The authors thank the National Meteorological Agency (NMA) of Ethiopia for providing the data used in this study. We also thank the Ethiopian Civil Service University and Addis Ababa University for the educational support. We are grateful to the editor and the three reviewers for their constructive comments, which enhanced the quality of our manuscript.
Conflict of interest
Author EG was employed by Climpact Data Science.
The remaining authors declare that the research was conducted in the absence of any commercial or financial relationships that could be construed as a potential conflict of interest.
Publisher’s note
All claims expressed in this article are solely those of the authors and do not necessarily represent those of their affiliated organizations, or those of the publisher, the editors, and the reviewers. Any product that may be evaluated in this article, or claim that may be made by its manufacturer, is not guaranteed or endorsed by the publisher.
Abbreviations
AppEEARS, Application for Extracting and Exploring Analysis Ready Samples; DJF, December, January, and February; JJA, June, July, and August; LPDAAC, Land Processes Distributed Active Archive Center; MAM, March, April, and May; mm, millimeter; MODIS, moderate imaging spectroradiometer; NDVI, normalized difference vegetation index; NIR, near infrared; NMA, National Meteorological Agency; SON, September, October, and November; VCI, vegetation condition index; °C, degrees centigrade.
References
Broge, N. H., and Leblanc, E. (2001). Comparing prediction power and stability of broadband and hyperspectral vegetation indices for estimation of green leaf area index and canopy chlorophyll density. Remote Sens. Environ. 76, 156–172. doi:10.1016/s0034-4257(00)00197-8
Cheikh, M., Rasmus, F., Thomas, T. N., and Kjeld, R. (2014). Advances in monitoring vegetation and land use dynamics in the Sahel. Geografisk Tidsskrift-Danish J. Geogr. 114 (1), 84–91. doi:10.1080/00167223.2014.886515
Cheng, C. H., Nnadi, F., and Liou, Y. A. (2015). A regional land use drought index for Florida. Remote Sens. 7, 17149–17167. doi:10.3390/rs71215879
Coppock, D. L. (1993). “Vegetation and pastoral dynamics in the southern Ethiopian rangelands: Implications for theory and management,” in Range Ecology at Disequilibrium: New models of natural variability and pastoral adaptation in African savannas. Editors R. H. Behnke, I. Scoones, and C. Kerven (London, UK: Overseas Development Institute), 42–61.
Gemedo, D. (2004). Vegetation ecology, rangeland condition and forage resources evaluation in the Borana lowlands, southern Oromia, Ethiopia. PhD Thesis (Georg-August Universität Göttingen, Germany: Cuvillier Verlag Göttingen).
Debela, N., McNeil, D., Bridle, K., and Mohammed, C. (2019). Adaptation to climate change in the pastoral and agropastoral systems of Borana, south Ethiopia: Options and barriers. Am. J. Clim. Change 8, 40–60. doi:10.4236/ajcc.2019.81003
Didan, K. (2015). MOD13Q1 MODIS/Terra vegetation indices 16-day L3 global 250m SIN grid V006. NASA EOSDIS land process DAAC. https://lpdaac.usgs.gov/products/mod13q1v006/.
Dutta, D., Kundu, A., Patel, N., Saha, S., and Siddiqui, A. (2015). Assessment of agricultural drought in Rajasthan (India) using remote sensing derived vegetation condition index (VCI) and standardized precipitation index (SPI). Egypt. J. Remote Sens. Space Sci. 18, 53–63. doi:10.1016/j.ejrs.2015.03.006
Ethiopia’s Climate-Resilient Green Economy (CRGE) Strategy, (2011). Ethiopia’s climate-resilient green economy (CRGE) strategy. Addis Ababa, Ethiopia: Federal Democratic Republic of Ethiopia.
Fenetahun, Y., Yuan, Y., Xu, X.-W., and Wang, Y. D. (2022). Borana rangeland of southern Ethiopia: Estimating biomass production and carrying capacity using field and remote sensing data. Plant Divers. 44, 598–606. doi:10.1016/j.pld.2022.03.003
Gemedo, D., Maass, B. L., and Isselstein, J. (2006). Rangeland condition and trend in the semiarid Borana lowlands, southern Oromia, Ethiopia. Afr. J. Range Forage Sci. 23 (1), 49–58. doi:10.2989/10220110609485886
Getahun, Y. S., and Shefine, B. G. (2015). Analysis of climate variability (ENSO) and vegetation dynamics in Gojjam, Ethiopia. J. Earth Sci. Clim. Change 6, 320. doi:10.4172/2157-7617.1000320
Ghaleb, F., Mario, M., and Sandro, A. N. (2015). Regional Landsat-based drought monitoring from 1982 to 2014. Climate 3, 563–577. doi:10.3390/cli3030563
Gu, Y., Brown, J. F., Verdin, J. P., and Wardlow, B. (2007). A five-year analysis of MODIS NDVI and NDWI for grassland drought assessment over the central Great Plains of the United States. Geophys. Res. Lett. 34, L06407. doi:10.1029/2006gl029127
Gulacsi, A., and Kovacs, F. (2018). Drought monitoring of forest vegetation using MODIS-based normalized difference drought index in Hungary. Hung. Geogr. Bull. 67 (1), 29–42. doi:10.15201/hungeobull.67.1.3
Hao, L., Wang, S., Cui, X., and Zhai, Y. (2021). Spatiotemporal dynamics of vegetation net primary productivity and its response to climate change in inner Mongolia from 2002 to 2019. Sustainability 13, 13310. doi:10.3390/su132313310
Haugen, T. (1992). Woody vegetation of Borana, south Ethiopia. A study on the main vegetation types of the area. SINET Ethiop. J. Sci. 15 (2), 17–130.
He, Y., Yan, H., Ma, L., Zhang, L., Qiu, L., and Yang, S. (2020). Spatiotemporal dynamics of the vegetation in Ningxia, China using MODIS imagery. Front. Earth Sci. 14, 221–235. doi:10.1007/s11707-019-0767-7
Igbawua, T., Zhang, J., Chang, Q., and Yao, F. (2016). Vegetation dynamics in relation with climate over Nigeria from 1982 to 2011. Environ. Earth Sci. 75, 518. doi:10.1007/s12665-015-5106-z
IPCC, (2014). “Climate change 2014: Mitigation,” in Contribution of working group III to the fifth assessment report of the intergovernmental Panel on climate change (Cambridge, United Kingdom and New York, NY, USA: Cambridge University Press).
Jiang, H., Xu, X., Guan, M., Wang, L., Huang, Y., and Jiang, Y. (2019). Determining the contributions of climate change and human activities to vegetation dynamics in ago-pastural transitional zone of northern China from 2000 to 2015. Sci. Total Environ. 718. doi:10.1016/j.scitotenv.2019.134871
Kalisa, W., Igbawua, T., Henchiri, M., Ali, S., Zhang, S., Bai, Y., et al. (2019). Assessment of climate impact on vegetation dynamics over East Africa from 1982 to 2015. Sci. Rep. 9, 16865. doi:10.1038/s41598-019-53150-0
Kogan, F., Gitelson, A., Zakarin, E., Spivak, L., and Lebed, L. (2003). AVHRR-based spectral vegetation Index for quantitative assessment of vegetation state and productivity. Photogramm. Eng. Remote Sens. 69, 899–906. doi:10.14358/PERS.69.8.899
Kogan, F. N. (1995a). Application of vegetation index and brightness temperature for drought detection. Adv. Space Res. 15, 91–100. doi:10.1016/0273-1177(95)00079-T
Kogan, F. N. (1995b). Droughts of the late 1980s in the United States as derived from NOAA polar-orbiting satellite data. Bull. Am. Meteorological Soc. 76, 655–668. doi:10.1175/1520-0477(1995)076<0655:dotlit>2.0.co;2
Kogan, F. N. (1990). Remote sensing of weather impacts on vegetation in non-homogeneous areas. Int. J. Remote Sens. 11 (8), 1405–1419. doi:10.1080/01431169008955102
Kogan, F., Stark, R., Gitelson, A., Jargalsaikhan, L., Dugrajav, C., and Tsooj, S. (2004). Derivation of pasture biomass in Mongolia from AVHRR-based vegetation health indices. Int. J. Remote Sens. 25, 2889–2896. doi:10.1080/01431160410001697619
Korecha, K., and Barnston, A. G. (2007). Predictability of June–September rainfall in Ethiopia. J. Am. Meteorological Soc. 135, 628–650. doi:10.1175/mwr3304.1
Kourouma, J. M., Eza, E., Negash, E., Phiri, D., Vinya, R., Girma, A., et al. (2021). Assessing the spatiotemporal variability of NDVI and VCI as indices of crops productivity in Ethiopia: A remote sensing approach. Geomatics, Nat. Hazards Risk 12 (1), 2880–2903. doi:10.1080/19475705.2021.1976849
Liou, Y., and Mulualem, G. M. (2019). Spatiotemporal assessment of drought in Ethiopia and the impact of recent intense droughts. Remote Sens. 11, 1828. doi:10.3390/rs11151828
Liu, Q., Zhang, S., Zhang, H., Bai, Y., and Zhang, J. (2020). Monitoring drought using composite drought indices based on remote sensing. Sci. Total Environ. 711, 134585. doi:10.1016/j.scitotenv.2019.134585
Measho, S., Chen, B., Trisurat, Y., Pellikka, P., Guo, L., Arunyawat, S., et al. (2019). Spatiotemporal analysis of vegetation dynamics as a response to climate variability and drought patterns in the semiarid region. Eritrea. Remote Sens. 11, 724. doi:10.3390/rs11060724
Melkamu, M. A. (2019). Analysis of spatiotemporal land surface temperature and normalized difference vegetation index changes in the Andassa watershed, Blue Nile Basin, Ethiopia. J. Resour. Ecol. 10 (1), 77–85. doi:10.5814/j.issn.1674-764x.2019.01.010
Melku, D., Asfaw, K., Awdenegest, M., and Adane, A. (2020). Effects of climate variability on normalized difference vegetation index (NDVI) in the Gojeb River catchment, Omo-Gibe Basin, Ethiopia. Adv. Meteorology 2020, 1–16. doi:10.1155/2020/8263246
Muir, C., Southworth, J., Khatami, R., Herrero, H., and Akyapi, B. (2021). Vegetation dynamics and climatological drivers in Ethiopia at the turn of the century. Remote Sens. 13, 3267. doi:10.3390/rs13163267
Mushore, T. D., Dube, T., Manjowe, M., Gumindoga, W., Chemura, A., Rousta, I., et al. (2019). Remotely sensed retrieval of Local Climate Zones and their linkages to land surface temperature in Harare metropolitan city, Zimbabwe. Urban Clim. 27, 259–271. doi:10.1016/j.uclim.2018.12.006
Pratt, D. J., and Gwynne, M. (1977). Rangeland management and ecology in east Africa. London, UK: Hodder and Stoughton.
Riche, B., Hachileka, E., Awuor, C. B., and Hammill, A. (2009). Climate-related vulnerability and adaptive capacity in Ethiopia’s Borana and Somali communities. Canada: International Institute for Sustainable Development.
Rousta, I., Olafsson, H., Moniruzzaman, M., Ardo, J., Zhang, H., Mushore, T. D., et al. (2020). The 2000-2017 drought risk assessment of the western and southwestern basins in Iran. Model. Earth Syst. Environ. 6, 1201–1221. doi:10.1007/s40808-020-00751-8
Swain, S., Wardlow, B. D., Narumalani, S., Tadesse, T., and Callahan, K. (2011). Assessment of vegetation response to drought in Nebraska using terra-MODIS land surface temperature and normalized difference vegetation index. GIS Remote Sens. 48 (3), 432–455. doi:10.2747/1548-1603.48.3.432
Tadesse, M., Mekuanent, T., Yohannis, G., and Amsalu, A. (2020). Long-term dynamics of woodland vegetation with response of climate variability in the lowlands of north western part of Ethiopia. Environ. Dev. Sustain. 23, 123–132. doi:10.1007/s10668-019-00569-0
Tsai, H. P., and Yang, M. D. (2016). Relating vegetation dynamics to climate variables in Taiwan using 1982–2012 NDVI3g data. IEEE J. Sel. Top. Appl. Earth Observations Remote Sens. 9 (4), 1624–1639. doi:10.1109/JSTARS.2015.2511742
Wang, J., Price, K. P., and Rich, P. M. (2001). Spatial patterns of NDVI in response to precipitation and temperature in the central Great Plains. Int. J. Remote Sens. 22, 3827–3844. doi:10.1080/01431160010007033
Wedajo, G. K., Muleta, M. K., Gessesse, B., and Koriche, S. A. (2019). Spatiotemporal climate and vegetation greenness changes and their nexus for Dhidhessa River Basin, Ethiopia. Environ. Syst. Res. 8, 31. doi:10.1186/s40068-019-0159-8
Wei, W., Zhang, J., Zhou, L., Xie, B., Zhou, J., and Li, C. (2021). Comparative evaluation of drought indices for monitoring drought based on remote sensing data. Environ. Sci. Pollut. Res. 28, 20408–20425. doi:10.1007/s11356-020-12120-0
Worku, M. A. (2020). Climate change mitigation in agriculture and forestry sectors in Ethiopia. A Rev. Agric. For. J. 4 (1), 11–18. doi:10.5281/zenodo.3837623
Worku, M. A., Feyisa, G. L., and Beketie, K. T. (2022). Climate trend analysis for a semi-arid Borana zone in southern Ethiopia during 1981-2018. Environ. Syst. Res. 11, 2. doi:10.1186/s40068-022-00247-7
Wu, D., Qu, J. J., and Hao, X. (2015). Agricultural drought monitoring using MODIS-based drought indices over the USA Corn Belt. Int. J. Remote Sens. 36 (21), 5403–5425. doi:10.1080/01431161.2015.1093190
Yang, Z., Di, L., Yu, G., and Chen, Z. (2011). Vegetation condition indices for crop vegetation condition monitoring. Conf. Pap. doi:10.1109/IGARSS.2011.6049984
Zewdie, W., Csaplovics, E., and Inostroza, L. (2017). Monitoring ecosystem dynamics in northwestern Ethiopia using NDVI and climate variables to assess long term trends in dryland vegetation variability. Appl. Geogr. 79, 167–178. doi:10.1016/j.apgeog.2016.12.019
Keywords: MODIS, NDVI, VCI, NASA USGS, rainfall, temperature, Borana rangelands
Citation: Worku MA, Feyisa GL, Beketie KT and Garbolino E (2023) Spatiotemporal dynamics of vegetation in response to climate variability in the Borana rangelands of southern Ethiopia. Front. Earth Sci. 11:991176. doi: 10.3389/feart.2023.991176
Received: 11 July 2022; Accepted: 05 January 2023;
Published: 17 January 2023.
Edited by:
Clara Rodriguez Morata, Columbia University, United StatesReviewed by:
Brilliant Mareme Petja, Water Research Commission, South AfricaLifu Zhang, Aerospace Information Research Institute (CAS), China
Copyright © 2023 Worku, Feyisa, Beketie and Garbolino. This is an open-access article distributed under the terms of the Creative Commons Attribution License (CC BY). The use, distribution or reproduction in other forums is permitted, provided the original author(s) and the copyright owner(s) are credited and that the original publication in this journal is cited, in accordance with accepted academic practice. No use, distribution or reproduction is permitted which does not comply with these terms.
*Correspondence: Mitiku Adisu Worku, adismite2011@gmail.com