Use of ablation-season albedo as an indicator of annual mass balance of four glaciers in the Tien Shan
 Xiaoying Yue
 Zhongqin Li1
  Feiteng Wang
 Huilin Li
- 1State Key Laboratory of Cryospheric Science, Northwest Institute of Eco-Environment and Resources, Chinese Academy of Sciences, Lanzhou, Gansu, China
- 2National Cryosphere Desert Data Center, Northwest Institute of Eco-Environment and Resources, Chinese Academy of Sciences, Lanzhou, Gansu, China
Glacier mass balance and its sensitivity to climate change depend to a large degree on the albedo and albedo feedback. Although recent increasing studies reconstruct the annual surface mass balance (SMB) based on the relationships between satellite-derived minimum albedo and annual glaciological mass balance (so-called albedo method), a relationship remains conjectural for Tien Shan glaciers. Accumulation and ablation occur simultaneously in summer, causing different surface processes. We examine this relationship using glaciological mass-balance data and the equilibrium-line altitude (ELA) made on the eastern branch of Urumqi Glacier No. 1 (UG1-E), Tuyuksu, Golubin and Glacier No. 354, and ablation-season (May–September) albedo retrieved from Moderate Resolution Imaging Spectroradiometer (MODIS) images from 2000 to 2021. Compared with minimum ablation-season albedo, we find higher coefficients of determination between mean ablation-season albedo and glaciological mass balance at UG1-E and Tuyuksu. In contrast, for Golubin and Glacier No. 354, glaciological mass balance is higher correlated to minimum ablation-season albedo than mean ablation-season albedo. This difference is related to the glaciological mass-balance time period. The relationship between albedo and glaciological mass balance is obtained over a shorter time for Golubin (8 years) and Glacier No. 354 (9 years) than for UG1-E (20 years) and Tuyuksu (20 years). Non-etheless, based on the correlativity between MODIS-derived mean ablation-season albedo and minimum ablation-season albedo and glaciological mass balance of Golubin and Glacier No. 354 over the 2011–2019 period, the annual SMB for these glaciers can be reconstructed using the albedo method over the period 2000–2010. Comparison with previously reconstructed results indicated that the mass balance derived from albedo is robust for Glacier No. 354, while for Golubin, the results derived from the albedo method only captured the relative changes in mass balance. The current study suggested that ablation-season albedo can be regarded as a proxy for annual mass balance, and mean ablation-season albedo may be more reliable than minimum ablation-season albedo for some Tien Shan glaciers.
1 Introduction
Tien Shan is characterized by an arid and semi-arid continental climate (Sorg et al., 2012; Pohl et al., 2017). Glaciers play an irreplaceable buffer role in streamflow regimes and substantially supply freshwater to the intensely populated and vulnerably ecological downstream areas (Pritchard, 2019). As in most other parts of the world, glaciers in Tien Shan are losing mass over the past decades, and an accelerating tendency is most pronounced since the 1970s (Sorg et al., 2012; Farinotti et al., 2015). Long-term continuous mass-balance data improve our understanding of the glacial melting process (Pu et al., 2008; Zemp et al., 2009; Carturan et al., 2016), provide critical insights into climate change both at global and regional scales (Bhattacharya et al., 2021), and are useful for the high-efficiency utilization of water resources.
Annual change in glacier mass was measured by the well-established but labor-intensive glaciological method. However, glaciological field data remain sparse in Tien Shan, and the data was interrupted from the mid-1990s to around 2010, such as at Golubin glacier, Abramov glacier, and Batysh glacier (Hoelzle et al., 2017). Only two of the long-term mass balance measurements have been continued on Tuyuksu Glacier, Kazakhstan and Urumqi Glacier No. 1, China. Recent developments in the capabilities of satellite and airborne sensors, as well as improved processing techniques, have complemented glaciological measurements to reconstruct the mass balance for the interrupted glaciers and to generate insights into region-wide mass changes.
Several glacier surface properties derived from remote sensing imagery have been used as proxies for mass balance, such as surface elevation (Hugonnet et al., 2021), and end-of-summer snow line elevation from high spatial resolution optical images (Rabatel et al., 2016). Although the difference between two or more surface elevations acquired at different dates, provides estimates of height and volume change over large regions, this method cannot be confidently used to capture the interannual or even seasonal signals of glacier mass balance. For the reconstruction of interannual or even seasonal mass balance, the end-of-summer snow line elevation showed robust and reliable performance (Barandun et al., 2021) but needs to be automated to compute glacier SMB at regional scales.
Net shortwave radiation contributes predominantly energy for the melting process of glaciers, in turn, which is modulated by surface albedo (Hock and Holmgren, 2005; Gurgiser et al., 2013; Schaefer et al., 2020). Therefore, albedo is one of the key driving factors governing the surface mass balance conditions of mountain glaciers. Variations in surface albedo cause strong, positive feedback that can amplify or dampen glacier melt in response to a change in climate (Box et al., 2012; Johnson and Rupper, 2020). Moreover, ablation-season albedo minima provide insight into the accumulation–area ratio (AAR) and the equilibrium-line altitude (ELA), which can often be used as a predictor of SMB both qualitatively and quantitatively. Thus, the good relationship between minimum glacier-wide albedo and annual mass balance (called albedo method) was used to reconstruct the mass balance record among MODIS observations, which has been widely applied and validated on some glaciers in different regions. Dumont et al. (2012) concluded that a strong linear correlation exists between MODIS-derived minimum albedo and glacier mass balance on Saint-Sorlin glacier, which could be used to retrieve inter-annual variations of glacier mass balance; Sirguey et al. (2016) confirmed that minimum glacier-wide albedo was a reliable predictor for annual mass variability in the Southern Alps of New Zealand and reconstructed both winter and summer balance records of Brewster Glacier. Based on a methodological framework proposed by Sirguey et al. (2016), the albedo-based method was exploited to quantify the annual and summer mass balance on 30 glaciers in the French Alps (Davaze et al., 2018). In addition, Brun et al. (2015) assessed the albedo method to reconstruct the glacier mass balance for summer accumulation-type and winter accumulation-type glaciers in the Himalayas from MODIS albedo data and discussed the prospects of using spatial extrapolation of the established regression models for unmonitored neighboring glaciers that have similar climatological conditions to the studied glaciers. Zhang et al. (2018) assessed the applicability of the albedo-based method to continental glaciers in the interior Tibetan Plateau and reconstructed the annual mass balance for three glaciated regions, Xiao Dongkemadi glacier, Purogangri ice cap and Geladandong mountain region glaciers, derived from the MODIS albedo.
The relationship between minimum glacier-wide albedo and annual mass balance is still highly conjectural for summer accumulation-type glaciers, where most of the accumulation and ablation occur simultaneously during the summer. In Tien Shan, frequent summer snowfall events increase the accumulation of glacier, Meanwhile, summer snowfall events lead to a temporary snow coverage of the glacier, this can “feed” the integrated albedo and physically reduces glacier melting. During the period of no snowfall in summer, the melt-albedo feedback process accelerates the glacier melting. It is unknown, however, whether the annual glacier-wide albedo minima reflect these processes, or to what extent. Moreover, glaciers in the Tien Shan are retreating at an unprecedented rate (Sorg et al., 2012; Farinotti et al., 2015). In the scenario of extremely negative mass balance, ELA exceeds the summit of the glacier, AAR decreases to zero, and the glacier surface is identical to the ablation zone—such as on Urumqi Glacier No. 1 in 2010 and the Sary-Tor glacier for the period 2015–2017. In this scenario, minimum glacier-wide albedo does not indicate ELA and AAR, thus, the relationship between minimum glacier-wide albedo and mass balance is questionable.
These reasons justify further investigation into the suitability of the albedo method for the Tien Shan context to extend the mass balance record of the interrupted glacier beyond glaciological observations, as well as assess whether monitoring albedo on Tien Shan glaciers can provide insights about glacier fluctuations. Therefore, the principal aim of this study is to test the validity of the relationships between glacier SMB and albedo relationship for Tien Shan glaciers. We wanted to identify the most appropriate proxy of annual mass balance on glaciers in Tien Shan. To this end, the variations in summer glacier-wide averaged albedo for four benchmark glaciers over the period of 2000–2021 were first investigated (Figure 1A), including Urumqi Glacier No. 1, Tuyuksu Glacier, Golubin Glacier and Glacier No. 354 (WGMS, 2021). Subsequently, the relationships between mean ablation-season albedo, minimum albedo and annual SMB, equilibrium-line altitude (ELA) was analyzed. Finally, based on the albedo records from MODIS, the annual SMB for Golubin and Glacier No. 354 were reconstructed over the 2000–2010 period using the albedo method, which allows for cross-comparison and validation with the results by Barandun et al. (2018) and Kronenberg et al. (2016) to provide robust conclusions to be drawn about the mass change and its temporal dynamics since 2000.
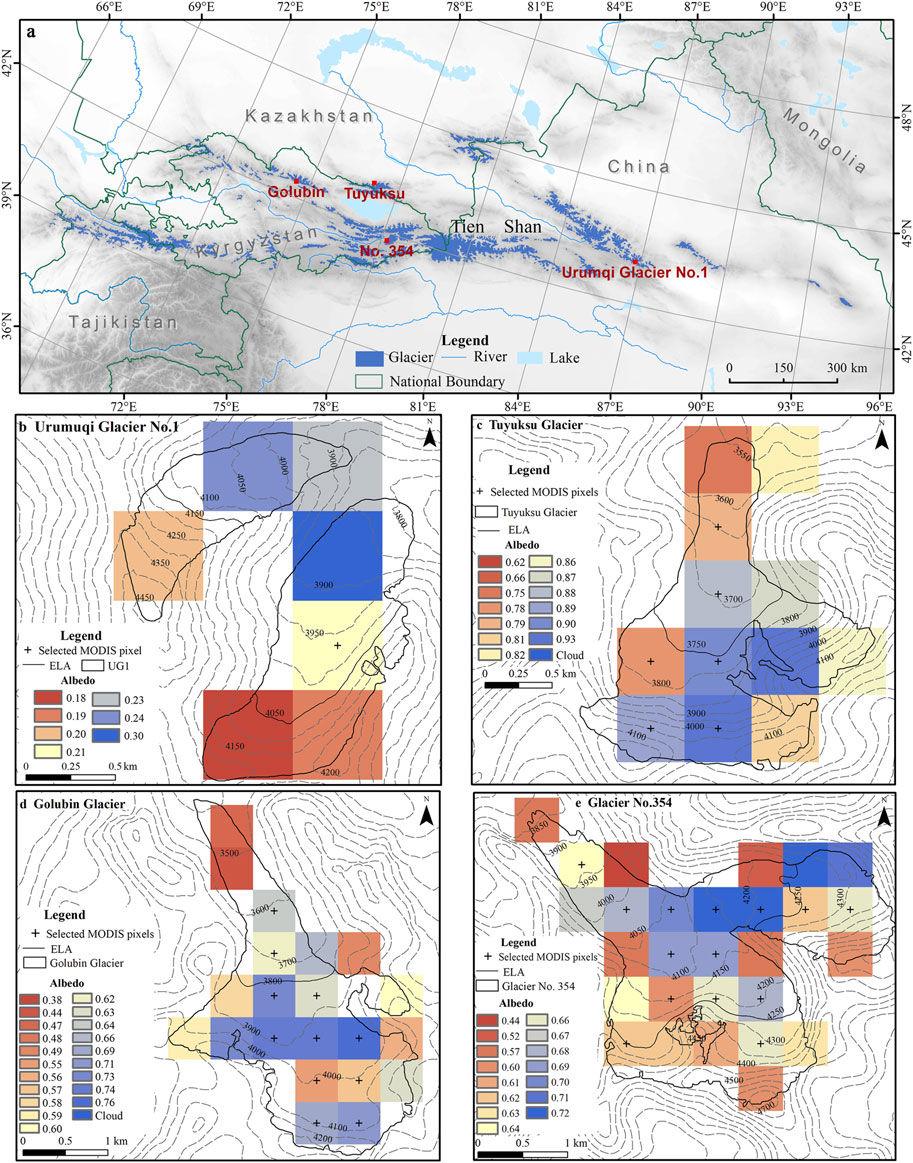
FIGURE 1. Situation (A) and map of UG1-E (B), Tuyuksu (C), Golubin (D) and Glacier No. 354 (E) in the Tien Shan. The contours of four study glaciers were extracted from ASTER GDEM V2 (downloaded from http://earthexplorer.usgs.gov/). The cross represented the selected MODIS pixels for individual study glaciers.
2 Study sites and data
2.1 Study sites
2.1.1 Urumqi Glacier No. 1
Urumqi Glacier No. 1 (43°06′N, 86°49′E) is a northeastward valley-type glacier located in the eastern Tien Shan in China. The glacier separated into two branch glaciers in 1993, which are now referred to as the east and west branches of Urumqi Glacier No. 1, with an area of ∼0.98 km2 for the east branch and ∼0.56 km2 for the west branch in 2019 (Figure 1B). The eastern branch glacier spans an altitudinal range from ∼4,225 m to ∼3,752 m a.s.l., and the altitudinal range for the west branch glacier is between ∼4,445 m and ∼3,848 m a.s.l. The glacier surface is almost free of debris. Mean values of annual air temperature and precipitation at the nearby station at Daxigou (3,539 m a.s.l.) are −5.0°C and 460 mm (Yue et al., 2017), with about 88% of precipitation occurring in the forms of wet snow, hail, and graupel concentrated in May through September (Yang et al., 1992). Mean air temperature and precipitation at ELA (4,100 m a.s.l.) of Urumqi Glacier No. 1 was evaluated as approximately −10.1°C (with lapse rate as −0.65°C 100 m-1) and ∼690 mm (with vertical gradient as 22 mm 100 m-1 in the non-glaciated area and 10% 100 m-1 on the glacier surface), respectively (WGMS, 2021).
Mass-balance measurements were performed between 1958 and 1966 and resumed in 1978. Over the past 60 years, the continuous mass loss with an average of 336 mm w.e., yr-1 was accompanied by an accelerating trend, and the equilibrium-line altitude for a zero mass balance (ELA0) was located at about 4,005 m a.s.l. Since 2000, observation data indicates the ELA fluctuated between 4,050 m and 4,250 m. Based on the meteorological data from an automatic weather station in the upper ablation zone of the glacier, the internal accumulation of +0.007 m w.e., yr-1 was calculated during the ablation season by Wang et al. (2020) using an energy and mass balance model.
It must be noted that all the MODIS pixels extend beyond the western branch of Urumqi Glacier No. 1, as shown in Figure 1B. To avoid the biases induced by mixed pixels, only the eastern branch of Urumqi Glacier No. 1 (UG1-E) was considered in the current study, where there is one pure pixel within the glacier outline. Considering the consistency, the glaciological mass balance and ELA reported by the WGMS database were only for UG1-E from 2000 to 2020.
2.1.2 Tuyuksu Glacier
Tuyuksu glacier (43.05°N, 77.08°E) is situated in the northern Tien Shan in Kazakhstan. It is also classified as a valley-type glacier. The glacier flows northward from the highest altitude of ∼4,219 m a.s.l to the lowest point of ∼3,478 m a.s.l, with a debris-free surface area of about 2.24 km2 in 2019 (Figure 1C). The glacier is a cold to polythermal glacier (WGMS, 2021). The Tuyuksu meteorological station recorded the average annual air temperature of −7.4°C at the ELA and the annual sum of precipitation of 863 mm, 34% of this amount was passed on as precipitation during the summer period (WGMS, 2021).
Intense mass-balance observation has been carried out since 1956 using the glaciological method, which provides a valuable, continuous, and high-quality mass-balance data set. More than 60 years of observations have indicated a sustained mass wastage of −406 mm w.e., yr-1, and ELA0 was estimated to be close to 3,572 m a.s.l.
2.1.3 Golubin Glacier
Golubin Glacier (42°26.94′N, 74°30.10′E) is situated in Kyrgyzstan, close to the Western Tien Shan. The valley-type glacier has a northern aspect in the accumulation area and a northwestern aspect in the ablation area, covering an area of ∼5.13 km2 in 2021 and extending from an altitude of ∼3,300–∼4,400 m a.s.l., (Figure 1D). The mean annual air temperature of about 1.5°C at 3,450 m a.s.l., is calculated, based on records from the Baitik station, with a lapse rate of 0.72°C per 100 m (Aizen et al., 1995). Precipitation is not evenly distributed throughout the year, with about half of precipitation of 700 mm yr-1 occurring from April to June (Aizen et al., 2006).
Glaciological measurements began in 1958 and continued until 1994, and after 15-year interruptions, the monitoring was re-initiated in 2010 (Hoelzle et al., 2017). The field measurements indicated a mass change of about −285 mm w.e., yr-1 for the first period (1970–1994), and of about −306 mm w.e., yr-1 for the second period (2010–2019). Over the period of 2010/11–2018/19, the ELA varied from 3,700 m to 4,245 m a.s.l., Aizen et al. (1997) reported an internal accumulation of about +0.08 m w.e., yr-1 due to the refreezing of meltwater.
2.1.4 Glacier No. 354
Glacier No. 354 (41°47.62′N, 78°9.69′E) is located in the central Tien Shan in Kyrgyzstan. The polythermal glacier has a surface area of 6.39 km2 in 2018, spanning an altitudinal range of ∼3,750 m–∼4,680 m a.s.l., and exposes to the northwest with three accumulation basins (Figure 1E). The mean annual air temperature of −6.0°C was measured by the Tien Shan Kumtor weather station in 1997–2014, and the recorded annual sum of precipitation is only 360 mm (Kutuzov and Shahgedanova, 2009), 75% of which are, on average, deposited during summer (May–September) (Kronenberg et al., 2016). The Tien Shan Kumtor weather station situates at a distance of around 14 km from the glacier.
The glacier-wide mass balance has been measured by the glaciological method since 2010 (Kronenberg et al., 2016), thus deriving a mean glacier-wide mass balance of about −523 mm w.e., yr-1, and the ELA lies between 4,155 m and 4,345 m a.s.l., Kronenberg et al. (2016) estimated internal accumulation to be +0.04 m w.e., yr−1.
2.2 Field data
2.2.1 Glaciological mass balance
Annual surface mass balance data, measured with the glaciological method, were used to investigate the relationship between albedo and mass budget. The glacier-wide annual SMB values have been published by the World Glacier Monitoring Service (WGMS) for UG1-E and Tuyuksu over the period 1999/2000–2018/19 and for Golubin and Glacier No. 354 over the periods 2010/11–2018/19. These are freely available on the WGMS website (http://wgms.ch/data_databaseversions/). In addition, the glacier-wide annual SMB for Golubin and Glacier No. 354 over the periods 2010/11–2015/16 was also calculated by Barandun et al. (2018), using a model-based spatial extrapolation of glaciological point measurements to the entire glacier surface. Similarly, the record of direct glaciological observations was reanalyzed by Hoelzle et al. (2017) using a distributed mass balance model, yielding a consolidated and homogenized time series of direct mass balance observations. For Golubin and Glacier No. 354, although the calculations above utilized the same glaciological point observations, a significant deviation in mass balance values was found in the same year, due to the differences in extrapolation methods and the duration of the mass-balance year.
2.2.2 Field reflectance spectral measurements
To estimate the accuracy of MODIS-derived albedo, the field spectral reflectance measurements were carried out in the summer of 2015–2020 with an Analytical Spectral Devices (ASD) field spectrometer (HandHeld) on UG1-E (Table 1). The ASD collects electromagnetic radiation at 325 nm–1,075 nm with a spectral sampling interval of 1 nm and a spectral resolution (full width at half maximum) of < 3 nm at the band centered at 700 nm. The hemispherical conical reflectance factor was calculated by normalizing the reflected radiance with the incident radiance measured from a calibrated Spectralon© panel. Each spectrum was the average value resulting from 15 scans, all corrected for the instrument dark current.
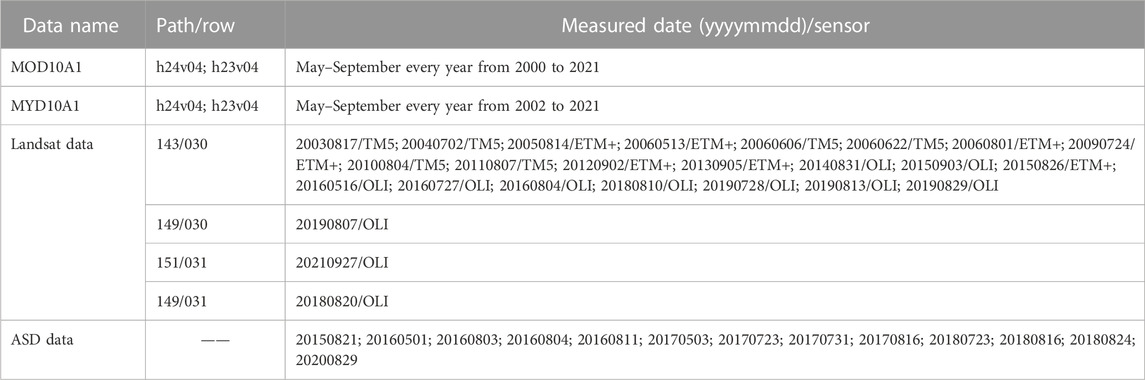
TABLE 1. Overview of data of surface albedo monitoring for the four studied Tien Shan glaciers.
Nadir spectrum was collected at a distance of 80 cm from the glacier surface by a bare fiber-optic cable with a field of view of 25°C, corresponding to a circular footprint with a radius of approximately 17.5 cm for flat ground. The ASD was handheld and not installed on a stand to minimize shading. The field spectral measurements were carried out between 11:00 and 14:00 (local time) under clear-sky conditions to minimize the uncertainty related to variations in the radiation environment (e.g., changes in the direct and diffuse ratio) during the field measurements. The measurement was repeated three times at each site. Before every spectral measurement, the instrument was calibrated using the surface of a white reference panel that is nearly 100% reflective and diffusive.
For each field measurement, the spectral sampling sites contained 27 fixed sites and several roving sites, which were spread throughout the ablation area (Figure 2A). The fixed sites were marked with aluminum alloy stakes which are drilled into the ice with a Heucke steam drill. These fixed sites also constitute the observation network of the mass balance of UG1-E. Several roving sites were selected by visual inspection to capture the significant variability of the properties of the glacier surface between two fixed sites. Figure 2A shows examples of reflectance spectral sampling sites collected by the ASD, take 16 August 2017, for example. The coordinates of the spectra measured points were recorded by a standard handheld GPS (Trimble Juno 5B/5D). The horizontal accuracy of the GPS coordinates is better than 4 m as per the internal accuracy assessment of the GPS device.
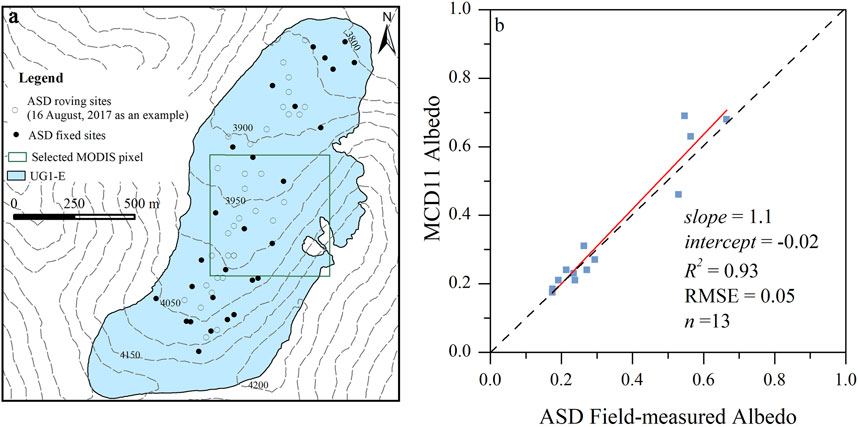
FIGURE 2. The location of reflectance spectral sampling sites collected by the ASD on UG1-E, take 16 August 2017, for example (A). The dark dots indicated the fixed sites, and the circles show the roving sites. The green box represents the selected MODIS pixel used to validate the MCD11 albedo value. (B) Each point represents each ASD-observed date in Table 1. The dashed line is the 1:1 ratio.
According to the method of Ming et al. (2013) and Li et al. (2019), broadband shortwave albedo values measured by ASD were calculated using a standard terrestrial solar spectral irradiance distribution [ASTM G173-03(2020)], which was provided by the American Society for Testing and Materials. ASTM G173-03(2020) data was generated via the Simple Model of the Atmospheric Radiative Transfer of sunshine (SMARTS) atmospheric transmission code (https://www.astm.org/g0173-03r20.html). We only calculated the broadband albedo in the spectral ranges of 350–1,050 nm. The associated expression is as follows:
where αnarrow(λ) and i(λ) denoted the measured narrowband albedo and incoming solar irradiance reference at wavelength λ, respectively. Due to we only collected the nadir reflectance spectrum, the BRDF correction is not carried out. Naegeli et al. (2017) reported that the correction generally resulted in an underestimate of mean glacier-wide albedo about 0.02.
2.3 Remote sensing data
2.3.1 MODIS snow products
MODIS instrument, aboard the Terra (2000 to present) and Aqua (2002 to present) satellites, is performing near-daily observations for the Earth’s surface with 36 spectral bands ranging from 0.459 µm to 14.385 µm, and spatial resolution ranging from 0.25 km to 1 km depending on the spectral band. Daily blue-sky snow albedo data (0.25 µm–5.0 µm) with 500 m spatial resolution, provided by MOD10A1 and MYD10A1 products (Liang et al., 1999; Klein and Stroeve, 2002; Hall and Riggs, 2021a; Hall and Riggs, 2021b), are used to investigate the variation in surface albedo over the four Tien Shan glaciers in ablation season (May–September), which were processed and delivered by the National Snow and Ice Data Center. Moreover, daily snow cover, fractional snow cover, and snow spatial quality assessment at 500 m resolution can also be included in MOD10A1 and MYD10A1 products. MOD10A1 and MYD10A1 albedo values are calculated using the first seven visible and near-infrared bands of the MODIS. The retrieval process includes atmospheric correction, anisotropic correction for ice and snow, and narrow-to-broadband conversion (Klein and Stroeve, 2002; Hall and Riggs, 2021a; Hall and Riggs, 2021b).
Considering the influence of solar zenith angles on MODIS-derived albedo of mountain glaciers, the albedo products were filtered, and only those calculated from images acquired with a solar zenith angle lower than 75°C were retained, as recommended by Wang et al. (2012). The MOD35 cloud mask products were applied to MOD10A1 and MYD10A1 albedo values (Ackerman and Frey, 2015), and the value of the cloud-covered pixels within the areas that were classified as snow cover were assigned to 150 and 151 in MOD10A1 and MYD10A1 albedo products, respectively (Hall and Riggs, 2021a; Hall and Riggs, 2021b). Therefore, cloud-covered pixels are easily identified and removed in subsequent calculations. In the current study, the ablation season is defied from 1 May to 30 September. Thus, we selected MOD10A1 and MYD10A1 products of h24v04 and h23v04 paths/rows over the period from May to September of 2000/2002–2021, eventually 50 to 97 images per year (Figure 5; Table 1).
2.3.2 Landsat satellite imagery
Landsat imagery was used for determining the outline of four studied glaciers and deriving surface albedo for UG1-E to extend the only pure pixel MODIS albedo to its entire eastern branch glacier. Aimed to obtain the glacier outlines, cloudy-free and near-snow-free images acquired at the end of the ablation period were preferentially chosen. To derive surface albedo, the images were selected based on two criteria: 1) cloud-free images were selected during each ablation period (from May to September) of 2000–2021; 2) there was valid MODIS albedo on the day of Landsat imagery acquisition for UG1-E. Table 1 summarized all Landsat imagery selected in this study.
The following procedure was used to retrieve surface albedo from Landsat imagery, including geolocation, radiometric calibration, atmospheric correction, topographic correction, anisotropic correction, and narrow-to-broadband conversion. The Landsat-derived broadband albedo used in the current study were all from the albedo data previously reported by Yue et al. (2017, 2020, 2021) for Urumqi Glacier No. 1, and for an exhaustive description of this retrieval process, see Supplementary Material. Compared with the field synchronously measured broadband albedo, the accuracy of the Landsat-derived broadband albedo is < 5% (Yue et al., 2021).
3 Methods
3.1 Glacier outlines
Combined with the Randolph Glacier Inventory (RGI 6.0) outlines for Central Asia (region 13), we updated the outline for four studied glaciers with cloudy-free and near-snow-free Landsat OLI images. The Landsat OLI images were captured on 13 August 2019 for Urumqi Glacier No. 1, on 7 August 2019 for Tuyuksu, on 27 September 2021 for Golubin and on 20 August 2018 for Glacier No. 354, respectively. To aid in the identification of the glacier boundary, the lower-resolution (30 m) band 2, band 3 and band 4 of Landsat OLI were firstly fused with its higher-resolution (15 m) band 8 (panchromatic band), respectively. Then, glacier extents were mapped manually based on the true color composite image of the fused bands 2 to 4. Considering errors related to glacier outlines digitized manually on optical remote sensing images, the uncertainties of ±5% of the total glacier area are expected for medium-resolution images such as Landsat TM (Paul et al., 2013). It should be noted that the glacier outlines were constant for all subsequent analyses of this research.
3.2 Glacier surface albedo
3.2.1 MODIS data processing
Daily snow cover data products (MOD10A1 V006 and MYD10A1 V006) were firstly preprocessed using the MODIS Reprojection Tool, which is a recommended software supporting higher-level MODIS land products. Data preprocessing included map reprojection, format conversion, and spatial sub-setting. The reprojection of MODIS products from the sinusoidal projection into the Universal Transverse Mercator (UTM) projection with the datum of WGS84 was carried out. Additionally, the data format of HDF was converted to Geotiff, and the spatial resolution was still 500 m.
Then, surface albedo values for the individual glaciers were extracted by the updated glacier outline. To detect the variation of the glacier-wide mean albedo, only the data of pixels entirely within the glacier boundary were chosen, and potential mixed pixels were discarded to reduce biases (Figures 1B–E). Consequently, 6 pixels for Tuyuksu were chosen for computing the mean glacier albedo. The corresponding number of pixels for Golubin and Glacier No. 354 was 11 and 14, respectively, while there was only one pure pixel inside the Urumqi Glacier No. 1 outline. In addition, it also occurs that only some of the pure pixels were covered by cloud. In this case, images with valid pixels covering over 50% of the total glacier area were retained.
Finally, to capture as many of the glacier surface albedo signals as possible, and improve the efficiency of data utilization, data merging was applied to the daily surface albedo data provided by MOD10A1 and MYD10A1. Here, the merged MODIS-derived albedo was called MCD11 albedo. Data merging was performed by the following rules: 1) for pixels identified as snow or ice either in MOD10A1 or in MYD10A1, their corresponding values were retained in the MCD11 albedo; 2) for pixels identified as snow or ice both in MOD10A1 and MYD10A1, their average value was considered in the MCD11 albedo; 3) otherwise, the pixels were assigned to null and neglected in subsequent processing steps. Thus, MCD11 is referring to combined dataset based on MOD10A1 and MYD10A1 products, and is not a publicly available dataset.
3.2.2 The spatial extrapolation of MODIS albedo on UG1-E
Because there is only one pure MODIS pixel within the outline of UG1-E, the ability to capture the signals of glacier-wide albedo for UG1-E is severely limited. Combined with the previous albedo studies for Urumqi Glacier No. 1 by Yue et al. (2017, 2020, 2021), an excellent agreement between the pure pixel albedo retrieved from MCD11 data and synchronously mean Landsat-derived albedo over the entire UG1-E was found (r2 = 0.81) (Figure 3), and the latter is on average 0.1 higher than the former. Therefore, the pure pixel MCD11 albedo was extrapolated to the entire UG1-E, utilizing the relationship between MCD11 albedo and Landsat-derived albedo averaged over UG1-E (Figure 3).
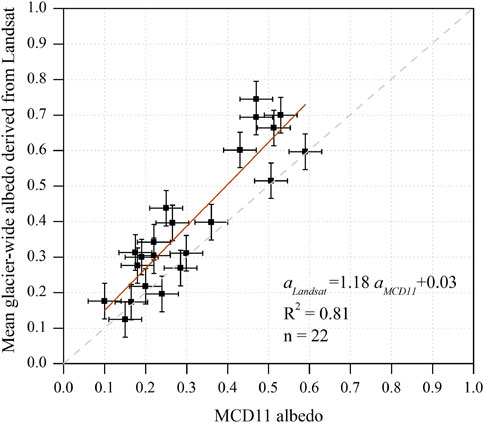
FIGURE 3. Relationship between MCD11 albedo for the selected MODIS pixel and mean glacier-wide albedo derived from Landsat imagery for UH1-E. Each point represents each Landsat datapoint in Table 1. The dashed line is the 1:1 ratio. The error line is the mean error prediction interval, with 0.05 for Landsat-derived albedo and 0.05 for MCD11 albedo.
4 Results
4.1 Accuracy assessment using field measurements
To evaluate quantitatively the performance of MCD11 albedo, the albedo values provided by MCD11 data were compared to the field synchronously measured broadband albedo by ASD on UG1-E. Because the spatial resolutions differ between ground-based and MODIS-retrieved albedo, the direct comparison is questionable. Indeed, the ASD measured a footprint of about 0.15 m2, whereas a pixel area of MCD11 data matches 250,000 m2. Especially in ablation season, the enormous spatial heterogeneity of a glacier surface results in a high spatial albedo variability, as shown in Supplementary Figure S2. Therefore, we first averaged all albedo values measured by ASD within the selected MODIS pixel on the UG1-E (the number of albedo sampling points ranges from 8 to 23 per day), and then compared the mean ground-based albedo with the MCD11 albedo for the corresponding pixel.
There is a clear grouping in the Figure 2B. Apparently, characteristic albedos for snow and ice emerging. For ice (n = 9), the RMSE is 0.03 with an R2 of 0.65. For snow (n = 4), the RMSE increases to 0.08, and R2 decreases to 0.3. For all the observation points, the difference between the MCD11 albedo and ASD-measured albedo ranged from −0.07 to 0.14, with a mean absolute difference of 0.04. The high correlation (RMSE =0.05 and R2 = 0.93) indicates that the ASD observations capture a wide range of melt season variability of albedo ranging from 0.18 to 0.70 which is well captured with the MCD11 albedo. The comparison presented here is in fact similar to the work on Icelandic glaciers by Gunnarsson et al. (2021), where the MODIS albedo was evaluated with a RMSE of 0.07 with an R2 of 0.9. However, Brun et al. (2015) quantified the mean difference between the AWS measurements and MOD10A1 product was 0.15, with the RMSE of 0.16 and R2 of 0.57, at Mera Glacier of Himalayan. Wang et al. (2014) reported that the RMSE for Palongzangbu No.4, Dongkemadi Glacier and Laohugou Glacier was 0.112, 0.068, and 0.064, and R2 was 0.64, 0.69, and 0.72, respectively, based on the comparison between MOD10A1 product and Landsat TM retrieval albedo calibrated by field measurements. Compared with the work on High Mountain Asia glaciers, a better agreement presented here profited from ASD observations in the field considering the temporal and spatial consistency with MODIS observations as much as possible.
4.2 Characteristics of MCD11 glacier albedo during the ablation period
The mean ablation-season (1 May–30 September) surface albedo is 0.45, 0.42, 0.43, and 0.46 for the eastern branch of UG1-E, Tuyuksu, Golubin and Glacier No. 354, respectively, and generally varies in a range from 0.34 to 0.50 during the period 2000–2021. However, it does not rule out that the mean ablation-season albedo was higher than 0.50 in extreme cases, even as high as 0.56, such as in 2001 and 2009 for Glacier No. 354.
To capture the seasonal characteristics of glacier albedo, we averaged all available MCD11 data for every day, although such an arithmetic mean may sometimes dilute extreme changes in albedo. Seasonal variability of albedo for four glaciers in Tien Shan exhibited a consistent pattern, with a marked and not monotonic downward trend in the average albedo through the ablation period (Figure 4). However, the timing and magnitude of key events, such as the minimum albedo, varies between glaciers and individual years. Specifically, the mean magnitude of minimum albedo changes between 0.14 (Tuyuksu) and 0.17 (Golubin) but ranges from 0.06 to 0.29. The timing of minimum albedo was generally reached in August, whereas it can happen as late as mid-September. The timing of minimum albedo was on average 5–14 days earlier on the eastern branch of UG1-E than that on the other three glaciers.
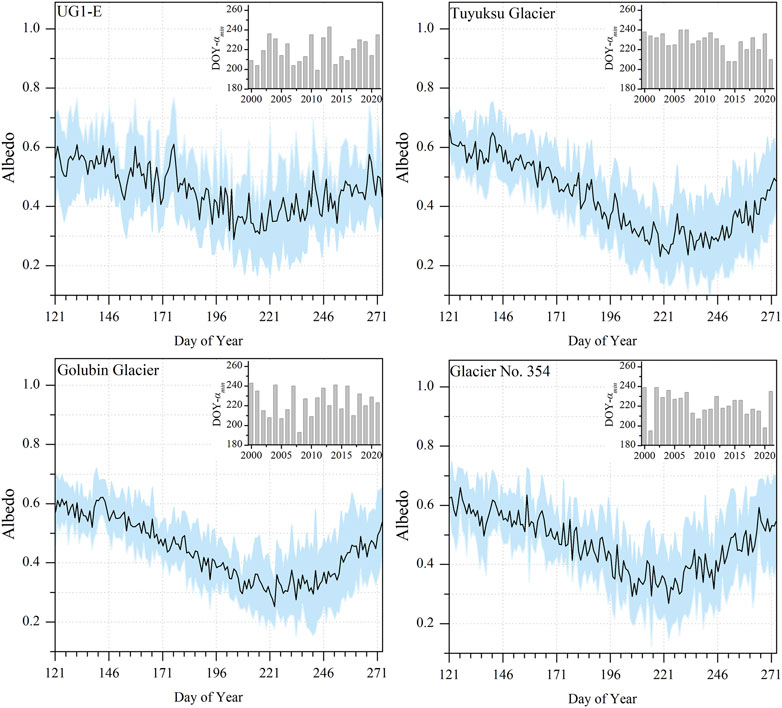
FIGURE 4. The average seasonal variations in albedo for four Tien Shan glaciers from the MCD11 product for May to September 2000–2021. The black line is average of all available MCD11 data for every day. The light blue shadow envelopes around the mean represent the interquartile range of average albedo. The interpolated graph indicates the dates of the albedo minima.
Interesting, Figure 4 shows that despite a large interannual variability, the timing of minimum ablation-season albedo appears to have a shift towards earlier summer for Tuyuksu and Glacier No.354, while no significant temporal trend was found for UG1-E and Golubin. However, the minimum ablation-season albedo remained a moderate interannual fluctuation within each glacier (Figure 5). The minimum ablation-season albedo provides insight into the relative share of the exposed ice and the snow-covered areas. Thus, an ahead timing of minimum ablation-season albedo could indicate a stronger ablation over the early ablation season.
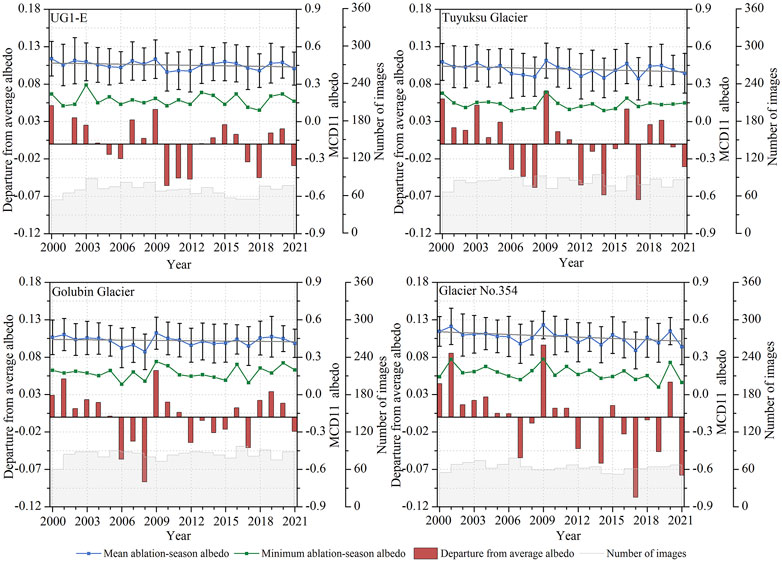
FIGURE 5. The average albedo and its temporal trend, minimum albedo, departures from average albedo, and number of images for four Tien Shan glaciers from the MCD11 data during the ablation season (1 May- 30 September) between 2000 and 2021.
Over the past 22-year period, the ablation-season albedo of Glacier No. 354 exhibited a significant decreasing trend. Especially since 2012, the frequent occurrence of strong negative anomalies also proves this point (Figure 5). Assuming a linear trend, the annual decrease rate is 0.004 at the 95% confidence level. The albedo reduction trend was found for every month during the ablation period, and the declining trend was the most significant in July and September, followed by May (Figure 6). Between 2000 and 2021, a negative variation in glacier albedo also emerged for UG1-E, while the general tendency was only statistically significant at the 80% confidence level. Nevertheless, the annual anomaly indicated that before 2009, positive anomalies were predominant, and the magnitude of the negative anomaly was weaker. After 2009, the number of years showing negative anomalies was greatly increased, and the magnitude of the negative anomalies was enhanced (Figure 5). These implied that the decrease in surface albedo on UG1-E did exist since 2009. Furthermore, the decrease in surface albedo was likely to occur in the middle and late stages of the ablation period (July–August) (Figure 6). Over the period 2000–2021, for Tuyuksu, the slight downward trend in albedo was similar to that of UG1-E, and the about 0.002 of annual decrease rate passed the statistical significance test at the 80% level. Anomaly analysis found the albedo for Tuyuksu undergone a shift from positive departure to close to, or substantially below, average, around 2006 (Figure 5). For Golubin, a remarkable interannual fluctuation of surface albedo was shown, with an overall trend of slight decline, while this trend lost statistical significance. The overall pattern of positive and negative anomalies was roughly consistent with records at Tuyuksu during 2000–2021 (Figure 5). For every month during the ablation period, Tuyuksu and Golubin presented various degrees of a downward trend in surface albedo, the declining signs were more pronounced in July and September than in other months (Figure 6). Thus, it can be concluded that the decline in glacier-wide albedo has really happening for the four studied glaciers in Tien Shan during the past 22 years, although the trend was not statistically significant in all cases. The reduction in mean glacier-wide albedo, especially in July, August and September, mainly due to rising snow lines. Since 2000, the increase in snowline altitude at the end of the ablation season was reported by Yue et al. (2021) for UG1-E, and Barandun et al. (2018) for Glacier No.354 and Glacier Golubin. As a raising snowline, the area of snow with high albedo decreased, and the area of ice with low albedo expanded, leading to a decline of mean glacier-wide albedo. During the ablation season, the decline in glacier albedo results in increased shortwave radiative energy to be absorbed by the glacier, accelerating glacier melting.
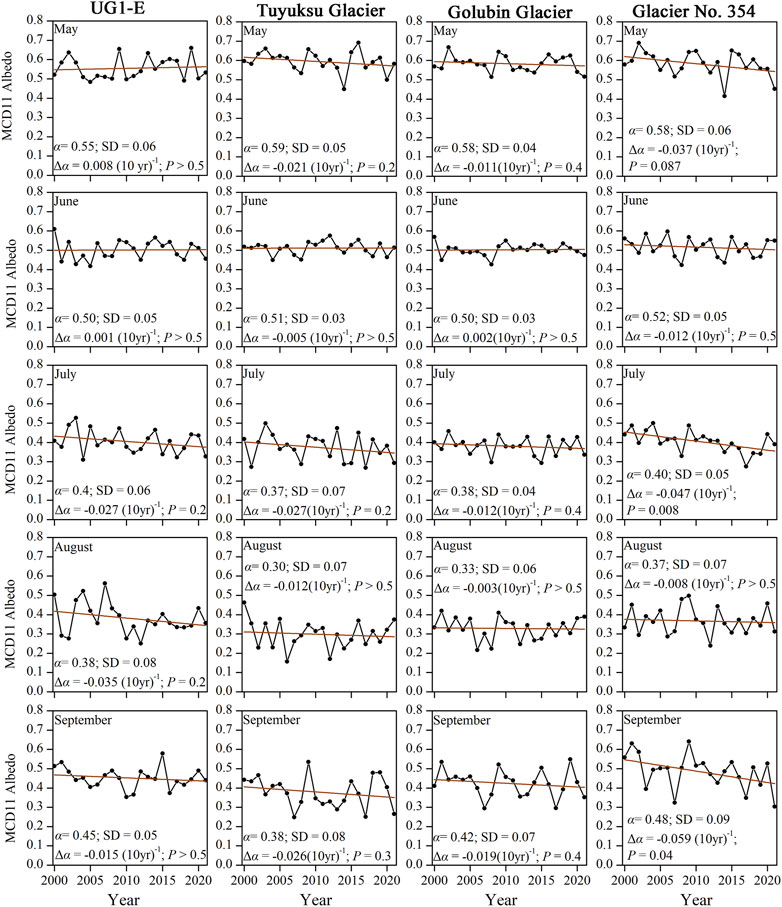
FIGURE 6. Linear trends of average monthly albedo for four Tien Shan glaciers from the MCD11 data in 2000–2021. The mean (α), standard deviation (SD), temporal trend (Δa) and its significance (P) are shown.
4.3 The relationship between ablation-season albedo and annual glacier-wide mass balance
Table 2 summarized the bivariate relationships between surface albedo in ablation season and annual glacier-wide SMB and ELA. It must be noted that the time of annual ablation season was adjusted to exactly match the respective period of mass balance. For example, in 2011 and 2012, the glaciological measurements for Glacier No. 354 were carried out on 12 August 2011 and 14 August 2012, respectively. Thus, the ablation season for 2011–2012 was adjusted to the period from 12 August to 30 September 2011, and from 1 May to 14 August 2012. However, the period covered by the reconstructed mass balance reported by Kronenberg et al. (2016) and Barandun et al. (2018) included fixed dates of the hydrological year (1 October to 30 September). Correspondingly, the ablation season was from May 1 to September 30 of the hydrological year to investigate the bivariate relationships between surface albedo and glacier-wide SMB derived from the mass-balance model.
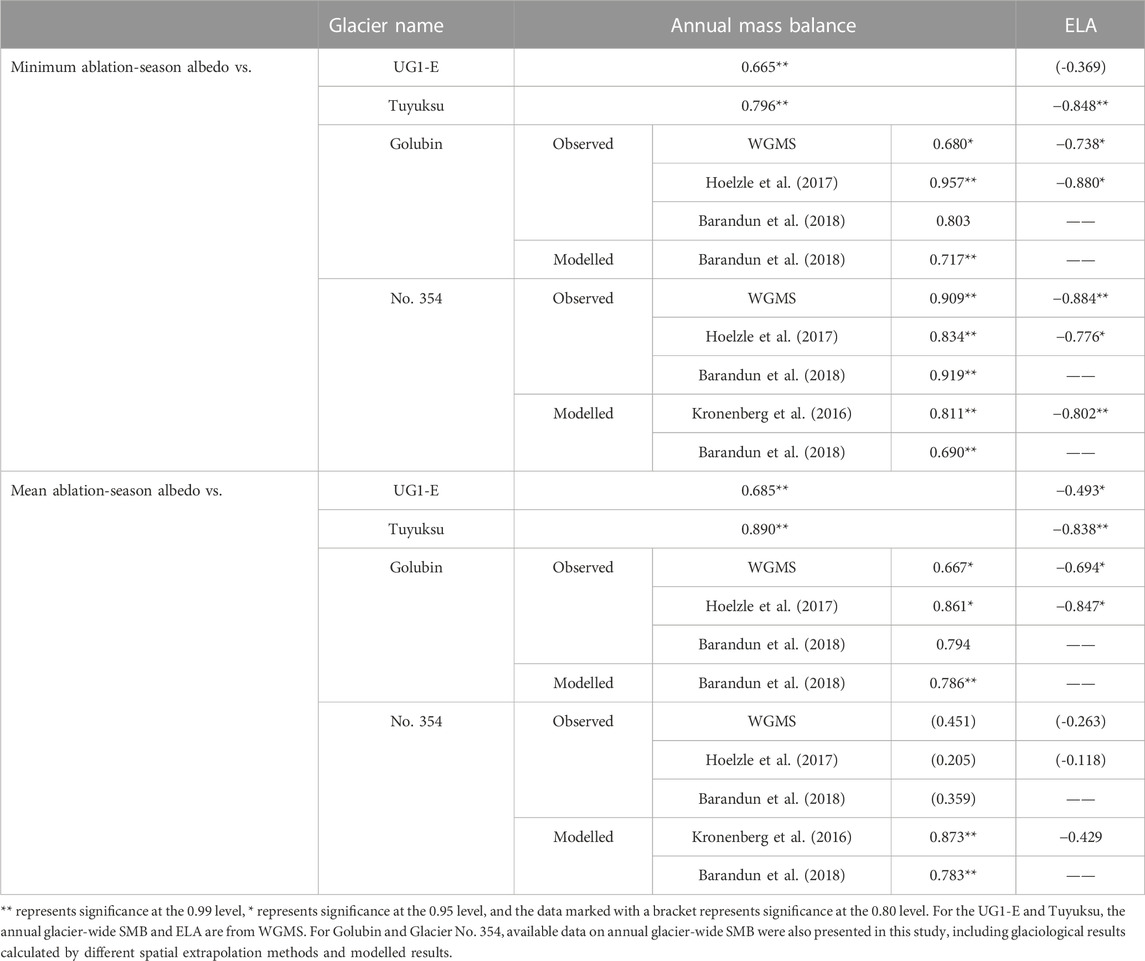
TABLE 2. Overview of the bivariate relationships between mean ablation-season albedo and minimum ablation-season albedo in ablation season (May–September) and annual glacier-wide SMB and ELA over four Tien Shan glaciers.
The correlation relationships are strong and significant for most variables at the 95% confidence level, and even at 99% in most cases, with numerous interactions. The importance of albedo to melt and mass balance conditions is undoubted. Specifically, for the four studied glaciers, annual mass balance is significantly correlated with mean ablation-season albedo or albedo minima. Moreover, it should be noted that glaciological mass balance is higher correlated to mean ablation-season albedo on the UG1-E and Tuyuksu, while a stronger correlation is found between glaciological mass balance and albedo minima on Golubin and Glacier No. 354. A possible explanation is the time scale of glaciological mass-balance data. The time scale is much shorter for Golubin and Glacier No. 354 than for the UG1-E and Tuyuksu (9 years vs. 20 years), and the results computed on short periods should be interpreted with caution. Furthermore, if glaciological mass balance is replaced by surface mass balance derived from the accumulation and temperature-index melt model constrained by TSL observations, and the time scale has been extended to 17 years for Golubin and 13 years for Glacier No. 354, the higher correlation with mean summer albedo is presented. To test this assertion, the correlation between ablation-season albedo and the modeled mass balance on a shorter time-scale was examined. For Golubin glacier, on the shorter time-scale (e.g., 2010–2016), the correlation between mean ablation-season albedo and the mass balance modeled Barandun et al. (2018) was significantly reduced, and lower than that minimum ablation-season albedo (0.29 vs. 0.44). However, for Glacier No. 354, even on the shorter time-scale (e.g., 2010–2016), the correlation between mean ablation-season albedo and mass balance reported by Barandun et al. (2018) was still higher than that minimum ablation-season albedo (0.75 vs. 0.70), and the similar results (0.86 vs. 0.82) was also found for the mass balance modeled by Kronenberg et al. (2016) over the period of 2008–2014. For Golubin Glacier, the present results rely heavily on the time scale of the available mass balance. For Glacier No.354, the correlation between albedo and modeled mass balance (regardless of time scale) is completely different from that between albedo and glaciological mass balance. Thus, the longer series of glaciological mass-balance observation is required to identify the most appropriate proxy of annual mass balance on glaciers in Tien Shan.
For the mid-latitude mountain glaciers, the surface albedo is high and uniform in winter due to its surface being fully covered by snow. During the ablation season, the accumulation area is still covered with snow and firn, conversely to the ablation area where the ice is exposed. As the transient snow line rises, the overall albedo of the glacier surface decreases throughout the ablation season. The maximum elevation of the transient snow line is often referred to as a proxy of the ELA (Rabate et al., 2013). Hence, the correlation between ELA and albedo minima should theoretically be higher than that between ELA and the mean ablation-season albedo. It is expected that ELA was higher correlated to albedo minima than that to mean ablation-season albedo over Golubin, Glacier No. 354 and Tuyuksu. However, ELA still retains a stronger correlation with mean ablation-season albedo on the UG1-E. This difference in correlation between ELA and albedo minima may have resulted from the intensity of glacier melting. The cumulative mass balances indicated that the UG1-E had the most negative mass balance (−14.5 m w.e., from 2000 to 2019), which implied that the glacier experienced the most intense ablation, and ELAs were likely to be higher than the firn line, even exceeded the summit of the glacier, such as in 2010 and 2011. In these cases of more intense ablation, the albedo minima are closely related to the firn line, while ELA is above the firn line, and therefore, there is no theoretical relationship between the albedo minima and ELA.
4.4 Mass balance reconstruction for Golubin and Glacier No. 354, 2000–2010
The annual SMB was reconstructed over the observation period of 2000–2010 using the albedo method proposed by Dumont et al. (2012). The reconstructed mass balance derived from the albedo method was presented for the fixed dates of the hydrological year (1 October to 30 September).
Figure 7 illustrates the linear relationship between mean and minimum ablation-season albedo and annual SMB measured with the glaciological method for Golubin and Glacier No. 354, respectively. Figure 8 demonstrates the reconstructed annual SMB for Golubin and Glacier No. 354 based on MODIS-derived albedo data, together with previous results from various studies in comparison with the albedo method. The glaciological SMB values from 2011 to 2016 were obtained from Barandun et al. (2018), and the glaciological SMB values for the period 2017 to 2019 are from WGMS (2020). It should be kept in mind that the linear relationship for Golubin did not include the observed SMB value in 2014. In 2014, the glacier-wide SMB of −1,560 mm w.e., was computed by Barandun et al. (2018), and the value of −1999 mm w.e., was reported by WGMS (2017). These values were at least 15 times as large as the mean mass balance during the period of 2011–2019. To avoid the influence of extreme negative mass balance on the relationship between surface albedo and annual SMB, the value for 2014 in Golubin was not used to investigate the linear regression model. In Golubin, leave-one-out cross validation illustrated that the uncertainty of reconstructed mass balance was 0.12 m w. e., (for minimum ablation-season albedo), and 0.24 m w. e., (for mean ablation-season albedo). In Glacier No.354, the uncertainty of reconstructed mass balance was 0.10 m w. e., (for minimum ablation-season albedo), and 0.23 m w. e., (for mean ablation-season albedo).
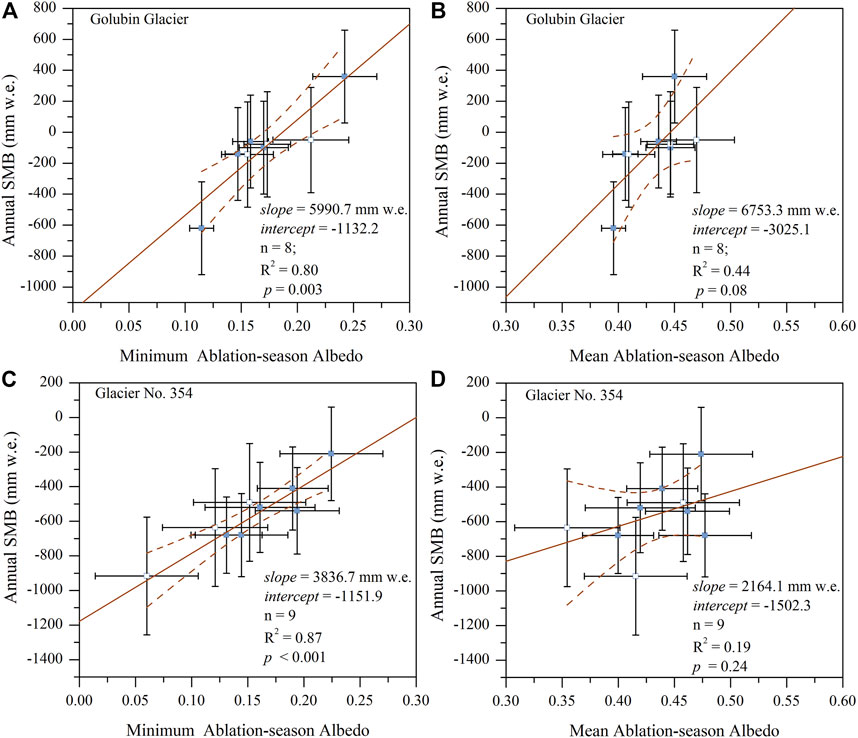
FIGURE 7. Annual SMB as a function of the MODIS-retrieved minimum ablation-season albedo for Golubin Glacier (A) and Glacier No. 354 (C), mean ablation-season albedo for Golubin Glacier (B) and Glacier No. 354 (D). The solid squares indicate the glaciological SMB (2011–2016) computed by Barandun et al. (2018), and the hollow squares indicate the glaciological SMB (2017–2019) from WGMS (2020, 2021). Error bars indicate the uncertainties in the annual SMB and the mean error of MCD11 albedo. The red line illustrates the line of best fit, along with regression coefficients and significance.
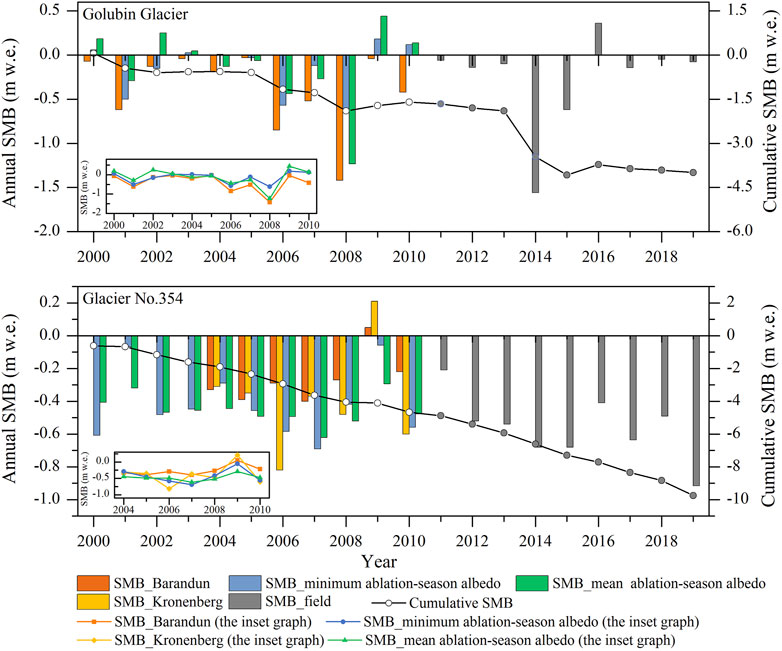
FIGURE 8. The reconstructed annual SMB for the period of 2000–2010 using the albedo method on Golubin and Glacier No. 354, together with previous results from various studies. The inset graphs show the comparison of variation trend of annual SMB reconstructed by different methods. The orange bar and line indicate the modelled mass balance by Barandun et al. (2018) (SMB_ Barandun) for Golubin and Glacier No. 354. The yellow bar and line indicate the modelled mass balance by Kronenberg et al. (2016) (SMB_ Kronenberg) for Glacier No. 354. The green bar and line indicate the mass balance derived from the mean ablation-season albedo (SMB_ mean ablation-season albedo), and the blue bar and line indicate the mass balance derived from the minimum ablation-season albedo (SMB_ minimum albedo). The glaciological mass balance for the period of 2011–2019 was shown by a Gray bar.
The geodetic surveys delivered an extensive and independent data set for validation of the extended mass balance obtained with the albedo method constrained by glaciological mass balance. Although a bias may exist due to the study periods varying between the different studies, and results might thus not be directly comparable, this comparison allows us to check the order of magnitude of our results. Here, the glaciological and reconstructed annual SMB were averaged over the corresponding recorded period to allow comparison with the glacier-wide geodetic mass balance. It is noteworthy that the geodetic mass change included internal and basal components of the mass balance. Thus, an estimate for internal and basal mass balance was added to the reconstructed SMB and referred to as the total mass change. The estimate of the internal and basal mass balance is +80 mm w. e., yr-1 for Golubin (Aizen et al., 1997), and +40 mm w. e., yr-1 for Glacier No. 354 (Kronenberg et al., 2016). For Golubin, the geodetic method revealed mean mass balance was −0.30 ± 0.37 m w. e., yr-1 from 8 September 2006 to 1 November 2014 (Barandun et al., 2018), −0.04 ± 0.19 m w. e., yr-1 for the period of 2002–2013 (Brun et al., 2017), and −0.28 ± 0.96 m w. e., yr-1 for the period 2000–2012 (Bolch, 2015). During these three periods, the mass balance retrieved from minimum albedo was found to be −0.24 ± 0.12 m w. e., yr-1, −0.04 ± 0.12 m w. e., yr-1 and −0.06 ± 0.12 m w. e., yr-1, and the corresponding values retrieved from mean ablation-season albedo was −0.28 ± 0.24 m w. e., yr-1, −0.05 ± 0.24 m w. e., yr-1 and −0.04 ± 0.24 m w. e., yr-1 (Figure 9A). Over the 2002–2014 period, the reconstructed mass balance for Glacier No. 354 was −0.42 ± 0.10 m w. e., yr-1 (derived from minimum ablation-season albedo) and −0.44 ± 0.23 m w. e., yr-1 (derived from mean ablation-season albedo), the geodetic mass balance of −0.46 ± 0.19 m w. e., yr-1 was calculated by Brun et al. (2017); Barandun et al. (2018) reported that Glacier No. 354 had a mass balance of −0.42 ± 0.07 m w. e., yr−1 from 1 September 2003 to 27 July 2012, while the mass balance derived from the albedo method was −0.38 ± 0.10 m w. e., yr-1 (derived from minimum ablation-season albedo) and −0.41 ± 0.23 m w. e., yr-1 (derived from mean ablation-season albedo) (Figure 9B).
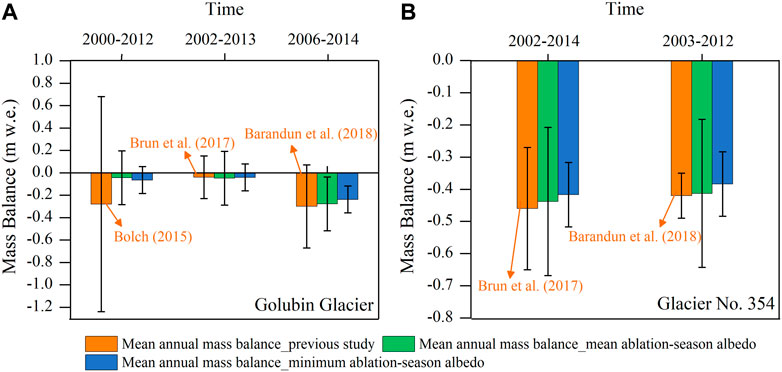
FIGURE 9. The comparison between the mass balance estimated by the albedo method and the geodetic mass balance for Golubin Glacier (A) and Glacier No. 354 (B). The orange bar indicates the geodetic mass balance, the green bar indicates the mass balance derived from mean ablation-season albedo, and the blue bar indicates the mass balance derived from minimum ablation-season albedo. For Golubin, the geodetic mass balance from 2006 to 2014 was reported by Barandun et al. (2018), the geodetic mass balance for the period of 2002–2013 was reported by Brun et al. (2017), and the geodetic mass balance for 2000–2012 was reported by Bolch (2015). For Glacier No. 354, the geodetic mass balance of 2002–2014 was calculated by Brun et al. (2017), and the geodetic mass balance of 2003–2012 was calculated by Barandun et al. (2018).
In generally, the inferred mass balance is in well agreement with the geodetic mass balance, except for Golubin glacier over the period 2000–2012. The reconstructed mass balance using the albedo method was somewhat less negative than the geodetic mass balance. A possible reason can be explained by the fact that surface albedo only reflects the contribution of the shortwave radiative energy to glacier melting, while does not capture glacier melting associated with other energy sources. As a result, less mass loss is calculated by the albedo method. For Golubin glacier over the period 2000–2012, a possible reason about underestimate of mass loss is that most of the selected pixels were above the glacier equilibrium line (Figure 1D), the calculated glacier-wide albedo from MODIS products captured more information about the accumulation area. According to the results reported by Bolch (2015), a slight mass gain was identified in the upper reaches of the glacier for the period 2000–2012. Consequently, the albedo method derived a less mass loss from 2000 to 2012. In addition, we note that the mass balance computed by Bolch (2015) has as uncertainty of up to 0.96 m w. e., yr-1, the differences were still within their error bounds.
Moreover, the agreement between mass balance retrieved from mean ablation-season albedo and geodetic method is slightly better than between minimum ablation-season albedo and geodetic method. If we ignore the difference in individual glacier, the slope of the scatter plot of geodetic mass balance vs. mean albedo-retrieved mass balance is much closer 1 than that minimum albedo-retrieved mass balance (slope is 0.98 and 0.93, respectively). RMSE for both albedo-retrieved mass balance 0.11. The mean absolute difference between geodetic mass balance and mean albedo-retrieved mass balance is 0.06, and the corresponding value is 0.07 for minimum albedo-retrieved mass balance. Thus, mean ablation-season albedo may be more reliable than minimum ablation-season albedo as a proxy of the annual mass balance for some Tien Shan glaciers. It is noteworthy that the relationship between albedo and surface mass balance is obtained over a shorter period for Golubin glacier and No. 354 glacier, and compared with minimum ablation-season albedo, mean ablation-season albedo has a poor correlation with glaciological mass balance (Figure 7).
The albedo-retrieved annual SMB was also compared to previous reconstructed results from various mass-balance models (Figure 8). For Glacier No. 354, except in 2006, 2007 and 2009, the annual SMB computed by albedo method are in well agreement with the results reported by Barandun et al. (2018) or Kronenberg et al. (2016). Moreover, a better agreement was found between the reconstructed mass balance using minimum ablation-season albedo and the modelled mass balance (in term of the mean absolute difference, RMSE and the slope in Table 3). For Golubin, significant differences in the specific values between albedo-retrieved and modelled mass balance are found, except for in 2003 and 2005, in which a less negative or almost balanced mass budget was computed. However, it is noteworthy that the relative trend in mass balance was consistent over the reconstruction period considered in this study (the inset of panel Golubin glacier in Figure 8), which can be also demonstrated by the higher R2 (Table 3). Therefore, we speculate that there may be a systematic bias between the albedo method and mass-balance models. A reliable explanation was not yet available but may be related to the morpho-topography features of the glacier, such as slope, aspects, and topographic shading. Olson and Rupper (2019) showed shading from topography, including both shaded relief and cast shadowing, is a key factor contributing to the SMB, while MODIS albedo products were not corrected with topography.
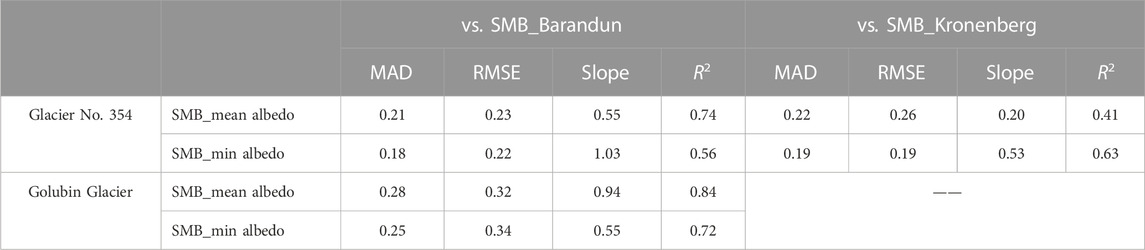
TABLE 3. Comparison between albedo-retrieved mass balance and modelled mass balance for Glacier No.354 and Golubin Glacier, in term of the mean absolutely difference (MAD), R2, RMSE and slope.
Overall, the mass balance reconstruction by the albedo method is robust for Glacier No. 354 but appeared to display higher uncertainty for Golubin. Non-etheless, during the 11 considered years, the reconstructed mass balance retrieved from different methods overlap within the respective uncertainty ranges.
4.5 Long-term SMB variations in Golubin and Glacier No. 354
Considering the higher correlation between ablation-season albedo minima and glaciological mass balance, the mass balance values retrieved from ablation-season albedo minima, together with those from previous studies, were used to investigate the long-term variations in Golubin and No. 354 glaciers.
For Glacier No. 354, over the past 20 years, the annual mass balance was negative, and the most negative mass balance of about −916 mm w. e., was found in 2019. Between 2000 and 2019, Glacier No. 354 experienced an annual mass wastage of 487 mm w. e., accompanied by a standard deviation of 205 mm w. e., which was about 40% more mass wastage than that experienced over the entire Tien Shan (Shean et al., 2020), while was about 33% less than the average annual records of mass wastage for global reference glaciers. A clear negative variation trend in annual SMB over this period was shown for Glacier No. 354, which indicated that mass wastage is accelerating at a rate of 15 mm w. e., yr-1. Compared to the late 20th century, mass wastage was significantly less negative, and the mean annual mass wastage slowed from 790 mm w. e., yr-1 in 1975–1999 (Bolch, 2015) to 487 mm w. e., yr-1 in 2000–2019.
Golubin exhibited an average annual SMB of −134 mm w. e., and a cumulative mass balance of −2,681 mm w. e., during the period 2000–2019. Furthermore, about 58% of total mass loss was contributed by the intense ablation in 2014. A diminished mass loss was exhibited over the first two decades of the 21st century. The annual mass loss was less than one-fifth of the average value of mass loss for global reference glaciers during that period, and it was also less than the entire Tien Shan glaciers’ mass loss of 290 ± 70 mm w. e., yr-1 (Shean et al., 2020). Despite a visibly decreased mass loss for Golubin, stronger interannual variations of annual SMB were found, with a standard deviation of 403 mm w. e., Moreover, glaciological SMB records indicated the mean annual mass change of −291 mm w. e., and lower year-to-year variability (σ = 226 mm w. e.) over the period 1970–1994. Compared to the first period (1970–1994), the reduction of mass loss rate and the increase in year-to-year variability implied an intensification of extreme events of mass change under ongoing climate change.
5 Discussion
5.1 Limitations of the MODIS albedo product in Tien Shan
MODIS allows obtaining get daily images, although retrieving daily maps of the Earth’s surface albedo remains challenging. Clouds are known to be a major problem in optical remote sensing of the Earth’s surface, especially in the case of ice- and snow-covered surfaces. For MO/YD10A1 albedo products, cloudy pixels were determined using the MOD35 cloud product described by Ackerman and Frey (2015), which was assigned the values 150 and 151. In this study, the identification of cloud-cover pixels depended on the performance of the MOD35 cloud product. In the glaciers of the Himalayas, Brun et al. (2015) reported that the MOD35 cloud mask correctly detected 67% of cloud-obscured pixels. Before using the MO/YD10A1 albedo products, it is necessary to evaluate the performance of cloud detection for studied glaciers. In particular, the minimum albedo obtained from MO/YD10A1 albedo products, due to persistent cloud coverage at the glacier, hindered the true albedo minima to be captured in some years. For the present study, we used the highest transient snow line to independently evaluate the possibility of minimum albedo obtained by MODIS imager, considering that the highest transient snow line usually occurs when the albedo minima are reached. For Golubin and Glacier No. 354, between 2000 and 2016, the maximum transient snow line recorded by Landsat TM/ETM+ and OLI, Terra ASTER-L1B, Sentinel-2A scenes and terrestrial cameras was mapped manually by Barandun et al. (2018). For UG1-E, the highest transient snow line observed by Landsat TM/ETM+ and OLI for the period of 2000–2016 was reported by Yue et al. (2021). For UG1-E, the average time difference between the appearance of the maximum snow line altitude and the arrival of the minimum albedo was 5 days, ranging from 5 to 7 days. For Golubin and Glacier No. 354, the corresponding values are 4 days (range from 6 days to 9 days) and 6 days (range from 6 days to 9 days), respectively. These close occurrence times confirmed that the minimal albedo signal had been largely captured by MODIS data in this study.
For Tien Shan glaciers, another limitation of MODIS albedo products is the low spatial resolution. The robustness of the albedo method depends on the number of pixels averaged to compute glacier-wide albedo. As highlighted by Dowson et al. (2020), the use of MODIS albedo products to the albedo method remains applicable only for glaciers that are large enough to allow albedo to be retrieved and averaged over a number of pixels. However, for the glaciers in Tien Shan, the 500 m spatial resolution is relatively coarse, due to 80% of glaciers being less than 1 km2 in Tien Shan. If the mixed pixels at the margin of the glacier were removed, there are very few pixels that are covered by snow or ice. Therefore, spatial extrapolation is required to obtain the glacier-wide albedo. In the present study, the Landsat-derived albedo was used to perform the spatial extrapolation for UG1-E. A future application of MODIS imagery to apply the albedo method for Tien Shan glaciers needs to employ other algorithms, such as the MODImLab toolbox (Sirguey et al., 2009; Dumont et al., 2012) or the spatial and temporal adaptive reflectance fusion model (Hilker et al., 2009), to capture more spatial detail while ensuring temporal resolution. The choice of glacier outline was also influenced by the spatial resolution of the MODIS images. Due to the four glaciers exhibited an area reduction of about 0.11–0.26 km2 from 2000 to 2019, which was mainly at the end of the glacier, and less than one MODIS pixel (Supplementary Figure S3). In the present study, the mixed pixels at the edge of the glacier have been removed to capture only the snow/ice albedo signal. Thus, the application of a fixed outline has little effect on the mean glacier-wide albedo for earlier years. However, once the reduction of glacier area is more than one MODIS pixel, the application of a fixed outline will cut the terminal region of the glacier in earlier years, where the glacier surface is usually darkest, leading to an underestimation of glacier-wide albedo.
5.2 Potential and limitations of the albedo method applied in the Tien Shan
The mass balance reconstructed by albedo method was compared with the glaciological method to assess the performance of the albedo method. For UG1-E and Tuyuksu glacier, using the glaciological mass balance from 2010 to 2020 to train, the SMB reconstruction over the period of 2000–2009 was compared with the glaciological mass balance. The SMB derived from mean ablation-season albedo explained more than 70% of the variation in the glaciological mass balance, while the SMB reconstructed by the minimum ablation-season albedo has a slightly lower explanation for the variation of the glaciological mass balance, which is 50%–60%. An advantage of the albedo method is the reconstruction of annual SMB for glaciers where mass-balance observation series were interrupted, with minimum input data. For some glaciers, the mean ablation-season albedo may be more reliable as a proxy of the annual mass balance. A possible explanation is that these glaciers are summer accumulation-type glaciers, where accumulation and ablation occur simultaneously in summer. Summer snowfall not only contributes directly to mass accumulation but also increases surface albedo and then reduces ablation. The mean ablation-season albedo captures these signals associated with summer snowfall much more than the ablation-season albedo minima. Overall, for glaciers in Tien Shan, surface albedo can be regarded as an appropriate proxy of the glacier-wide annual SMB, and thus the albedo method could be used to reconstruct annual SMB. However, it should be noted that the mass balance is retrieved from albedo minima or mean ablation-season albedo.
Despite the great potential of the albedo method applied in the Tien Shan, some special attention should be paid when this method is used for further applications. The albedo method is not applicable to all glaciers. For glaciers with intense melting, the ELA located above the firn line, and even exceeded the summit of the glacier, for example, on the UG1-E in 2010 and 2011. The glacier-wide albedo merely represents the average albedo of part of the glacier (most of the ablation zone). Thus, the derived mass balance will largely underestimate the real mass change. The observation of Golubin in 2014 was a good example of the albedo method by underestimating the mass loss with very negative SMB. In 2014, to correctly predict the SMB of −1,560 mm w. e., in Golubin using the albedo method, monitored glacier-wide average albedo would need to be extremely low (lower than 0), to match the regression line derived from other years of the time series. Indeed, monitoring such low albedo values at a glacier-wide scale is unrealistic. This indicated a limitation of the albedo method by underestimating the mass loss value for years with very negative annual SMB. Moreover, the albedo method is probably not suitable for debris-covered glaciers since the debris-covered area is usually classified as land rather than snow in the MODIS albedo products.
5.3 The influence of spatial extrapolation on the glacier-wide albedo value
Due to the heterogeneity of the glacier surface during the ablation period, the large spatial scale mismatch between in situ-based measurements and MODIS pixels, and the limited coverage of in situ sites, the upscaling method was crucial to quantify the performance of MODIS albedo products. In fact, both the averaging the multi-point measurement and spatial extrapolation are upscaling method methods (Wu et al., 2019). The errors implied in the upscaling process are inevitable.
To minimize these errors as much as possible, spectral measurements at much higher spatial densities were made by increasing the roving sites. The roving sites were selected by visual inspection to capture the significant variability of the properties of the glacier surface between two fixed sites. Except for the six fixed points, the number of roving sites ranges from 0 to 15 within a MODIS pixel. Furthermore, the kriging-based upscaling method was used for spatial extrapolation, aiming to evaluate the effect of spatial extrapolation on the mean albedo within a MODIS pixel. This upscaling method has been used for inferring soil moisture by Pandey and Pandey (2010) and Zhang et al. (2017). The results show that the difference in mean albedo between with and without the use of spatial extrapolation was small (< 0.03) on 3 May and 16 August 2017, when the MODIS sub-pixel glacier surface was dominated by snow or ice, and the surface was less heterogeneous. On 23 July 2017, the difference in mean albedo between with and without the use of the spatial extrapolation increased to 0.05, attributed to sub-pixel-scale significant variations in the glacier surface. For the MODIS pixel considered in this study, the glacier surface on 23 July 2017 was transformed from ice to snow, which can be demonstrated by the albedo quartile ranging from 0.1 to 0.48.
Overall, a good agreement between ground-based albedo and the MCD11 albedo was found whatever the use of the spatial extrapolation. Using the spatial extrapolation, a slight decrease in agreement was shown with the R2 of 0.92 and RMSE of 0.06. The result was very close to the result of multi-point averaging, which indicated that the spectral sampling sites selected in this study are spatially representative to some extent. Thus, no further spatial extrapolation was applied to obtain the ground “truth” albedo within a MODIS pixel. However, for the glacier surface with significant spatial heterogeneity, spatial extrapolation is essential for the validation of coarse pixel satellite products, and a high spatial resolution image is a good choice.
6 Conclusion
To investigate the variations in surface albedo of four reference glaciers in Tien Shan and their linkages with the annual mass balance, we evaluated the validity of MCD11 albedo using the field albedo data measured by ASD. Despite the intrinsic limitations of moderate resolution imagery, for example, there was only one pure pixel inside the UG1-E boundary, the MCD11 albedo was tightly matched to the ASD-measured albedo, with the RMSE of 0.05 and R2 of 0.93.
The MCD11 albedo data show the large seasonal and interannual variability in surface albedo. The mean ablation-season (May–September) surface albedo was 0.45, 0.42, 0.43 and 0.46 for the UG1-E, Tuyuksu, Golubin and Glacier No. 354, respectively, and generally varies in a range from 0.34 to 0.50 during the period of 2000–2021. The annual minimum glacier-wide albedo for individual glaciers ranges between 0.14 and 0.17 and can occur as early as the last week of July and as late as mid-September. A negative albedo variation signal was captured over the period 2000–2021 except Golubin glacier, and this downward trend with a rate of 0.004 in albedo was significant at the 95% confidence level for Glacier No. 354. For individual glaciers, average linear trends for monthly data indicate that the decrease in albedo was more pronounced in July compared to other months during the ablation period.
The bivariate relationships between surface albedo in ablation season and annual glacier-wide SMB and ELA highlight the fact that annual mass balance is strongly controlled by mean ablation-season albedo, while the minimum ablation-season albedo captures more information about ELA. These implied that mean ablation-season albedo may be more reliable than minimum albedo as a proxy for mass balance for some Tien Shan glaciers. However, for Golubin and Glacier No. 354, this is currently highly dependent on the length of the mass-balance time series. Hence, time series of glaciological mass balance data with sufficient length are crucial to validate the above conclusion. Nevertheless, based on the correlativity between MODIS-derived mean ablation-season albedo and minimum ablation-season albedo and glaciological mass balance of Golubin and Glacier No. 354 over the 2011–2019 period, the annual SMB for these glaciers can be reconstructed using the albedo method over the period 2000–2010. Comparison with previously reconstructed results indicated that the mass balance derived from albedo is robust for Glacier No. 354, while for Golubin, the results derived from the albedo method only captured the relative changes in mass balance. The current study suggests that ablation-season albedo can be regarded as a proxy for annual mass balance, and mean ablation-season albedo may be more reliable than minimum albedo for some Tien Shan glaciers.
Data availability statement
The datasets presented in this study can be found in online repositories. The names of the repository/repositories and accession number(s) can be found in the article/Supplementary Material.
Author contributions
XY: Conceptualization; conducted the data collection and analysis; methodology and writing-original draft; ZL: Conceptualization; data collection and resources; HL: Conceptualization; data analysis and methodology; FW: Data collection and resources.
Funding
This work was supported by the National Natural Science Foundation of China (42001066); the Third Comprehensive Scientific Expedition of Xinjiang Uyghur Autonomous Region (2022xjkk0802; 2021xjkk0801); State Key Laboratory of Cryospheric Science (SKLCS-ZZ-2022); the Open-end Foundation for National Cryosphere Desert Data Center (20D05); and the Foundation for Excellent Youth Scholars of NIEER, CAS (FEYS2019003).
Acknowledgments
We are grateful to WGMS for their compiling and disseminating standardized mass balance observations. We also thank the NASA for the MODIS data and USGS for the Landsat images data.
Conflict of interest
The authors declare that the research was conducted in the absence of any commercial or financial relationships that could be construed as a potential conflict of interest.
Publisher’s note
All claims expressed in this article are solely those of the authors and do not necessarily represent those of their affiliated organizations, or those of the publisher, the editors and the reviewers. Any product that may be evaluated in this article, or claim that may be made by its manufacturer, is not guaranteed or endorsed by the publisher.
Supplementary material
The Supplementary Material for this article can be found online at: https://www.frontiersin.org/articles/10.3389/feart.2023.974739/full#supplementary-material
References
Ackerman, S. A., and Frey, R. (2015). “MODIS atmosphere L2 cloud mask product,” in NASA MODIS adaptive processing system (USA: Goddard Space Flight Center). doi:10.5067/MODIS/MOD35_L2.006
Aizen, V., Aizen, E., and Melack, J. (1995). “Present and future impact of snow cover and glaciers on runoff from mountain regions – comparison between Alps and Tien Shan,” in Biochemistry of sesonally snow-covered catchments (Boulder, Colorado, USA: IAHS) 228, 413–430.
Aizen, V. B., Aizen, E. M., Melack, J. M., and Dozier, J. (1997). Climatic and hydrologic changes in the Tien Shan, central Asia. J. Clim. 10 (6), 1393–1404. doi:10.1175/1520-0442(1997)010<1393:cahcit>2.0.co;2
Aizen, V., Surazakov, A., Kuzmichenok, V., and Aizen, E. (2006). Glacier changes in the central and northern Tien Shan during the last 140 years based on surface and remote-sensing data. Ann. Glaciol. 43, 202–213. doi:10.3189/172756406781812465
Barandun, M., Huss, M., Usubaliev, R., Azisov, E., Berthier, E., Kääb, A., et al. (2018). Multi-decadal mass balance series of three Kyrgyz glaciers inferred from modelling constrained with repeated snow line observations. Cryosphere 12, 1899–1919. doi:10.5194/tc-12-1899-2018
Barandun, M., Pohl, E., Naegeli, K., McNabb, R., Huss, M., Berthier, E., et al. (2021). Hot spots of Glacier mass balance variability in central Asia. Geophys. Res. Lett. 48, e2020GL092084. doi:10.1029/2020gl092084
Bhattacharya, A., Bolch, T., Mukherjee, K., King, O., Menounos, B., Kapitsa, V., et al. (2021). High Mountain Asian glacier response to climate revealed by multi-temporal satellite observations since the 1960s. Nat. Commun. 12, 4133. doi:10.1038/s41467-021-24180-y
Bolch, T. (2015). glacier area and mass changes since 1964 in the ala archa valley, Kyrgyz ala-too, northern tien Shan. Ice Snow 55, 28–39. doi:10.15356/2076-6734-2015-1-28-39
Box, J. E., Fettweis, X., Stroeve, J. C., Tedesco, M., Hall, D. K., and Steffen, K. (2012). Greenland ice sheet albedo feedback thermodynamics and atmospheric drivers. Cryosphere 6, 821–839. doi:10.5194/tc-6-821-2012
Brun, F., Berthier, E., Wagnon, P., Kääb, A., and Treichler, D. (2017). A spatially resolved estimate of High Mountain Asia glacier mass balances from 2000 to 2016. Nat. Nat. Geosci. 10, 668–673. doi:10.1038/ngeo2999
Brun, F., Dumont, M., Berthier, E., Azam, M. F., Shea, J. M., Sigruey, P., et al. (2015). Seasonal changes in surface albedo of Himalayan glaciers from MODIS data and links with the annual mass balance. Cryosphere 9 (1), 341–355. doi:10.5194/tc-9-341-2015
Carturan, L., Baroni, C., Brunetti, M., Carton, A., Fontana, G. D., Salvatore, M. C., et al. (2016). Analysis of the mass balance time series of glaciers in the Italian Alps. Cryosphere 10, 695–712. doi:10.5194/tc-10-695-2016
Davaze, L., Rabatel, A., Arnaud, Y., Sigruey, P., Six, D., Letreguilly, A., et al. (2018). Monitoring glacier albedo as a proxy to derive summer and annual surface mass balances from optical remote-sensing data. Cryosphere 12, 271–286. doi:10.5194/tc-12-271-2018
Dowson, A. J., Sirguey, P., and Cullen, N. J. (2020). Variability in glacier albedo and links to annual mass balance for the gardens of Eden and Allah, Southern Alps, New Zealand. Cryosphere 14, 3425–3448. doi:10.5194/tc-14-3425-2020
Dumont, M., Gardelle, J., Sirguey, P., Guillot, A., Six, D., Rabatel, A., et al. (2012). Linking glacier annual mass balance and glacier albedo retrieved from MODIS data. Cryosphere 6, 1527–1539. doi:10.5194/tc-6-1527-2012
Farinotti, D., Longuevergne, L., Moholdt, G., Duethmann, D., Mölg, T., Bolch, T., et al. (2015). Substantial glacier mass loss in the Tien Shan over the past 50 years. Nat. Geosci. 8 (9), 716–722. doi:10.1038/ngeo2513
Gunnarsson, A., Gardarsson, S. M., Pálsson, F., Jóhannesson, T., and Sveinsson, Ó. G. B. (2021). Annual and inter-annual variability and trends of albedo of Icelandic glaciers. Cryosphere 15, 547–570. doi:10.5194/tc-15-547-2021
Gurgiser, W., Marzeion, B., Nicholson, L., Ortner, M., and Kaser, G. (2013). Modeling energy and mass balance of Shallap Glacier, Peru. Cryosphere 7, 1787–1802. doi:10.5194/tc-7-1787-2013
Hall, D. K., and Riggs, G. A. (2021b). MODIS/Aqua snow cover daily L3 global 500m SIN grid. Boulder, Colorado USA: NASA National Snow and Ice Data Center Distributed Active Archive Center. Version 61. [2002-2021].
Hall, D. K., and Riggs, G. A. (2021a). MODIS/Terra snow cover daily L3 global 500m SIN grid. Boulder, Colorado USA: NASA National Snow and Ice Data Center Distributed Active Archive Center. Version 61. [2000-2021].
Hilker, T., Wulder, M. A., Coops, N. C., Seitz, N., White, J. C., Gao, F., et al. (2009). Generation of dense time series synthetic Landsat data through data blending with MODIS using a spatial and temporal adaptive reflectance fusion model. Remote Sens. Environ. 113, 1988–1999. doi:10.1016/j.rse.2009.05.011
Hock, R., and Holmgren, B. (2005). A distributed surface energy balance model for complex topography and its application to Storglaciaren, Sweden. J. Glaciol. 51 (172), 25–36. doi:10.3189/172756505781829566
Hoelzle, M., Azisov, E., Barandun, M., Huss, M., Farinotti, D., Gafurov, A., et al. (2017). Re-establishing glacier monitoring in Kyrgyzstan and Uzbekistan, Central Asia. Geoscientific Instrum. Methods Data Syst. 6 (2), 397–418. doi:10.5194/gi-6-397-2017
Hugonnet, R., McNabb, R., Berthier, E., Menounos, B., Nuth, C., Girod, L., et al. (2021). Accelerated global glacier mass loss in the early twenty-first century. Nature 592 (7856), 726–731. doi:10.1038/s41586-021-03436-z
Johnson, E., and Rupper, S. (2020). An examination of physical processes that trigger the albedo-feedback on glacier surfaces and implications for regional glacier mass balance across High Mountain Asia. Front. earth Sci. 8, 129. doi:10.3389/feart.2020.00129
Klein, A. G., and Stroeve, J. (2002). Development and validation of a snow albedo algorithm for the MODIS Instrument. Ann. Glaciol. 34, 45–52. doi:10.3189/172756402781817662
Kronenberg, M., Barandun, M., Hoelzle, M., Huss, M., Farinotti, D., Azisov, E., et al. (2016). Mass-balance reconstruction for Glacier No. 354, tien Shan, from 2003 to 2014. Ann. Glaciol. 57 (71), 92–102. doi:10.3189/2016aog71a032
Kutuzov, S., and Shahgedanova, M. (2009). Glacier retreat and climatic variability in the eastern Terskey-Alatoo, inner Tien Shan between the middle of the 19th century and beginning of the 21st century. Glob. Planet. Change 69 (1-2), 59–70. doi:10.1016/j.gloplacha.2009.07.001
Li, Y., Kang, S., Yan, F., Chen, J., Wang, K., Paudyal, R., et al. (2019). Cryoconite on a glacier on the northeastern Tibetan plateau light absorbing impurities albedo and enhanced melting. J. Glaciol. 65 (252), 633–644. doi:10.1017/jog.2019.41
Liang, S., Strahler, A. H., and Walthall, C. (1999). Retrieval of land surface albedo from satellite observations a simulation study. J. Appl. Meteorology 38 (6), 712–725. doi:10.1175/1520-0450(1999)038<0712:rolsaf>2.0.co;2
Ming, J., Wang, P., Zhao, S., and Chen, P. (2013). Disturbance of light-absorbing aerosols on the albedo in a winter snowpack of Central Tibet. J. Environ. Sci. 25 (8), 1601–1607. doi:10.1016/s1001-0742(12)60220-4
Naegeli, K., Damm, A., Huss, M., Wulf, H., Schaepman, M., and Hoelzle, M. (2017). Cross-comparison of albedo products for glacier surfaces derived from airborne and satellite (Sentinel-2 and Landsat 8) optical data. Remote Sens. 9, 110. doi:10.3390/rs9020110
Olson, M., and Rupper, S. (2019). Impacts of topographic shading on direct solar radiation for valley glaciers in complex topography. Cryosphere 13, 29–40. doi:10.5194/tc-13-29-2019
Pandey, V., and Pandey, P. K. (2010). Spatial and temporal variability of soil moisture. Int. J. Geosciences 1 (02), 87–98. doi:10.4236/ijg.2010.12012
Paul, F., Barrand, N., Baumann, S., Berthier, E., Bolch, T., Casey, K., et al. (2013). On the accuracy of glacier outlines derived from remote-sensing data. Ann. Glaciol. 54 (63), 171–182. doi:10.3189/2013aog63a296
Pohl, E., Gloaguen, R., Andermann, C., and Knoche, M. (2017). Glacier melt buffers river runoff in the Pamir Mountains. Water Resour. Res. 53, 2467–2489. doi:10.1002/2016wr019431
Pritchard, H. D. (2019). Asia’s shrinking glaciers protect large populations from drought stress. Nature 569, 649–654. doi:10.1038/s41586-019-1240-1
Pu, J., Yao, T., Yang, M., Yang, M., Tian, L., Wang, M., et al. (2008). Rapid decrease of mass balance observed in the Xiao (lesser) Dongkemadi Glacier, in the central Tibetan plateau. Hydrol. Process. 22, 2953–2958. doi:10.1002/hyp.6865
Rabate, A., Letreguilly, A., Dedieu, J. P., and Echert, N. (2013). Changes in glacier equilibrium-line altitude in the Western Alps from 1984 to 2010 evaluation by remote sensing and modeling of the morpho-topographic and climate controls. Cryosphere 7, 1455–1471. doi:10.5194/tc-7-1455-2013
Rabatel, A., Dedieu, J., and Vincent, C. (2016). Spatio-temporal changes in glacier wide mass balance quantified by optical remote sensing on 30 glaciers in the French Alps for the period 1983-2014. J. Glaciol. 62 (236), 1153–1166. doi:10.1017/jog.2016.113
Schaefer, M., Fonseca-Gallardo, D., Farías-Barahona, D., and Casassa, G. (2020). Surface energy fluxes on Chilean glaciers: Measurements and models. Cryosphere 14, 2545–2565. doi:10.5194/tc-14-2545-2020
Shean, D. E., Bhushan, S., Montesano, P., Rounce, D. R., Arendt, A., and Osmanoglu, B. (2020). A systematic, regional assessment of High Mountainmountain Asia glacier mass balance. Front. Earth Sci. 7, 363. doi:10.3389/feart.2019.00363
Sirguey, P., Mathieu, R., and Arnaud, Y. (2009). Subpixel monitoring of the seasonal snow cover with MODIS at 250 m spatial resolution in the southern Alps of New Zealand: Methodology and accuracy assessment. Remote Sens. Environ. 113, 160–181. doi:10.1016/j.rse.2008.09.008
Sirguey, P., Still, H., Cullen, N. J., Dumont, M., Arnaud, Y., and Conway, J. P. (2016). Reconstructing the mass balance of Brewster Glacier, New Zealand, using MODIS-derived glacier-wide albedo. Cryosphere 10, 2465–2484. doi:10.5194/tc-10-2465-2016
Sorg, A., Bolch, T., Stoffel, M., Solomina, O., and Beniston, M. (2012). Climate change impacts on glaciers and runoff in Tien Shan (central Asia). Nat. Clim. change 2, 725–731. doi:10.1038/nclimate1592
Wang, J., Ye, B., Cui, Y., He, X., and Yang, G. (2014). Spatial and temporal variations of albedo on nine glaciers in Western China from 2000 to 2011. Hydrol. Process. 28, 3454–3465. doi:10.1002/hyp.9883
Wang, P., Li, Z., Schneider, C., Li, H., Hamm, A., Jin, S., et al. (2020). A test study of an energy and mass balance model application to a site on Urumqi Glacier No. 1, Chinese tian Shan. Water 12, 2865. doi:10.3390/w12102865
Wang, Z., Schaaf, C. B., Chopping, M. J., Strahler, A. H., Wang, J., Román, M. O., et al. (2012). Evaluation of Moderate-resolution Imaging Spectroradiometer (MODIS) snow albedo product (MCD43A) over tundra. Remote Sens. Environ. 117, 264–280. doi:10.1016/j.rse.2011.10.002
Wu, X., Xiao, Q., Wen, J., You, D., and Hueni, A. (2019). Advances in quantitative remote sensing product validation: Overview and current status. Earth-Science Rev. 196, 102875. doi:10.1016/j.earscirev.2019.102875
Yang, D., Kang, E., and Felix, B. (1992). Characteristics of precipitation in the source area of the Urumqi river basin. J. Glaciol. Geocryol. 14, 258–266.
Yue, X., Li, Z., Zhao, J., Fan, J., Takeuchi, N., and Wang, L. (2020). Variations in albedo and relationship with surface dust at Urumqi Glacier No.1 in Tien Shan, China. Front. Earth Sci. 8, 110.
Yue, X., Li, Z., Zhao, J., Li, H., Wang, P., and Wang, L. (2021). Changes in the end-of-summer snow line altitude of summer-accumulation-type glaciers in the eastern Tien Shan Mountains from 1994 to 2016. Remote Sens. 13, 1080. doi:10.3390/rs13061080
Yue, X., Zhao, J., Li, Z., Zhang, M., Fan, J., Wang, L., et al. (2017). Spatial and temporal variations of the surface albedo and other factors influencing Urumqi Glacier No. 1 in Tien Shan, China. J. Glaciol. 63 (24), 899–911. doi:10.1017/jog.2017.57
WGMS (2020). in Global Glacier change bulletin No. 3 (2016–2017). ISC(WDS)/IUGG(IACS)/UNEP/UNESCO/wmo. Editors M. Zemp, I. Gärtner-Roer, S. U. Nussbaumer, J. Bannwart, P. Rastner, F. Paulet al. (Zurich, Switzerland: World Glacier Monitoring Service), 274., publication based on database version:. doi:10.5904/wgms-fog-2019-12
Zemp, M., Hoelzle, M., and Haeberli, W. (2009). Six decades of glacier mass-balance observations a review of the worldwide monitoring network. Ann. Glaciol. 50, 101–111. doi:10.3390/s17061390
WGMS (2021). in Global Glacier change bulletin No. 4 (2018–2019). ISC(WDS)/IUGG(IACS)/UNEP/UNESCO/WMO. Editors M. Zemp, S. U. Nussbaumer, I. GärtnerRoer, J. Bannwart, F. Paul, and M. Hoelzle (Zurich, Switzerland: World Glacier Monitoring Service), 278., publication based on database version:. doi:10.5904/wgms-fog-2021-05
WGMS (2017). in Global Glacier change bulletin No. 2 (2014–2015). ICSU(WDS)/IUGG(IACS)/UNEP/unesco/wmo. Editors M. Zemp, S. U. Nussbaumer, I. GärtnerRoer, J. Huber, H. Machguth, F. Paulet al. (Zurich, Switzerland: World Glacier Monitoring Service), 244., publication based on database version:. doi:10.5904/wgms-fog-2017-10
Zhang, J., Li, X., Yang, R., Liu, Q., Zhao, L., and Dou, B. (2017). An extended kriging method to interpolate near-surface soil moisture data measured by wireless sensor networks. Sensors 17 (6), 1390.
Keywords: MODIS albedo, Tien Shan, ablation season, glacier, mass balance
Citation: Yue X, Li Z, Wang F and Li H (2023) Use of ablation-season albedo as an indicator of annual mass balance of four glaciers in the Tien Shan. Front. Earth Sci. 11:974739. doi: 10.3389/feart.2023.974739
Received: 21 June 2022; Accepted: 23 February 2023;
Published: 03 March 2023.
Edited by:
Bo Cao, Lanzhou University, ChinaReviewed by:
Kathrin Naegeli, University of Zurich, SwitzerlandSatoru Yamaguchi, National Research Institute for Earth Science and Disaster Resilience (NIED), Japan
Copyright © 2023 Yue, Li, Wang and Li. This is an open-access article distributed under the terms of the Creative Commons Attribution License (CC BY). The use, distribution or reproduction in other forums is permitted, provided the original author(s) and the copyright owner(s) are credited and that the original publication in this journal is cited, in accordance with accepted academic practice. No use, distribution or reproduction is permitted which does not comply with these terms.
*Correspondence: Huilin Li, lihuilin@lzb.ac.cn