Deformation localization and crack propagation of sandstone containing different flaw inclination angles under different loading rates
 Chengjin Li
 Lin Pan1
  Alma G. Galang
- 1Faculty of Civil Engineering and Architecture, Xinxiang University, Xingxiang, Henan, China
- 2Nueva Ecija University of Science and Technology, Cabanatuan City, Philippines
Defects with varying geometric distribution in the rock mass play a crucial role in determining the stability of engineered rock masses. Previous studies have primarily investigated the initiation, propagation, and coalescence behaviors of flaws within rock masses. Nevertheless, there has been limited analysis of flawed rock masses under different loading rates. In this study, we present the deformation localization and cracking process of three types of inclined flawed sandstone specimens through conducting uniaxial compression and acoustic emission tests at four different levels of loading rate. The results supported the following findings: 1) Sandstone specimens with different flaw inclination angles exhibit the loading rate strengthening effect, and the strengthening effect gradually decreases with the increase of loading rate. 2) As the loading rate increases, the type of crack emergence changes from wing cracks to anti-tensile cracks, and the time of flaw initiation is shortened. 3) The cumulative acoustic emission counts were higher for the low-loading rate specimens than for the high-loading rate specimens. 4) Tensile cracks typically occur as the initial cracks. Anti-tensile cracks often coexist with wing cracks in rock specimens that have undergone tensile damage. Coplanar secondary cracks are the primary indication of shear damage formation in rock specimens. 5) The increase in loading rate promotes the transition of rock specimens from the mixed tensile-shear damage mode to the shear damage mode. These research results are of great theoretical significance and engineering value for understanding the failure mechanism of rock mass containing flaws and proposing effective measures to prevent cracking and ensure the safety of brittle solid structures.
1 Introduction
With the increasing demand for energy, mining operations are now expanding into the deep parts of the earth. The environment in these deep rock formations is complex and variable, leading to significant rock mechanics challenges. Sandstone, a commonly encountered rock in mining processes, plays a crucial role in ensuring the safety and stability of mining projects due to its strength and deformation damage characteristics. Over time, various initial defects such as joints, fissures, weak surfaces, and microcracks are formed within the rock mass as a result of geological processes. These defects have a significant impact on the stability of the rock formations (Mouthereau et al., 2009). Understanding the mechanisms of deformation damage and crack initiation in rock bodies with inherent defects is essential for assessing the safety and stability of rock engineering projects. Throughout the history of rock engineering, numerous accidents have occurred due to the extension penetration of rock fissure defects, leading to failures in bearing capacity. Prominent examples include the Malpasset dam failure in France (Cao et al., 2016) and the Vaiont slope slide phenomenon in Italy (Rossmanith, 1983). Therefore, studying the change characteristics of rock mechanical properties in prefabricated flaws, the evolution of crack propagation, and the damage modes is of utmost importance for ensuring the safe construction of projects and enabling the prediction and early warning of disasters.
In recent years, there have been several studies conducted on prefabricated flawed rock masses at the laboratory scale. Wang et al. (2020) examined the propagation pattern of a pair of parallel colinear cracks. Wong and Einstein (2009a) investigated the damage processes and modes of sandstone specimens with two different geometrical defects under uniaxial compression. Eftekhari et al. (2016) explored the damage pattern and mechanical properties of flawed rocks by the finite element method (XFEM). Park et al. (Park and Bobet, 2009; Park and Bobet, 2010) prefabricated flaws of different geomtries on rock-like specimens and summarized three different types of cracks. Modiriasari et al. (2017) prefabricated two parallel cracks on the specimen and investigated the variation of the displacement field on the surface of the specimen by using digital image correlation (DIC) techniques. Mohammad et al. (Mehdi et al., 2017; Mohammad et al., 2018; Cemiloglu et al., 2023) utilized AI image processing algorithms for rock structure detection and rock mass definition in both 2D and 3D space, using the Mathematica software package. Similar studies were also conducted by Richardson et al. (2011), Reis et al. (2015), and Taheri et al. (2020). These research findings have significantly contributed to the knowledge and understanding of engineering rock damage.
With the advancement of science, the means of monitoring rock crack propagation in the laboratory are becoming more and more advanced, and the most commonly used techniques are digital image processing methods (Sun et al., 2016; Mousa, 2017) and acoustic emission monitoring techniques (Ohno and Ohtsu, 2010; Aggelis, 2011). Shkuratnik and Novikov (2012) used acoustic emission methods to study the progressive damage process of rocks under different confining pressures. Zhigalkin et al. (2011) used the acoustic emission methods to study the effect of aggregate size and shape in concrete on the uneven shrinkage of concrete. Eberhardt et al. (1998) studied the acoustic emission characteristics of rock specimens during cracking and concluded that a sudden increase in acoustic emission events corresponds to the creation of new cracks. Song et al. proposed the concept of compaction factor and permeability influence factor for limestone under uniaxial compression (Song et al., 2022). Bhuiyan et al. (2018) used acoustic emission (AE) techniques to probe the crack expansion process in aluminum panels. Wen et al. (2019) explored the mechanical properties of rocks with different lithology from an energy perspective. Similar studies have been conducted by Song et al. (2019), Poddar and Giurgiutiu (2017), and Kumari et al. (2018).
In the context of rock loading rates, several studies have explored the impact of different strain rates on shale fracture toughness and energy release rates. Mahanta et al. (2016) investigated this effect, while Zhang et al. (2000) focused on studying fracture damage patterns and energy characteristics of rocks under various loading rates. Trepmann and Seybold (2018) developed a model to analyze the effects of high-temperature action and different strain rates on quartz crystals. Additionally, Wang et al. (2021) considered the influence of inclination angle and strain rate on the mechanical properties of fractured rock masses using rock-like materials, and observed that the compressive strength of rock-like specimens was rate-enhanced. Tang et al. (2015) specifically examined the effect of loading rate on crack initiation and propagation mode. Furthermore, Wong and Einstein (2009b) investigated the macroscopic and microscopic damage mechanisms of rock-like specimens under the influence of loading rate. These findings provide a solid foundation for further research on the influence of loading rate on rock mechanical properties. Currently, most of the photographic monitoring techniques are used for observing crack propagation. However, it is important to note that crack evolution is three-dimensional, and traditional methods are limited in their ability to quantitatively characterize the rupture process. As a result, the acoustic emission testing technique has gained popularity in crack nondestructive testing and damage assessment. This technique allows for real-time, dynamic, and continuous monitoring of the crack generation and propagation within the rock mass, making it an effective metric method. By combining digital image processing methods and acoustic emission monitoring techniques to investigate the damage process and damage pattern of the flawed specimens in this test.
Most studies have investigated the effects of various geometric fracture parameters on the strength damage characteristics and crack evolution of rock-like materials under single loading conditions. However, the change in rock loading rate induced by engineering construction, loading, tectonic extrusion, etc. also significantly impacts the propagation of cracks and damage modes in cracked rocks (Mahanta et al., 2016). Unfortunately, little research has been conducted in this area. Therefore, in this paper, sandstone, which is commonly used in rock engineering, is taken as the object of study. Flaws are prefabricated on the specimens, and high-speed photography and acoustic emission monitoring technology are used to observe the uniaxial compression damage process. The effects of different loading rates on the mechanical properties of specimens with different crack angles and the modes of crack propagation and penetration are analyzed. Explored the failure mechanics mechanism of cracked specimens during uniaxial compression. The findings of this study can provide a theoretical basis for understanding the deformation and damage mechanism within engineered rock masses and the stability analysis of surrounding rocks under different loading rates.
2 Overview of the test
2.1 Test specimen preparation and program
Engineered rock masses often contain various types of structural surfaces that greatly influence rock stability. In recent years, the stability of engineering rock masses and disaster prevention and control have gained increasing attention due to the rapid development of civil engineering, transportation engineering, mining engineering, water conservancy engineering, and other rock engineering fields. This study focuses on investigating the mechanical properties and damage behavior of rocks under different flaw inclinations through uniaxial compression tests on sandstone. The rock specimens used in this study were obtained from an open pit mine, which aligns with the engineering background of the analysis on rock engineering destabilization damage, as shown in Figure 1.
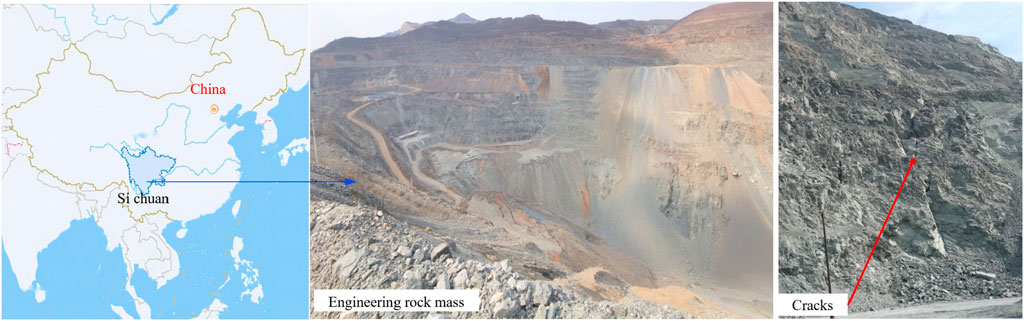
FIGURE 1. Sources and mineral component of tested sandstone.
The test sandstone was collected from the outcrops of Zhongliangshan mine in Huaying Mountain. It belongs to the Upper Permian Longtan Formation, Changxing Formation, and Triassic Xilingjiang Formation. The tested sandstone is a medium-grained cemented sedimentary rock with a grain size ranging from 0.15 to 0.25 mm. In its natural state, the sandstone appears light gray, with an apparent density of 2,428 kg/m3.
Raw rock specimens were prepared according to the specifications and protocol outlined by the International Society of Rock Mechanics for testing the physical and mechanical properties of rocks. To ensure consistent results, rock samples were obtained from the same location, ensuring their integrity, and transported to the laboratory. These samples were then processed into standard rectangular specimens measuring 50 mm × 100 mm × 30 mm. Care was taken to control any non-parallelism and non-perpendicularity on each surface, with a maximum tolerance of 0.02 mm. Flaws were introduced using the center drilling method. The test involved different loading rates of 0.05, 0.1, 0.5, and 1.0 mm/min, with a total of 24 batches of specimens for each loading rate. Each batch included flaw specimens with inclination angles of 30°, 45°, and 60°, resulting in a total of 72 test samples. The flaw inclination angle (α) represents the angle between the flaw and the horizontal plane, while the flaw length (a) and flaw width (d) remained constant at 10 and 1 mm, respectively. Each specimen is named based on its flaw angle and loading rate, such as 30°-0.05 indicating a specimen with a flaw inclination of 30° and a loading rate of 0.05 mm/min. The flaw spreading pattern in the flawed specimen is illustrated in Figure 2.
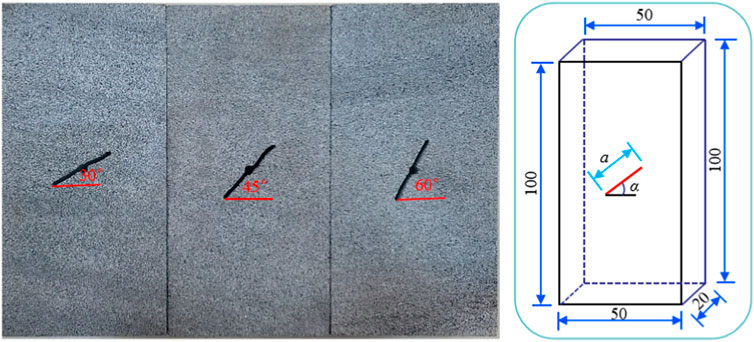
FIGURE 2. Test model of flaw specimens (unit: mm).
2.2 Test system and loading conditions
To prepare for the test, the specimens were dried at a temperature of 105 °C for 12 h. A high-speed camera was used to track the initiation and propagation process of cracks on the specimen surface. The high-speed camera was set to shoot at a frame rate of 60 fps. The loading equipment used was a TAW-2000 micro-controlled electronic universal testing machine. The acoustic emission monitoring equipment used was model PCI-II, manufactured by the United States acoustic physics company PAC. The probe arrangement is shown in Figure 3. The loading method followed the rate set in Section 1.1. The experimental test system is depicted in Figure 3.
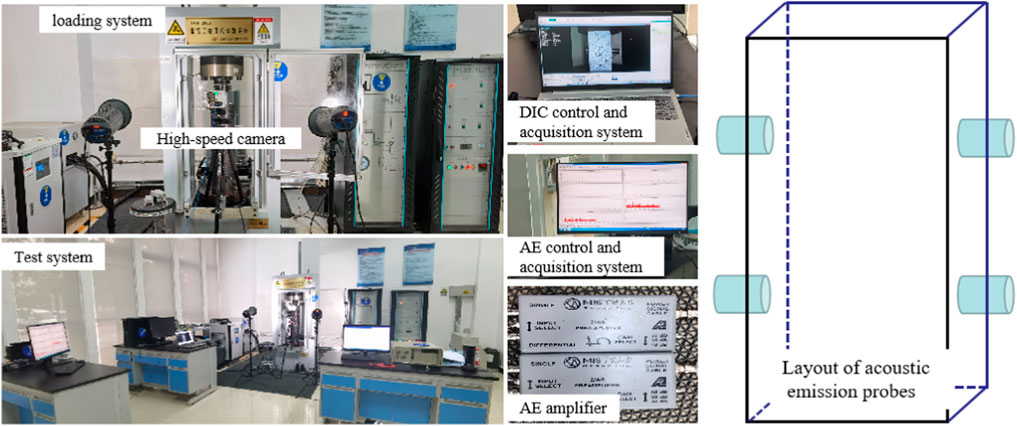
FIGURE 3. Layout diagram of the experimental testing system.
3 Mechanical properties of flawed sandstone
3.1 Load-displacement curves
The load-displacement curves of the flawed specimens are presented in Figure 4, illustrating the influence of different loading rates. Specifically, Figures 4A–C depict the effect of loading rate on the flawed specimens with flaw inclination angles of α=30°, 45°, and 90° respectively. On the other hand, Figure 4D demonstrates the impact of flaw inclination angle on the load-displacement curves of the specimens, while maintaining a constant loading rate of v = 0.05 mm/min.
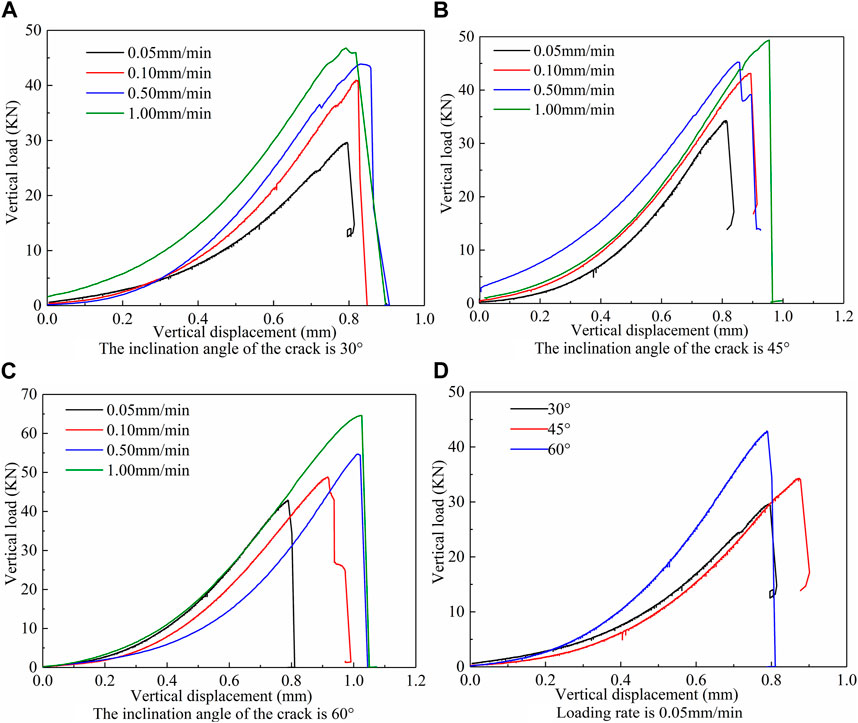
FIGURE 4. Load-displacement curve.
As shown in Figure 4, the load-displacement curves of the specimens exhibit four distinct stages: compaction, elasticity, yielding, and damage, which align with the typical characteristics of classical rock mechanics load-displacement curves. During the crack compaction stage, the axial load compacts the original pores within the specimen. Over time, the displacement of the specimen increases without any significant change in stress, resulting in a fluctuating curve during the preloading period. It should be noted that only the micropores inside the specimen are compacted at this stage, while the pre-existing flaws remain uncompacted and open. As the load continues to increase, the specimen enters the elastic deformation stage, characterized by a steady increase in load with displacement, following the linear growth predicted by the generalized Hooke’s law. With further load increase, the compression process of the specimen transitions to the yield stage, where the rate of load increase reduces and the curve exhibits an upward convex shape. During this stage, the specimen’s deformation gradually shifts from elastic to elastic-plastic mixed deformation. Simultaneously, the specimen accumulates internal elastic energy, and once this energy, along with the plastic deformation, exceeds the specimen’s limit, micro-cracks propagate throughout the specimen, leading to the appearance of macro-cracks on the surface. Consequently, the specimen’s stress dramatically decreases, resulting in overall destabilization and damage. This marks the onset of the post-peak damage phase in the load-displacement curve.
3.2 Analysis of strength and deformation behaviors of sandstone specimens
Figure 5A illustrates the relationship between the curves of peak strength and loading rate for sandstone specimens with different flaw inclination angles. The peak strengths of these specimens demonstrate similar strengthening effects under the influence of loading rate. However, it is important to note that the change in peak strength is non-linear, and the strengthening effect gradually diminishes as the loading rate increases. For instance, when examining the sandstone specimen with a flaw inclination angle of 45°, the peak strength increased from 34.25 KN to 43.14 KN, 45.24 KN, and 49.38 KN as the loading rate increased from 0.05 mm/min to 1.0 mm/min. The corresponding strength increments were 8.98 KN, 2.1 KN, and 4.14 KN, respectively. The reinforcing effect was primarily observed within the range of 0.05–0.10 mm/min, with an overall weakening trend beyond 0.10 mm/min.
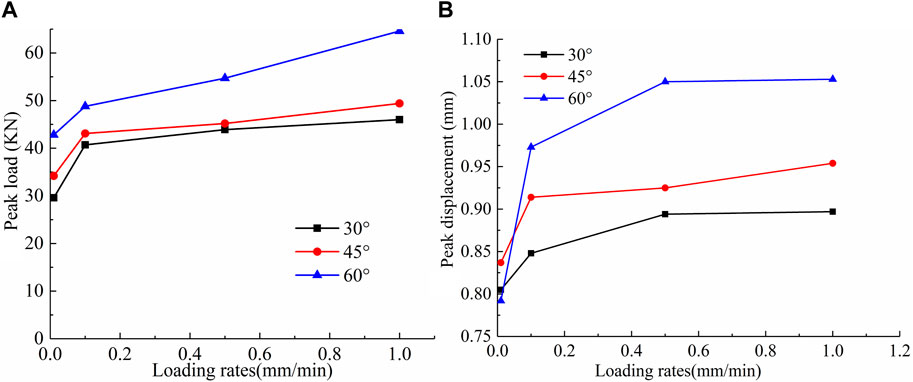
FIGURE 5. Relationship between peak load and peak displacement with loading rate. (A) Peak load, (B) Peak displacement.
The peak displacement versus loading rate curves for sandstone specimens with different flaw inclination angles are shown in Figure 5B. The peak displacement is positively correlated with the loading rate, meaning that the displacement increases as the loading rate increases until it reaches its peak strength. The curve enters the surge phase when the loading rate increases from 0.01 mm/min to 0.1 mm/min. Beyond a loading rate of 0.1 mm/min, the slope of the curve decreases, indicating a slower growth in peak displacement. However, there is still a positive linear correlation between peak displacement and loading rate, highlighting the interval nature of the loading rate. Figure 5B also demonstrates that as the flaw inclination angle α increases, there is some degree of dispersion in the specimen’s peak displacement, but the overall trend is an increase with α.
In addition, the interval of the loading rate effect is obvious, but because the loading rate of this test is only set to 0.01 mm/min, 0.1 mm/min, 0.5 mm/min, 1.0 mm/min, these four levels, in order to more comprehensively and accurately obtain the characteristics of the interval of the loading rate effect, the subsequent study should be added to increase the range of variation of the loading rate and the defect angle for in-depth discussion.
4 The correspondence between crack propagation and stress and AE counts
4.1 Correspondence between crack propagation and load-displacement curve
The load-displacement curves reflect the crack development and propagation of the flawed specimens. Typically, the development of cracks leads to abnormal fluctuations in the curves. In this section, we analyze the relationship between crack propagation and load-displacement curves using typical specimens with different loading rates. These specimens have a flaw inclination angle of 30°, as shown in Figures 6A–D.
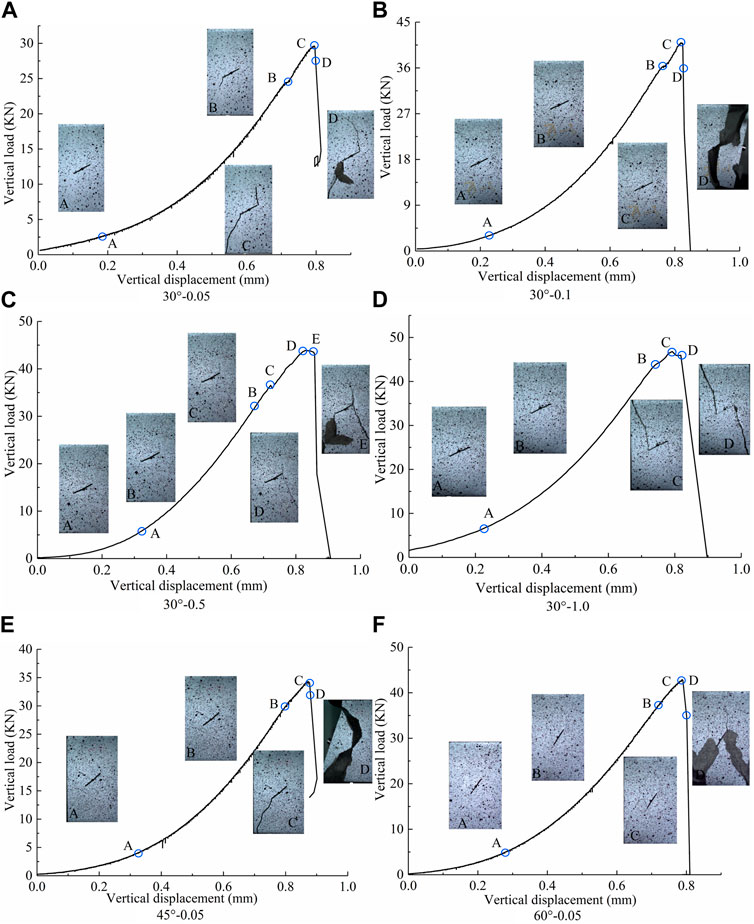
FIGURE 6. Relationship between flaw growth and stress-strain curves in typical specimens.
The load-displacement curves and crack propagation of the specimen tested at a speed of 0.05 mm/min are shown in Figure 6A. The damage process of the specimen can be divided into two stages: compaction and elastic deformation. During these stages, no crack initiation was observed at the tip of the prefabricated flaws. The increase in displacement is primarily due to the compaction of the primary microcracks in the rock samples, which reduces the voids and prepares for the development of microcrack nucleation. As the loading increases, the curve experiences a stress drop at point B, leading to cracking at the tip of the cracks in the rock samples and the formation of tensile wing cracks. The load then slightly decreases before continuing to increase with displacement. At peak point C, the wing crack transforms into a secondary crack that penetrates the lower end face of the specimen, while a wing tensile crack appears at the upper tip of the prefabricated flaw. Upon reaching point D, the wing crack further evolves into a non-coplanar secondary crack and rapidly propagates through the upper-end face of the specimen. This leads to surface dislodgement from the rock and a loss of load-bearing capacity, resulting in overall destabilization damage.
The load-displacement curves and crack propagation of the specimen with a displacement rate of 0.1 mm/min are shown in Figure 6B. The crack propagation process of this specimen is similar to that of the specimen with a displacement rate of 0.05 mm/min. It exhibits a small load drop before reaching the peak, which is accompanied by crack initiation or rapid crack propagation. At point B, a winged tensile crack is initially formed near the prefabricated flaw of the specimen. As the load reaches the peak point C, there is a significant stress drop and rapid propagation of the winged tensile cracks on the surface of the specimen. When the load reaches point D, the overall structural damage occurs as the tensile cracks penetrate through the upper and lower surfaces of the specimen, ultimately causing the specimen to be crushed.
The load-displacement curves and crack propagation of the v = 0.5 mm/min specimen are illustrated in Figure 6C. The crack propagation process of the specimen is similar to that of Figures 6A, B. In both cases, a small load drop occurs before reaching the peak, accompanied by crack initiation or rapid crack propagation. At point C, a winged tensile crack and an anti-tensile crack are initially formed near the prefabricated flaw of the rock specimen. As the load reaches the peak at point D, the winged tensile cracks and anti-cracks on the surface of the specimens transform into secondary cracks. The curves show that there is no instantaneous load drop at the peak. When the load reaches point E, there is a sudden large drop in load. The tensile crack penetrates through the upper and lower surfaces of the specimen, causing the rock sample to fail as a whole, and resulting in the ejection of some fragments.
The load-displacement curves and crack propagation of the specimen with a displacement rate of 1.0 mm/min are shown in Figure 6D. The crack propagation process of this specimen follows a similar pattern as the one with a displacement rate of 0.5 mm/min, with no temporary decrease in load at the peak. At the peak point C, an anti-tensile crack initially forms near a pre-existing flaw in the specimen and then continues to propagate through the upper-end face. As the load reaches point D, there is a sudden significant drop, and the tensile crack transforms into a non-coplanar secondary crack, which penetrates both the upper and lower end surfaces of the specimen, resulting in failure of the rock sample’s bearing capacity.
The load-displacement curves and crack propagation of the specimen with a loading rate of 1.0 mm/min and an angle of 45° (α=45°) are presented in Figure 6E. The damage process of this specimen is similar to that of the specimen with an angle of 30° (α=30°), undergoing compaction stage and elastic deformation stage. However, unlike the α=30° specimen, no crack sprouting is observed at the tip of the prefabricated flaw in the α=45° specimen. The increase in displacement mainly originates from the compaction of the native microfractures in the specimen. The key difference is that there is no small decrease in load before reaching the peak. Upon reaching the peak point C, there is an instantaneous stress drop in the curve, leading to the generation of tensile wing cracks at the flaw tip. As the load reaches point D, the wing cracks rapidly propagate and merge with newly sprouted shear cracks, resulting in the formation of macroscopic through cracks. This leads to the compaction of the prefabricated flaws and the overall crushing of the rock samples, accompanied by bursting sounds.
The load-displacement curves and crack propagation of the specimen with a velocity of 1.0 mm/min and an angle of 60° (α=60°) are presented in Figure 6F. The destructive process of these specimens is similar to that of the sandstone specimens with an angle of 30° (α=30°). As the load increases, a stress drop occurs at the peak C point, leading to the formation of anti-tensile cracks at the crack tip of the rock sample. When the load reaches point D, these anti-tensile cracks rapidly propagate and merge with newly formed non-coplanar secondary cracks, resulting in the formation of macroscopic cracks that quickly penetrate the surface of the specimen. The stress value decreases to zero instantaneously, indicating the strong brittle characteristics of the specimen.
The analysis above demonstrates that the loading rate has an impact on the fracture extension and damage pattern of the rock specimens. Comparing Figures 6A–D, it can be observed that the type of crack generation changes from wing cracks to anti-tensile cracks as the loading rate increases. The crack initiation time is shortened, and the damage mode shifts from tensile shear damage to shear damage. Furthermore, by comparing Figures 6A, E, F, it becomes evident that the prefabricated flaw inclination angle significantly influences the crack initiation location, propagation path, and damage mode of the specimen. Notably, the 30° specimens exhibit a significant stress drop at the peak front, while the 45° and 60° specimens do not show a significant stress drop at the peak front. All cracks are initiated at the tip of the prefabricated flaws, and they are generated at the peak.
4.2 Correspondence between AE counts and load-displacement curve
The acoustic emission (AE) information not only provides insight into the mechanical properties of the rock, but also offers valuable information about the internal damage evolution. The point at which there is a sudden change in the AE event, resulting from crack propagation penetration during loading, can be considered as the point of specimen destabilization. AE counts indicate the magnitude of AE activity, while the cumulative ring count curve reflects the progression of damage in the specimen. In this section, we analyze the correlation between crack evolution at the crack tip and the load-displacement and ring counting parameters using a specimen with a flaw inclination angle of 60°, as shown in Figure 7. The acoustic emission test and the uniaxial compression test are conducted simultaneously, with time serving as the link between the two. The test equipment measures time in seconds, therefore the horizontal coordinates in Figure 7 represent seconds, which can be converted to minutes if desired.
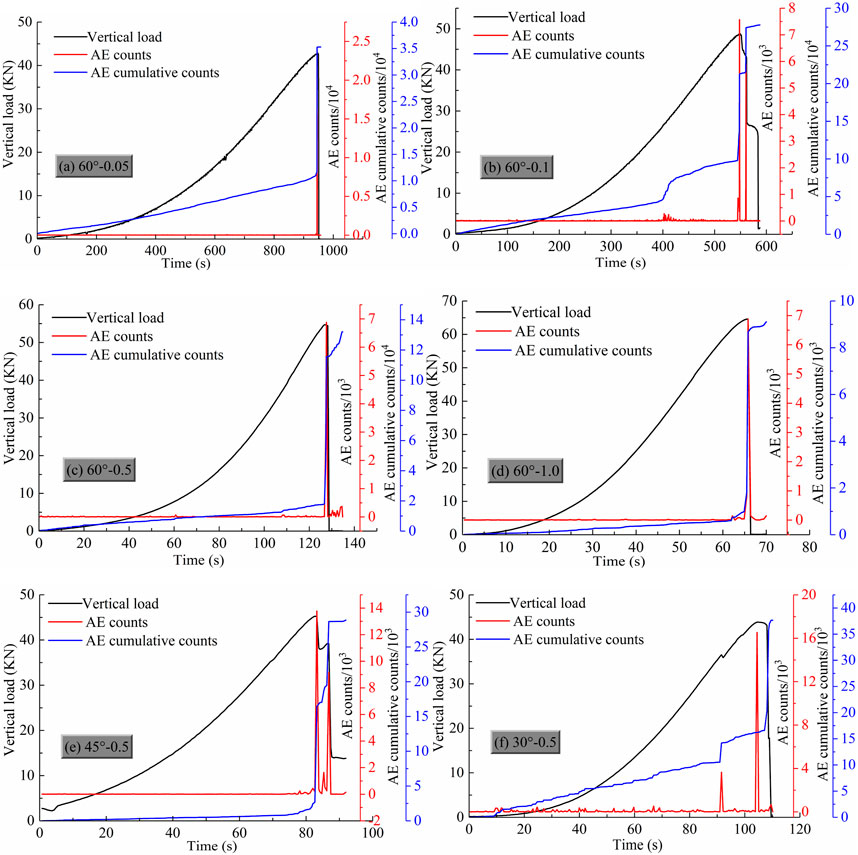
FIGURE 7. Load-acoustic emission count-strain curves of flawed specimens (α = 60°) at different loading rates.
The distribution characteristics of the AE counts and the AE cumulative counts of the flawed specimens (with α=60° as an example) at different loading rates (0.05–1.0 mm/min) are shown in Figure 7. From Figures 7A–D, it can be seen that different loading rates lead to significant differences in the AE count versus load-time curves. The test was able to record more AE counts from the specimen at a loading rate of 0.05–0.1 mm/min. As the loading rate increases, especially when the loading rate is 1.0 mm/min, the number of AE events recorded in the test decreases, as shown in Figure 7D. The author believes that this should be attributed to the volumetric deformation caused by the crack propagation and particle rearrangement of the specimen under load, while the formation of the crack and particle rearrangement need time to accumulate. At low loading rates, defects within the specimen as well as prefabricated flaws have enough time to propagate slowly, and both larger and smaller cracks within the specimen undergo misalignment and propagation, are more fully developed, and have a larger amount of damage, and therefore more AE events are recorded. At high loading rates, the time for crack development and particle rearrangement is reduced, and the internal defects and prefabricated flaws within the specimen do not have time to undergo full development, and only the larger cracks undergo misalignment and propagation, with a reduced amount of damage, and therefore fewer AE signals are received. This is further characterized by the distribution of the cumulative acoustic emission counts of the fracture specimens at different loading rates, i.e., the cumulative acoustic emission counts of the specimens with low loading rates tend to be higher than those of the specimens with high loading rates at the same moments, especially at the pre-loading stage.
Figure 7 demonstrates that the AE count variation curve, similar to the load-displacement curve of the rock, can indicate the initiation, propagation, and penetration of cracks in the specimen. The significant drop in load and apparent futility of the AE cumulative counting curve indicate the initiation or rapid propagation of cracks in the specimens. The accompanying AE ringing counts are higher when a stress drop occurs at a higher stress state (near the stress peak). The distribution of AE ringing counts in rock specimens is influenced by the inclination angle of flaws. In rock samples with smaller inclination angles, the AE ringing counts increase at the peak stress. However, when the inclination angle exceeds 45°, the AE ringing counts increase before the peak stress, as shown in Figures 7E,F.
5 Analysis of crack evolution and failure modes in flawed rock specimens
Based on the existing results of uniaxial compression tests on flawed rock specimens, it is found that the crack distribution under uniaxial conditions is mainly wing cracks of tensile properties and secondary cracks of shear properties (Cheng et al., 2016). Cracks with tensile properties can be further divided into wing cracks and anti-tensile cracks, while cracks with shear properties can be further divided into coplanar secondary cracks, non-coplanar secondary cracks, and transverse cracks (Zhou et al., 2019). The type of crack initiation under uniaxial conditions is shown in Figure 8.
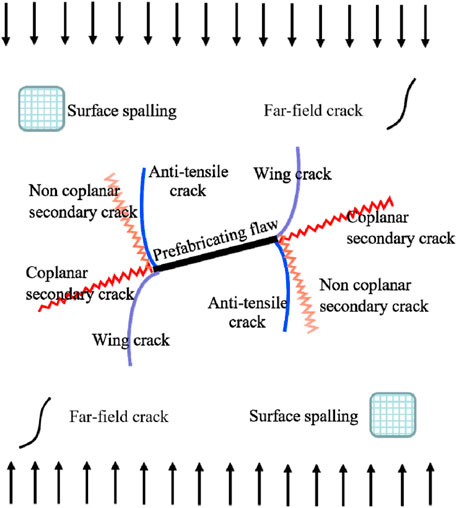
FIGURE 8. Crack initiation type (BOBET, 2000).
5.1 Crack propagation type
The crack evolution characteristics of specimens with different crack inclination angles under the influence of loading rate are depicted in Figure 9. The black line represents wing tensile cracks or anti-tensile cracks related to tensile properties, while the blue line represents shear cracks, including coplanar secondary cracks, non-coplanar secondary cracks, and transverse cracks. The numbers 1 to 6 in the diagram indicate various types of cracks commonly observed under uniaxial compression. The letter T denotes tensile cracks, and the letter S represents shear cracks. Based on Figure 8, it is evident that the structural instability damage in the flawed sandstone arises from the combined damage of multiple crack types. Additionally, the variation in crack inclination angle and loading rate does have some influence on the combination of crack types.
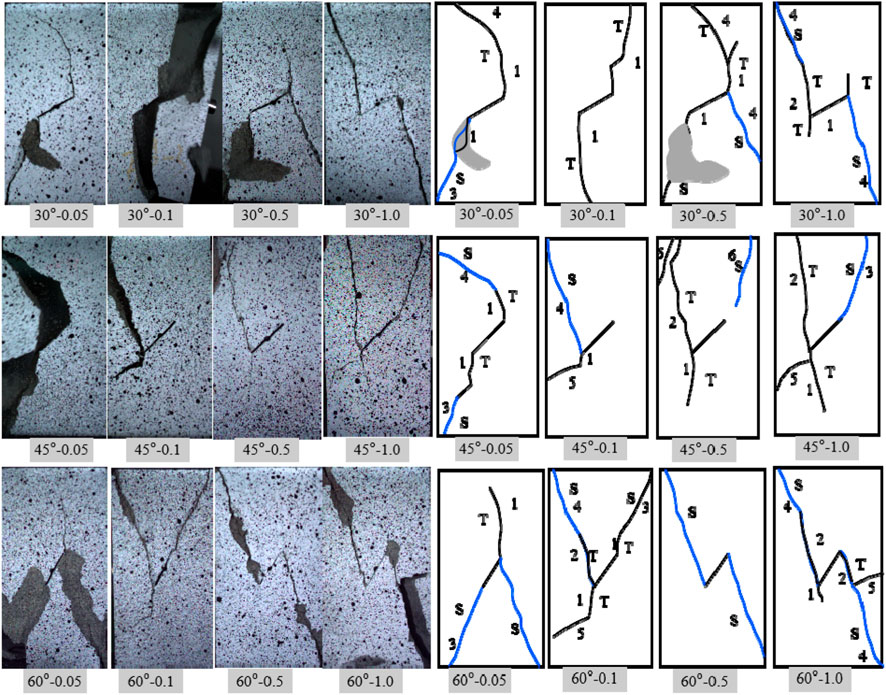
FIGURE 9. Crack propagation in specimens. 1-wing crack; 2 -anti tensile crack; 3 -coplanar secondary crack; 4 -non-coplanar secondary crack; 5 -transverse 329 crack; 6 -far-field crack; T -tensile property; S -shear property.
The analysis of Figure 9 reveals that rock specimens often exhibit a combination of multiple crack types. For instance, the 30°-1.0 rock specimen demonstrates various types of damage, including wing cracks, anti-tensile cracks, and secondary cracks, with a noticeable shear pattern. The characteristics of these crack types can be summarized as follows: Tensile cracks are typically the initial cracks observed in flawed specimens at all inclination angles, with wing cracks being the dominant macroscopic manifestation. However, it is important to note that tensile cracks are often not the ultimate cause of specimen failure. On the other hand, the 60°-0.1 rock specimen experiences the development and evolution of wing cracks and anti-tensile cracks into coplanar and non-coplanar secondary cracks under increasing stress, ultimately resulting in shear damage. Anti-tensile cracks, which frequently accompany wing cracks in tensile damaged rock specimens such as the 30°-1.0, 45°-1.0, and 60°-1.0 specimens, rarely occur independently and serve as the primary macroscopic crack in the specimens. Shear damage formation is mainly characterized by coplanar secondary cracks, which are more prevalent in α = 30° specimens like the 30°-0.05 and 30°-0.1 specimens. On the other hand, non-coplanar secondary cracks are more frequent in α = 30° specimens, such as the 60°-0.1, 60°-0.5, and 60°-1.0 specimens. Additionally, when α = 45°–60°, transverse cracks originating from the tip of the prefabricated flaw and propagating perpendicular to the stress loading direction are observed in the specimens, such as the 45°-0.1 and 60°-1.0 specimens.
According to Figure 9, the type of crack initiation in the specimens is also influenced by the loading rate. For instance, in α=30° sandstone specimens, at low loading rates (v = 0.05–0.1 mm/min), the prefabricated flaw tip initially generates wing cracks under loading. As the stress increases, these wing cracks transform into secondary cracks or are replaced by other secondary cracks. As the loading rate increases, the dominant macroscopic cracks in the specimens gradually shift to anti-tensile cracks, which directly impact the final damage pattern. For example, when v = 0.5 mm/min, the main manifestation of cracks becomes a combination of wing cracks and anti-tensile cracks. At the highest loading rate, v =1.0 mm/min, anti-tensile cracks form on the surface of the specimens and continuously expand, leading to the destabilization and destruction of the specimens. These cracks exhibit clear tensile-shear characteristics.
5.2 The ultimate failure mode
Three primary modes of damage, namely, tensile, shear, and mixed tensile-shear, were observed in the flaw specimens under uniaxial conditions. According to literature (Liu et al., 2015), the destruction modes of the specimens can be categorized into nine types, as illustrated in Figure 10. The tensile damage can be further classified into four categories: TⅠ, TⅡ, TⅢ, and TⅣ. TⅠ represents the damage caused by the formation of the main crack due to the upper and lower penetration of the wing crack. TⅡ refers to the damage caused by the penetration of the anti-tensile crack. TⅢ represents the damage caused by the upper and lower penetration of two types of tensile cracks. TⅣ denotes the damage caused by the joint damage with cracks on one side of the specimen. The shear damage can be categorized into three types: SⅠ, SⅡ, and SⅢ. SⅠ represents the damage caused by coplanar secondary crack penetration. SⅡ refers to the damage caused by non-coplanar secondary crack penetration. SⅢ denotes the damage caused by the mixed penetration of the two secondary cracks with an X-shaped distribution in the final specimen. The mixed tension-shear damage can be further divided into two types: MⅠ and MⅡ. MⅠ represents the penetration of an anti-tensile crack with a coplanar secondary crack, while MⅡ refers to the penetration of a wing crack with a coplanar secondary crack.
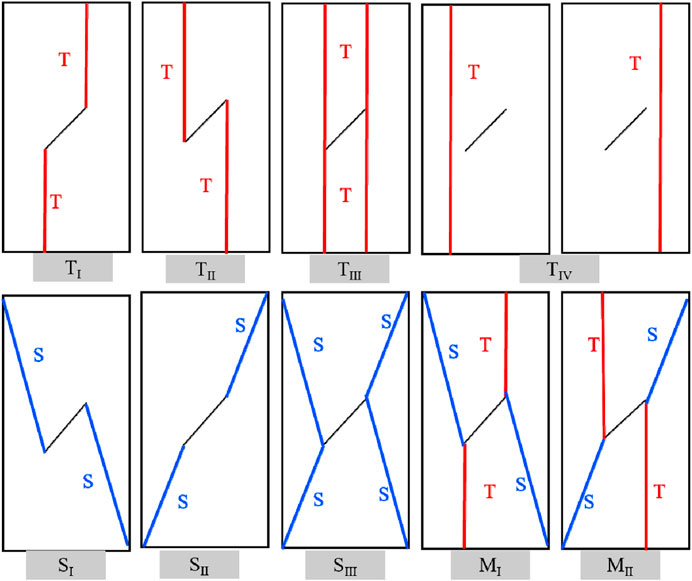
FIGURE 10. Damage pattern of the flawed specimen under uniaxial condition.
According to the results of the damage mode classification in Figure 10, it is observed that the sandstone specimens with a flaw inclination angle α=30° exhibit sequential damages of MⅡ, TⅠ, TⅡ, and SⅠ under different loading rates. Similarly, specimens with α=45° display damages of MⅡ, SⅠ, TⅢ, and TⅡ. On the other hand, specimens with α=60° demonstrate damages of MⅡ, SⅢ, SⅠ, and TⅠ. At α =30° and 45°, the main damage observed in the specimens is M-type damage. However, as the inclination angle α increases, the damage mode transitions to shear damage. For instance, when α = 60°, the damage mode tends to be S-type damage. The loading rate significantly influences the damage pattern of the specimens. For specimens with α =30° and 60°, at lower loading rates (0.05 mm/min), the specimens exhibit noticeable mixed tensile-shear damage modes. As the loading rate increases, such as v = 0.1–0.5 mm/min, shear-type damage modes become the predominant choice for the specimens. When the loading rate reaches the highest level (1.0 mm/min), the damage characteristics of the specimens shift to pure shear S-type damage. Hence, it can be observed that an increase in the loading rate leads to a transition of the specimens from the mixed tensile-shear damage mode to the shear damage mode.
6 Discussion
This section investigates the mechanism of crack propagation under uniaxial action using fracture mechanics theory. In the mechanical model depicted in Figure 11, the crack angle (α) with respect to the horizontal plane is considered under axial stress (σ1). The force acting on the crack surface can be divided into shear stress (τn) parallel to the crack surface and normal stress (σn) perpendicular to the crack surface. The mathematical expression for this decomposition is as follows:
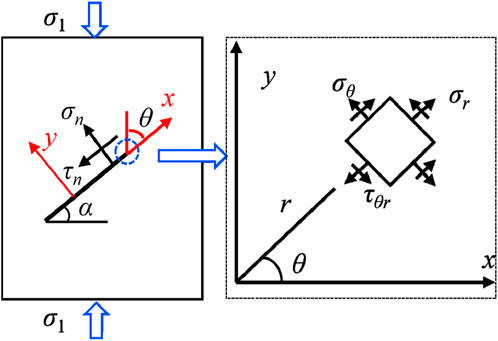
FIGURE 11. Mechanical model of crack propagation under uniaxial compression conditions.
In Eq. 1, the positive or negative of σn determines the tensile and compressive state of the vertical stress on the crack surface; σn > 0, indicating tensile stress; σn < 0, indicating compressive stress. According to the two-dimensional fracture mechanics theory, the approximate value of the stress intensity factor at the tip of a crack of length 2a on an infinite body plane under uniaxial compression is (Li et al., 2003):
Where: KI is the type I stress intensity factor of the crack tip, and KII is the type II stress intensity factor of the crack tip.
In Figure 11, the crack tip initiation equation can be solved in polar coordinates, and each stress component can be represented as:
According to the maximum circumferential tensile stress criterion, it can be seen that the maximum direction of the circumferential stress σθ determines the direction of crack initiation, and the direction of crack initiation satisfies the condition:
By combining formulas 3 and 4, it can be obtained that:
The condition for crack initiation propagation is σθmax=σθc. σθc is the maximum circumferential stress critical value, and σθc can be determined by the rock type I fracture toughness KΙc, i.e.,
The approximate values of KI and KII are:
The crack initiation moment was recorded using a high-speed camera during the test. The crack initiation stress was then determined based on the load-displacement curve. The initiation stress was substituted into formula (7) to calculate the stress intensity factors KI and KII at the crack tip. By substituting KI and KII into formula (6), the crack initiation angle θ0 (Khaji and Fakoor, 2022) was obtained. The calculation results are presented in Table 1. The comparison of the theoretical calculation results with the test results showed consistency within an acceptable range of error. This further confirms the feasibility and reasonableness of the test results presented in this paper.
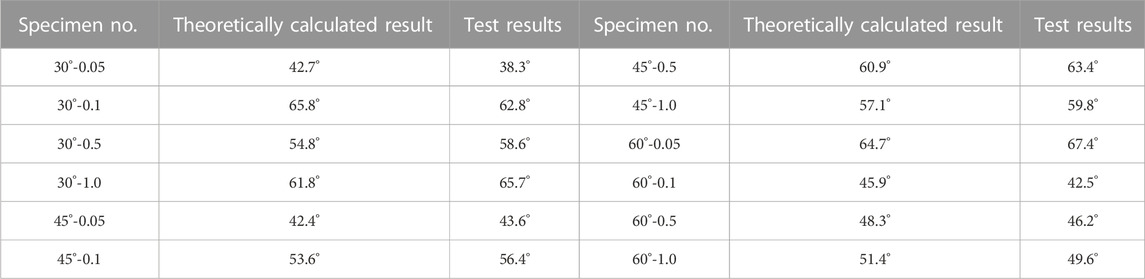
TABLE 1. Theoretical value and test comparison of crack initiation angle.
The discussion in this article primarily revolves around the crack initiation angle as a linkage. By comparing the theoretically calculated values with the experimental test values, it was found that the error fell within the acceptable range. This validates the accuracy and validity of the test methods used in this study. The types of cracks observed in this article align with the classification mentioned in literature (BOBET, 2000; Cheng et al., 2016; Zhou et al., 2019). However, the article also presents conclusions regarding the damage pattern and mechanical properties of the specimens under different loading rates.
7 Conclusion
In conclusion, our research findings contribute to the field of rock samples health assessment through the use of image processing techniques. The main takeaways from our study include the successful application of image processing algorithms to analyze rock samples and identify potential health issues. We have demonstrated the effectiveness of these techniques in accurately detecting cracks, fractures, and other anomalies in the rock samples. This advancement in rock samples health assessment can greatly benefit industries such as mining and construction, as it enables early identification of potential structural weaknesses and improves safety measures. Furthermore, our research opens up new possibilities for further exploration and development of image processing techniques in the field of geology and rock mechanics. The main conclusions of this paper are as follows:
(1) The sandstone specimens with varying flaw inclination angles exhibited a strengthening effect under different loading rates. The change in peak strength was non-linear, as the strengthening effect gradually decreased with increasing loading rate. In particular, the 30° specimens displayed a noticeable stress drop before reaching the peak, whereas the 45° and 60° specimens did not exhibit such a drop.
(2) The AE cumulative counts are higher for the low-loading rate specimens than for the high-loading rate specimens. In specimens with smaller dip angles, the AE count increases at the peak stress, while the dip angle is greater than 45°, and the AE ringing count increases before the peak stress.
(3) Damage to specimens consists of a combination of crack types. Tensile cracks are generally the first to appear, and wing cracks are their dominant macroscopic manifestation. Anti-tensile cracks are a special type of tensile cracks, often accompanied by wing cracks in tensile-damaged specimens, and coplanar secondary cracks are the main manifestation of the formation of shear damage in specimens.
(4) With an increase in the inclination angle of flaws, the damage mode of specimens transitions to shear damage. At lower loading rates, the specimens exhibit a distinct mixed tensile-shear damage mode. However, as the loading rate increases, the specimens predominantly experience shear damage.
While this study has yielded several valuable conclusions, there are a few limitations that should be noted. Firstly, it is important to acknowledge that the mechanical properties of rocks are significantly influenced by the loading rate shadow, and this effect exists within a certain range. Therefore, it would be beneficial to conduct multi-stage loading experiments within each level of strain rate in the static loading category. Additionally, further investigation into the loading rate effect within a narrower range of variation would be worth exploring in future research. Secondly, it is worth mentioning that this study focused solely on the mechanical properties, acoustic emission characteristics, and damage mechanism of sandstone, specifically in relation to rock strength. To gain a more comprehensive understanding, it is necessary to extend this research to include other types of rocks, such as hard brittle, brittle, and soft rocks, and study the crack initiation and evolution mechanisms under the influence of loading rate.
Data availability statement
The original contributions presented in the study are included in the article/Supplementary Material, further inquiries can be directed to the corresponding author.
Author contributions
CL: Writing–original draft. LP: Writing–review and editing. LZ: Writing–review and editing. MC: Writing–review and editing. AG: Writing–review and editing.
Funding
The author(s) declare that no financial support was received for the research, authorship, and/or publication of this article.
Conflict of interest
The authors declare that the research was conducted in the absence of any commercial or financial relationships that could be construed as a potential conflict of interest.
Publisher’s note
All claims expressed in this article are solely those of the authors and do not necessarily represent those of their affiliated organizations, or those of the publisher, the editors and the reviewers. Any product that may be evaluated in this article, or claim that may be made by its manufacturer, is not guaranteed or endorsed by the publisher.
References
Aggelis, D. G. (2011). Classification of cracking mode in concrete by acoustic emission parameters. Mech. Res. Commun. 38, 153–157. doi:10.1016/j.mechrescom.2011.03.007
Bhuiyan, M. Y., Lin, B., and Giurgiutiu, V. (2018). Acoustic emission sensor effect and waveform evolution during fatigue crack growth in thin metallic plate. J. Intelligent Material Syst. Struct. 29, 1275–1284. doi:10.1177/1045389X17730930
Bobet, A. (2000). The initiation of secondary cracks in compression. Eng. Fract. Mech. 66 (2), 187–219. doi:10.1016/s0013-7944(00)00009-6
Cao, P., Cao, R. H., Zhao, Y. L., Zhang, K., Pu, C. Z., and Fan, W. C. (2016). Rock crack propagation fracture law and rheological characteristics. Chin. J. Nonferrous Metals 26, 1737–1762. doi:10.19476/j.ysxb.1004.0609.2016.08.017
Cemiloglu, A., Zhu, L. C., Arslan, S., Xu, J. X., Yuan, X. F., Mohammad, A., et al. (2023). Support vector machine (svm) application for uniaxial compression strength (UCS) prediction: a case study for maragheh limestone. Appl. Sci. 13 (2023), 2217. doi:10.3390/app13042217
Cheng, H., Zhou, X. P., Zhu, J., and Qian, Q. H. (2016). The effects of crack openings on crack initiation, propagation and coalescence behavior in rock-like materials under uniaxial compression. Rock Mech. Rock Eng. 49, 3481–3494. doi:10.1007/s00603-016-0998-9
Eberhardt, E., Stead, D., Stimpson, B., and Read, R. S. (1998). Identifying crack initiation and propagation thresholds in brittle rock. Can. Geotech. J. 35, 222–233. doi:10.1139/t97-091
Eftekhari, M., Baghbanan, A., and Hashemolhosseini, H. (2016). Crack propagation in rock specimen under compressive loading using extended finite element method. Arabian J. Geosciences 9, 145–210. doi:10.1007/s12517-015-2196-6
Khaji, Z., and Fakoor, M. (2022). Examining the effect of crack initiation angle on fracture behavior of orthotropic materials under mixed-mode I/II loading. Int. J. Solids Struct. 256, 111952. doi:10.1016/j.ijsolstr.2022.111952
Kumari, W. G. P., Ranjith, P. G., Perera, M. S. A., and Chen, B. K. (2018). Experimental investigation of quenching effect on mechanical, microstructural and flow characteristics of reservoir rocks: thermal stimulation method for geothermal energy extraction. J. Pet. Sci. Eng. 162, 419–433. doi:10.1016/j.petrol.2017.12.033
Li, Y. P., Tham, L. G., Wang, Y. H., and Tsui, Y. (2003). A modified Kachanov method for analysis of solids with multiple cracks. Eng. Fract. Mech. 70, 1115–1129. doi:10.1016/S0013-7944(02)00096-6
Liu, Q., Xu, J., Liu, X., Jiang, J., and Liu, B. (2015). The role of flaws on crack growth in rock-like material assessed by AE technique. Int. J. Fract. 193, 99–115. doi:10.1007/s10704-015-0021-6
Mahanta, B., Tripathy, A., Vishal, V., Singh, T. N., and Ranjith, P. G. (2016). Effects of strain rate on fracture toughness and energy release rate of gas shales. Eng. Geol. 218, 39–49. doi:10.1016/j.enggeo.2016.12.008
Mehdi, A., Derakhshi, F., Reza, M., and Mohammad, A. (2017). Computer modeling of crack propagation in concrete retaining walls: a case study. Comput. Concr. 19, 509–514. doi:10.12989/cac.2017.19.5.509
Modiriasari, A., Bobet, A., and Pyrak-Nolte, L. J. (2017). Active seismic monitoring of crack initiation, propagation, and coalescence in rock. Rock Mech. Rock Eng. 50, 2311–2325. doi:10.1007/s00603-017-1235-x
Mohammad, A., Ghazifard, K., Akgün, H., and Kaljahi, E. A. (2018). Development of a 2D and 3D computational algorithm for discontinuity structural geometry identification by artificial intelligence based on image processing techniques. Bull. Eng. Geol. Environ. 4, 1–13. doi:10.1007/s10064-018-1298-2
Mousa, A., D. Ph, Revisiting the calibration philosophy of constitutive models in geomechanics, (2017) 1–14. doi:10.1061/(ASCE)GM.1943-5622.0000895
Mouthereau, F., Fillon, C., and Ma, K. (2009). Distribution of strain rates in the Taiwan orogenic wedge. Earth Planet. Sci. Lett. 284, 361–385. doi:10.1016/j.epsl.2009.05.005
Ohno, K., and Ohtsu, M. (2010). Crack classification in concrete based on acoustic emission. Constr. Build. Mat. 24, 2339–2346. doi:10.1016/j.conbuildmat.2010.05.004
Park, C. H., and Bobet, A. (2009). Crack coalescence in specimens with open and closed flaws: a comparison. Int. J. Rock Mech. Min. Sci. 46 (2009), 819–829. doi:10.1016/j.ijrmms.2009.02.006
Park, C. H., and Bobet, A. (2010). Crack initiation, propagation and coalescence from frictional flaws in uniaxial compression. Eng. Fract. Mech. 77 (2010), 2727–2748. doi:10.1016/j.engfracmech.2010.06.027
Poddar, B., and Giurgiutiu, V. (2017). Detectability of crack lengths from acoustic emissions using physics of wave propagation in plate structures. J. Nondestruct. Eval. 36, 41. doi:10.1007/s10921-017-0392-x
Reis, J. M. L., Nunes, L. C. S., and Mattos, H. S. C. (2015). Crack propagation analysis of polymer mortars Brazilian disc specimens containing cracks under compressive line loading. Adv. Mat. Res. 1129, 429–437. doi:10.4028/www.scientific.net/amr.1129.429
Richardson, C. L., Hegemann, J., Sifakis, E., Hellrung, J., and Teran, J. M. (2011). An XFEM method for modeling geometrically elaborate crack propagation in brittle materials. Int. J. Numer. Methods Eng. 88, 1042–1065. doi:10.1002/nme.3211
Shkuratnik, V. L., and Novikov, E. A. (2012). Correlation of thermally induced acoustic emission and ultimate compression strength in hard rocks. © Pleiades Publ. 48 (4), 629–635. doi:10.1134/s1062739148040053
Song, Z. P., Cheng, Y., Yang, T. T., Huo, R. K., Wang, J. B., Liu, X. R., et al. (2019). Analysis of compression failure and acoustic emission characteristics of limestone under permeability-stress coupling. J. China Coal Soc. 44, 2751–2759. doi:10.13225/j.cnki.jccs.2018.1425
Song, Z. P., Wang, T., Wang, J. B., Xiao, K. H., and Yang, T. T. (2022). Uniaxial compression mechanical properties and damage constitutive model of limestone under osmotic pressure. Int. J. Damage Mech. 31, 557–581. doi:10.1177/10567895211045430
Sun, L., Abolhasannejad, V., Gao, L., and Li, Y. (2016). Non-contact optical sensing of asphalt mixture deformation using 3D stereo vision. MEASUREMENT 85, 100–117. doi:10.1016/j.measurement.2016.02.029
Taheri, A., Zhang, Y., and Munoz, H. (2020). Performance of rock crack stress thresholds determination criteria and investigating strength and confining pressure effects. Constr. Build. Mater. 243, 118263. doi:10.1016/j.conbuildmat.2020.118263
Tang, Z. C., Ngai, L., and Wong, Y. (2015). Influences of normal loading rate and shear velocity on the shear behavior of artificial rock joints. Rock Mech. Rock Eng. 49, 2165–2172. doi:10.1007/s00603-015-0822-y
Trepmann, C. A., and Seybold, L. (2018). Geoscience Frontiers Deformation at low and high stress-loading rates. Geosci. Front., 1–12. doi:10.1016/j.gsf.2018.05.002
Wang, J., Chen, Z., and Zhang, L. (2020). Unloading-induced crack propagation of two collinear unequal length flaws in brittle rocks. Geofluids 2020, 1–18. doi:10.1155/2020/9385749
Wang, X., Wang, E., Liu, X., and Zhou, X. (2021). Failure mechanism of fractured rock and associated acoustic behaviors under different loading rates. Eng. Fract. Mech. 247, 107674. doi:10.1016/j.engfracmech.2021.107674
Wen, T., M Tang, H., Huang, L., Wang, Y. K., and Ma, J. W. (2019). Energy evolution: a new perspective on the failure mechanism of purplish-red mudstones from the Three Gorges Reservoir area. China: Engineering Geology. doi:10.1016/j.enggeo.2019.105350
Wong, L. N. Y., and Einstein, H. H. (2009a). Systematic evaluation of cracking behavior in specimens containing single flaws under uniaxial compression. Int. J. Rock Mech. Min. Sci. 46, 239–249. doi:10.1016/j.ijrmms.2008.03.006
Wong, L. N. Y., and Einstein, H. H. (2009b). Crack coalescence in molded gypsum and carrara marble: Part 1. Macroscopic observations and interpretation. Rock Mech. Rock Eng. 42, 475–511. doi:10.1007/s00603-008-0002-4
Zhang, Z. X., Kou, S. Q., Jiang, L. G., and Lindqvist, P. (2000). Effects of loading rate on rock fracture: fracture characteristics and energy partitioning. Int. J. Rock Mech. Min. Sci. 37, 745–762. doi:10.1016/s1365-1609(00)00008-3
Zhigalkin, V. M., Rychkov, B. A., Usol’tseva, O. M., Tsoi, P. A., and Chynybaev, M. K. (2011). Estimation of strength properties of rock samples in terms of calculated Mohr’s envelopes. Pleiades Publ. 47 (6), 714–721. doi:10.1134/s1062739147060025
Keywords: flawed specimen, loading rate, crack propagation, acoustic emission (AE), failure mode
Citation: Li C, Pan L, Zhang L, Chris A. M and Galang AG (2023) Deformation localization and crack propagation of sandstone containing different flaw inclination angles under different loading rates. Front. Earth Sci. 11:1322992. doi: 10.3389/feart.2023.1322992
Received: 17 October 2023; Accepted: 01 December 2023;
Published: 29 December 2023.
Edited by:
Tao Wen, Yangtze University, ChinaReviewed by:
Zhanping Song, Xi’an University of Architecture and Technology, ChinaMohammad Azarafza, University of Tabriz, Iran
Copyright © 2023 Li, Pan, Zhang, Chris A. and Galang. This is an open-access article distributed under the terms of the Creative Commons Attribution License (CC BY). The use, distribution or reproduction in other forums is permitted, provided the original author(s) and the copyright owner(s) are credited and that the original publication in this journal is cited, in accordance with accepted academic practice. No use, distribution or reproduction is permitted which does not comply with these terms.
*Correspondence: Chengjin Li, chengjinli666@gmail.com