Helical cyclogenesis as an extreme threshold phenomenon in a rotating stratified moist atmosphere
 Galina Levina
- Space Research Institute, Russian Academy of Sciences, Moscow, Russia
In this paper, the concept of helical cyclogenesis is discussed, allowing for a unified interpretation of the existence of intense large-scale long-lived vortices in the atmosphere through the transfer of energy from cloud-scale motions. In 2022, the first evidence of such a phenomenon was found at Jovian high latitudes. The theory introduces ideas about large-scale threshold instabilities in turbulence with broken mirror symmetry. Such turbulence, called helical turbulence, occurs in a rotating, stratified, moist atmosphere. The present publication emphasizes the problem of tropical cyclogenesis in the Earth’s atmosphere. In the case of tropical cyclones, these ideas allowed, for the first time, the development of a procedure for the exact diagnosis of the emergence of large-scale helical-vortex instability and interpretation of this event as the birth of a tropical cyclone. Our very simple diagnostics and lucid quantitative criterion of the tropical cyclogenesis are discussed in the context of their successful application to two distinct idealized genesis scenarios and three observed tropical cyclones. In all cases, a nascent vortex became energy-self-sustaining and intensifying dozens of hours before the formation of a tropical depression. The pivotal role of rotating cumulonimbus clouds, known as vortical hot towers (VHTs), is highlighted. They are a necessary element both to provide and to diagnose the instability. These main actors of the helical cyclogenesis are illustrated by authors’ photos, satellite imagery, and animation from idealized atmospheric modeling. New fundamental and applied interpretations are offered. The hypothesis on the two-scale vortex dynamo-effect is put forward, which suggests the energy transfer from the VHTs scale, 10–30 km, directly to the mesoscales, hundreds km, of the system circulation of a tropical cyclone. Based on the results of the applied new diagnostics, we propose a definition of tropical cyclogenesis: interpret the onset of helical-vortex instability as the beginning of the genesis stage while considering the formation of a tropical depression as this stage completion. The diagnostics is best suited as a fundamental basis for detecting the “Potential Tropical Cyclone” stage introduced by the U.S. National Weather Service for operational forecasting purposes. Prospects are discussed.
1 Introduction
The theoretical concept of helical cyclogenesis originated in the 1980s and predicted an upscale energy transfer in the atmosphere, which might be driven by thermal convection of cloud scale. It took another 4 decades for this phenomenon to be discovered. Surprisingly, however, it was first found not in the Earth’s atmosphere, but almost a billion kilometers from our home planet, on Jupiter (Siegelman et al., 2022).
In pioneering theoretical studies (Moiseev et al., 1983a; Moiseev et al., 1983b; Levich and Tzvetkov, 1984; Levich and Tzvetkov, 1985), the existence of intense large-scale atmospheric vortices was interpreted on the basis of fundamental ideas about the processes of self-organization in turbulence. Self-organization here refers to the formation of larger and longer-lived–“coherent” (Hussain, 1986)–vortex structures against the background of smaller and chaotic components of motion. An essential feature of self-organization processes is their non-equilibrium, meaning that a constant influx of energy from outside is needed to sustain the resulting large-scale structures in a stable state. In this context, the inverse energy cascade in turbulence, realized under some special conditions and allowing the transfer of energy from small to large scales (Frisch, 1995), becomes of particular importance.
As such a case with special conditions, Moiseev et al. (1983a), Moiseev et al. (1983b) and Levich and Tzvetkov (1984), Levich and Tzvetkov (1985) considered the three-dimensional helical turbulence in an electrically non-conducting environment. Helical turbulence is characterized by the break of mirror symmetry and is generated in physical fields with pseudovector properties, such as magnetic or Coriolis force fields (Moffatt, 1978; 2014). Turbulence of such kind can be observed in astro- and geophysical systems. Amongst the familiar natural systems, the rotating atmospheres of the Earth and planets can be emphasized, where the spiral properties of the velocity field are attributed to the action of the Coriolis force.
A physical mechanism of intensifying and maintaining large-scale vortex disturbances in the rotating stratified atmosphere by transferring energy from small-scale motions was proposed by Moiseev et al. (1983a), Moiseev et al. (1983b). The mechanism is now widely known as a turbulent vortex dynamo and has been the subject of two reviews, by Levina et al. (2000) and Levina (2018). Let us point out an intrinsic feature of the turbulent vortex dynamo, namely, the existence of a threshold for the large-scale helical-vortex instability. The threshold-type excitation is likely a characteristic feature of large-scale instabilities in turbulent media with broken symmetry because this was also found for the alpha effect in magnetohydrodynamics (Moffatt, 1978; Krause and Rädler, 1980) and for the anisotropic kinetic alpha effect (AKA-effect) in an electrically non-conducting medium (Frisch, 1995).
The first application of a still hypothetical vortex dynamo to observed atmospheric phenomena was realized as a daring move undertaken by Fortov et al. (1996) and Ivanov et al. (1996). They used the theory in order to explain the size and structure of large-scale long-lived vortex disturbances in the mid-latitudes of the Jovian atmosphere after the fall of Comet Shoemaker-Levy 9’s debris in July 1994. To this end, a mathematical relation for the threshold of large-scale helical-vortex instability and corresponding expressions for atmospheric characteristics, obtained in Moiseev et al. (1983b), were applied. This allowed Fortov et al. (1996) and Ivanov et al. (1996) to give a proper explanation for the vortex structures in Jupiter’s atmosphere, which many other researchers had failed to do before. Detailed discussion of these results can be found in the overview paper by Levina et al. (2000).
However, in those last years of the passing millennium, not only the turbulent vortex dynamo, but also the very existence of helical turbulence in the atmosphere was only a tempting theoretical hypothesis.
2 Materials and methods
Tropical cyclones (TC) are intense atmospheric vortices, reaching sizes from several hundred to a thousand kilometers or more. They usually originate above the surface of warm water in places of powerful cloud clusters, indicating intense atmospheric convection and characterized by weak cyclonic vorticity (Riehl, 1954). To date, there is still no consensus amidst the global tropical meteorologist community about the genesis of a cyclone. “No aspect of tropical cyclones has proved as vexing and intractable as their formation. Much has been written on the subject, and several field campaigns have been mounted to address the issue, … Much has been learned, and many hypotheses advanced, but a clear understanding of the process remains elusive.”–K. Emanuel (2018) summarized in his review for the 100th Anniversary of the American Meteorological Society.
Meanwhile, the application of the theory of turbulent vortex dynamo to the study of tropical cyclogenesis, initiated by the author and supported by American colleagues, looks quite promising. The threshold-type large-scale instability offers an exact time diagnosis for the beginning of TC genesis. Therefore, this new approach to an “old” problem encompasses important implications both for the science of hurricanes and of practical issues, such as warning the population.
In relation to the tropical atmosphere of the Earth, a series of collaborative Russian American works on helical cyclogenesis was undertaken in 2006–2015. The initiative involved leading world experts in this field and was based on a state-of-the-art atmospheric cloud-resolving numerical simulation using American high-performance computing. Methods, data, and important findings were summarized by Levina (2018). This topic is being continued by the author at the present time; see, Levina (2019), Levina (2020), Levina (2021b), Levina (2021a), Levina (2022).
2.1 Numerical analysis of helicity generation
The study of the helical nature of tropical cyclogenesis began with the verification of the basic hypothesis and, at the same time, the necessary conditions for the implementation of the vortex dynamo mechanism, namely, the existence of helical atmospheric turbulence, which is characterized by a non-zero mean helicity. For this purpose, approaches and results of two series of numerical experiments, Levina and Burylov (2006) and Montgomery et al. (2006), were brought together.
The first of them, by Levina and Burylov (2006), was undertaken to examine a mathematical model of the turbulent vortex dynamo that was formulated in terms of mean-field hydrodynamics (Krause and Rädler, 1980) as the mean-field equations, which describe the dynamo-effect in a non-uniformly heated medium (Moiseev et al., 1988). This allowed the development of numerical methods for analysis of helical features of the velocity field and resulted in the diagnostic approach for detection of the large-scale helical-vortex instability.
That same year, a paper by Montgomery et al. (2006) appeared, which proposed a new scenario of tropical cyclogenesis. Using near-cloud resolving simulations of 2, 3 km horizontal grid spacing, it showed how a mesoscale tropical depression vortex could develop against the background of cumulonimbus convection as a result of upscale vorticity organization. In the simulations, the initial growth of flow scales occurred by multiple mergers of small convective updrafts (each up to 2–5 km horizontal scale). Then, there appeared a number of intense rotating convective cells, called vortical hot towers ‒ VHTs (Hendricks et al., 2004) - each 10–30 km in horizontal scale. Further development resulted in an intense mesoscale helical vortex.
From the point of view of the helical cyclogenesis concept, it is important to note that the simulated VHTs, as well as those ones found in observations data (Reasor et al., 2005) and detected during an aircraft mission and described by Houze et al. (2009), were three dimensional structures possessing height-to-width aspect ratios of order unity. This gave Montgomery et al. (2006) a reason to advance a new scenario of TC formation based on the upscale organization punctuated by strongly three-dimensional convective events in a favorable tropical environment. Correspondingly, their publication got the title “A vortical hot tower route to tropical cyclogenesis.”
The scenario of a “vortical hot tower (VHT) route” showed many similarities with an upscale organization through the vortex dynamo (Levina and Burylov, 2006) and was chosen as a superb basis to introduce and examine the helical features of the three-dimensional convective atmospheric turbulence. The diagnostic approach by Levina and Burylov (2006) was applied for analysis of data from atmospheric modeling (Montgomery et al., 2006). As a result, for the first time in atmospheric research, non-zero helicity generation in three-dimensional moist convective turbulence was discovered—this occurred during TC formation (Levina and Montgomery, 2010). The integral helicity of the nascent vortex under examination became non-zero from the very beginning of each numerical experiment and increased with the strengthening of the forming tropical cyclone. For the purpose of verification, several numerical experiments (Montgomery et al., 2006) were chosen and examined. They were characterized by different initial conditions and resulted in TC intensity from the tropical depression up to a category two hurricane vortex. The dependence on the horizontal spatial resolution was also tested with 2 and 3 km grid increments. All tests confirmed the effect of generating the non-zero helicity.
This finding of the environment required for the turbulent dynamo-effect opened a further way to search for large-scale helical-vortex instability.
Later, a similar analysis of the spiral features of atmospheric turbulence during the TC evolution was carried out using data from another numerical study undertaken by Nicholls and Montgomery (2013). In the simulations, two different scenarios of TC genesis were examined and compared. One was proposed by Montgomery et al. (2006), and the other by Nolan (2007). The break in the mirror symmetry of turbulence, that is, the non-zero and increasing-with-time helicity of the vortex system, has been confirmed again ‒ in a numerical experiment that was following Nolan’s (2007) scenario.
In our post-processing of data from both simulations, by Montgomery et al. (2006), and Nicholls and Montgomery (2013), helicity
The helicity density of the flow
Both quantities are pseudoscalars because they change sign under change from a right-handed to a left-handed frame of reference. The quantity
Turbulence characterized by the non-zero mean helicity,
is called helical. A non-vanishing mean helicity determines, according to its sign, the predominance of the left-handed or right-handed spiral motions in the examined flow. Expression (3) provides a necessary but not sufficient condition for the emergence of large-scale helical-vortex instability. Helicity
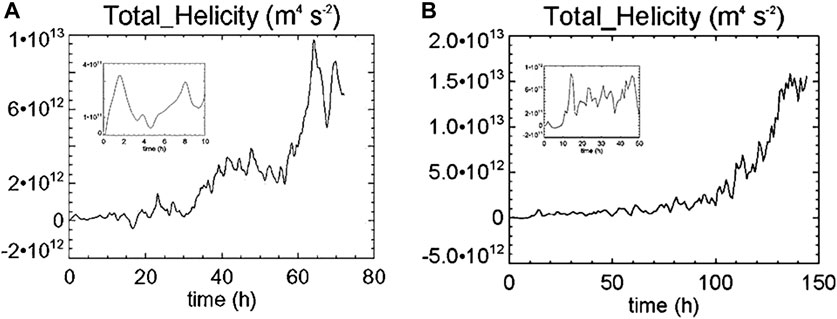
FIGURE 1. Evolution of helicity integrated over the computational domain and normalized by a number of grid points. (A) Experiment A2 (Montgomery et al., 2006): post-processing of the RAMS (Regional Atmospheric Modeling System) model data was carried out on the finest of three computational grids for subsequent times with a time increment of 10 min during 72 h of numerical experiment. Helicity was calculated in the computational domain 276 x 276 x 20 km in Cartesian coordinates
Conclusion 1. Thus, the three-dimensional helical moist convective turbulence does really exist and has first been found in the tropical atmosphere of the Earth. The discovery of the environment required for the turbulent dynamo-effect has paved the way for a further search for the large-scale vortex instability. This made it possible to proceed to the interpretation of tropical cyclogenesis as an extreme threshold event in spiral atmospheric turbulence and begin development of the remote diagnostics of the precise time of a TC genesis.
The summarizing review-research article (Levina, 2018) highlighted the pivotal role of VHTs in ensuring the tropical cyclogenesis. Therefore, the phenomenon of vortical convection deserves a special section in order to be described and illustrated properly.
2.2 Rotating cloud convection: vortical hot towers–VHTs
Given the interdisciplinarity of the “Frontiers”, let us go into more details on the phenomenon of VHTs. At the same time, the author apologizes in advance to the hurricane community for possible repetitions of information from her recently published works.
A typical landscape with tropical deep convection in pre-hurricane conditions is shown in Figure 2A; Figure 2B presents the corresponding satellite imagery. Meanwhile, a conclusion on whether these towering clouds are rotating requires a special investigation and will be discussed in due course throughout the section. The VHTs are also known under stricter scientific names, such as “rotating convection paradigm” and “rotating deep convection” (Montgomery and Smith, 2017). A brief summary of modern knowledge on VHTs can be given as follows.
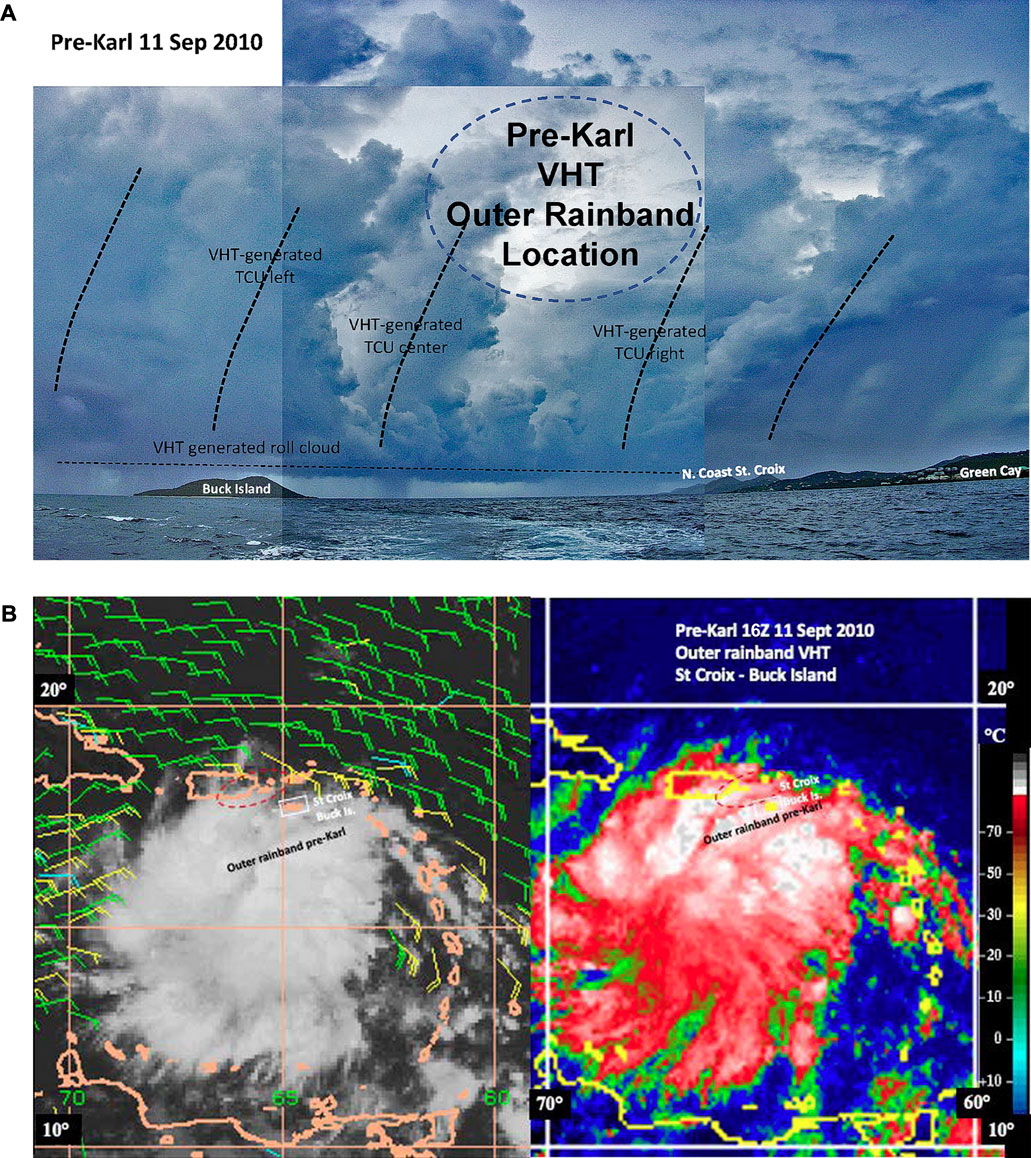
FIGURE 2. Tropical cloud convection in the nascent Hurricane Karl, near the Saint-Croix Island, U.S.V.I., 11 September 2010. (A) Composition of three photos taken by the author at 16:09–16:17 UTC in vicinity of the Buck Island Reef National Monument. Towering Cumulus (TCU) clouds and a roll cloud are shown, which were generated by a VHT located in the outer rainband of vortex disturbance (Figure 2B). Composition and meteorological interpretation courtesy of Dr. Peter Black. (B) Satellite images, visible and infrared, of the same vortex disturbance (Pre-Karl) at 16:00 UTC. Location of the photo-maker is shown within the white rectangle while the outer rainband with the VHT is shown within the red ellipse. Courtesy of Dr. Peter Black.
The hot cloud towers were first described by Riehl and Malkus (1958) as horizontally small but intense cumulonimbus convection cores that can penetrate throughout a troposphere height up to 16–18 km. As a “classical” hot tower, one can choose the biggest of cells presented in Figure 3. A clearly visible forming “dome” feature over the strong updraft location ‒ overshooting cloud top ‒ confirms the tower extension beyond the tropopause into the stratosphere. Their vortical nature was first identified nearly 50 years later in Hendricks et al. (2004) numerical modeling, and convincingly confirmed by observations with Doppler radar data from research flights into hurricanes (Reasor et al., 2005; Houze et al., 2009), and ground-based measurements (Sippel et al., 2006).
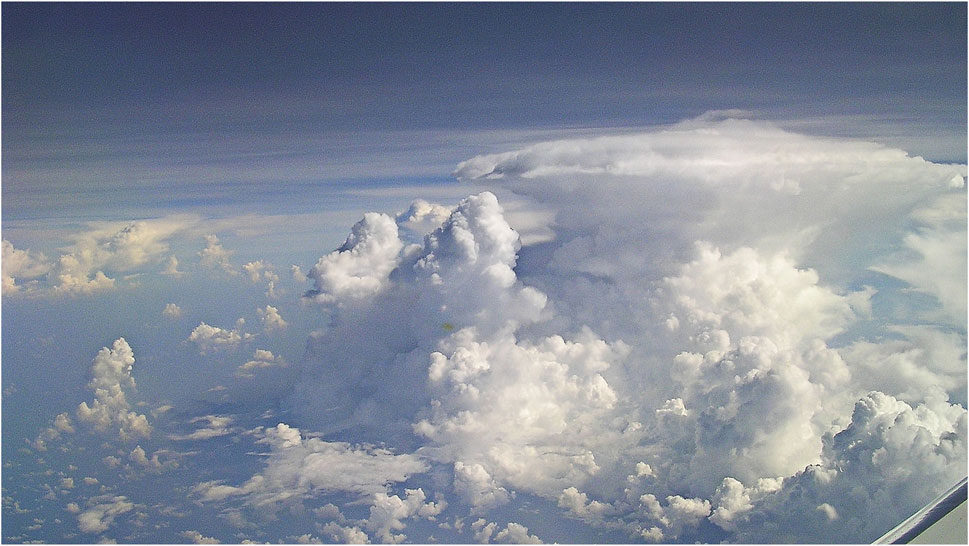
FIGURE 3. Vortical Hot Tower: portrait. A VHT photo taken by the author during NSF/NCAR Gulfstream-V flight within the “newborn” Tropical Storm Karl at 19:33 UTC 14 September 2010. This is how the VHT looks from a height of 14500 m above sea level. Vortical Hot Towers (VHTs)–rotating deep convection. The term “hot” comes not from the temperature of the air but from the latent heat release due to phase transitions of moisture (vapor-water-ice) along the tower height. Their characteristic lifetime is about 1 h, the horizontal size–10–30 km; the most intense ones extend throughout the whole troposphere height of 14–16 km; the documented vertical velocity is typically from 2 to 4 m s−1 up to 25–30 m s−1, and may exceed 30 m s−1 at the upper levels; the relative vertical vorticity reaches up to 10−3–10–2 s−1, i.e., exceeds the planetary rotation by one to two orders.
The VHTs deserve special attention not only because of their role in the formation of TCs, but also due to the danger of such cloud structures for the population inexperienced in meteorology. In Dunkerton et al. (2009), the VHTs were described as “deep moist convective clouds that rotate as an entity and/or contain updrafts that rotate in helical fashion … These locally buoyant vortical plume structures amplify pre-existing cyclonic vorticity by at least an order of magnitude.” Many people, faced with something similar to what is shown in Figure 2A, will not even be able to imagine that, beyond their menacing appearance, these huge cloud towers can cover up intense rotating updrafts inside themselves. Recently, similar vortex structures have been found in hurricane-like vortices at mid-latitudes, in the Black (Yarovaya and Levina, 2019) and Mediterranean (Kilroy et al., 2022) Seas.
However, there are still colleagues who doubt the existence of VHTs. The author encountered several anonymous reviewers of such kind.
2.2.1 Recognizing the rotation of cloud convection
It is quite challenging to identify rotation within a specific cloud tower. In natural conditions, for a person without special measurement tools, this seems doubtful. For example, in cases of Figures 2A, 3, visually, the author did not notice any signs of cloud rotation when taking the photos. This may be a reason for doubters about VHTs existence. In fact, all confirmations for VHTs were gained by high-precision measurements using Doppler radars in both airborne and ground-based studies.
The rare opportunity to catch the same cloud tower during three successive fly-bys within an approximately 40 min time interval was discussed in Houze et al. (2009). The documented convective cell was found in a depression that was intensifying and became Hurricane (2005). The cell was extremely deep and reached up to about 17 km in height. The width was typically 10–15 km, changing somewhat with altitude. The updraft had vertical velocities reaching 10–25 m s−1 at the upper levels. The maximum vertical velocity within this updraft exceeded 30 m s−1. Maximum values of the cyclonic vertical relative vorticity were on the order of 10–3 s−1 (Houze et al., 2009, Figures 10–12).
Useful information can be found in the review (Houze, 2010). Vortical tropical convection has been investigated in several field experiments in the Atlantic and Pacific (Montgomery et al., 2012). Since then, the results of the study of VHTs in different countries around the world have been published.
A way of confidently distinguishing the rotating convection in numerical and laboratory modeling is based on its inherent helical nature.
2.2.2 “VHTs are helical by definition”
Molinari and Vollaro (2008, 2010) calculated helicity for developed tropical cyclones from 1998 to 2001 sampled during the NASA Convection and Moisture Experiment (CAMEX). Using tropospheric-deep dropsonde soundings carried out by reconnaissance aircrafts, the most extreme values of helicity, among the largest ever reported in the literature, were found in the vicinity of deep convective cells. In TC research, Molinari and Vollaro (2008) have first shown that there exists an association of large helicity and intense convection; they continued in Molinari and Vollaro (2010) by noting that VHTs are helical by definition because they contain coincident updrafts and vertical vorticity (Molinari and Vollaro, 2010).
2.2.3 Mechanism of VHT formation
At this juncture, it is worth recalling a mechanism of VHT formation presented by Montgomery et al. (2006). In the review by Levina (2018), it was substantiated that this is simultaneously a process of helicity generation on cloud scales. For our current discussion, let us present here the corresponding illustration from Levina (2018) in Figure 4.
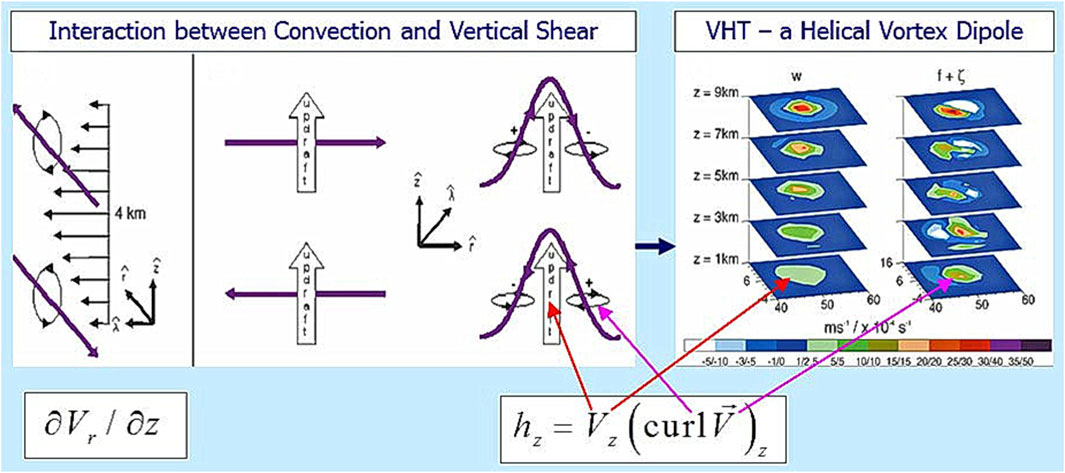
FIGURE 4. Vortical Hot Tower: the mechanism of formation. Formation of a VHT is illustrated to explain how the vertical vorticity and vertical helicity are generated based on numerical experiments by Montgomery et al. (2006). For this purpose, their Figure 9(b) showing the VHT and Figure 10 on vortex tilting were borrowed and combined. Left panel: schematic of vortex tilting within the initial MCV (Montgomery et al., 2006). Purple lines represent vortex filaments. Radial vorticity
The VHT was formed (Montgomery et al., 2006) in realistic meteorological conditions that were favorable for TC genesis (Gray, 1979), which included cyclonic low-level vorticity from a preexisting mesoscale cyclonic vortex (MCV). It is important to note that the existence of initial large-scale vortex disturbance was also considered as a necessary condition for the realization of the turbulent vortex dynamo in the atmosphere (Moiseev et al., 1983a; Moiseev et al., 1983b). This primary tangential circulation provides an environment rich in horizontal and vertical vorticity. Evolving convection tilts ambient horizontal vorticity into the vertical while at the same time stretching MCV-generated vertical vorticity. As some updraft intensifies to become a hot tower, both ambient and tilting-generated vertical vorticity is stretched even more, leading to a strong convectively generated vertical vorticity anomaly.
Important support for this mechanism of producing the rotating convection was delivered from a laboratory experiment (Evgrafova et al., 2013), which was carrying out simultaneously with numerical simulation for the same statement of the problem. It was shown that both non-zero vertical vorticity and vertical helicity were generated as a result of interaction of ascending convective plumes with shear flow in a non-rotating fluid layer.
2.2.4 Visualization of vortical convection in numerical atmospheric modeling
The presented mechanism results in creating helical convective flows. This gave a basis to first introduce (Levina, 2013; Levina and Montgomery, 2014a; Levina and Montgomery, 2014b) a method of identifying the vortical convection using the vertical helicity field, which is successfully applied in all subsequent studies. To this end, the vertical helicity field
When examining numerical experiments (Montgomery et al., 2006), the method revealed an emergence of the whole spectrum of rotating convective flows of various sizes and intensities, including the strongest ones up to 14 km in height. The corresponding animation was first presented at the 31st Hurricane Conference in San Diego (Levina and Montgomery, 2014c) and is available in Supplementary Material S1. The animation manifests the existence of rotating convection during the entire TC evolution in Experiment A2 (Montgomery et al., 2006), from the very first minutes up to the formation of a hurricane of category 2 intensity, and confidently refutes a widespread misconception that convection is suppressed by intense rotation in hurricane conditions.
2.2.5 The role of environment in the development of rotating convection
In the context of this discussion, let us note a common feature of both idealized numerical simulations (Montgomery et al., 2006; Nicholls and Montgomery, 2013). For these experiments, an initial local heating was applied for 300 s in order to create a warm bubble (temperature surplus 2 K) at low levels (z = 2 km). The bubble method serves to stimulate cumulus convection in the local environment. Indeed, in the presented animation (Supplementary Material S1), at “Time = 08–22–98—12 h, 10 min” one can see the emerging convective cell (green spot), which develops very quickly and becomes an intense rotating updraft.
Investigation of vortical convection in Experiment C1 “No initial MCV” and E1 “Zero Coriolis” from Montgomery et al. (2006) brought interesting results. In C1, one could observe the first VHT, generated by the initial 300 s local heating at low levels. After this VHT died out within the early 3–4 h, there was no further development of rotating convection. A quite different situation was found in E1, where the experiment was progressing from the similar initial VHT through developing rotating convection and resulted in the formation of the tropical depression. This emphasizes the important role of the vorticity-rich environment in the emergence of rotating convection and tropical cyclone formation.
Finally, back to Figures 2A, 3, and based on the available weather information about pre-genesis conditions with numerous detected overshooting cloud tops at the dates of taken photos, the author may suggest rotation in all cloud towers. The only question is about its intensity.
Conclusion 2. The mechanism of VHT formation in Figure 4 transforms the horizontal vorticity into a vertical one. This explains why the intensifying tangential circulation does not suppress the vortical convection even in major hurricanes (of category 3 and higher) but contrarily leads to the emergence of extremely intense VHTs, such as those discussed in Molinari and Vollaro (2008); Molinari and Vollaro (2010). The mechanism was tested in laboratory experiments and was also validated by numerical simulation carried out for the conditions and parameters implemented in the experiments.
3 Helical scenario of tropical cyclogenesis
The problem of tropical cyclogenesis is one of the most challenging in meteorology. Many researchers consider that is a fact of the formation of the tropical depression (Montgomery et al., 2012). Let us remind ourselves here of information from the U.S. National Hurricane Center (NHC) on several stages in the tropical cyclone intensity (NHC Glossary, 2023a): tropical depression (TD) for vortices with maximum sustained tangential near-surface winds up to 17 ms−1, tropical storm (TS)–18–32 ms−1 winds, and hurricanes (H) with winds 33 ms−1 and higher can attain a category of intensity from 1 to 5 (since 70 ms−1).
An overview of difficulties, which such an approach poses for operational forecasters, can be found in Levina, (2020, 2021a, 2021b, 2022). The main difficulty is that, behind the given TD definition (NHC Glossary, 2023a), one does not imply any specific mechanism or process, leading to the genesis and holding the quantitative TD characteristics as the threshold ones. Unfortunately, many cases are known when the TD stage was missed, and a forming vortex having exceeded the TD intensity was declared as a TC too late and in a dangerous vicinity to a populated coast. In order to avoid a significant risk of life-threatening situations, beginning with the 2017 hurricane season, the U.S. National Weather Service has introduced the term “Potential Tropical Cyclone–TCP.” The new term describes “… a disturbance that is not yet a tropical cyclone, but which poses the threat of bringing tropical storm or hurricane conditions to land areas within 48 h (NHC Glossary, 2023c).” However, this innovation does not contribute to precise diagnosis of TC genesis by any quantitative criterion.
The authors of the turbulent vortex dynamo theory (Moiseev et al., 1983b; Moiseev et al., 1988) also believed TD formation is a TC genesis and associated this event with the onset of new large-scale helical-vortex instability. This could rightly be called the helical cyclogenesis. Meanwhile, they proposed, at once, a strict criterion for diagnosing such an effect: the forming TC should become energy-self-sustaining and intensifying. This emphasizes the kinetic energy as a possible diagnostic quantity for identifying the instability. Indeed, an arising and persistently progressing increase in the kinetic energy of the forming vortex can signal the onset of instability. Diagnosis of emerging instability is a well-known problem in computational fluid dynamics and there are well-developed diagnostic tools to solve it. Such an “energy-based” diagnostic approach was successfully applied by Levina and Burylov (2006) in the numerical examination of a mathematical model for the turbulent vortex dynamo (Supplementary Material S2, left side). As a result, not only was the existence of new large-scale helical-vortex instability confirmed, but an instability threshold including the dependence on the helicity level was also found (Levina, 2006; Levina and Burylov, 2006).
3.1 Precise diagnosis of the tropical cyclogenesis
The detailed examination of the helical scenario was initially carried out by numerical simulation of the dynamo-effect on the basis of its mathematical model (Levina et al., 2000; Supplementary Material S2). Numerical hydrodynamical methods were applied by Levina and Burylov (2006) in order to discover and investigate the helical-vortex instability.
Following this, the developed approach was applied to the atmospheric case, for post-processing of RAMS (Regional Atmospheric Modeling System) simulation data obtained by Montgomery et al. (2006). A very simple diagnostics and lucid quantitative criterion in the TC genesis case have been introduced (Levina, 2013; Levina and Montgomery, 2014a; Levina and Montgomery, 2014b; Levina and Montgomery, 2015):
• the first sign of instability, as follows from the dynamo theory, is the start of mutual amplification of the primary and secondary circulation,
• the quantitative measure is the kinetic energy; analysis of the evolution of the integral kinetic energy
• to detect the onset of instability one should calculate separately the kinetic energy,
To date, the proposed method has been tested to diagnose the cyclogenesis in several idealized numerical experiments, see Levina and Montgomery (2014a); Levina and Montgomery (2014b); Levina and Montgomery (2015), and Levina (2018), as well as used in a numerical study of three observed TCs (Munsi et al., 2023). This brought absolutely unexpected and striking results: in all cases, the instability appeared several and even dozens of hours before the TD formation. The results are shown in Table 1.
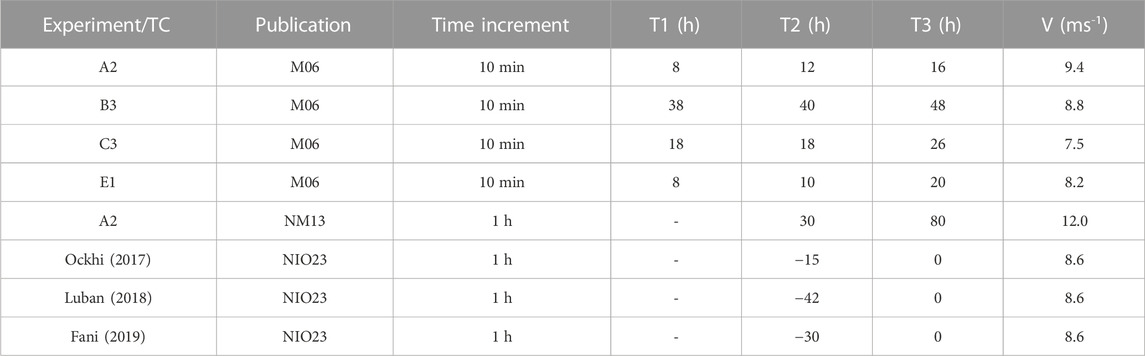
TABLE 1. Pre-depression large-scale vortex instability. In the upper five lines, results from post-processing of data of idealized numerical experiments are given. They present outcomes of two different cyclogenesis pathways. In the first four lines (Publication M06), results are shown for the pathway proposed and simulated by Montgomery et al. (2006): experiment A2 (control, 3 km), B3 (cape-less, 3 km), C3 (weak vortex), and E1 (zero Coriolis). These are followed (line 5, Publication NM13) by our findings for the pathway (Nolan, 2007) simulated by Nicholls and Montgomery (2013). In the lower three lines, results from (Munsi et al., 2023) are presented who applied (Publication NIO23) the discussed approach to diagnose the large-scale helical-vortex instability in the three observed TCs in the North Indian Ocean. In (Munsi et al., 2023), the time of TD formation is chosen as
3.2 If not a TD formation, what is behind the onset of discovered instability?
Detailed analysis of the dynamics and structure of nascent TC in the pre-depression time span was possible for experiments from Montgomery et al. (2006), in which the applied time increment equal to 10 min was appropriate and allowed answering the above query. The time resolution was found to be a decisive factor in order to discover and trace the crucial VHTs role in the tropical cyclogenesis. It is worth remembering here that the VHT lifetime is about 1 h. For this reason, simulations with 1 h time increments in post-processing are useful in order to approximately, with corresponding accuracy, detect the onset of instability and/or analyze integral characteristics like helicity, in Figure 1B, but insufficient to examine processes with involved VHTs and other cloud convections.
Beginning with the publication by Montgomery et al. (2006), the process of upscale organization of convection was studied by many researchers. Among the studies, there are several in which the analysis of helical features of convective turbulence was introduced (Levina and Montgomery, 2010; Levina and Montgomery, 2014a; Levina and Montgomery, 2014b; Levina and Montgomery, 2015; Levina, 2013) in the context of searching for new large-scale instability.
At this point, it is worth remembering a special condition to launch the vortex dynamo: an initial break of the mirror symmetry of turbulence. In both discussed simulations, (Montgomery et al., 2006), and (Nicholls and Montgomery, 2013), this was fulfilled. Numerical experiments, except C1 (Montgomery et al., 2006), started with a mesoscale convective vortex in the midtroposphere. What is more, our examination (Levina, 2013) revealed one more factor of symmetry breaking involved from the very beginning in each experiment. The initial local 300 s heating at low levels resulted in the first intense VHT (Figure 4, right), and helicity generation started at a cloud scale, expanding the area with time. This first VHT has been honored with many discussions.
Meanwhile, only recently has special attention been paid to the sequence of further appearance of separate intense VHTs as well as to an analysis of the impact of these events on the dynamics and structure of the nascent vortex (Levina, 2020; Levina, 2021a; Levina, 2021b; Levina, 2022). For this purpose, the method of VHTs visualization in the vertical helicity field was used (Supplementary Material S1). In the presented animation, one can trace the entire evolution of the modeled hurricane with the time increment 10 min. The timer is shown in the red frame below the animation, and the corresponding stages in the vortex evolution can be found in the table at the left. At the pre-depression stage, in the first 10–12 h, the emergence and growth of each VHT are clearly visible.
Was the initial VHT a trigger of the cyclogenesis or not is a really exciting matter and, possibly, this is worth special research as noted in Levina (2021b). What is evident, the first VHT did become the trigger of convective instability (Supplementary Material S1). Quantitative characteristics of intensity and sizes of emerging vortical convective cells can be found in Levina (2013); Levina (2018), and Levina and Montgomery (2014b) while the progressing instability is well traced in the gif-animation.
Having begun against the background of the decay of the first tower, the development of convective instability continues in the form of new cells, but smaller in height and for several hours, not extending beyond the middle troposphere. Thus, in Experiment A2 (Montgomery et al., 2006) presented in (Supplementary Material S1), within the interval t = 6–7 h, three intense cells appear at the level of 7 km. One of these structures continues to strengthen and grows to 13 km by t = 8 h. Around the same time, multiple convective cells up to 4–7 km in height appear. Some of them develop up to 7–10 km. The formation of a secondary circulation begins, which was illustrated using images of hydrothermodynamic fields in Levina (2013), and Levina and Montgomery (2014b). This process happens very quickly.
At t = 8 h, the radial inflow created by the intense VHT is about 10 km along the radius and covers lower levels 0–3 km; its maximum azimuthally averaged speed is approximately 1 ms−1; an appearing outflow is much weaker 1 ms−1 and not resolved in the image. At t = 12 h, the circulation is fully formed: the inflow of about 50 km along the radius at 0–3 km levels expands with height, reaching 100 km at levels of 6–10 km and the maximum speed near 5 ms−1; the developed outflow at the upper levels 11–15 km extends 100 km along the radius and has the maximum speed about 3 ms−1. It is important to note that at the stage of formation of the secondary circulation within 8–12 h there is no noticeable drop in pressure. However, at this time, significant changes begin in the initial mesoscale vortex: the maximum tangential velocity shifts to lower levels and to the center of the domain. During these 4 hours, one can observe the formation of the system of convective cells in the animation (Supplementary Material S1). The system consists of chaotic cells of different intensity and size, and includes several intense VHTs of 13 km high (the upper limit shown in the image).
At t = 12 h, against the background of chaotic convection and no obvious pressure drop, the large-scale instability emerges and reveals itself as a start of the mutual increase in the kinetic energy of the primary and secondary circulation (Supplementary Material S3). It takes four more hours to form the tropical depression, it is detected at t = 16 h.
Similar results were obtained for the three other Experiments, B3, C3, and E1, from Montgomery et al. (2006). They are collected in Table 1.
Conclusion 3. The instability appears against a background of seemingly disorganized convection, without either a pronounced pressure drop in the environment or a well-defined center of the near-surface circulation. This precedes, from a few hours up to dozens of hours, the formation of a tropical depression. The onset of new large-scale helical-vortex instability coincides with the completion of the formation of secondary circulation.
3.3 Two-scale turbulent vortex dynamo
Following the dynamo-theory, it was hypothesized that the new instability is ensured by positive “helical” feedback, which directly connects the two components of the vector velocity field–toroidal
Based on the mechanism in Figure 4, the necessary substantiation was offered by Levina (2018): “We can summarize that the VHTs appear as a result of interaction between cloud moist convection and vertical wind shear. Each convective updraft generates the vertical vorticity by tilting of horizontal vortex filaments and amplifies it by stretching. This process provides a linkage of horizontal and vertical vortex lines and results in helicity generation on a local cloud scale.” Meanwhile, an evolving population of VHTs of different sizes and intensities (Supplementary Material S3, left side, the upper schematic) participate in the formation and maintenance of the secondary transverse circulation during tropical cyclone evolution and ensures the linkage of circulations on mesoscales. Helicity dynamics allows us to trace such upscale flow organization. The corresponding schematics is presented here in Supplementary Materials S2, 3.
Once the circulations are linked (the formation of secondary circulation has been completed and the required level of linkage (helicity) has been achieved)–time G (Supplementary Material S3, right side, the upper schematic), the positive feedback starts acting, and the vortex becomes energy-self-sustaining and intensifying.
Conclusion 4. Due to the crucial role of topology in the new instability and role of VHTs in providing this, the analysis of helicity (integral helicity, helicity density, and its space contributions given by Eqs. 1, 2) can be suggested to quantify the chaotic influence resulting from moist convection on the TC formation (Levina, 2018).
However, the role of VHTs is not limited to topology. They ensure the fulfillment of the necessary condition for the energetics of a vortex dynamo–volumetric latent heat release (Levina et al., 2000; Levina, 2018; Supplementary Material S2, left side). Moreover, they do this throughout the entire height of the troposphere.
Unlike many expectations, in the tropical cyclone case we observe a peculiar dynamo-effect–the two-scale dynamo -- in which the energy transfers from the VHTs scale, 10–30 km, directly to the mesoscales, hundreds km, of the TC system circulation. This may explain why, so far, no one has been able to observe a consistent enlargement of the scale of convective cells, for example, as a result of their merger, as expected in the case of a continuous inverse energy cascade. The latter scenario was simulated and illustrated in Levina (2019) with a forcing of a special kind applied to Rayleigh-Bénard convection in a horizontal fluid layer.
4 Concluding remarks
Tropical cyclones and intense mesocyclones of middle and high latitudes are united by the fact that the same physical mechanism, thermal convection, plays an important role in their formation. A new type of atmospheric deep moist convection–vortical hot towers–was discovered in the first years of the appearance of cloud-resolving numerical models of the atmosphere. This pioneering discovery made it possible to substantiate the existence of the turbulent vortex dynamo in the tropical atmosphere and to develop accurate diagnostics for the tropical cyclogenesis. Within the framework of the proposed diagnostics, the analysis of the emergence and evolution of rotating cloud convection plays a key role (Levina, 2020; 2022), and the formation of such structures is the first sign of a possible large-scale instability. The recent finding of vortical cloud towers in the Black Sea quasi-tropical cyclone (Yarovaya and Levina, 2019) and the Mediterranean hurricane-like vortex (Kilroy et al., 2022) indicates the possibility of a vortex dynamo in mid-latitudes. Similar studies for polar mesocyclones are likely to appear in the near future. Thus, the turbulent vortex dynamo turns out to be a universal mechanism for the formation of intense, long-lived, large-scale vortices in the Earth’s atmosphere. A generalized theoretical model of the dynamo effect (Kopp et al., 2021) for a rotating stratified moist atmosphere, taking into account the tilt of the planet’s axis, opens possibilities to study and compare the features of the implementation of this mechanism in the atmospheres of different planets.
The present work, for the first time in tropical cyclone research, offers an original approach for determining the exact time of the onset of tropical cyclogenesis. The proposed quantitative diagnosis based on the numerical analysis of the kinetic energy is discussed in the context of its successful application to two distinct idealized genesis scenarios and three observed tropical cyclones. In all cases, a nascent vortex became energy-self-sustaining and intensifying dozens of hours before the formation of a tropical depression. The pivotal role of rotating cumulonimbus clouds, known as VHTs, is highlighted. They are a necessary element both to provide and to diagnose the instability.
Based on the results of the applied new diagnostics, we propose a definition of tropical cyclogenesis: interpret the onset of helical-vortex instability as the beginning of the genesis stage while considering the formation of a tropical depression as this stage completion.
It would be useful to test the proposed diagnostics on the basis of “Hurricane Nature Run” (Nolan et al., 2013), which depicts the life cycle of a strong hurricane over the North Atlantic Ocean. A test could be possible for an observed nascent hurricane using the regime “Invest”, introduced in the case of “a weather system for which a tropical cyclone forecast center (NHC–National Hurricane Center, … ) is interested in collecting specialized data sets … ” (NHC Glossary, 2023b).
The diagnostics is best suited as a fundamental basis for detecting the “Potential Tropical Cyclone” stage introduced by the U.S. National Weather Service for operational forecasting purposes.
Data availability statement
The original contributions presented in the study are included in the article/Supplementary Material, further inquiries can be directed to the corresponding author.
Author contributions
GL: Writing–original draft, Writing–review and editing.
Funding
The author(s) declare financial support was received for the research, authorship, and/or publication of this article. This research was supported by the Ministry of Science and Higher Education of the Russian Federation; the program “Monitoring”, state registration 122042500031-8. Post-processing of the cloud-resolving numerical simulation data used and discussed in this paper was supported in part by the U.S. National Science Foundation under Grant ATM-0733380.
Acknowledgments
The author thanks the journal and Topic Editors for the invitation and kindly provided partial Frontiers Fee support. The results based on cloud-resolving numerical simulation could only be obtained in close collaboration with my co-author in many works, M.T. Montgomery, and his colleagues M.E. Nicholls and S. Barve. I am deeply grateful to P.G. Black for his interest in this research and help with VHT imagery. I was also encouraged by interest from Organizers of Annual Workshop on Numerical Modeling in MHD and Plasma Physics: Methods, Tools, and Outcomes what resulted in a series of publications in 2019–2021. Online participation in international discussions via tstorms.org, “map discussions” at UAlbany, and seminars at the University of Maryland, headed by R.Z. Sagdeev with assistance from G.I. Dudnikova, were greatly supportive, especially in 2020–2023. The author is grateful to the editor and reviewers for their careful and helpful participation.
Conflict of interest
The author declares that the research was conducted in the absence of any commercial or financial relationships that could be construed as a potential conflict of interest.
Publisher’s note
All claims expressed in this article are solely those of the authors and do not necessarily represent those of their affiliated organizations, or those of the publisher, the editors and the reviewers. Any product that may be evaluated in this article, or claim that may be made by its manufacturer, is not guaranteed or endorsed by the publisher.
Supplementary material
The Supplementary Material for this article can be found online at: https://www.frontiersin.org/articles/10.3389/feart.2023.1296067/full#supplementary-material
References
Dunkerton, T. J., Montgomery, M. T., and Wang, Z. (2009). Tropical cyclogenesis in a tropical wave critical layer: easterly waves. Atmos. Chem. Phys. 9, 5587–5646. doi:10.5194/acp-9-5587-2009
Emanuel, K. (2018). 100 years of progress in tropical cyclone research. Meteorol. Monogr. 59. 15.1–15.68. doi:10.1175/AMSMONOGRAPHS-D-18-0016.1
Evgrafova, A. V., Levina, G. V., and Sukhanovskii, A. N. (2013). Study of vorticity and helicity distribution in advective flow with secondary structures. Comput. Contin. Mech. 6 (4), 451–459. (in Russian). doi:10.7242/1999-6691/2013.6.4.49
Fortov, V. E., Ivanov, M. F., Ivlev, A. V., Gnedin, Yu. N., and Klumov, B. A. (1996). Collision of Comet Shoemaker-Levy 9 with Jupiter: what did we see. Phys. Uspekhi 39, 363–392. doi:10.1070/PU1996v039n04ABEH000142
Frisch, U. (1995). Turbulence: the legacy of A.N. Kolmogorov. Cambridge, UK: Cambridge University Press.
Gray, W. M. (1979). “Hurricanes: their formation, structure, and likely role in the tropical circulation,” in Meteorology over the tropical oceans. Editor D. B. Shaw (Reading, United Kingdom: R. Meteorol. Soc.), 155–218.
Hendricks, E. A., Montgomery, M. T., and Davis, C. A. (2004). The role of “vortical” hot towers in the formation of tropical cyclone Diana (1984). J. Atmos. Sci. 61, 1209–1232. doi:10.1175/1520-0469(2004)061<1209:TROVHT>2.0.CO;2
Houze, R. A. (2010). Clouds in tropical cyclones. Mon. Wea. Rev. 138, 293–344. doi:10.1175/2009MWR2989.1
Houze, R. A., Lee, W. C., and Bell, M. M. (2009). Convective contribution to the genesis of Hurricane Ophelia (2005). Mon. Wea. Rev. 137, 2778–2800. doi:10.1175/2009MWR2727.1
Hussain, A. K. M. F. (1986). Coherent structures and turbulence. J. Fluid Mech. 173, 303–356. doi:10.1017/S0022112086001192
Ivanov, M. F., Galburt, V. A., and Fortov, V. E. (1996). On a possible mechanism of the formation of large-scale disturbances in Jupiter’s atmosphere as a result of the falling of fragments of Comet Schoemaker-Levy 9. JETP Lett. 63, 813–817. doi:10.1134/1.567096
Kilroy, G., Zhu, H., Chang, M., and Smith, R. K. (2022). Application of the rotating-convection paradigm for tropical cyclones to interpreting medicanes: an example. Trop. Cyclone Res. Rev. 11, 131–145. doi:10.1016/j.tcrr.2022.09.001
Kopp, M. I., Tur, A. V., and Yanovsky, V. V. (2021). Hydrodynamic α-effect in a rotating stratified moist atmosphere driven by small-scale non-helical force. Geophys. Astrophys. Fluid Dyn. 115, 551–576. doi:10.1080/03091929.2021.1946802
Krause, F., and Rädler, K.-H. (1980). Mean-field magnetohydrodynamics and dynamo theory. Berlin: Academie–Verlag.
Levich, E., and Tzvetkov, E. (1984). Helical cyclogenesis. Phys. Lett. A 100, 53–56. doi:10.1016/0375-9601(84)90354-2
Levich, E., and Tzvetkov, E. (1985). Helical inverse cascade in three-dimensional turbulence as a fundamental dominant mechanism in mesoscale atmospheric phenomena. Phys. Rep. 128, 1–37. doi:10.1016/0370-1573(85)90036-5
Levina, G. (2021a). How does cyclogenesis commence given a favorable tropical environment? Environ. Sci. Proc. 8 (1), 20. doi:10.3390/ecas2021-10320
Levina, G. V. (2006). Parameterization of helical turbulence in numerical models of intense atmospheric vortices. Dokl. Earth Sci. 411A, 1417–1421. doi:10.1134/S1028334X06090182
Levina, G. V. (2013). Helical organization of tropical cyclones. Cambridge, UK: Isaac Newton Institute for Mathematical Sciences. Preprint NI13001-TOD. Available at: https://www.newton.ac.uk/documents/preprints/?search=NI13001 (Accessed September 16, 2023).
Levina, G. V. (2018). On the path from the turbulent vortex dynamo theory to diagnosis of tropical cyclogenesis. Open J. Fluid Dyn. 8, 86–114. doi:10.4236/ojfd.2018.81008
Levina, G. V. (2019). A realization of the turbulent vortex dynamo in the atmosphere: based on the 21st century knowledge. J. Phys. Conf. Ser. 1336, 012007. doi:10.1088/1742-6596/1336/1/012007
Levina, G. V. (2020). Birth of a hurricane: early detection of large-scale vortex instability. J. Phys. Conf. Ser. 1640, 012023. doi:10.1088/1742-6596/1640/1/012023
Levina, G. V. (2021b). Turbulent vortex dynamo in the Earth’s atmosphere and the emerging opportunity to affect tropical cyclogenesis. J. Phys. Conf. Ser. 2028, 012017. doi:10.1088/1742-6596/2028/1/012017
Levina, G. V. (2022). Application of the turbulent vortex dynamo theory for early diagnostics of the tropical cyclone genesis. Fundam. Appl. Hydrophys. 15 (2), 47–59. doi:10.59887/fpg/vaxg-xdmv-11pn
Levina, G. V., and Burylov, I. A. (2006). Numerical simulation of helical-vortex effects in Rayleigh-Bénard convection. Nonlin. Process. Geophys. 13, 205–222. doi:10.5194/npg-13-205-2006
Levina, G. V., Moiseev, S. S., and Rutkevich, P. B. (2000). “Hydrodynamic alpha-effect in a convective system,” in Advances in fluid mechanics series no 25) nonlinear instability, chaos and turbulence. Editors L. Debnath, and D. N. Riahi (Southampton: WITPress), Vol. 2, 111–162.
Levina, G. V., and Montgomery, M. T. (2010). A first examination of the helical nature of tropical cyclogenesis. Dokl. Earth Sci. 434, 1285–1289. doi:10.1134/S1028334X1009031X
Levina, G. V., and Montgomery, M. T. (2014a). Numerical diagnosis of tropical cyclogenesis based on a hypothesis of helical self-organization of moist convective atmospheric turbulence. Dokl. Earth Sci. 458, 1143–1148. doi:10.1134/S1028334X14090189
Levina, G. V., and Montgomery, M. T. (2014b). Tropical cyclogenesis: a numerical diagnosis based on helical flow organization. J. Phys. Conf. Ser. 544, 012013. doi:10.1088/1742-6596/544/1/012013
Levina, G. V., and Montgomery, M. T. (2014c). in Helical nature of tropical cyclogenesis: WHEN will a nascent vortex become self-sustaining? Abstracts of the 31st AMS Conference on Hurricanes and Tropical Meteorology, San Diego, CA, USA, 31 March–4 April 2014. Available at: https://ams.confex.com/ams/31Hurr/webprogram/Paper243281.html (Accessed September 16, 2023).
Levina, G. V., and Montgomery, M. T. (2015). When will cyclogenesis commence given a favorable tropical environment? Procedia IUTAM 17, 59–68. doi:10.1016/j.piutam.2015.06.010
Moffatt, H.-K. (1969). The degree of knottedness of tangled vortex lines. J. Fluid Mech. 35, 117–129. doi:10.1017/S0022112069000991
Moffatt, H.-K. (1978). Magnetic field generation in electrically conducting fluids. Cambridge, UK: Cambridge University. Press.
Moffatt, H.-K. (2014). Helicity and singular structures in fluid dynamics. Proc. Natl. Acad. Sci. USA. 111, 3663–3670. doi:10.1073/pnas.1400277111
Moiseev, S. S., Rutkevich, P. B., Tur, A. V., and Yanovskii, V. V. (1988). Vortex dynamo in a convective medium with helical turbulence. Sov. Phys. JETP. 67, 294–299.
Moiseev, S. S., Sagdeev, R. Z., Tur, A. V., Khomenko, G. A., and Shukurov, A. M. (1983b). Physical mechanism of amplification of vortex disturbances in the atmosphere. Sov. Phys. Dokl. 28, 925–928.
Moiseev, S. S., Sagdeev, R. Z., Tur, A. V., Khomenko, G. A., and Yanovsky, V. V. (1983a). Theory of the origin of large-scale structures in hydrodynamic turbulence. Sov. Phys. JETP. 58, 1149–1157.
Molinari, J., and Vollaro, D. (2008). Extreme helicity and intense convective towers in Hurricane Bonnie. Mon.Wea. Rev. 136, 4355–4372. doi:10.1175/2008MWR2423.1
Molinari, J., and Vollaro, D. (2010). Distribution of helicity, CAPE, and shear in tropical cyclones. J. Atmos. Sci. 67, 274–284. doi:10.1175/2009JAS3090.1
Montgomery, M. T., Davies, C., Dunkerton, T., Wang, Z., Velden, C., Torn, R., et al. (2012). The Pre-depression Investigation of Cloud Systems in the Tropics (PREDICT) experiment: scientific basis, new analysis tools, and some first results. Bull. Amer. Meteor. Soc. 93, 153–172. doi:10.1175/BAMS-D-11-00046.1
Montgomery, M. T., Nicholls, M. E., Cram, T. A., and Saunders, A. B. (2006). A vortical hot tower route to tropical cyclogenesis. J. Atmos. Sci. 63, 355–386. doi:10.1175/JAS3604.1
Montgomery, M. T., and Smith, R. K. (2017). Recent developments in the fluid dynamics of tropical cyclones. Annu. Rev. Fluid Mech. 49, 541–574. doi:10.1146/annurev-fluid-010816-060022
Munsi, A., Kesarkar, A. P., Bhate, J. N., Rajasree, V. P. M., and Kutty, G. (2023). Helicity evolution during the life cycle of tropical cyclones formed over the North Indian Ocean. Adv. Space Res. 71 (3), 1473–1485. doi:10.1016/j.asr.2022.10.004
NHC Glossary (2023a). National hurricane center and central pacific hurricane center NOAA. Available at: https://www.nhc.noaa.gov/aboutgloss.shtml (Accessed September 16, 2023).
NHC Glossary (2023b). National hurricane center and central pacific hurricane center NOAA. Available at: https://www.nhc.noaa.gov/aboutgloss.shtml#i (Accessed December 27, 2023).
NHC Glossary (2023c). National hurricane center and central pacific hurricane center NOAA. Available at: https://www.nhc.noaa.gov/aboutgloss.shtml#p (Accessed December 27, 2023).
Nicholls, M. E., and Montgomery, M. T. (2013). An examination of two pathways to tropical cyclogenesis occurring in idealized simulations with a cloud-resolving numerical model. Atmos. Chem. Phys. 13, 5999–6022. doi:10.5194/acp-13-5999-2013
Nolan, D. S. (2007). What is the trigger for tropical cyclogenesis? Aust. Meteor. Mag. 56, 241–266. Available at: http://www.bom.gov.au/jshess/docs/2007/nolan.pdf (Accessed September 16, 2023).
Nolan, D. S., Atlas, R., Bhatia, K. T., and Bucci, L. R. (2013). Development and validation of a hurricane nature run using the joint OSSE nature run and the WRF model. J. Adv.Model. Earth Syst. 5, 382–405. doi:10.1002/jame.20031
Reasor, P. D., Montgomery, M. T., and Bosart, L. F. (2005). Mesoscale observations of the genesis of Hurricane Dolly (1996). J. Atmos. Sci. 62, 3151–3171. doi:10.1175/JAS3540.1
Riehl, H., and Malkus, J. S. (1958). On the heat balance in the equatorial trough zone. Geophysica 6, 503–538.
Siegelman, L., Klein, P., Ingersoll, A. P., Ewald, S. P., Young, W. R., Bracco, A., et al. (2022). Moist convection drives an upscale energy transfer at Jovian high latitudes. Nat. Phys. 18, 357–361. doi:10.1038/s41567-021-01458-y
Sippel, J. A., Nielsen-Gammon, J. W., and Allen, S. E. (2006). The multiple-vortex nature of tropical cyclogenesis. Mon. Wea. Rev. 134, 1796–1814. doi:10.1175/MWR3165.1
Wikipedia (2023). The free encyclopedia. Available at: https://en.wikipedia.org/wiki/Tropical_cyclone_scale (Accessed September 16, 2023).
Yarovaya, D. A., and Levina, G. V. (2019). “Study of vortical convection of the quasi-tropical cyclone over the Black Sea by cloud-resolving numerical modeling,” in the All-Russian Conference “Climate change: causes, risks, consequences, problems of adaptation and management”, Moscow, Russia. Abstracts, November 26–28 (Moscow: Fizmatkniga), 132. (in Russian).
Keywords: planet atmospheres, rotating moist convection, helical turbulence, upscale energy transfer, cyclogenesis
Citation: Levina G (2024) Helical cyclogenesis as an extreme threshold phenomenon in a rotating stratified moist atmosphere. Front. Earth Sci. 11:1296067. doi: 10.3389/feart.2023.1296067
Received: 18 September 2023; Accepted: 24 November 2023;
Published: 09 January 2024.
Edited by:
Yuliya Troitskaya, Institute of Applied Physics (RAS), RussiaReviewed by:
Eric Hendricks, National Center for Atmospheric Research (UCAR), United StatesTimothy Dowling, University of Louisville, United States
Copyright © 2024 Levina. This is an open-access article distributed under the terms of the Creative Commons Attribution License (CC BY). The use, distribution or reproduction in other forums is permitted, provided the original author(s) and the copyright owner(s) are credited and that the original publication in this journal is cited, in accordance with accepted academic practice. No use, distribution or reproduction is permitted which does not comply with these terms.
*Correspondence: Galina Levina, levina@cosmos.ru