Analysis of the movement pattern of overburden and the form of spatial development of separation after mining in a fully mechanized caving face
 Wanpeng Huang
 Mingfeng Yang
 Yaxin Liu1
 - 1College of Energy and Mining Engineering, Shandong University of Science and Technology, Qingdao, China
- 2State Key Laboratory of Efficient Mining and Clean Utilization of Coal Resource, Beijing, China
- 3School of Emergency Technology and Management, North China Institute of Science and Technology, Beijing, China
- 4Xinchaizhuang Coal Mine, Shandong Luzhong Energy Group Co. Ltd., Taian, China
For the fully mechanized caving face, it is easy to cause significant surface subsidence and other related problems after large-scale mining of coal seams, we should take some measures to solve them. In this study, in order to further explore the movement pattern of overburden and the form of spatial development of separation after mining in a fully mechanized caving face, we combined the engineering practice of Tangshan mining area, took the T2294 and T2291 working faces as the engineering background and used the three methods of similar simulation, numerical simulation and field measurement to comprehensively study. The results show that in the first stage of working face mining, the separation can generally reach 0.31 times the mining thickness of the coal seam, and the maximum can reach 0.58 times the mining thickness; in the second stage, the width of the separation seam is narrow, and the separation is small. It generally takes 20–30 days for the separation to reach its maximum from initiation, which is equivalent to the working face advancing 70–100 m, and the corresponding horizon height is 200 m. The research results provide theoretical guidance and a basis of engineering practice for the safe mining of multiple working faces under the Jingshan railway. This study even provides a basic theoretical reference for the safe mining of a thick coal seam working face under similar engineering geological conditions.
1 Introduction
The mining method of fully mechanized caving in a thick coal seam has the typical characteristics of a large thickness of primary mining of the coal seam and a wide influence range of overburden movement. After large-scale mining of coal seams, it is easy to cause significant surface subsidence, which has a serious impact on the safe use of buildings/structures in the area and the ecological balance of the mining area. In recent years, domestic and foreign experts and scholars have developed separation grouting technology for overburden separation in thick coal seam mining to solve the above technical problems. To obtain the optimal effect of separation grouting to control mining subsidence, the key scientific problem to be solved is the movement pattern of overburden and the spatial and temporal development of separation space in a fully mechanized caving face, which can provide basic theoretical support for controlling surface subsidence and safe production in mining areas.
Many domestic and foreign experts and scholars have carried out useful research and discussion on the movement pattern of overburden and the development pattern of separation in fully mechanized caving faces and have obtained a series of useful research conclusions. Guo et al. (1995) proposed the formula for predicting separation height under ideal conditions. The high-extension method uses the displacement back analysis method to carry out model identification and theoretical analysis and proposes the concept of the “four-band” model, which provides a theoretical basis for the accurate algorithm of rock movement and deformation (Gao, 1996). Some scholars proposed the key strata theory of strata control, constructed the discrimination method of the key strata position of overburden, and analyzed the influence of key strata movement on surface movement and the evolutionary pattern of separation, which laid a theoretical foundation for studying the separation movement pattern of overburden (Xu and Qian, 2000; Qian et al., 2003; Xu et al., 2004). International scholar used a rubber plug during ground drilling and measured the gas overflow section by section during drilling to further determine the height of the overburden failure zone and the horizontal separation position (Palchik, 2003; Palchik, 2005). Based on Cosserat theory, Chen and Guo, (2008) analyzed the mechanism of overburden separation development during longwall mining. Shen and Brett, (2014) studied the movement and stress concentration of overburden after mining coal seams with the longwall mining method. Jiang et al. (2014) studied the law of fracture instability of high-level hard and thick rock strata and obtained the evolutionary pattern of separation space under high-level magmatic rocks. Yang et al. (2015) established a two-dimensional similar material simulation and FLAC 3D numerical simulation model to study the development pattern of deformation and fracturing of the overburden of the coal seam and the size of the stress release zone. Yu et al. (2015) measured and analyzed the cracks in the hole wall through digital panoramic technology and obtained the movement and failure pattern of the overburden. Wang et al. (2017) used UDEC numerical simulation software to simulate the movement of overburden and studied and analyzed the movement and separation characteristics of overburden. Some scholars established a similarity simulation experiment system to study the mining-fracture-evolution characteristics of overburden and obtain the deformation law of overburden (Ju et al., 2017; Ye et al., 2018; Zhao et al., 2020). Zhu et al. (2018) studied the influence of elastic expansion of rock mass unloading induced by mining on the development of separation by combining triaxial unloading tests and theoretical calculation. Wang et al. (2019) analyzed the failure characteristics of overburden and the development of separation space filled with different overburden soil combinations through numerical simulation.
To further explore the movement pattern of overburden and the form of spatial development of separation after top coal cave mining in a thick coal seam, this paper combines the engineering practice of the Tangshan mining area based on the previous theoretical and technical research foundation, adopts the comprehensive research method of similar simulations, numerical simulations and field measurements, and studies and analyzes the spatiotemporal movement pattern of the roof after mining in a thick coal seam working face from different angles. On this basis, the development pattern of overburden separation space and the factors influencing the correlation of separation quantity are summarized. This study provides a basic theoretical reference for the safe mining of a thick coal seam working face under similar engineering geological conditions.
2 Engineering overview and stratum structure analysis
2.1 Project overview
The Tangshan Coal Mine of the Kailuan Mining Group produces more than 3 million tons of raw coal per year and is the main production mine of the company. However, the large amount of coal pressure on the surface severely restricts the sustainable development of the Tangshan Coal Mine. The Jingshan Railway, which runs through the center of the Tangshan Coal Mine, is a national Class I railway. The influence of the coal line is nearly 10 km long. The Jingshan Railway is in the southwest‒northeast direction, and the railway is located above the center of the second mining area. The second mining area is the main mining area of the Tangshan Coal Mine, and the working face layout of the mining area is shown in Figure 1. The working faces from south to north in the northeastern part of the Tieer mining area are the T2191, T2192, T2193(1), T2193(2), T2194 and T2195 working faces, the strike length of these working faces are 1040 m, 960 m, 935 m, 872 m, 852 m and 854 m, and the inclined length of these working faces are 148 m, 150 m, 130 m, 134 m, 130 m, 125 m. The T2294 and T2291 working faces are in the southeast direction. The strike length of the T2294 working face is 1,195 m, and the inclined length of the working face is 144 m. The strike length of the T2291 working face is 1,062 m, and the inclined length of the working face is 138 m. The T2291 and T2294 working faces are adjacent to each other. The coal seam thickness and roof structure are consistent. The coal seam thickness is 10 m, the average dip angle is 13°, and the average burial depth is 676 m. The main roof is a fine–medium sandstone with a thickness of 8.6 m. The immediate roof is a siltstone with a thickness of 5.3 m, and there is no false roof.
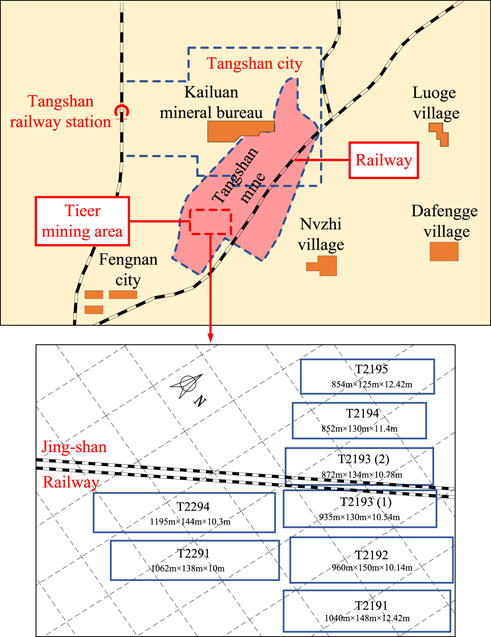
FIGURE 1. Working face layout of mining area.
The working face layout of mining area is shown in Figure 1. The six working faces on the northeast side of Figure 1 are located near the Jingshan railway line, among which T2193(1) and T2193(2) are located directly below the railway. If multiple working faces, such as T2191-T2,195, are directly mined, due to the close proximity of the working face and the large area of combined mining, compared with single working face mining, the adverse effects on the surface and the railway line are more prominent. Therefore, in the early stage, the T2294 and T2291 working faces were used as the engineering background for experimental mining, and the migration pattern of overburden above the working face and the development and evolutionary processes of separation were studied and analyzed, forming the basis of engineering practice. The objectives were to guide the safe mining of the T2191-T2195 working face and then provide basic data for surface subsidence control after mining.
During the main part of the mining of coal seam 9 in the Tieer mining area, the mining elevations are -550-740 m. The working face is mined by comprehensive mechanized top coal caving technology, and the roof is managed by the all caving method. The technical characteristics of coal seam occurrence are shown in Table 1. The lithology of the upper surrounding rock of coal seam 9 is quite different, and the whole area has a medium-strength structure of the stratum. The geological comprehensive histogram of the mining area is shown in Figure 2, and the main physical and mechanical parameters of the typical surrounding rock are shown in Table 2.

TABLE 1. Technical characteristics of coal seam occurrence.
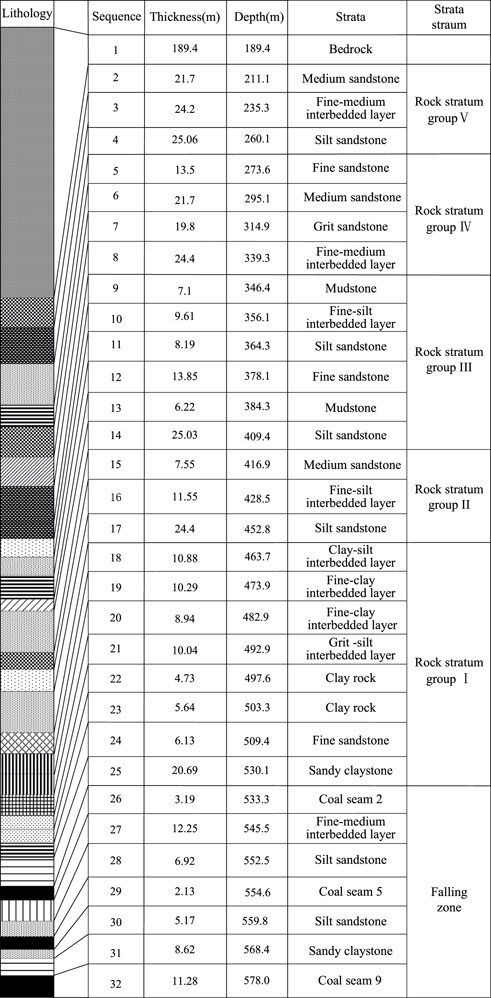
FIGURE 2. Geological comprehensive histogram.
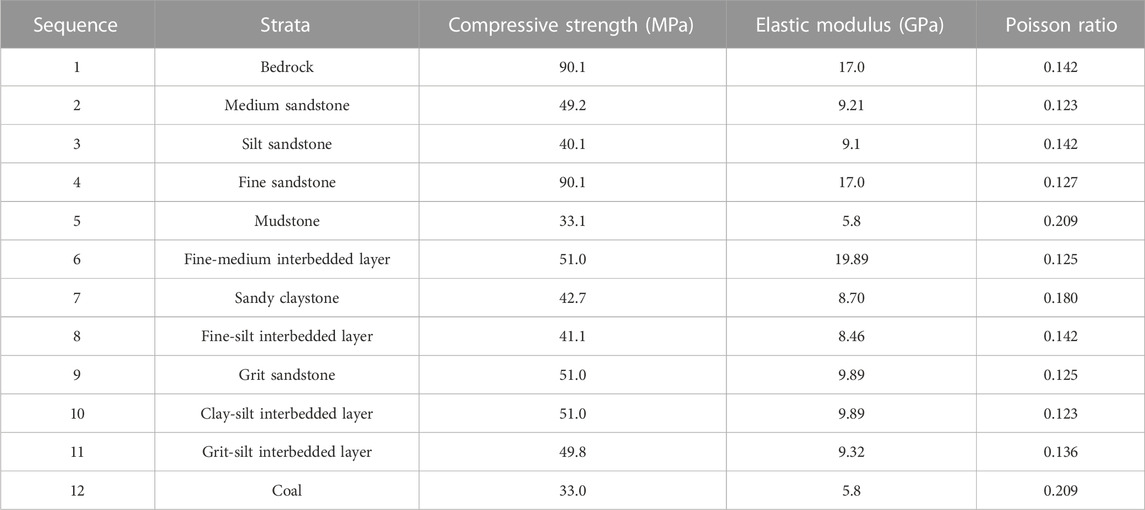
TABLE 2. Main physical and mechanical parameters of the typical surrounding rock.
2.2 Analysis of the stratigraphic structure
To study the movement pattern and form of separation development of overburden in thick coal seams after mining, the structural characteristics of overburden in coal seams should be analyzed first. The overburden structure of a coal seam is composed of multilayer coal strata with different thicknesses and lithologies, so its combined characteristics and movement rules are quite different. Sometimes overburden shows group movement characteristics. Group movement refers to the synchronous and coordinated movement of the upper layers of soft rock strata driven by a layer of hard rock strata at the bottom of the strata group (Song, 1988). The combined movement of rock strata is determined by the strength of the factors of each rock stratum (including lithology, thickness and elastic modulus). The upper rock strata with factors with low strength move simulta neously with the lower rock strata with factors with high strength, and the curvature of the subsidence is the same. The upper rock strata with factors with higher strength gradually separate from the lower rock strata with factors with lower strength.
For the two adjacent rock strata, whether they move at the same time to form a strata group or separate movement can be judged by the maximum curvature in the settled rock stratum.
When
When
The maximum curvature of the rock beam can be expressed by the following formula:
Where
According to the above criterion analysis, according to the stratigraphic structure shown in Figure 2, the overburden of the coal seam roof can be divided into 5 strata groups.
1) Strata group I contains No. 18 to No. 25 strata. The lower No. 25 sandy claystone has a large thickness and high strength, and other strata in the upper part attach to the No. 25 sandy claystone and move at the same time.
2) Strata group II contains No. 15 ∼ No. 17 strata, and the movement of this strata group is determined by the No. 17 silt sandstone at 24.4 m.
3) Strata group III contains No. 9 ∼ No. 14 strata; the movement of this strata group is determined by the No. 14 silt sandstone at 25.03 m;
4) Strata group IV contains No. 5 ∼ No. Eight strata, and the movement of this strata group is determined by the No. Eight fine-medium interbedded layer at 24.4 m.
5) Strata group V contains No. 2 ∼ No. 4 strata; the movement of this strata group is determined by the No. 4 silt sandstone at 25.06 m.
3 Research methods and schemes
3.1 Similar simulation research method
(1) Similar simulation experimental materials and parameters
The similar simulation takes the T2291 working face as the engineering background. Gypsum and calcium carbonate are selected as cementing materials, river sand is used as filling material, and different proportions of materials are made into specimens to simulate the weak, medium hard and hard rock strata in the stratum The rock strata ranging from the surface to the floor of coal seam 9 are simulated, and the actual rock strata thickness is 580 m. The main similarity ratios for the similar models are shown in Table 3.
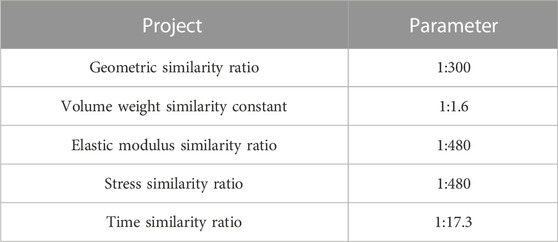
TABLE 3. The main similarity ratios for the similar models.
According to the similarity ratio and the physical and mechanical parameters of the simulated coal strata, combined with the test results of similar material specimens, the similar material ratio of typical surrounding rock is determined, as shown in Table 4 (Huang et al., 2022a; Huang et al., 2022b; Huang et al., 2023a).
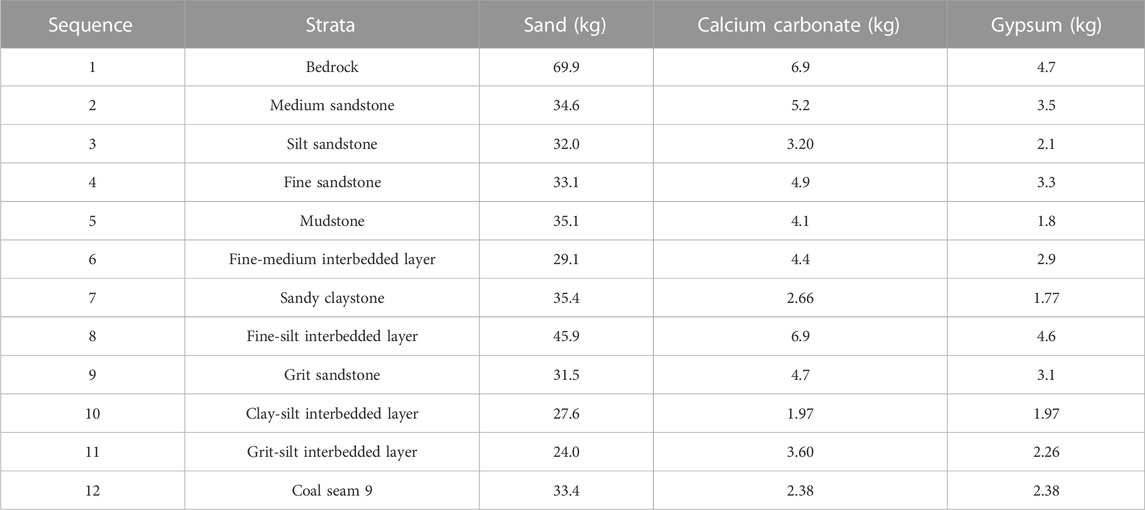
TABLE 4. Similar material ratio of typical surrounding rock (1:300).
(2) Introduction of the similar simulation laboratory and experimental scheme
To prevent changes in the mechanical parameter of the material used for the similar experimental model after drying and curing, which leads to an increase in the experimental error, the research team designed and constructed the ‘constant humidity and constant temperature similar material simulation laboratory’ in the State Key Laboratory of Shandong University of Science and Technology, as shown in Figure 3. The humidity in the laboratory is set to 60%, and the temperature is set to 16 °C. The laboratory is an assembled detachable structure, and its plate is a colored steel composite sandwich plate, which mainly plays a role in heat preservation. In the room, air conditioners and humidifiers are used to control temperature and humidity, and thermometers and relative humidity meters are used to monitor temperature and humidity.
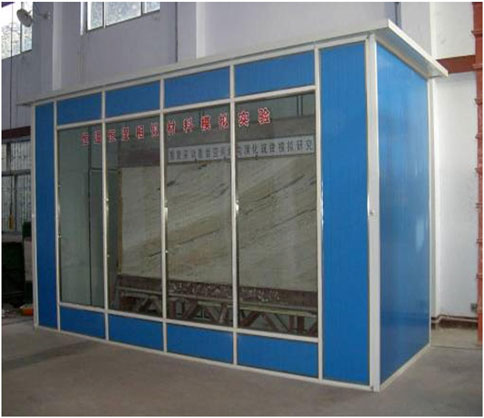
FIGURE 3. Constant humidity and constant temperature similar material simulation laboratory.
The experiment uses a plane stress test bench of 4.0×0.28×2.0 m. The large test bench consists of a frame system, a test system, and a loading system. The loading system is jack-loaded, and the vertical settlement of the surface is measured using a dial indicator. The horizontal movement and subsidence of the surface and various rock strata are measured using a light lens displacement meter (Chai et al., 2023). The mining footage of the site is 104 m/month. The experiment uses step-by-step excavation; 10 cm are mined at 8:00 a.m., and 10 cm are mined at 4:30 p.m. every day; and the overburden movement and surface movement are observed at the end of each step to obtain information such as the time and amount of separation during the mining of the working face.
3.2 Numerical simulation research method
(1) Model construction and mechanical parameter determination
According to the engineering situation and analysis of the stratum structure in the Tieer mining area, the lithology of composition is simplified. Combined with the characteristics of ANSYS numerical simulation software, a three-dimensional calculation of the engineering geological model is constructed, as shown in Figure 4. The model size is X×Y×Z=2000 m×2000 m×900 m. The elastoplastic yield criterion, i.e., the Drucker‒Prager (DP) yield criterion, is selected, and the contact parameters are used to simulate the ‘weak surfaces’ between strata, the ‘weak surface’ artificially weakens the physical and mechanical parameters of the contact surface, namely, the bedding plane or the structural plane, so that the corresponding position in the rock strata in the process of the advancing working face is more likely to produce separation. The Coulomb friction model is selected as the basic model, and the elastic‒plastic constitutive relation of the Mohr‒Coulomb criterion is calculated. For the model calculation, the selected rock mechanics parameters are shown in Table 5.
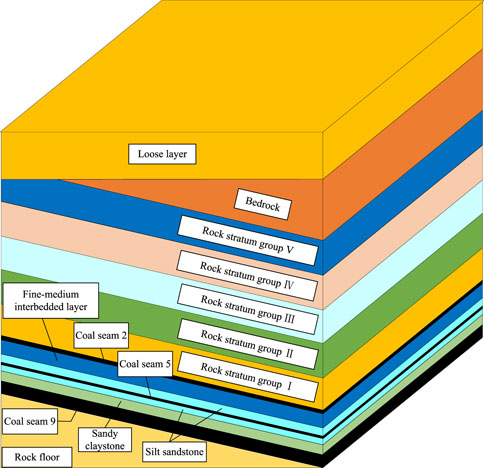
FIGURE 4. Three-dimensional calculation of the engineering geological model.
(2) Simulated excavation and monitoring scheme

TABLE 5. Selected rock mechanics parameters.
Combined with the characteristics of ANSYS numerical simulation software, a three-dimensional calculation of the engineering geological model is constructed, as shown in Figure 4. The model size is X×Y×Z=2000 m×2000 m×900 m. The elastoplastic yield criterion, i.e., the Drucker‒Prager (DP) yield criterion, is selected, and the contact parameters are used to simulate the weak surfaces between strata. The Coulomb friction model is selected as the basic model, and the elastic‒plastic constitutive relation of the Mohr‒Coulomb criterion is calculated (Shi and Ji, 2021). For the model calculation, the selected rock mechanics parameters are shown in Table 5.
The numerical simulation takes the T2294 working face as the engineering background, and the generalized model is divided into 5,400 units from the coal seam floor to the surface. After the initial ground stress field reaches equilibrium, the weak surfaces are set at 50 m, 90 m, 149 m, 202 m, 240 m and 306 m above the roof of the working face (each weak surface corresponds to the No. 25, 21, 17, 12, 8, and 5 rock strata in Figure 2–Comprehensive stratigraphic column). The size of the separation and the evolutionary process of the strata at the weak surface when advancing 200 m, 300 m, 400 m, 500 m, 600 m and 700 m in the strike direction are monitored.
3.3 Method of field measurement research
(1) Observation device and method and observation borehole layout scheme
Field measurement uses deep borehole rock movement observation device. The adopted method is the deep base point observation method. Before mining, a vertical borehole is drilled from the surface to the roof of the mining area. The treated compressed wood is placed and fixed at different depths in the hole as the observation base point. As the working face advances, the variation in the lead drilling according to the observation base point displacement is transmitted to the surface through the steel wire connecting the compressed wood to obtain the movement and change in the rock stratum where the measuring point is located. The measurement base point of assembled compressed wood is shown in Figure 5.
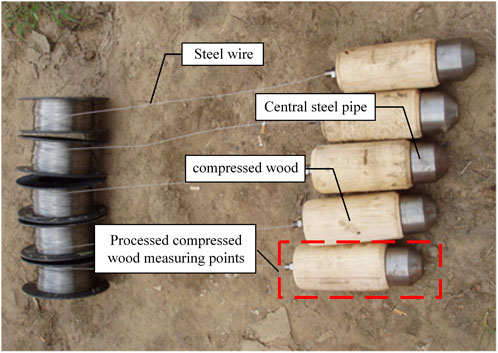
FIGURE 5. Measurement base point of assembled compressed wood.
The boreholes in which surface rock movement are arranged in the mined T2294 and T2291 working faces. The observation boreholes are arranged in the middle of the T2294 working face. The distance from the borehole to the open cut is 150 m. In the inclined direction of the working face, the distance between the upper borehole and the upper groove is 77 m, and the distance from the lower groove is 67 m, as shown in Figure 6A.
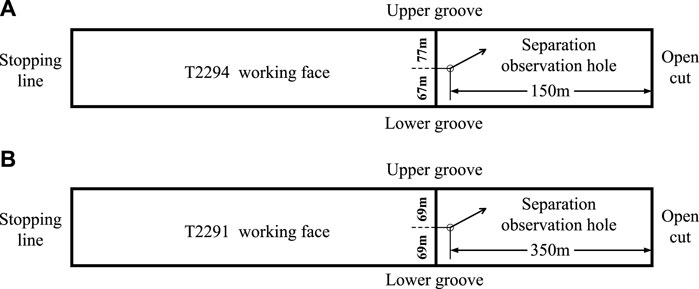
FIGURE 6. Observation borehole layout plan of T2294 and T2291 working face. (2) Measurement point layout and measurement scheme
The observation borehole is in the middle of the T2291 working face. The distance between the borehole and the open cut is 350 m. In the inclined direction of the working face, the distance between the borehole and the upper groove is 69 m, and the distance between the borehole and the lower groove is 69 m, as shown in Figure 6B.
After the mining of the working face, the movement and deformation of the rock strata began to move and deform until the movement and deformation of the rock strata were stable. In the vertical direction, the displacement of the 230 m rock strata from 130 to 350 m in the roof of the two working faces was observed. A total of 6 measuring points were installed in the T2294 borehole for observing the separation. The horizon for observing the separation was selected to be 180–350 m upward from the coal seam roof, and the depth interval of the observed rock strata was 372–543 m. A total of 6 measuring points were installed in the T2291 borehole for observing the separation. The stratum for observing the separated was selected to be 100–300 m upward from the coal seam roof, and the depth interval of the observed rock strata was 356–496 m (Wang et al., 2020; Huang et al., 2023c). According to the structure and mechanical properties of the rock strata, the position of the separation of the rock strata was assessed, and the observation points for the separation were arranged. The positions of the 6 measuring points in the T2294 and T2291 working faces are shown in Tables 6, 7.
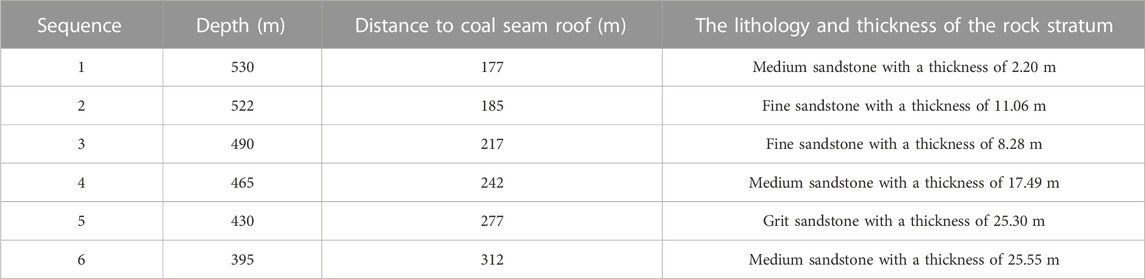
TABLE 6. Positions of the 6 measuring points in the T2294 working faces.
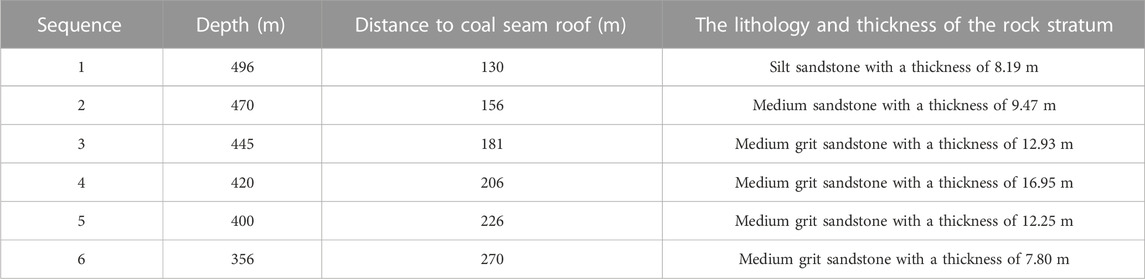
TABLE 7. Positions of the 6 measuring points in the T2291 working faces.
The observation borehole structures of the T2294 and the T2291 working faces are shown in Figure 7. The measuring points were all arranged in the thick and hard rock strata. The distance between the orifice and the measuring point and the elevation of the were measured and recorded regularly. According to the change in the displacement of different measuring points with time, information on the separation quantity was obtained, and the law of overburden movement is discussed and summarized.

FIGURE 7. Observation borehole structures of the T2294 and the T2291 working faces.
4 Analysis of the results
4.1 Analysis of similar simulation results
In the experiment, the first caving step distance of the T2291 working face is 75 m, and the periodic caving step distance is 30 m. Every time there is a periodic collapse, the damage and movement of the overburden are upward-directed, and a certain distance is expanded in the direction of the working face. That is, with the advancement of the working face, the development of the overburden damage is basically expanding in the form of an ‘arch’ and gradually upward and forward, as shown in Figure 8.
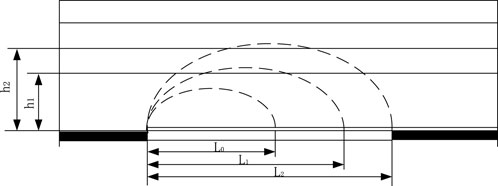
FIGURE 8. Schematic diagram of the development of ‘fracture arch'.
The formation and closure of the separation space of the overburden is a dynamic evolutionary process. When the working face advances to different positions, the pattern of the location of the separation and the size of the separation are shown in Figure 9.

FIGURE 9. The evolution process of separation space in the process of mining.
In the initial advancing stage of the working face, the overburden on the working face gradually bends, deforms and destroys, forming a falling zone. As the advance continues for a certain distance, the fracture zone gradually forms, and separation begins to develop. When the working face advances to 160 m, the separation has developed for a period of time. At this time, the separation space is large, and a ‘wide crescent shape’ separation appears. According to the similarity ratio, the separation value of the experimental model is converted, and the length of the separation space is obtained. The separation reaches 21 m, and the maximum height in the middle is 3 m, as shown in Figure 9A; when the working face continues to advance to 360 m, the new separation is more fully developed than the original separation, which is reflected in the increase in the width and height of the separation. The width reaches 39 m, and the height reaches 6 m, as shown in Figure 9B. At this time, the position of the separation in Figure 9A has been compacted, and only part of the residual separation remains. The position of the maximum separation in Figure 9B is relative to the position of the original separation space in Figure 9A. The separation is formed by raising upward and advancing toward the working face. When the working face continues to advance to 460 m, the separation continues to develop along the original vertical direction and the advancing direction of the working face. The maximum separation in Figure 9B is closed to a certain extent, and the separation height is reduced; however, the separation width increases, and the separation presents a ‘flat crescent shape’, as shown in Figure 9C. At this time, the separation width is 52.5 m, and the height is 2.4 m (Jiang et al., 2015).
In summary, if the mining distance of the working face continues to increase, the trend of the development of the maximum separation will continue to develop in the horizontal direction and continue to rise upward in the vertical direction, while the previous separation will be compacted, leaving only part of the residual separation. However, the height of the newly generated maximum separation will also decrease with increasing separation, and the width will increase to a certain extent (Yuan et al., 2019; He et al., 2020).
In summary, the results or rules obtained by the similar simulation are as follows.
(1) As the working face advances, separation is generated from the bottom to the top. The time that the separation exists is negatively correlated with the depth of the upper rock strata and positively correlated with the strength factor. In other words, the greater the depth of the upper rock strata is, the shorter the existence time of the separation is, the greater the strength factor of the upper rock strata is, the longer the existence time of the separation is.
(2) The expansion of the separation space has a certain temporal effect, that is, it takes 20–30 days from the initiation of separation to reach its maximum, which is equivalent to a working face advance of 70–100 m.
(3) In the first stage, namely, the first weighting and the first periodic weighting stage, the maximum separation formed in the lower strata is larger than that in the upper strata. In the crack belt, the maximum separation can reach 0.58 times the thickness of the coal seam. When the separation is transmitted to the limit equilibrium cove, the separation can generally reach 0.31 times the thickness of the coal seam. In the second stage, after the second periodic weighting, the separation is still present, and the horizon is clear, but the width of the separation is narrow. When the working face continues to approximately 30 m, that is, after a pressure step, as the separation fractures, the separation in the separation belt is quickly closed.
4.2 Analysis of numerical simulation results
The dynamic development of separation during mining is shown in Figure 10. In the initial advancing stage of the working face, the separation begins to develop along the vertical direction and the advancing direction of the working face, as shown in Figures 10A,B. With the continuous advancement of the working face, the scale of separation development continues to expand. The scale of separation development in the advancing direction of the working face is particularly obvious. In the vertical direction, the degree of separation development is small, and the lower separation begins to show a closed trend, as shown in Figures 10C,D. Figures 10E,F show that when the working face advances to 600 m and 700 m, the size of the separation is further expanded compared with those shown in Figures 10C,D. The lower separation is compacted, but some of the separations are not completely compacted. With increasing mining distance, the low-level separation is gradually compacted, the high-level separation begins to develop, and the high-level separation is larger than the low-level uncompacted separation. This result has similar regularity with similar simulation results (Zhang et al., 2016).
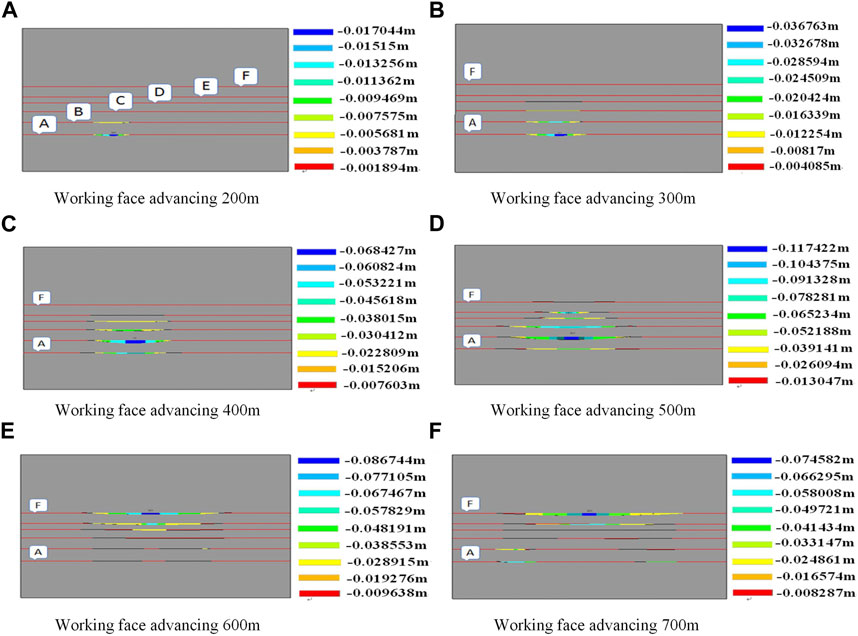
FIGURE 10. Dynamic development of separation during mining.
The weak surfaces above the coal seam roof are recorded as A, B, C, D, E, and F, as shown in Figure 10A. According to Figure 10, the corresponding relationships between different advancing distances and separation characteristics are summarized in Table 8. The curve showing the development of the separation amount from 200 to 700 m during the advance of the working face is shown in Figure 11. Figure 11 shows that the separation at each location gradually develops from zero to the maximum and finally tends to close. The separation at each location develops to the maximum at 500–600 m, and when the working face advances to 700 m, there is almost no separation at 200, 300 and 400 m.
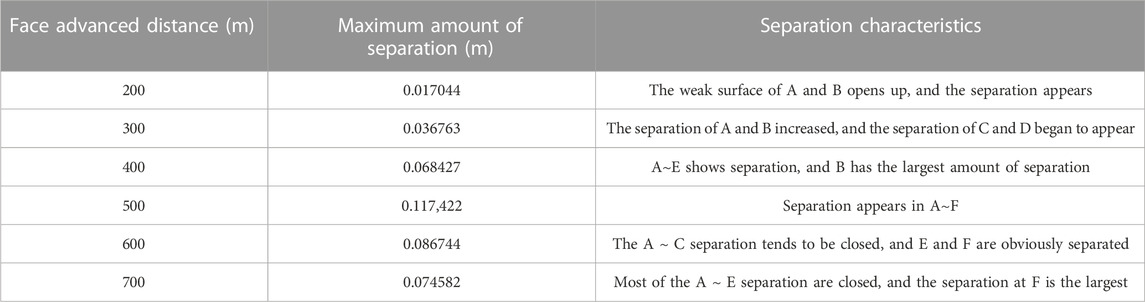
TABLE 8. The corresponding relationships between different advancing distances and separation characteristics.
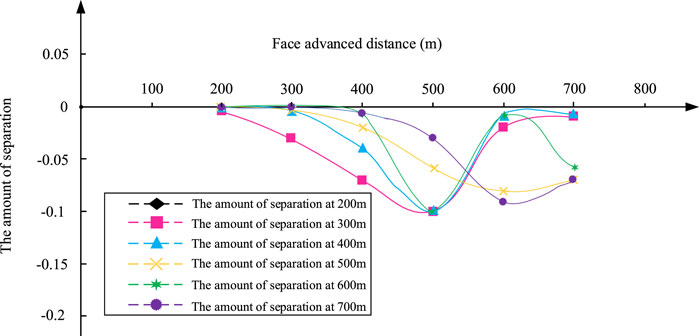
FIGURE 11. Development curve of the separation amount from 200 to 700 m.
In summary, the results or rules obtained by numerical simulation are as follows.
(1) In the advancing direction of the working face, the scale of separation development gradually increases. In the vertical direction, the lowermost separation tends to close with the emergence of the upper separation. After mining is completed, the middle and lower separations and cracks slowly close and finally form a residual separation.
(2) The vertical depth of the model of the section along strike is 900 m, and separation begins to appear when the working face advances to 200–300 m, as shown in Figures 10A,B. For the mining of medium–hard strata and medium–thick coal seams, when the advancing distance reaches approximately 1/3 of the mining depth, separation begins to appear above the crack belt.
(3) Different sizes of separations are produced at each weak surface above the coal seam roof. The separation has a strong sensitivity to the lithology and thickness of the rock strata. If the lithology of the adjacent rock strata are quite different or the lithology of the adjacent rock strata is similar but the thickness or elastic modulus is quite different, separation is also produced.
4.3 Analysis of field measurement results
The six measuring points on the T2294 surface and the T2291 surface are recorded as #1, #2, #3, #4, #5, and #6. The curves showing the observations of overburden subsidence and separation in the two working faces are shown in Figure 12. A comparison and analysis of the above two figures shows that the subsidence patterns of overburden in the three stages of the two working faces show a similar regularity: in the first stage, the displacements of each measuring point along the two working faces relative to the ground are very small, and the overburden basically does not sink; in the second stage, the overburden of the two working faces sinks frequently and periodically, and the magnitude of sinking increases rapidly. In the third stage, the development of the separation of the two working faces is basically stagnant, and no new separation is produced. In the first stage and the third stage, the subsidence of the overburden and the development of the separation are very small, and separation mainly occurs in the second stage. In this stage, the separation space increases obviously, the displacement relative to the ground increases rapidly, the overburden sinks concentratedly, and the relative displacement between each measuring point is not large; that is, the sinking and separation of each measuring point are not uniform and continuous throughout the whole process but show a jump (Fan et al., 2022; Yu et al., 2017; Feng et al., 2021; Huang et al., 2023b).
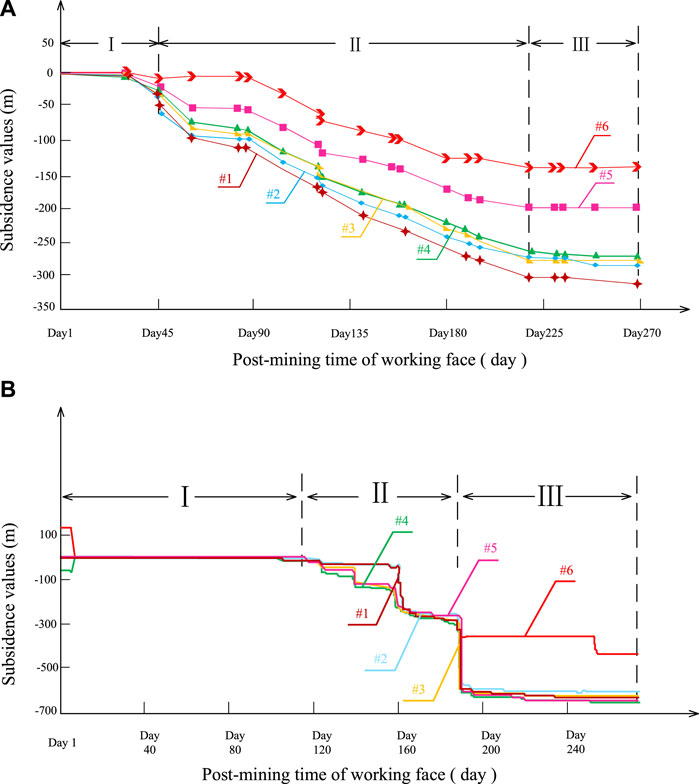
FIGURE 12. Observation curve of overburden subsidence and separation in T2294 and T2291 working face.
Figure 13, respectively include the curve showing the amount of separation between each measuring point on the T2294 and T2291 working faces and the curve showing the total amount of separation within the measurement range. Among them, the curves named '#1-2, #2-3, #3-4, #4-5, and #5–6 separation’ represent the change in the amount of separation between measuring points #1–#2, #2–#3, #3–#4, #4–#5, and #5–#6, respectively. The curve named ‘total separation’ is the result of superposition of all the above separation curves, that is, represents the change in the total amount of separation within the measurement range.
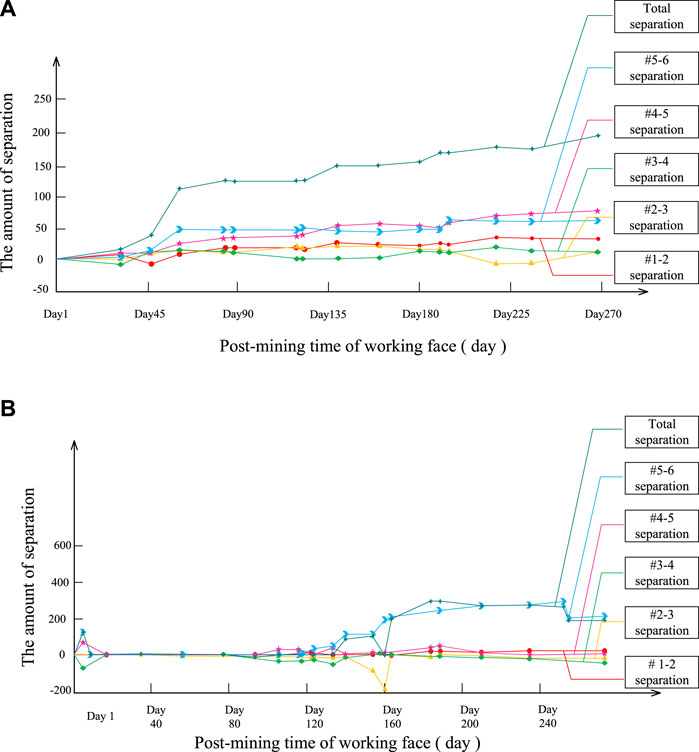
FIGURE 13. The amount of separation between each measuring point on the T2294, T2291 working faces and the total amount of separation within the measurement range.
In summary, the results or rules obtained from field measurements are as follows.
(1) According to Figure 13, the maximum separation during separation development observed in the T2294 working face is 88 mm, and the maximum separation observed in the T2291 working face is 295 mm. The maximum separation of the two working faces occurs between the #4 and #5 curves.
(2) The separation between the two measuring points with large digital number is obviously larger than that between the two measuring points with small digital number: as shown in Figure 13, the separation of '#5-6′ is obviously larger than that of '#1-2'. This result shows that when the working face is completed, the lower separation is gradually compacted, leaving only the residual separation, and the separation space gradually develops upward to the high-level position. The separation generated by the high-level position is larger than the residual separation that has been compacted in the lower part. This conclusion has a similar regularity with the relevant conclusions obtained from similar simulations and numerical simulations.
5 Discussion
The rock strata in the Tieer mining area are medium–hard rock strata, so the formula for calculating the height of the falling zone is selected:
The crack belt calculation formula is as follows:
where M is the thickness of the coal seam, and the ranges of the falling zone and crack belt are calculated. According to the above discussion and analysis, the structure diagram of the whole section of coal seam 9 to the surface is drawn, as shown in Figure 14. Finally, the results or rules of three kinds of experiments are compared and studied, and the relevant conclusions of the movement pattern of overburden and the form of development of separation space after mining of a thick coal seam are obtained.
(1) With the advance of the working face, separation is generated from the bottom to the top. The time of separation existence is negatively correlated with the depth of the upper rock strata and positively correlated with the strength factor. The expansion of the separation space has a certain temporal effect, that is, it generally takes 20–30 days for the separation to reach its maximum from initiation, which is equivalent to the working face advancing 70–100 m, and the corresponding horizon height is 200 m.
(2) If the lithologies of adjacent rock strata are similar, the thickness of the upper rock strata is larger than the thickness of the lower rock strata, and it also produces separation. The separation has a strong sensitivity to the thickness of the rock strata. The difference in the bending stiffness between two adjacent rock strata is the key to the occurrence of separation. The bottom surface of the thick and hard rock strata is undoubtedly the location of separation.
(3) In the two stages of working face mining, the amount of separation in the separation zone is significantly different. In the first stage, the separation can generally reach 0.31 times the mining thickness of the coal seam, and the maximum can reach 0.58 times the mining thickness; in the second stage, the width of the separation seam is narrow, and the separation is small. With the fracturing of the overburden, the separation seam closes quickly.
(4) Separation gradually develops from bottom to top. The lowermost separation tends to close with the emergence of the upper separation. For medium–hard strata and medium–thick coal seam mining, when the advancing distance reaches approximately 1/3 of the mining depth, separation above the fracture zone begins to appear.
(5) After mining reaches a certain range, separation develops in the upper part of the overburden. The separation of the overburden in the lower part of the overburden and the middle and upper part of the mining range generally close, while the upper part of the working face and the upper part of the coal wall generally have residual separation. Some separations never close.
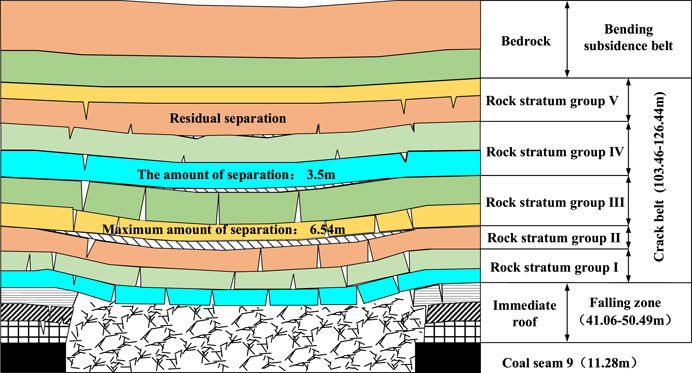
FIGURE 14. The structure diagram of the whole section of coal seam 9.
6 Conclusion
(1) The movement pattern of overburden during working face mining
In the initial mining stage of the coal seam, the roof of the coal seam begins to collapse and form a falling zone; after the mining of the working face continues, cracks gradually appear above the falling zone, forming a crack belt; with the continuous advancement of the working face, the upper strata of the crack belt continue to fracture and bend and sink sequentially. The lower broken rock that was previously produced reduces the subsidence of the upper overburden, the deformation range in the bedding direction gradually expands, and the curvature of the overburden decreases. In this way, when the failure of the rock strata due to fracturing develops to a certain height, only bending subsidence occurs, and no failure due to fracturing occurs; that is, the overburden eventually sinks in the form of overall bending.
(2) The development pattern of separation during working face mining
In the initial stage of working face advance, due to the small mining distance, the separation begins to develop, and the amount of separation is not large at this time. After the working face continues to advance for a short distance, the position of the original separation is closed to a certain extent, and the position of the maximum separation is moved upward. At the same time, with the movement of the working face, it advances in the direction of mining. With the further advancement of the working face, the maximum separation still maintains the trend of continuous advancement in the horizontal direction and continuous elevation in the vertical direction, while the previously generated separation is compacted to a certain extent, and some of the separation may have residual deformation.
(3) Morphological characteristics after separation compaction stability
The initial generation of low-level separation is characterized by a large separation height and small separation width. After the separation is compacted and stabilized, the low-level separation far from the ground basically does not exist. There may be residual separation above the open cut of the working face and above the back of the coal wall, and some separations may never be closed. The rock strata or strata group in the middle are also closely attached, that is, there is basically no separation in the middle strata; for the high-level separation, one or more separations are generated between the adjacent rock strata or strata group in the high-level position, and the size of the resulting separation is generally larger than the residual separation.
Data availability statement
The original contributions presented in the study are included in the article/supplementary material, further inquiries can be directed to the corresponding authors.
Author contributions
WH: Writing–original draft, Writing–review and editing. MY: Writing–review and editing. YL: Data curation, Writing–review and editing. LS: Supervision, Writing–review and editing. MG: Validation, Writing–review and editing. XW: Data curation, Writing–review and editing. HG: Resources, Writing–review and editing.
Funding
The author(s) declare that no financial support was received for the research, authorship, and/or publication of this article.
Conflict of interest
Author HG was employed by Shandong Luzhong Energy Group Co. Ltd.
The remaining authors declare that the research was conducted in the absence of any commercial or financial relationships that could be construed as a potential conflict of interest.
Publisher’s note
All claims expressed in this article are solely those of the authors and do not necessarily represent those of their affiliated organizations, or those of the publisher, the editors and the reviewers. Any product that may be evaluated in this article, or claim that may be made by its manufacturer, is not guaranteed or endorsed by the publisher.
References
Chai, J., Ma, Z., Du, W., Gao, J., Huang, Z., Zhang, D., et al. (2023). Dynamic evolution law analysis of overburden separation and water flowing fracture under mining based on distributed optical fiber and information entropy theory. Opt. Fiber Technol. 80, 103408. doi:10.1016/j.yofte.2023.103408
Chen, S., and Guo, H. (2008). Numerical simulation of bed separation development and grout injecting into separations. Geotech. Geol. Eng. 26, 375–385. doi:10.1007/s10706-008-9174-7
Fan, K., He, J., Li, W., and Chen, W. (2022). Dynamic evolution and identification of bed separation in overburden during coal mining. Rock Mech. Rock Eng. 55, 4015–4030. doi:10.1007/s00603-022-02855-2
Feng, F., Chen, S., Wang, Y., Huang, W., and Han, Z. (2021). Cracking mechanism and strength criteria evaluation of granite affected by intermediate principal stresses subjected to unloading stress state. Int. J. Rock Mech. Min. Sci. 143, 104783. doi:10.1016/j.ijrmms.2021.104783
Gao, Y. (1996). “Four-zone” model of rockmass movement and back analysis of dynamic displacement. J. China Coal Soc. 21, 51–56. doi:10.13225/j.cnki.jccs.1996.01.010
Guo, W., Liu, L., Shen, G., and Jiang, B. (1995). Determination of overburden separation and their rules after coal mining. J. China Coal Soc. 20, 39–44. doi:10.13225/j.cnki.jccs.1995.01.008
He, J., Li, W., and Qiao, W. (2020). A rock mechanics calculation model for identifying bed separation position and analyzing overburden breakage in mining. Arab. J. Geosci. 13, 920. doi:10.1007/s12517-020-05912-8
Huang, W., Golsanami, N., Zhang, C., Canbulat, I., Xin, G., Sun, G., et al. (2023a). Assessment of long-term large deformation in deep roadways due to roof fracturing impact loading. Sci. Rep. 13, 3846–3916. doi:10.1038/s41598-023-30792-9
Huang, W., Li, H., Sun, G., Jiang, D., and Gao, Y. (2022a). Performance research of materials and engineering application of overburden strata separation-zone grouting technology. Adv. Mater. Sci. Eng. 2022, 1–17. doi:10.1155/2022/3513993
Huang, W., Liu, S., Gao, M., Hou, T., Wang, X., Zhao, T., et al. (2022b). Improvement of reinforcement performance and engineering application of small coal pillars arranged in double roadways. Sustainability 15, 292. doi:10.3390/su15010292
Huang, W., Song, T., Li, H., Liu, Y., Hou, T., Gao, M., et al. (2023b). Design of key parameters for strip–filling structures using cemented gangue in goaf—a case study. Sustainability 15, 4698. doi:10.3390/su15064698
Huang, W., Sui, L., Wang, Y., Zhang, C., Jiang, D., Cai, X., et al. (2023c). Study of the mining and aquifer interactions in complex geological conditions and its management. Sci. Rep. 13, 9462. doi:10.1038/s41598-023-34947-6
Jiang, J., Wang, P., Wu, Q., and Zhang, P. (2015). Evolution laws and prediction of separated stratum space under overlying high-position magmatic rocks. Chin. J. Geotech. Eng. 37, 1769–1779. doi:10.11779/CJGE201510004
Jiang, J., Zhang, P., Nie, L., Li, H., Xu, L., and Wang, W. (2014). Fracturing and dynamic response of high and thick stratas of hard rocks. Chin. J. Rock Mech. Eng. 33, 1366–1374. doi:10.13722/j.cnki.jrme.2014.07.008
Ju, M., Li, X., Yao, Q., Liu, S., Liang, S., and Wang, X. (2017). Effect of sand grain size on simulated mining-induced overburden failure in physical model tests. Eng. Geol. 226, 93–106. doi:10.1016/j.enggeo.2017.05.015
Palchik, V. (2003). Formation of fractured zones in overburden due to longwall mining. Environ. Geol. 44, 28–38. doi:10.1007/s00254-002-0732-7
Palchik, V. (2005). Localization of mining-induced horizontal fractures along rock layer interfaces in overburden: field measurements and prediction. Environ. Geol. 48, 68–80. doi:10.1007/s00254-005-1261-y
Qian, M., Miao, X., and Xu, J. (2003). Key strata theory of strata control[M]. Xuzhou: China University of Mining and Technology Press.
Shen, B., and Brett, P. (2014). Investigation of overburden behaviour for grout injection to control mine subsidence. Int. J. Min. Sci. Technol. 24, 317–323. doi:10.1016/j.ijmst.2014.03.005
Shi, X., and Ji, Y. (2021). A three-dimensional modeling method of overburden separated layer of TIN-DEM integrated model. J. Phys. Conf. Ser. 2021, 012052. doi:10.1088/1742-6596/2021/1/012052
Song, Z. (1988). Practical pressure control of mines[M]. Xuzhou: China University of Mining and Technology Press, 64–65. (in Chinese).
Wang, S., Li, X., and Wang, S. (2017). Separation and fracturing in overlying strata disturbed by longwall mining in a mineral deposit seam. Eng. Geol. 226, 257–266. doi:10.1016/j.enggeo.2017.06.015
Wang, S., Song, C., and Liu, Y. (2020). Experimental study on dynamic developing law of overburden separation. J. Shandong Agr. Uni. Nat. Sci. Ed. 51, 663–667. doi:10.3969/j.issn.1000-2324.2020.04.016
Wang, Z., Wang, A., and Guo, X. (2019). The numerical simulation of space growth of bed separations under different horizontal overburden combinations. Geotech. Geol. Eng. 37, 347–357. doi:10.1007/s10706-018-0613-9
Xu, J., Qian, M., and Jin, H. (2004). Study and application of bed separation distribution and development in the process of strata movement. Chin. J. Geotech. Eng. 26, 632–636. doi:10.13225/j.cnki.jccs.2000.02.003
Xu, J., and Qian, M. (2000). Study on the influence of key strata movement on subsidence. J. China Coal Soc. 25, 122–126. doi:10.13225/j.cnki.jccs.2000.02.003
Yang, K., He, X., Dou, L., Liu, W., Sun, L., and Ye, H. (2015). Experimental investigation into stress-relief characteristics with upward large height and upward mining under hard thick roof. J. China Coal Soc. Engl. Ed. 2, 91–96. doi:10.1007/s40789-015-0066-1
Ye, Q., Wang, G., Jia, Z., Zheng, C., and Wang, W. (2018). Similarity simulation of mining-crack-evolution characteristics of overburden strata in deep coal mining with large dip. J. Pet. Sci. Eng. 165, 477–487. doi:10.1016/j.petrol.2018.02.044
Yu, B., Zhao, J., Kuang, T., and Meng, X. (2015). In situ investigations into overburden failures of a super-thick coal seam for longwall top coal caving. Int. J. Rock Mech. Min. Sci. 78, 155–162. doi:10.1016/j.ijrmms.2015.05.009
Yu, G., Mi, W., Wang, D., Gao, L., Lu, S., and Li, G. (2017). Research on the relationship between the surface dynamic subsidence and overburden separated strata of coal mine and its model. Procedia Eng. 191, 196–205. doi:10.1016/j.proeng.2017.05.172
Yuan, C., Yuan, Z., Wang, T., and Li, C. (2019). Analysis of the diffusion process of mining overburden separation strata based on the digital speckle correlation coefficient field. Int. J. Rock Mech. Min. Sci. 119, 13–21. doi:10.1016/j.ijrmms.2019.04.016
Zhang, X., Qiao, W., Lei, L., Zeng, F., Zhang, H., and Wang, Y. (2016). Formation mechanism of overburden bed separation in fully mechanized top-coal caving (Article). J. China Coal Soc. 41, 342–349. doi:10.13225/j.cnki.jccs.2015.1992
Zhao, P., Zhuo, R., Li, S., Shu, C., Bin, L., Jia, Y., et al. (2020). Analysis of advancing speed effect in gas safety extraction channels and pressure-relief gas extraction. Fuel 265, 116825. doi:10.1016/j.fuel.2019.116825
Keywords: thick seam mining, comprehensively study, overburden, separation, movement law
Citation: Huang W, Yang M, Liu Y, Sui L, Gao M, Wang X and Gao H (2023) Analysis of the movement pattern of overburden and the form of spatial development of separation after mining in a fully mechanized caving face. Front. Earth Sci. 11:1284955. doi: 10.3389/feart.2023.1284955
Received: 29 August 2023; Accepted: 09 October 2023;
Published: 19 October 2023.
Edited by:
Yong Wang, Southwest Petroleum University, ChinaCopyright © 2023 Huang, Yang, Liu, Sui, Gao, Wang and Gao. This is an open-access article distributed under the terms of the Creative Commons Attribution License (CC BY). The use, distribution or reproduction in other forums is permitted, provided the original author(s) and the copyright owner(s) are credited and that the original publication in this journal is cited, in accordance with accepted academic practice. No use, distribution or reproduction is permitted which does not comply with these terms.
*Correspondence: Wanpeng Huang, hwp20033@sdust.edu.cn; Le Sui, m17866618716@163.com