Comparative analysis of different foamy oil flow characteristics and production performances of two similar super-heavy oil reservoirs using microscopic visual physical experiments
 Yongchao Xue
 Zhihao Jia
 Suran Wang
 Xuze Zhang3
 - 1College of Petroleum Engineering, China University of Petroleum, Beijing, China
- 2CNOOC (China) Co, Ltd. Research Institute, Beijing, China
- 3Research Institute of Exploration and Development, PetroChina Changqing Oilfield Company, Xi’an, China
Foamy oil flow is a potentially important reason for enhanced oil recovery (EOR) in super-heavy oil reservoirs during depressurized cold production (DCP). M oil reservoir and H oil reservoir located in Venezuela are typical super-heavy oil reservoirs with the foamy oil flow stage, and the properties of two reservoirs are similar. However, the production performances between two reservoirs in the stage foamy oil flow is quite different. In this paper, the novel microscopic visual physical experiments for foamy oil flow have been carried out to determine the flow characteristics of foamy oil and production performance. Three production stages of DCP are divided: stage I (the pressure greater than bubble point pressure), stage II (the pressure ranging from pseudo bubble point pressure to bubble point pressure), and stage III (the pressure lower than pseudo bubble point pressure). Then, the effects of different foamy oil flow characteristics in each production stage on production performances are investigated using comparative analysis method. The results show that the flow characteristics of the oil in the M and H oil reservoirs are both single-phase flow at stage I of DCP and two-phase flow at stage III of DCP. However, a phenomenon of strong foamy oil flow appeared in M oil reservoir while a phenomenon of weak foamy oil flow appeared in H oil reservoir at stage II of DCP. For the production performance, the oil rate, cumulative oil production and cumulative gas production of M oil reservoir increased obviously, while which of H oil reservoir increased slowly. The reason for the difference between the two oil reservoirs is that the super-heavy oil of M oil reservoir has more dissolved GOR and asphaltene content compared to H oil reservoir, and the pressure and temperature of M oil reservoir are more suitable for strong foamy oil flow.
1 Introduction
As a significant unconventional oil and gas resource, heavy and super-heavy oil reservoirs have a reserve of about 900 billion barrels, accounting for about two-thirds of the world’s crude oil reserves (Goodarzi et al., 2007; Shah et al., 2010; Chen et al., 2015; Sun et al., 2015; Zhou et al., 2017a; Yang et al., 2019; Wu et al., 2020a; Gong et al., 2022; Zhu et al., 2022; Guo et al., 2023). Most super-heavy oil reservoirs with foamy oil flow in the world are mainly located in Venezuela, Canada and Tuha Oilfield in China. During the DCP, the gas phase is extracted from the super-heavy oil with high dissolved gas-oil ratio and flows with the high viscosity crude oil, which results in foamy oil flow (Akin and Kovscek, 2002; Sun et al., 2019; 2021; Zhou et al., 2020; Li et al., 2022). Many scholars have investigated that, compared to super-heavy oil reservoirs without foamy oil flow stage, the foamy oil flow will improve oil recovery by 3%–7% during the DCP, which is essential for the efficient development of super-heavy oil reservoirs (Sheng et al., 1999; Lago et al., 2002; Bennion et al., 2003; Peng et al., 2009; Sun et al., 2018).
Given the significance of foamy oil, many studies have been done to determine the flow characteristics of foamy oil and its effects on the production performance of super-heavy oil reservoirs (Wang et al., 2020; Xu et al., 2020). The phenomena that bubbles are scattered in the oil phase of foamy oil have been observed from the wellhead sampling oil. The keys to differentiate foamy oil from conventional heavy oil are the dispersion time of gas phase and the bubble quantities. The physical experiments are considered as the important method to studying the flow characteristics of the foamy oil (Li. et al., 2012; Busahmin et al., 2016; Zhou et al., 2016; Zhou et al., 2017b; Wu et al., 2020b). The foamy oil flow stage of super-heavy oil reservoir is considered as the stage of oil production with the long gas dispersion time and the large bubble quantities. Second, the main factors affecting the generation of foamy oil, such as heavy oil components, gas-oil ratio, viscosity, pressure and temperature, etc., have been researched (Abusahmin et al., 2017; Zhou et al., 2017c; Basilio and Babadagli, 2020; Jia et al., 2020). Aldea (1967) devised a sand filling experiment to investigate the impacts of pressure gradient on the mechanism of dissolved gas flooding and ultimate oil recovery to determine the flow characteristics of foamy oil. The sand filling experiments were also employed by Pooladi-Darvish and Firoozabadi (1999) compared the difference of the mechanism of dissolved gas flooding between heavy oil and light oil, which revealed different displacement mechanisms of heavy oil reservoir with dissolved gas flooding at different stages. In addition, Kumar et al. (2002) developed a sand filling physical model to investigate the impact of pressure drop rate on gas mobility and solution gas flooding of super-heavy oil reservoirs. According to the analysis above, the physical experiment is an important method to study foamy oil flow, but there is little research on the visualization experiments of foamy oil flow in cores.
Foamy oil flow stage is observed in M and H super-heavy oil reservoirs during the DPC. Despite similar reservoir properties, there are great differences in production performance. In this paper, the novel visual physical experiments were developed to determine the different microscopic flow characteristics of foamy oil of two reservoirs. The reasons for different flow mechanisms of foamy oil and the effects of foamy oil on production performance were investigated by comparative analysis method. The logical structure of this paper is as follows: The experiment methodology and processes are introduced in Section 2; The results are analyzed in Section 3. The conclusions are drawn in Section 4. More importantly, a novel microscopic visual physical device is self-developed, and the different production characteristics and flow behaviors of two similar oil fields have been deeply researched.
2 Experiments
2.1 Experimental materials
The oil samples are the degassed crude oil from the M and H super-heavy oil reservoir of Venezuela. The super-heavy oil samples with specific gas-oil ratio were compounded by the high-pressure and high-temperature sampler under the initial conditions of two reservoirs. The reservoirs temperature, pressure and dissolved gas-oil ratio used in this experiment are shown in Table 1.
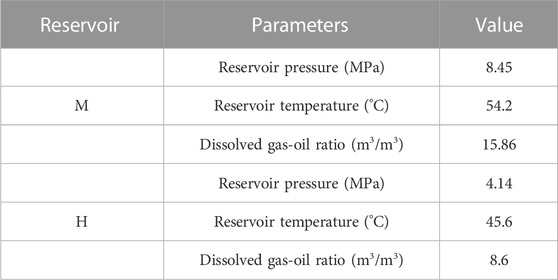
TABLE 1. Parameters for compounding oil sample of M and H super-heavy oil reservoir.
The artificial long-cores of two reservoirs were prepared according to the reservoir properties. The core parameters are shown in Table 2.
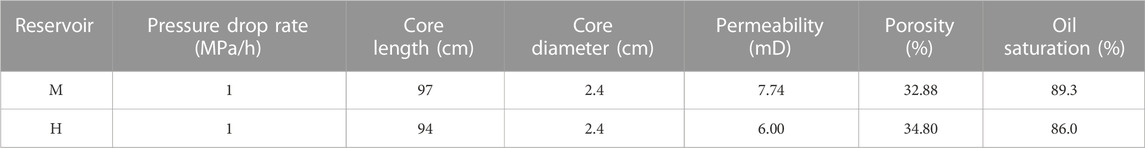
TABLE 2. Core parameters of M and H super-heavy oil reservoirs.
2.2 Experimental apparatus
A novel visualization microscopic flow experimental apparatus with long-core displacement for foamy oil flow was established, which is shown in Figure 1. The experimental apparatus consists of five parts: fluid injection system, super-heavy oil reservoir simulation system, microscopic visual monitoring system, oil-gas separating and measuring system, and data acquisition and control system. The novelty of this experimental apparatus is the connection between the long-core holder and the microscopic visualization monitoring device, which can indirectly observe the flow characteristic of foamy oil in the cores.
(1) Fluid injection system: The keys of the fluid injection system are the pump (FY-HSHY-80), two intermediate containers, and a heating sleeve. Oil samples and formation water are both prepared in the intermediate containers. Two intermediate containers are connected to the pumps to saturate cores with formation water or oil.
(2) Super-heavy oil reservoir simulation system: It mainly consists of long-core holder, piston pump, and thermostat. The long-core holder, which can fill a core with a diameter of 2.5 cm and a length of 100 cm, is made up of a pressure measurement pipeline, a metal case, a casing cap, and a core rubber sleeve. There are six pressure taps and high-precision pressure gauge (DG2113-B-20, ranging from 0 to 20 MPa) on the core holder, which can measure the pressure changes at different positions of cores. The overburden pressure could be precisely controlled by connecting the cavity between the core rubber sleeve and the metal case with the piston pump. The long-core holder was placed in the thermostat to create reservoir conditions, which can accurately simulate the DCP for super-heavy oil reservoir.
(3) Microscopic visual monitoring system: It mainly includes a novel high-temperature and high-pressure visual observation window, camera and light source. The high-temperature and high-pressure visual observation window, which could withdraw 15 MPa and 150°C, is connected to the outlet of the long-core holder to observe the foamy oil flow characteristics and morphological changes of gas phase. The camera and light source were used to record the observation results. The system can used to determine the pseudo bubble point pressure, which is defined as the pressure at which the oil transitions from a foamy state to a two-phase liquid-gas state, where the gas bubbles are no longer dispersed throughout the liquid but begin to separate and form a distinct gas phase. The changes in bubble behavior, such as bubble coalescence and gas release, can be observed by this system, and the pressure at which these changes become significant indicates the pseudo bubble point pressure.
(4) Oil-gas separation measuring system: It mainly consists of an oil-gas separation cylinder, a balance, a vacuum pump, and a gas measurement cylinder. The produced oil and gas are separated by the oil-gas separation cylinder, the oil mass is measured by the balance, and the gas volume is measured by the gas measurement cylinder based on the vacuum dewatering method. The vacuum pump is used to produce negative pressure on the gas measurement cylinder, so that the water in the lower tank enters the measuring cylinder.
(5) Data acquisition and control system: This includes a computer, back-pressure valves (HYF-III), and a nitrogen cylinder. The outlet pressure is controlled by the back-pressure valves. The pressure data of 6 pressure taps are automatically recorded by the software.
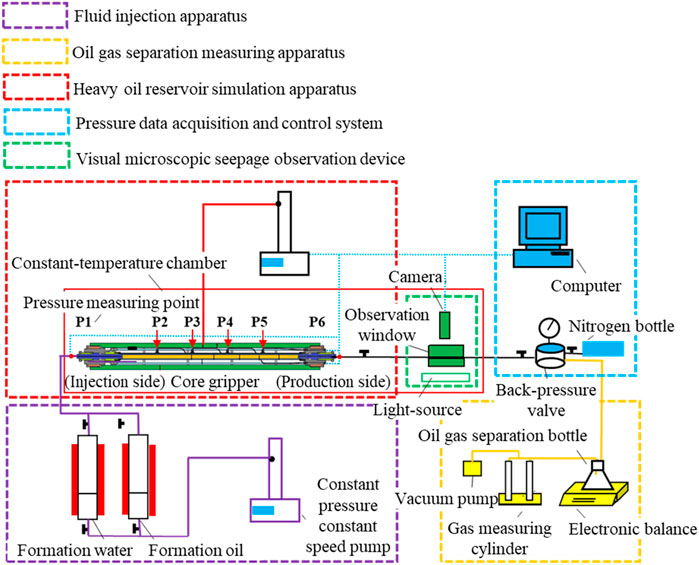
FIGURE 1. Experimental device schematic diagram of foamy oil seepage characteristics.
2.3 Experimental methods and procedures
The objective of the experiments is to investigate the reasons for the differences of production performance in foamy oil flow stage between M and H reservoirs. The experimental procedures are as follows:
(1) Experimental preparations: The oil samples, formation water and the long cores are prepared before the experiment. The experimental apparatus is installed as described in Section 2.2, and check for air leak.
(2) Saturated formation water: First, open the thermostat and increase the temperature to the reservoir temperature. Second, the experimental apparatus is vacuumed by the vacuum pump. And then, the cores are saturated with the formation water until the outlet flow rate is the same as the injection rate. Finally, keep the conditions that the confining pressure is 3 MPa above the core pressure, the formation water is continued to inject into the cores until the core pressure reaches the reservoir pressure.
(3) Saturated oil samples: The cores are saturated by the oil samples after 24 h core aging until the measured gas-oil ratio equals the initial dissolved gas-oil ratio. The oil saturations of cores are calculated, and the cores are heated in thermostat for 24 h.
(4) DCP Experiment: from the original reservoir pressure, the back-pressure valve pressure is reduced at a rate of 1 MPa/h until it reaches standard atmospheric pressure. Oil production, gas production, and pressure variations at each pressure tap were recorded during the DCP. Meanwhile, cameras were used to record foamy oil flow characteristics in the visual observation window.
3 Results and discussion
3.1 Analysis of production performance
The experimental results show that the bubble point pressure is 5.10 MPa and the pseudo bubble point pressure is 2.12 MPa in M reservoir, while the bubble point pressure is 3.54 MPa and the pseudo bubble point pressure is 0.41 MPa in H reservoir. The production performance of M reservoir is shown in Figures 2–4.
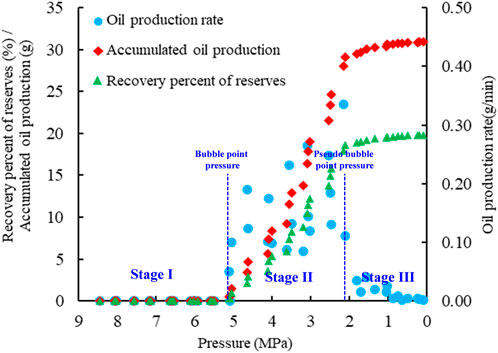
FIGURE 2. The curves of oil rate, cumulative oil production, oil recovery vs. pressure in M reservoir.
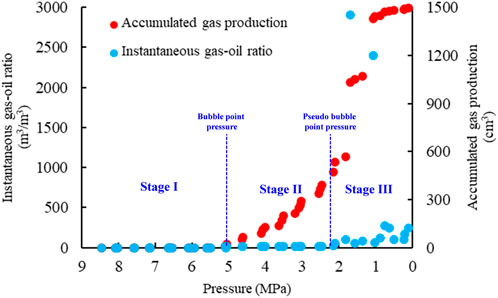
FIGURE 3. The curves of cumulative gas production, instantaneous GOR vs. pressure in M reservoir.
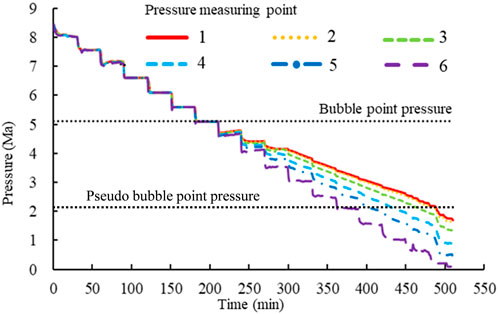
FIGURE 4. The curves of pressures at each pressure taps in M reservoir vs. time.
Three production stages of DCP are divided: stage I (the pressure greater than bubble point pressure), stage II (the pressure ranging from pseudo bubble point pressure to bubble point pressure), and stage III (the pressure lower than pseudo bubble point pressure). The production performances in each production stage are quite different. Furthermore, the production performances between two reservoirs are also different. The analyses of production performance in M reservoir are as follows:
Stage I: During this stage, the oil rate is very low, and the cumulative gas production and GOR are 0. The pressure at each pressure tap decreased linearly with time and at the same pace due to the high permeability.
Stage II: During this stage, the oil rate, cumulative oil production all increased quickly, but the instantaneous gas oil ratio remained low, ranging from 11.36 to 20.16 m3/m3. The pressures at each point tap decreased linearly with time when the pressure is lower than 5.10 MPa, and started to deviate from the pressure of the back-pressure valve. The reason is that the oil viscosity lowered and the oil volume expanded due to the foamy oil flow, which effectively maintain the reservoir pressure. In addition, the continuous gas phase has not been formed so that the instantaneous gas-oil ratio is retain low.
Stage III: During this stage, the oil rate decreased rapidly while the gas rate increased rapidly, due to the formation of continuous gas phase. Furthermore, the pressure fluctuation near the inlet is small while which near the outlet is large, indicating foamy oil flow at the inlet and continuous gas flow at the outlet.
The production performance of M reservoir is shown in Figures 5–7, which are as follows:
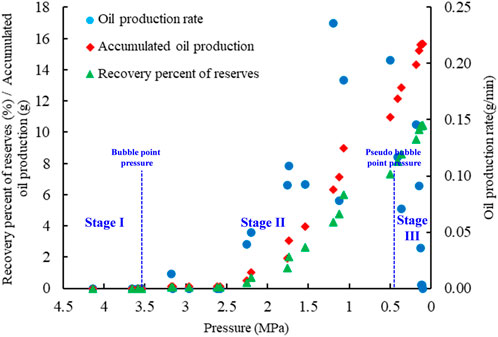
FIGURE 5. The curves of oil rate, cumulative oil production, oil recovery vs. pressure in H reservoir.
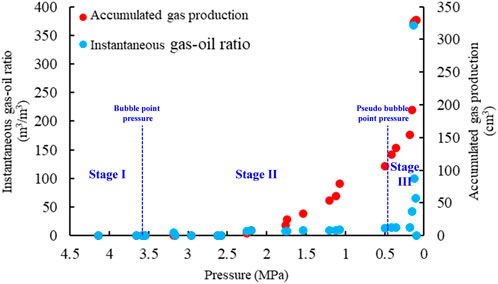
FIGURE 6. The curves of cumulative gas production, instantaneous GOR vs. pressure in H reservoir.
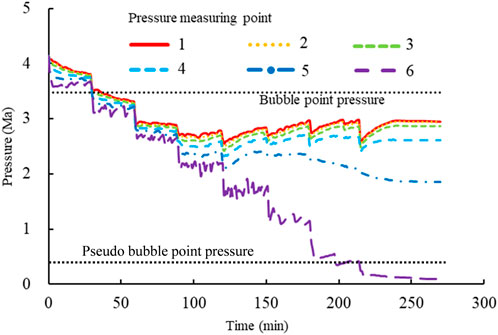
FIGURE 7. The curves of pressures at each pressure taps in H reservoir vs. time.
Stage I: During this stage, the production performance between M and H reservoirs is the same. The oil rate is very low, and cumulative gas production and GOR are 0.
Stage II: This stage can be further divided into two distinct periods. At the early period of stage II (pressure ranging from 3.54 MPa to 2.20 MPa), the instantaneous gas-oil ratio was very low, the oil production rate and accumulative oil production increased slowly. The deviation of pressures at each point tap from the pressure of back-pressure valves is small. At the later period of stage II (pressure ranging from 2.20 MPa to 0.41 MPa), the oil rate and cumulative oil production increased rapidly. The instantaneous GOR is slightly higher than dissolved GOR, ranging from 8.25 to 14.84 m3/m3. The deviation of pressures at each point tap from the pressure of back-pressure valves gradually increased.
Stage III: During this stage, the increase of oil rate, cumulative oil production was reduced, but the oil production capacity can still be maintained. The instantaneous GOR increased sharply in a brief period before decreasing sharply. Due to the formation of the continuous gas phase, the pressure near the inlet remained high, and the differential pressure gradually increased.
After comparative analysis, it can be found that when the pressure is higher than the bubble point pressure (Stage I) or lower than the pseudo bubble point pressure (Stage III), the production performance of M reservoir is the same as that of H reservoir. However, when the pressure decreased from the bubble point pressure to the pseudo bubble point pressure (Stage II), there is an obvious difference in production performance between M and H reservoir during DCP.
3.2 Analysis of microscopic flow characteristics of foamy oil flow
The images of foamy oil flow in M reservoir were shown in Figure 8, and the morphology descriptions were shown in Table 3. The flow characteristics of foamy oil in M reservoir during each stage of DCP are as follows:
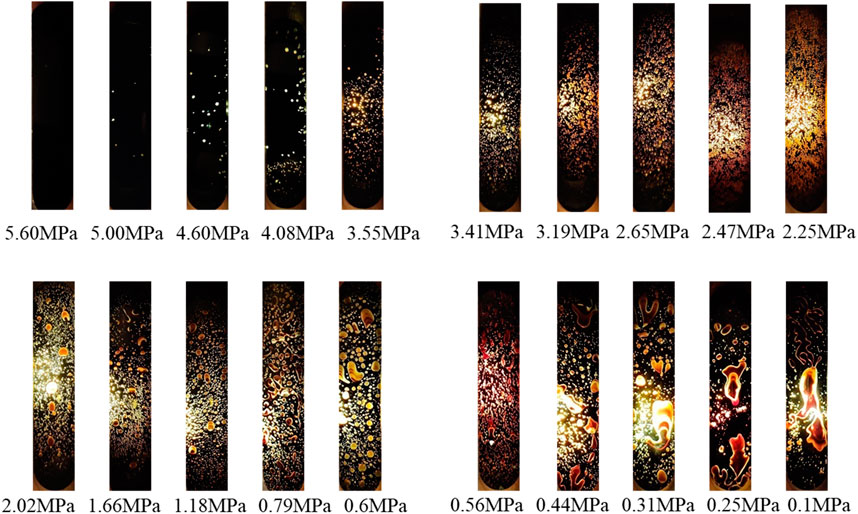
FIGURE 8. Foamy oil flow characteristic of M super-heavy oil reservoir during DCP.
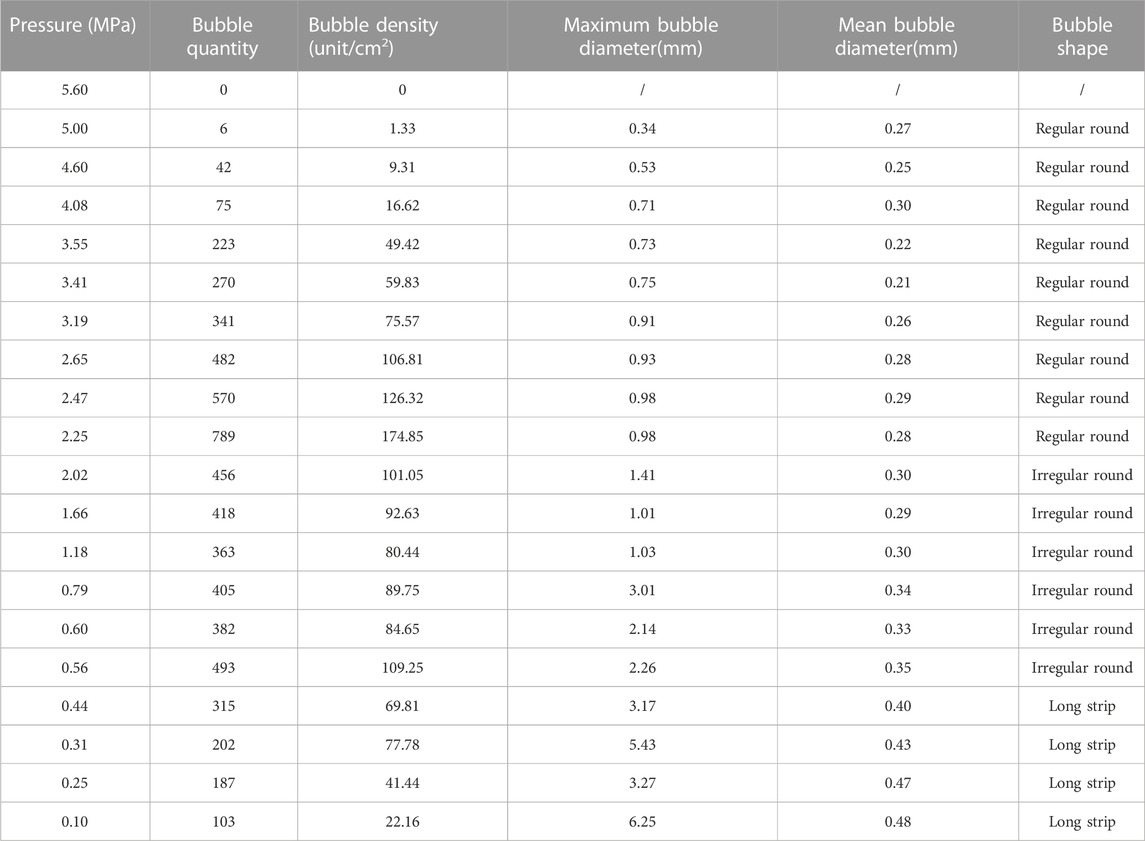
TABLE 3. Bubble properties of foamy oil of M reservoir during DCP.
Stage I: During this stage, there is primarily single oil flow, no dissolved gas separation, and the bubble quantities are 0.
Stage II: During this stage, the oil phase contains a lot of widely dispersed bubbles due to the dissolved gas separating from the oil phase. The foam shape is basically regular round, the foam size is small. As the pressure drops from 5 MPa to 2.25 MPa, the bubble quantity gradually increased from 6 to 789, and the bubble density gradually increased from 1.33/cm2 to 174.85/cm2, which demonstrate a strong foamy oil flow in M reservoir. In addition, the maximum diameter and average diameter of bubbles generally increase, indicating that the small bubbles gradually grow and become larger with the decrease of pressure at this stage.
Stage III: During this stage, the bubble quantity and bubble density respectively decreased from 456 to 101.05/cm2 to 103 and 22.16/cm2 when the pressure dropped from 2.02 MPa to 0.10 MPa, while the maximum bubble diameter and mean bubble diameter increased from 1.41 mm to 0.30 mm to 6.25 m and 0.48 mm, respectively. In, addition, the bubble shape also changed from the regular round to the irregular round, and finally to the long strip. These phenomena demonstrate that small bubbles progressively converge into larger ones, and form the continuous gas phase. Finally, the foamy oil flow changes into oil-gas two-phase flow.
The images of foamy oil flow in H reservoir were shown in Figure 9, and the morphology descriptions were shown in Table 4. The flow characteristics of foamy oil in H reservoir during each stage of DCP are as follows:
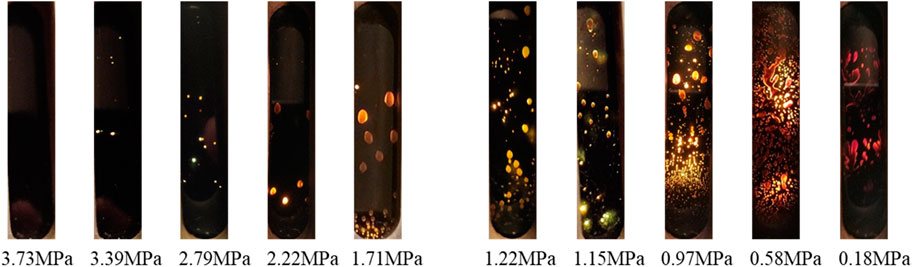
FIGURE 9. Foamy oil flow characteristic of H super-heavy oil reservoir during DCP.
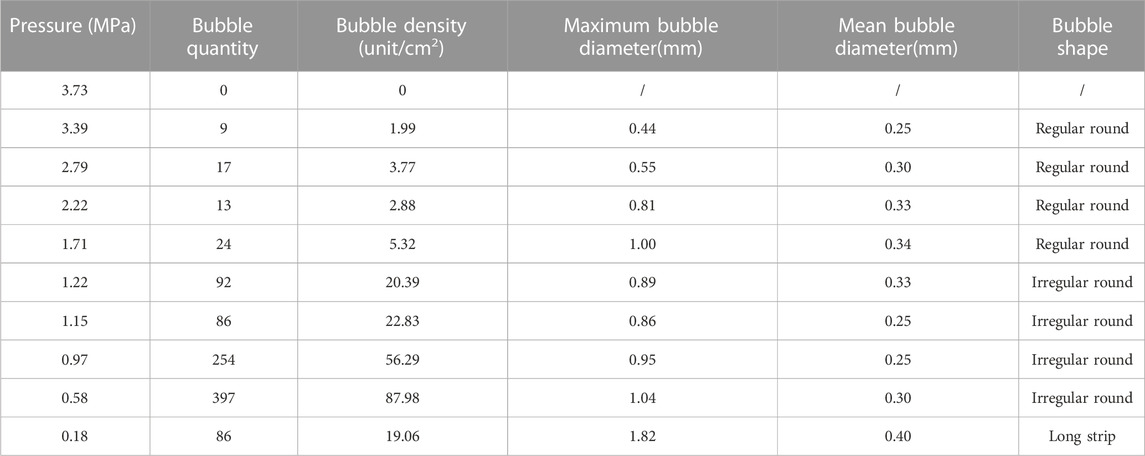
TABLE 4. Bubble properties of foamy oil of H reservoir during DCP.
Stage I: During this stage, the microscopic flow characteristic of H reservoir is the same as which of M reservoir. It is the single oil flow, and the bubble quantity is 0.
Stage II: During this stage, the microscopic flow characteristic of H reservoir is quite different from which of M reservoir. The bubble quantity and the bubble density are 9 and 1.99/cm2 at the pressure of 3.39 MPa, respectively. It is difficult to form foamy oil flow due to the small bubble quantity and large bubble diameter. As the pressure drops from 1.71 MPa to 0.58 MPa, the bubble quantity and bubble density increased from 24 to 5.32/cm2 to 397 and 87.98/cm2 respectively, which indicating the formation of foamy oil. However, the bubble quantity and bubble density of H reservoir are lower than those of M reservoir. All these phenomena demonstrate a weak foamy oil flow in H reservoir.
Stage III: During this stage, the bubble quantity and bubble density respectively decreased from 397 to 87.98/cm2 to 86 and 19.06/cm2 when the pressure dropped from 0.58 MPa to 0.18 MPa, while the maximum bubble diameter and the mean bubble diameter increased from 1.04 mm to 0.30 mm–1.82 mm and 0.40 mm, respectively. In, addition, the bubble shape also changed from the regular round to the irregular round, and finally to the long strip. Therefore, the flow characteristics of H reservoir at this stage are similar to those of M reservoir.
3.3 Analysis of microscopic flow characteristics of foamy oil flow
The experimental results show that the oil recovery, cumulative oil production, cumulative gas production and maximum oil rate of M reservoir are respectively 19.81%, 30.95 g, 1498 cm3 and 0.34 g/min, which are 9.38%, 15.29 g, 1,168.31 cm3 and 0.10 g/min higher than those of H reservoir during DCP. The comparison results of production performance between M and H reservoir are shown in Table 5.
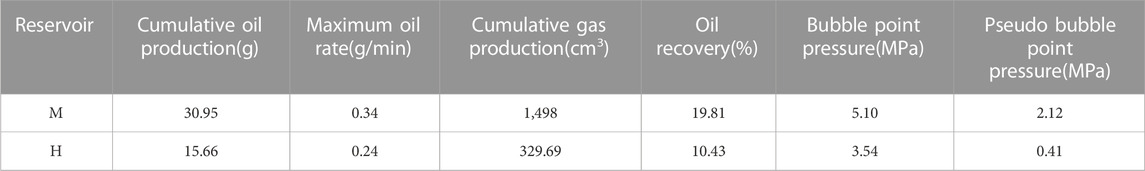
TABLE 5. Comparison of production performance of experiments between M and H reservoir during DCP.
The difference in production performance between the two reservoirs occurs in stage II, that is, the difference in foamy oil flow characteristics between the two reservoirs. The flow characteristic of M reservoir in stage II is a strong foamy oil flow, while that of H reservoir is a weak foamy oil flow. The main causes are as follows:
(1) The initial dissolved GOR of M reservoir is 15.86 m3/m3, higher than that of H reservoir (8.6 m3/m3). The formation of bubbles is affected by the initial GOR. More gas will disperse in super-heavy oil during DCP due to larger dissolved GOR of M reservoir, which could form the foamy oil flow. In addition, he higher the original dissolved gas-oil ratio, the increase of critical gas saturation, which is conducive to the reduction of gas phase fluidity.
(2) The asphalt content of super-heavy oil in M reservoir is higher. Because of the more stable molecular structure and higher molecular weight, the asphalt molecular is a suitable location for the formation of foam. Furthermore, asphaltene is also the most polar and interfacial active component of the heavy oil, which helps to preserve the stability of foamy oil.
(3) The reservoir temperature of M reservoir is in the moderate temperature range where strong foamy oil flow occurs. The density and viscosity of super-heavy oil are lower and the mobility of which is stronger. However, due to the low reservoir temperature, high oil density and viscosity, and poor fluidity in H reservoir, it would be difficult for foamy oil flow.
(4) The reservoir pressure in M reservoir is higher. High pressure makes the interfacial tension of oil-gas lower, which is conducive to formation of foamy oil. Furthermore, the action time of foamy oil is longer under high pressure.
4 Conclusion
The differences of foamy oil flow characteristics and production performance of M and H super-heavy oil reservoir with similar reservoir properties are analyzed using the microscopic visual physical experiments. The reasons for the difference between the two reservoirs are investigated. The conclusions are as follows:
(1) The production performance of two reservoirs at stage I and stage III of DCP are the same, while the production performance at stage II are quite different. The oil recovery, cumulative oil production, cumulative gas production and maximum oil rate of M reservoir are respectively 19.81%, 30.95 g, 1498 cm3 and 0.34 g/min, which are 9.38%, 15.29 g, 1,168.31 cm3 and 0.10 g/min higher than those of H reservoir during DCP.
(2) The flow characteristic makes the difference in production performance. The flow characteristics of two reservoirs at stage I and stage III of DCP are the same, while the flow characteristics at stage II are quite different. There is the single-oil flow in two reservoirs at stage I, and the gas-oil two-phase flow at stage III of DCP. But at stage II, the strong foamy oil flow is formed in M reservoir, while the weak foamy oil flow is formed in H reservoir.
(3) Due to the greater dissolved GOR, higher asphaltene content, higher pressure, more suitable temperature of M reservoir compared with those of H reservoir, the strong foamy oil flow is formed, which are the main reasons for the difference of flow characteristics and production performance between two reservoirs.
Data availability statement
The original contributions presented in the study are included in the article/Supplementary Material, further inquiries can be directed to the corresponding author.
Author contributions
YX: Conceptualization, Methodology, Writing–review and editing. ZJ: Data curation, Writing–original draft. SW: Writing–review and editing. XZ: Investigation, Methodology, Writing–review and editing. BP: Formal Analysis, Validation, Writing–review and editing.
Funding
The author(s) declare financial support was received for the research, authorship, and/or publication of this article. The researchers recognize that the National Science and Technology Major Project contributed to the funding of this study (No. 2017ZX05030002003).
Conflict of interest
SW was employed by the CNOOC (China) Co, Ltd. Research Institute and XZ was employed Research Institute of Exploration and Development, PetroChina Changqing Oilfield Company.
The remaining authors declare that the research was conducted in the absence of any commercial or financial relationships that could be construed as a potential conflict of interest.
Publisher’s note
All claims expressed in this article are solely those of the authors and do not necessarily represent those of their affiliated organizations, or those of the publisher, the editors and the reviewers. Any product that may be evaluated in this article, or claim that may be made by its manufacturer, is not guaranteed or endorsed by the publisher.
References
Abusahmin, B. S., Karri, R. R., and Maini, B. B. (2017). Influence of fluid and operating parameters on the recovery factors and gas oil ratio in high viscous reservoirs under foamy solution gas drive. Fuel 197, 497–517. doi:10.1016/j.fuel.2017.02.037
Akin, S., and Kovscek, A. R. (2002). Heavy-oil solution gas drive: A laboratory study. J. Petroleum Sci. Eng. 35 (1-2), 33–48. doi:10.1016/S0920-4105(02)00162-6
Basilio, E., and Babadagli, T. (2020). Testing the injection of air with methane as a new approach to reduce the cost of cold heavy oil recovery: an experimental analysis to determine optimal application conditions. Fuel 265, 116954. doi:10.1016/j.fuel.2019.116954
Bennion, D. B., Mastmann, M., and Moustakis, M. L. (2003). A case study of foamy oil recovery in the Patos-Marinza reservoir, Driza Sand, Albania. J. Can. Petroleum Technol. 42 (03). doi:10.2118/03-03-01
Busahmin, B., Maini, B., Karri, R. R., and Sabet, M. (2016). Studies on the stability of the foamy oil in developing heavy oil reservoirs. Defect Diffusion Forum 371, 111–116. doi:10.4028/www.scientific.net/ddf.371.111
Chen, Z., Sun, J., Wang, R., and Wu, X. (2015). A pseudo bubble point model and its simulation for foamy oil in porous media. SPE J. 20 (02), 239–247. doi:10.2118/172345-PA
Gong, H., Yu, C., Jiang, Q., Su, N., Zhao, X., and Fan, Z. (2022). Improving recovery efficiency by CO2 injection at late stage of steam assisted gravity drainage. Adv. Geo-Energy Res. 6 (4), 276–285. doi:10.46690/ager.2022.04.02
Goodarzi, N., Bryan, J., Mai, A., and Kantzas, A. (2007). Novel techniques for measuring heavy-oil fluid properties. SPE J. 12 (03), 305–315. doi:10.2118/97803-PA
Guo, J., Lu, Q., and He, Y. (2023). Key issues and explorations in shale gas fracturing. Key issues Explor. shale gas Fract. 10 (2), 183–197. doi:10.1016/j.ngib.2023.02.002
Jia, X., Li, J., Lin, R., and Chen, Z. (2020). Mathematical modeling of dynamic mass transfer in cyclic solvent injection. J. Petroleum Sci. Eng. 184, 106573. doi:10.1016/j.petrol.2019.106573
Kumar, R., Pooladi-Darvish, M., and Okazawa, T. (2002). Effect of depletion rate on gas mobility and solution gas drive in heavy oil. Spe J. 7 (02), 213–220. doi:10.2118/78438-PA
Lago, M., Huerta, M., and Gomes, R. (2002). Visualization study during depletion experiments of Venezuelan heavy oils using glass micromodels. J. Can. Petroleum Technol. 41 (01). doi:10.2118/2000-056
Li, S., Li, Z., Lu, T., and Li, B. (2012). Experimental study on foamy oil flow in porous media with Orinoco Belt heavy oil. Energy & Fuels 26 (10), 6332–6342. doi:10.1021/ef301268u
Li, X., Sun, X., Yang, Z., Gong, H., Li, T., and Shi, X. (2022). Experimental study on chemical-assisted methane flooding for foamy oil reservoirs after primary production. J. Petroleum Sci. Eng. 216, 110803. doi:10.1016/j.petrol.2022.110803
Peng, J., Tang, G. Q., and Kovscek, A. R. (2009). Oil chemistry and its impact on heavy oil solution gas drive. J. Petroleum Sci. Eng. 66 (1-2), 47–59. doi:10.1016/j.petrol.2009.01.005
Pooladi-Darvish, M., and Firoozabadi, A. (1999). Solution-gas drive in heavy oil reservoirs. J. Can. Petroleum Technol. 38 (04). doi:10.2118/99-04-06
Shah, A., Fishwick, R., Wood, J., Leeke, G., Rigby, S., and Greaves, M. (2010). A review of novel techniques for heavy oil and bitumen extraction and upgrading. Energy & Environ. Sci. 3 (6), 700–714. doi:10.1039/b918960b
Sheng, J. J., Maini, B. B., Hayes, R. E., and Tortike, W. S. (1999). Critical review of foamy oil flow. Transp. Porous Media 35 (2), 157–187. doi:10.1023/A:1006575510872
Sun, X., Cai, J., Li, X., Zheng, W., Wang, T., and Zhang, Y. (2021). Experimental investigation of a novel method for heavy oil recovery using supercritical multithermal fluid flooding. Appl. Therm. Eng. 185, 116330. doi:10.1016/j.applthermaleng.2020.116330
Sun, X., Dong, M., Zhang, Y., and Maini, B. B. (2015). Enhanced heavy oil recovery in thin reservoirs using foamy oil-assisted methane huff-n-puff method. Fuel 159, 962–973. doi:10.1016/j.fuel.2015.07.056
Sun, X., Zhang, Y., Gai, Z., Zhao, H., Chen, G., and Song, Z. (2019). Comprehensive experimental study of the interfacial stability of foamy oil and identification of the characteristic responsible for foamy oil formation. Fuel 238, 514–525. doi:10.1016/j.fuel.2018.10.096
Sun, X., Zhang, Y., Wang, S., Song, Z., Li, P., and Wang, C. (2018). Experimental study and new three-dimensional kinetic modeling of foamy solution-gas drive processes. Sci. Rep. 8 (1), 4369–4415. doi:10.1038/s41598-018-22669-z
Wang, H., Torabi, F., Zeng, F., and Xiao, H. (2020). A novel visualization approach for foamy oil non-equilibrium phase behavior study of solvent/live heavy oil systems. Fuel 272, 117648. doi:10.1016/j.fuel.2020.117648
Wu, M., Lu, X., Yang, J., Lin, Z., and Zeng, F. (2020a). Experimental analysis of optimal viscosity for optimizing foamy oil behavior in the porous media. Fuel 262, 116602. doi:10.1016/j.fuel.2019.116602
Wu, M., Lu, X., Zhou, X., Lin, Z., and Zeng, F. (2020b). Experimental study on the temperature effects of foamy oil flow in porous media. Fuel 271, 117649. doi:10.1016/j.fuel.2020.117649
Xu, F., Chen, Q., Ma, M., Wang, Y., Yu, F., and Li, J. (2020). Displacement mechanism of polymeric surfactant in chemical cold flooding for heavy oil based on microscopic visualization experiments. Adv. Geo-Energy Res. 4 (1), 77–85. doi:10.26804/ager.2020.01.07
Yang, M., Harding, T. G., and Chen, Z. (2019). Numerical investigation of the mechanisms in co-injection of steam and enriched air process using combustion tube tests. Fuel 242, 638–648. doi:10.1016/j.fuel.2019.01.041
Zhou, X., Yuan, Q., Peng, X., Zeng, F., and Zhang, L. (2017a). A critical review of the CO2 huff ‘n’ puff process for enhanced heavy oil recovery. Fuel 215, 813–824. doi:10.1016/j.fuel.2017.11.092
Zhou, X., Yuan, Q., Zeng, F., Zhang, L., and Jiang, S. (2017b). Experimental study on foamy oil behavior using a heavy oil‒methane system in the bulk phase. J. Petroleum Sci. Eng. 158, 309–321. doi:10.1016/j.petrol.2017.07.070
Zhou, X., Yuan, Q., Zeng, F., Zhang, L., and Jiang, S. (2017c). Experimental study on foamy oil behavior using a heavy oil‒methane system in the bulk phase. J. Petroleum Sci. Eng. 158, 309–321. doi:10.1016/j.petrol.2017.07.070
Zhou, X., Zeng, F., Zhang, L., Jiang, Q., Yuan, Q., Wang, J., et al. (2020). Experimental and mathematical modeling studies on foamy oil stability using a heavy oil–CO2 system under reservoir conditions. Fuel 264, 116771. doi:10.1016/j.fuel.2019.116771
Zhou, X., Zeng, F., Zhang, L., and Wang, H. (2016). Foamy oil flow in heavy oil–solvent systems tested by pressure depletion in a sandpack. Fuel 171, 210–223. doi:10.1016/j.fuel.2015.12.070
Keywords: super-heavy oil reservoirs, foamy oil flow, depressurized cold production, microscopic visual physical experiments, comparative analysis
Citation: Xue Y, Jia Z, Wang S, Zhang X and Pu B (2023) Comparative analysis of different foamy oil flow characteristics and production performances of two similar super-heavy oil reservoirs using microscopic visual physical experiments. Front. Earth Sci. 11:1272770. doi: 10.3389/feart.2023.1272770
Received: 04 August 2023; Accepted: 18 September 2023;
Published: 04 October 2023.
Edited by:
Wenjiao Xiao, Chinese Academy of Sciences (CAS), ChinaReviewed by:
Wendong Wang, China University of Petroleum, Huadong, ChinaZhongwei Wu, Yangtze University, China
Copyright © 2023 Xue, Jia, Wang, Zhang and Pu. This is an open-access article distributed under the terms of the Creative Commons Attribution License (CC BY). The use, distribution or reproduction in other forums is permitted, provided the original author(s) and the copyright owner(s) are credited and that the original publication in this journal is cited, in accordance with accepted academic practice. No use, distribution or reproduction is permitted which does not comply with these terms.
*Correspondence: Zhihao Jia, jiazhihao1996@126.com