The age and sources of stream water in a boreal forest watershed in the permafrost region: a case study of a watershed in northeast China
 Xiang Xiao
 Tijiu Cai
 Liangliang Duan
- 1School of Forestry, Northeast Forestry University, Harbin, China
- 2Key Laboratory of Sustainable Forest Ecosystem Management-Ministry of Education, Northeast Forestry University, Harbin, China
- 3Mudanjiang Normal College, Mudanjiang, China
Determining the age and sources of stream water is critical for understanding the watershed hydrological processes and biogeochemical cycle. In this study, daily isotope data of rainfall and runoff, as well as continuously monitored conductivity data from June to October in 2019 in-Laoyeling(LYL) watershed located in permafrost region of northeastern China were used to separate streamflow components through the application of two independent methods: isotope-based hydrograph separations (IHS) and the conductivity mass balance (CMB) methods. The results showed that stream water in a boreal forest watershed with permafrost of the Daxing’an Mountains is mainly composed of pre-event water. Although the IHS method is more sensitive and provides more details than the CMB method, the results of both methods show a similar trend. The average value of the young water fractions (Fyw) for those aged less than 65 days is 5.6%, while the mean transit time (MTT) was calculated to be 3.33 years. These findings enhance our understanding of the fundamental characteristics of runoff generation mechanisms and changes in runoff components in permafrost regions. Such knowledge is crucial for effective regional water resource management under the context of climate change, such as construction of water conservancy facilities and prediction of flood and drought disasters.
1 Introduction
The presence of permafrost and active layers significantly affects the transport pathways and transit time of water, consequently the water fluxes within the watershed (Kurylyk et al., 2016; Rogger et al., 2017). The low hydraulic conductivity of frozen ground and the seasonal freeze-thaw active layer can have a considerable impact on surface and subsurface water storage, drainage, and routing (Woo and Xiu, 2010; Helbig et al., 2013). Therefore, the hydrological processes in permafrost watersheds are characterized by a unique regime that is much less understood than those in non-permafrost regions. While water transit times (Aubeneau et al., 2016; Bergstrom et al., 2016; Yueqing et al., 2016) and water age (Birkel and Soulsby, 2016; Gabrielli et al., 2018; Visser et al., 2019) have been extensively studied in non-permafrost regions, little is known in permafrost regions.
Water age reveals the fundamental characteristics of the watershed, provides preliminary information about the geochemical system, and has a significant impact on the biological cycle, pollutant transportation, and conversion process (Burns et al., 2003). The mean transit time (MTT) refers to the average time the average time that elapses between parcels of water entering as precipitation and leaving again as streamflow Kirchner. (2016a). MTT describes various aspects of water storage, flow path and other critical informations, serving as a comprehensive indicator to characterize the key spatial variability of the flow path. Kirchner. (2016a) and Kirchner. (2016b) proposed a new indicator to describe water age: young water fraction (Fyw), water aged within a certain threshold is called new water, and the proportion of new water in runoff is called Fyw, which eliminates the effects of spatial heterogeneity and non-stationarity in watersheds with different properties. For instance, Mcguire and Mcdonnell (2010) investigated the control of hillside-streams through the observation of hydrological processes and stable isotopes in western Oregon, founding that the MTT of soil water ranged from 10 to 25 days, while the baseflow MTT were between 1 and 2 years. Although extensive studies have been conducted in tropical (Jeelani et al., 2013; Kumar et al., 2018), subtropical (Hu et al., 2020) or temperate watersheds (Garvelmann et al., 2017; Bansah and Ali, 2019) to analyze the water age and transit time, there is a lack of research on the water age and transit time in forest watersheds with permafrost. This research gap is crucial for understanding the hydrological processes under climate change.
Isotope technology is widely used to evaluate detailed hydrological processes at different spatial scales, such as the quantitative study of the conversion between the “three waters (rainfall, surface runoff, and groundwater)" and the source of runoff (Hinton et al., 1994; Klaus and McDonnell, 2013; Li et al., 2019). The selection of tracers in hydrograph separation based on water balance has become the crucial to accurately identify the runoff components. For example, Penna et al. (2015) observed that the contribution of groundwater and hillside soil water dominated the flow response under the humid conditions of autumn in a small forest catchment in the Italian Alps using the isotope method. Additionally, the conductivity mass balance method (CMB) has been used to divide the base flow (Zhang et al., 2012; Li et al., 2014). For instance, in Black Brook Watershed of New Brunswick, Li et al. (2014) found that the annual average replenishment was 322 mm obtained by the 20-year conductivity data using the CMB method. Therefore, using the aforementioned two independent methods to investigate the source of runoff components in forest watershed with permafrost can be mutually validated, thereby enhancing the accuracy of the results.
The Daxing’an Mountains permafrost region is located at the southern margin of the high-latitude permafrost region of Eurasia, which is one of the most significant permafrost regions affected by climate warming in China and even the world (Jin et al., 2007). Recent research have revealed that permafrost thaw has significant effects on annual runoff (Duan et al., 2017a), winter baseflow (Duan et al., 2017b) and streamflow recession (Feng et al., 2022) in the permafrost region in the Daxing’an Mountains. However, previous studies treated the watershed as a black box and only focus on the relationships between the runoff at the watershed outlet and the underlying surface. As a result, knowledge of hydrological processes within the watershed, such as runoff source and transit time, remains limited. Therefore, the objectives of this study were: (a) to perform hydrograph separations using daily-scale time series isotope data and continuous conductivity data, respectively. (b) Calculate Fyw and MTT using high-frequency daily sampling data.
2 Materials and methods
2.1 Study area
The present study was conducted in the LYL basin (53°23′53″–53°27′30″N, 122°14′27″–122°21′02″E), which is located at the southern margin of the high-latitude permafrost region in the northernmost China and is a primary tributary of Heilongjiang watershed (Figure 1). The area of the study basin is 21.9 km2, and the elevation ranges from 302 to 696 m above sea level, with an average slope of 13.8°. The research zone is characterized by a cold -temperature continental monsoon climate, with a duration of winter for more than 7 months. The annual average temperature is −4°C. The average annual precipitation is 500 mm, of which about 3/4 occurs from June to September. The soil type in the study watershed is dominated by brown coniferous forest soil with the average thickness ranging from 15 cm in the hillslope to 50 cm in the flat valley. The study area also features a permafrost layer. The main tree species are composed of 30% Larix gmelinii (Rupr.) Kuzen., 30% Betula platyphylla Sukaczev, 20% Populus davidiana Dode and 20% Pinus sylvestris var. mongholica Litv.
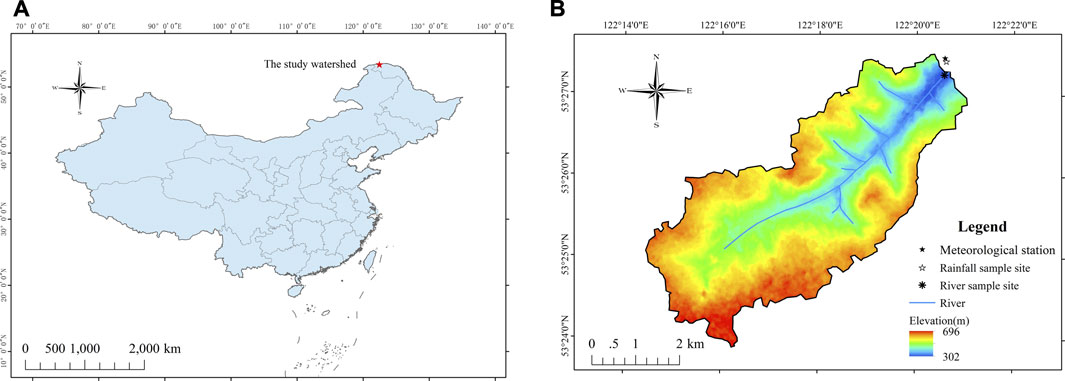
FIGURE 1. (A) Is the location of the LYL watershed in China, and (B) displays the sampling location and instrument layout of the watershed.
2.2 Sample collection
It is important that higher sampling frequency can provide a more accuracy estimations of young water fraction. For example, compared to weekly sampling, daily sampling resulting in a higher Nash-Sutcliffe Efficiency and more pronounced short term dynamics in the simulation result (Stockinger et al., 2016). In this study, the study period is from June 8th to October 19th in the year of 2019. The rainfall was manually sampled, and when multiple rainfall events occur on a day, the δ value was calculated as the weighted average of the rainfall. The runoff was manually sampled at a fixed daily sampling time of 18:00. All samples were collected in 50 mL polyethylene bottles and immediately sealed with Parafilm. Return to the laboratory for filtration and sealing, keep frozen to prevent evaporation, and tested within a few days. Total of 21 rainfall samples and 133 runoff samples were collected during the 133 days study period.
The instantaneous water level height and conductivity data of runoff were monitored by the water level gauge (Onset HOBO U20-001) and conductivity gauge (Onset HOBOU24-01) placed on the composite weir. In order to obtain continuous flow data, a water level flow relationship curve was established based on the known measured water level and the composite weir cross-section flow. The dynamic changes of soil temperature (Ts, °C) and soil moisture (Ms, %, volumetric soil moisture content) observed at fixed points in the watershed using the soil moisture and temperature sensor (Campbell Scientific CS650) at depths of 5, 10, 20, and 40 cm, with recording intervals of 30 min. Rainfall (R, mm) and air temperature (Ta, °C) data were provided by meteorological station immediately adjacent to the watershed (Figure 1). The dynamics of Ta, Ts, R, and Ms in the study period can be found in Figure 2.
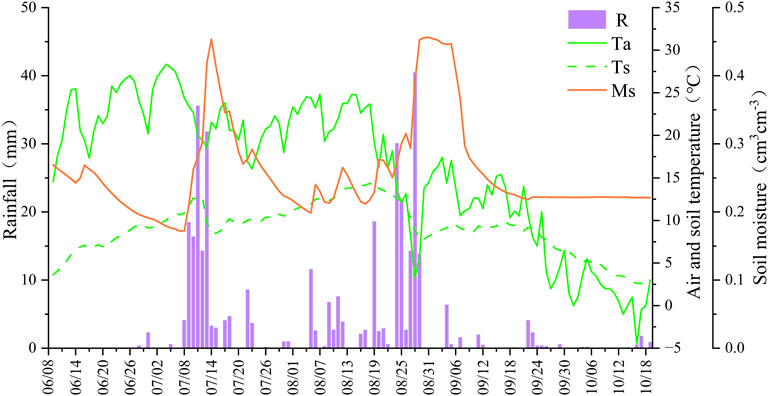
FIGURE 2. Daily rainfall (R), air temperature (Ta), mean soil temperature (Ts) and mean soil moisture (Ms) of the LYL watershed during the study period.
2.3 Laboratory analysis of isotope
All isotope data were analyzed at Shenyang Institute of Applied Ecology using the liquid water isotope analyzer (LGR-DLT-100, United States). The stable isotope composition of 18O and D was expressed in δ (‰ or per mil), with its definition based on the Vienna Standard Mean Seawater (VSMOW) measurement of δD and δ18O (where δ(‰) =(Rsample/Rstandard-1)×1000). The analytical accuracy of δ18O and δD are ±0.10‰ and ±0.30‰, respectively.
2.4 Hydrograph separation
The introduction of water isotope (18O or D) as a tool to divide the components of event water and pre-event water based on their source time in hydrograph separation is because isotope-based hydrograph separations (IHS) rely on the stable water components that can be objectively measured. In the mass balance method can be used to separate the runoff components if the initial isotope values of the two water sources are significantly different. The calculation procedure can be defined as follow:
where Qt represents the runoff depth (mm/day), Qp represents the pre-event water (mm/day), Qe represents the event water (mm/day), Ct, Cp and Ce represent the δ values of runoff depth at the timing of t, pre-event water and event water (‰), and Fp represents the fraction of pre-event water in the stream.
Theoretically, the pre-event water is the water stored in the basin before the event occurs. The pre-event water flows through the soil and rock formations and then flows into the river channel together with the event water to form river runoff. Thus, the ion concentration (conductivity) of the pre-event water is typically greater than that of event water. The conductivity mass balance method (CMB) also relies on the mass balance method to identify the proportion of different water sources. Where Qt is the runoff depth (mm/day), Qp is the component of pre-event water (mm/day), Qe is the component of event water (mm/day), CDt, CDp and CDe are the conductivity values of stream water at the timing of t, pre-event water and event water (μS/cm), and FDp is the fraction of pre-event water in runoff using CMB method with the equation as follow:
In this study, we define pre-event water (usually called old water) as the water stored in the catchment before the rainfall event, while the event water (usually called new water) is the water from the current precipitation event.
2.5 Young water fraction and mean transit time
Young water fraction (Fyw) represents the proportion of water that is less than a certain threshold age. The Fyw of the study catchment was calculated using the method developed by Kirchner. (2016a). First of all, sine wave fitting was performed on the time series of δ18O (‰) values for rainfall and streamflow, and determine the sine and cosine coefficients of rainfall and streamflow through multiple linear regression:
Where Cr(t) and Cs(t) are the actual measured δ18O (‰) values of rainfall and runoff, respectively, and a and b are the coefficients used to determine the amplitude and phase shift of the seasonal δ18O cycle, f is the frequency of the period (f=1 year-1 for a seasonal period), t is the time (in days) after the start of the sampling period, kr and ks are constants for sine wave fitting:
Where Ar and As represent the amplitude of rainfall and runoff, respectively, φr and φs represent the phase shift of rainfall and runoff, respectively.
The phase shift difference can be expressed by the shape parameter α in the gamma distribution function Γ(α,β) as:
The scale parameter β in Γ(α, β) can be expressed as:
The threshold age τyw of young water fraction can be obtained by using the regression equation proposed by Kirchner (2016a):
Fyw can be obtained by lower incomplete gamma function Γ (τ, α, β).
MTT: mean transit time, the average time for water parcels to enter the catchment in the form of precipitation until it leaves the catchment. It can be expressed as:
Where C is the attenuation coefficient, C=As/Ar.
2.6 Data analysis
In the current study, Pearson correlation analysis was applied to determine the relationship between the δ18O of the runoff and Ta, rainfall, Ts and Ms. Subsequently, in order to eliminate the effect of multicollinearity on the equation, the arithmetic mean values of Ms and Ts from different layers (depths of 5, 10, 20, and 40 cm) in this article were selected. Finally, a multiple linear regression including δD and δ18O of the runoff was performed to identify the main influencing variables. The backward trajectory calculation was obtained by Hybrid Single-Particle Lagrangian Integrated Trajectory (HYSPLIT) web version combined with ArcGIS. The fitting of the sine wave yielded the Fyw of the rainfall and runoff by using Matlab.
3 Results
3.1 Meteoric water lines
The δ18O value of rainfall in the LYL watershed varied between −25.0‰ and −4.5‰, with an average value of −13.1‰, and the δD value varied between −188.2‰ and −40.9‰, with an average value of −100.3‰. Furthermore, the δ18O value of the river water varies between −16.8‰ and −14.1‰, with an average value of −16.2‰, and the δD value varies between −124.6‰ and −112.5‰, with an average value of −119.0‰.
Figure 3 shows the relationship between the δD and δ18O for rainfall and stream water in the LYL watershed, along with a comparison to the Global Meteoric Water Line (GMWL). Craig (1961) proposed GMWL for global rivers, lakes and rainfall samples, has a relationship of δD=8δ18O+10‰. The Local Meteoric Water Line(LMWL) (δD = 7.41δ18O-3.05‰, n = 21, R2=0.97, p < 0.001) of rainfall in the LYL watershed has a similar slope and a smaller intercept compared to the GMWL. However, there is a significant difference between the LMWL (δD=4.82δ18O-41.00‰, n=133, R2=0.61, p < 0.001) of the stream and GMWL, with a gentler slope and a larger intercept. The LMWL slope (4.82) of the runoff is the lowest than for the LMWL of rainfall and GMWL.
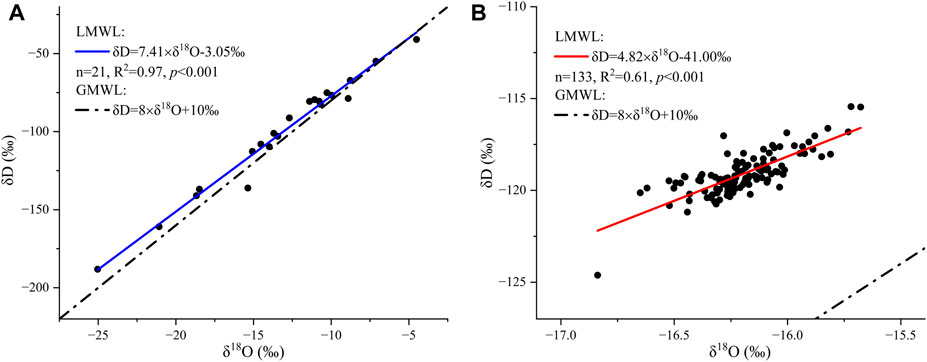
FIGURE 3. The relationship between δD and δ18O: (A) rainfall and (B) runoff. The solid line is LMWL and the dotted line is GMWL.
3.2 The temporal variations of stable isotopes (or electrical conductivity)
3.2.1 Isotope variations of rainfall and runoff
Figure 4 showed that the δ18O isotopic composition changes of rainfall are significant than those of streamflow (Figure 4). The δ18O values of rainfall and runoff decreased during the study period. The change trend of the δ18O of stream water showed a delay of about 10 days compared with the isotopic composition of rainfall.
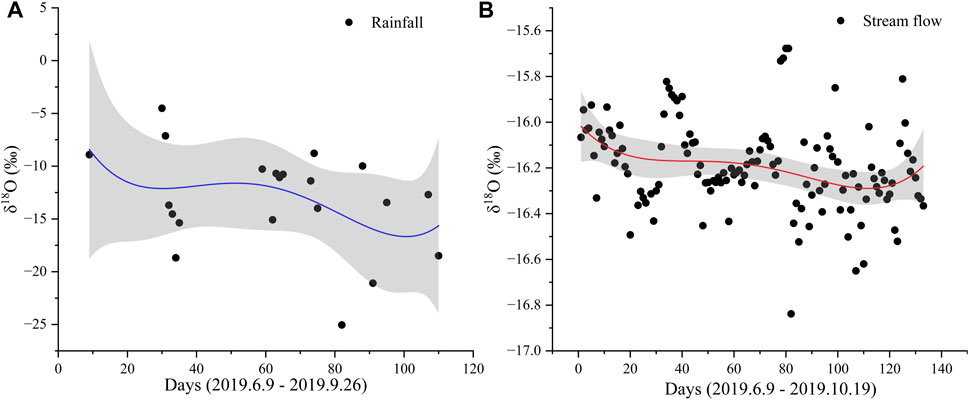
FIGURE 4. Changes in δ18O value of rainfall (A) and streamflow (B), the gray is 95% of the confidence interval.
3.2.2 The relationship between stable isotopes and various factors
The results of Pearson’s correlation analysis indicated that a significant negative correlation between the runoff depth and the isotope δD and δ18O values of stream water, with correlation coefficients of −0.66 and −0.58, respectively (Figure 5). Ta and EC also have a certain impact on the isotopic values of runoff (Table 1).
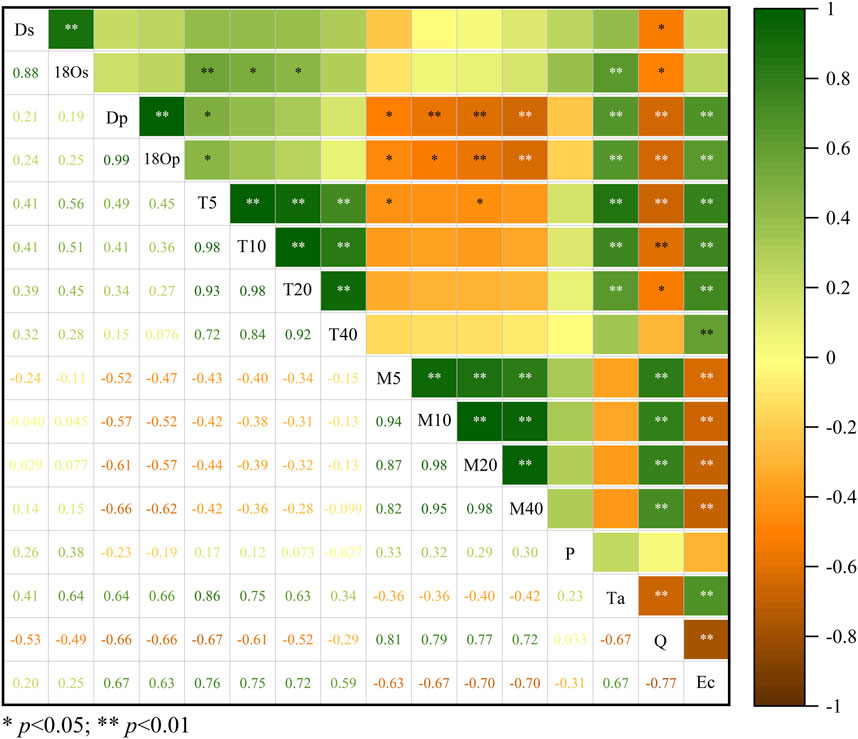
FIGURE 5. The correlation between stable isotope and various factors. ** Represents p<0.01, * represents p<0.05. Ds and 18Os represent the δ D (‰) and δ 18O (‰) of runoff, respectively; Dp and 18Op represent the δ D (‰) and δ 18O (‰) of rainfall, respectively; Tx is the soil temperature at a depth of x centimeters (°C); Mx is the soil moisture (%) at a depth of x centimeters; R, rainfall (mm); Ta, temperature (°C); Q, runoff depth (mm/day); EC, electrical conductivity (μS/cm).
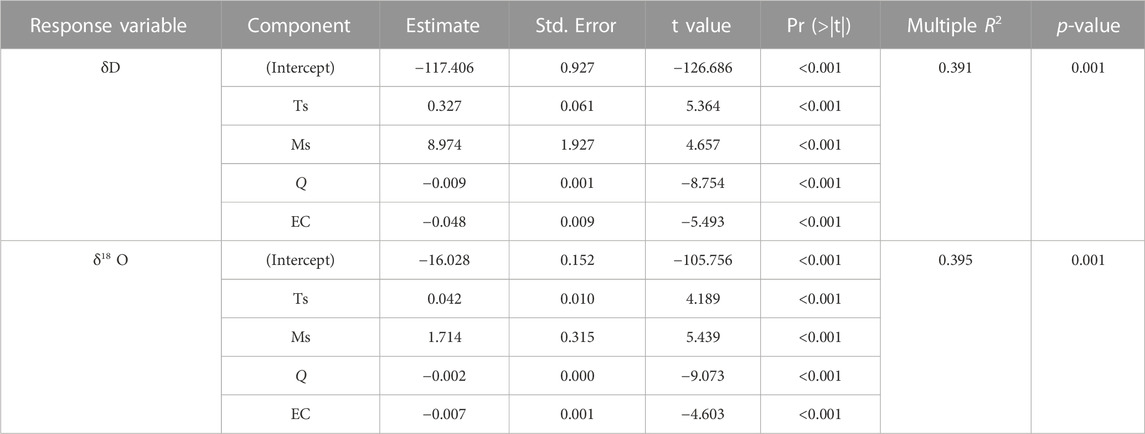
TABLE 1. Multi-linear regression model results of stable hydrogen and oxygen compositions of runoff. Abbreviations: t is the value of the T-test. Pr (>| t |), used for T-test judgment, matched with significance markers. p is used for F-test judgment, matching significance markers. Ts represents different depth average soil temperature (°C). Ms represents different depth average soil moisture (%), and Q represents runoff depth, and EC is the electrical conductivity.
3.3 Hydrograph separation
Comparing the IHS and CMB (Figure 6), it can be seen that the dynamic of the proportion of new water in runoff components is consistent. Both methods demonstrated that runoff mainly derived from old water (pre-event water). We also noted that CMB underestimated the pre-event water fraction during the rainfall period compared to the isotope method. Additionally, we found that CMB was not able to capture the minor changes of the runoff components when an event with small rainfall amount occurred. For example, from early to mid August, CMB shows that the runoff was composed of old water and does not reflect the proportion of new water. HIS could divide small proportion of new water.
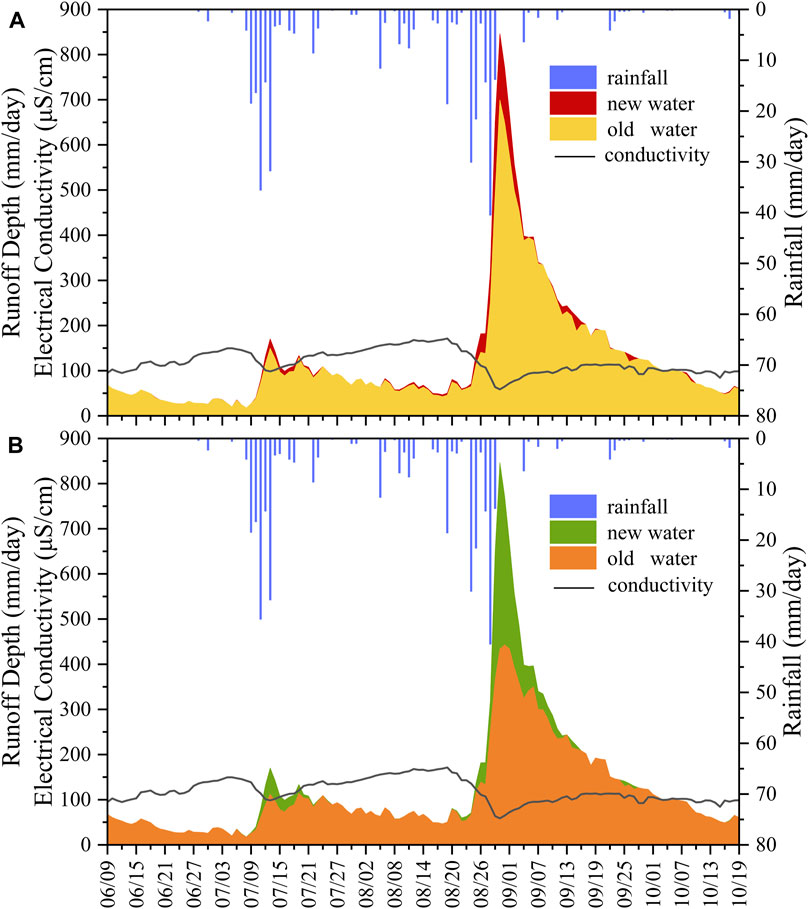
FIGURE 6. (A, B) are the hydrograph separation of the LYL watershed by isotope-based hydrograph separations (IHS) and conductivity mass balance method (CMB) during the study period, respectively.
Isotopic hydrograph separation analysis showed that the contribution of new water and old water was 3.6% (Table 2) and 96.4% during the study period, respectively. The rainfall amount and duration of the first peak in summer (Event I) were 127 mm and 9 days, respectively (Figure 7). Event I is composed of 7.5% new water and 92.5% old water. The maximum contribution of new water at the peak is 13.0%. The rainfall amount and duration of Event II (the second summer peak) were 123 mm and 7 days respectively. Event II is composed of 12.5% new water and 87.5% old water. The maximum amount of new water in the runoff component at the peak reaches 24.5%. Furthermore, the runoff calculated by conductivity mass balance method is composed of 5.7% new water and 94.3% old water during the study period. Event I is composed of 15.4% new water and 84.6% old water. The maximum contribution of new water at the peak of the flood is 34.1%. Event II is composed of 20.8% new water and 79.2% old water. New water accounts for the largest proportion of the streamflow, reaching 48.8% at the end of August (Table 2).
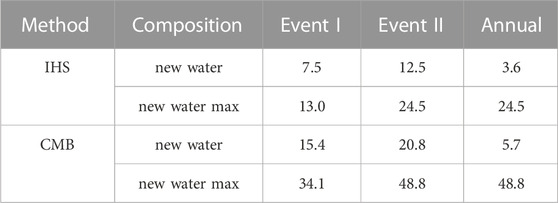
TABLE 2. New water composition and maximum value of hydrograph separation by IHS and CMB method, unit: %.
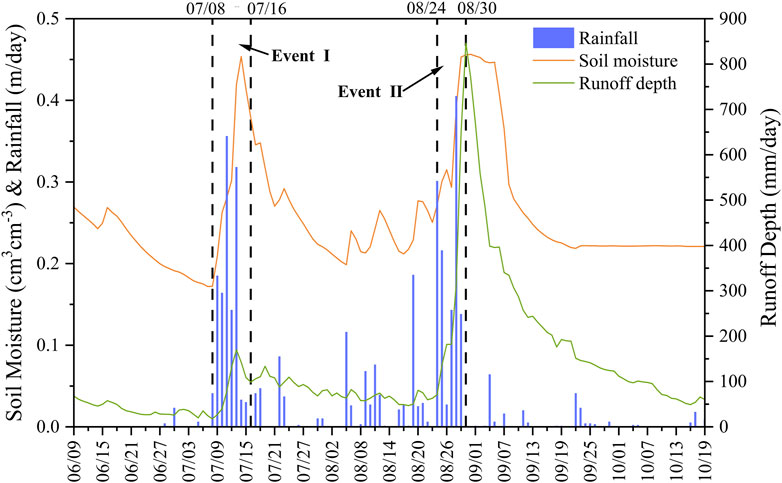
FIGURE 7. Daily rainfall, runoff depth and soil moisture of the LYL basin during the study. The blue histogram is rainfall, the green line is runoff depth, and the orange line is soil moisture.
It can be seen from Figure 7 indicated that the rainfall in Event I and Event II had similar rainfall amount and duration. Interestingly, we found that the shift in soil moisture from dry to wet states significantly influenced the composition of streamflow (Figure 7). Specifically, the soil moisture content before Event I was 0.172%, while the soil moisture content before Event II was 0.250%. The higher the soil moisture before rainfall lead to the greater the new water fraction. Moreover, the degree of underestimation of the old water fraction using the electrical conductivity method increased with an increase in the soil moisture before rainfall.
3.4 Young water fractions
The young water fraction (Fyw) of the LYL watershed was estimated using the rainfall and runoff δ18O values measured by high-frequency daily sampling data. The coefficient of sine and cosine through multiple linear regression was determined by performing sine wave fitting on the δ18O time series data of rainfall and runoff and calculating the amplitude of the sine wave fitting (Figure 8). The largest deviation of rainfall and runoff from their corresponding annual average isotope content was related to the estimated Fyw (Table 2). The sine wave fitting of rainfall and runoff was found to be statistically significant (p < 0.0001). The Fyw value of the runoff was 5.6% for the LYL watershed. According to the above formula, it can be calculated that, the threshold age is 65 days (Table 3). The uncertainty ranges of Fyw and τyw were 1.8%–24.5% and 58–82 days, respectively. The MTT was equal to 3.33 years.
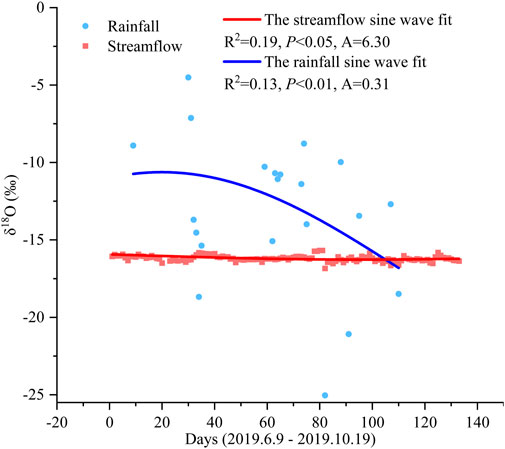
FIGURE 8. The sine wave fitting δ18O of rainfall and runoff in the LYL basin. A is the amplitude of the model.
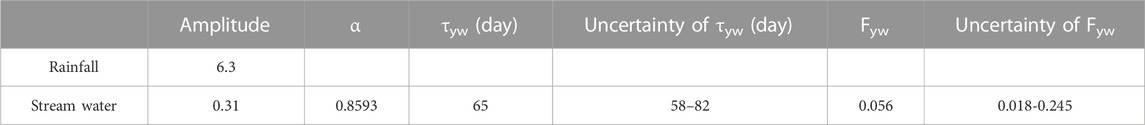
TABLE 3. The amplitude, threshold, uncertainty range of rainfall and runoff obtained through sine wave fitting.
4 Discussion
4.1 Meteoric water lines
The isotopic composition of rainfall and its variation are the most important basic data for studying river runoff, lake water and groundwater. Due to the isotope fractionation in the process of evaporation and condensation (Craig, 1961), the hydrogen and oxygen isotopic composition of atmospheric precipitation has a linearly related change, that is, the atmospheric waterline. The slope of LMWL is 7.41 less than GMWL, which means that the study area is in the inland with low temperature and far away from the vapor source. The intercept of LMWL is smaller than GMWL, which indicates that the water vapor has experienced multiple condensations during the process of reaching the basin, and the remaining water vapor is formed δD in rainfall is relatively depleted and deviates from equilibrium (Araguás-Araguás et al., 2000; Wang et al., 2019; Keesari et al., 2021). This is similar to the atmospheric waterline relationship obtained in northern China (Zhao et al., 2018). Compared with the LMWL of rainfall and the GMWL of rainfall, the stream water LMWL has the smallest slope and the largest intercept. On the one hand, it shows that the stream water is mainly recharged by the pre-event water (Marc et al., 2001). On the other hand, the stream water is most affected by evaporation and enriched in isotopes (Sanchez-Murillo et al., 2015). Compared with GMWL, a smaller slope represents relatively strong evaporation, which is similar to the results of river research in cold temperature regions of China (Li et al., 2014).
The entire sampling period was divided into monthly intervals from June to October, and the backward trajectory of each rainwater sample was calculated for 5 months (Figure 9). The water sources of the LYL watershed include four regions. In June, it mainly comes from Siberia. In July, in addition to Siberia, there is also part from the Arctic Ocean, and a small part comes from the yellow sea and South China Sea. In August, in addition to Siberia, there is also part from the Pacific Ocean. It mainly comes from Siberia and the Arctic Ocean in September, and Siberia in October. Similar conclusions were reached with previous studies (Li et al., 2012; Ding and Gao, 2015). The changes in time series isotope values fully confirm the variability of water vapor sources and the complexity of evaporation and condensation experienced in the transportation process. Comparing the rainfall δ18O in June, July, August and September and October, it is found that the δ18O in September and October is more depleted because of the same tracking 10-day trajectory, which is comes from cold regions, and the longer transport path is more prone to multiple condensation events.
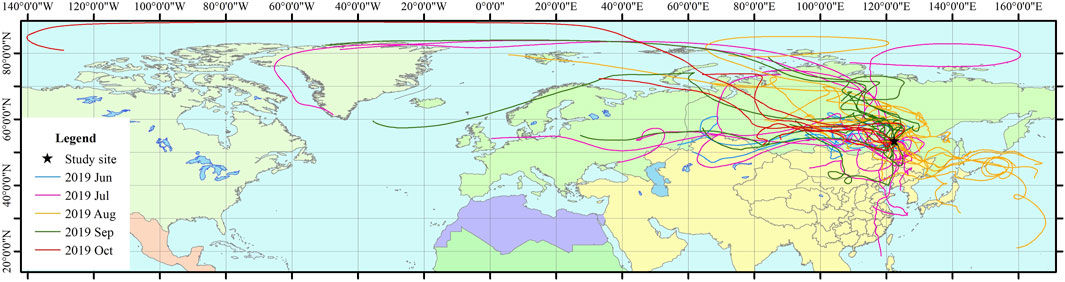
FIGURE 9. The potential water source of the LYL Basin based on the Hysplit model. Black stars are the location of the research area. Different colors represent the water vapor transport trajectories of 10 days ago in different months.
4.2 Influencing factors of rainfall and streamflow
4.2.1 Isotope variations of rainfall and runoff
Previous studies have identified temperature effects (showing a positive correlation), latitude effects (from low latitudes to high latitudes, the heavy isotopes of rainfall are gradually depleted), altitude effects (decreasing with the increase in terrain elevation), continental effects (isotopes of rainfall). The composition gradually decreases with distance from the coastline), rainfall effects (showing a negative correlation trend), and seasonal effects (high δ value in summer and low in winter) affect the isotopic composition of atmospheric rainfall (Dansgaard, 1964; Rozanski et al., 1992; Liu et al., 2010; Jia et al., 2019; Bedaso and Wu, 2020). We found that the rainfall isotope δ18O value is affected by temperature and rainfall in the LYL watershed. Isotope enrichment with increasing temperature; Isotope depletion with increasing rainfall. The δ18O of rainfall decreased because it was mainly controlled by the effect of rainfall in the periods of 2019.6.9–2019.7.9 and 2019.8.6–2019.9.17 (Figure 4). As the rainfall increases, the possibility of fractionation becomes smaller, leading to the depletion of δ18O (Rozanski et al., 1992; Sánchez-Murillo et al., 2016). The δ18O of rainfall increases slowly because of temperature control in 2019.7.9–2019.8.6. The equilibrium fractionation occurs because the temperature changes, and the δ18O enrichment is because the evaporation becomes stronger (Gat, 1996). The reason why δ18O of rainfall increased after 2019.9.17 may be that the characteristics of the source of water vapor affect the change of rainfall δ18O (Sánchez-Murillo et al., 2016).
4.2.2 Influencing factors of stream water isotope and conductivity
The δ18O fluctuation of the stream water changes related to the rainfall dynamic, but the amplitude is small and delayed because the pre-event water is the main supply source of the stream water rather than the event water, which is consistent with the findings of previous studies in some alpine regions, pre-event water is approximately 66∼89% (Hill and Waddington, 1993; Marc et al., 2001; Dahlke et al., 2014). Pearson’s correlation analysis showed that the soil temperature and soil moisture that stores the pre-water is the main factor affecting the δ18O of the runoff. Some studies have shown that the deep soil pore water has more depleted δ18O (Sugimoto et al., 2003; Throckmorton et al., 2016), and δ18O showed a downward-steady-decreasing trend from June 9th to September 30th (Figure 4). The event water replaces the pre-event water previously stored in the soil and reduces the δ18O of the stream water when Event I occurs (Hill and Waddington, 1993; Hinton et al., 1994). When the flood peak of Event II arrived, the δ18O of the runoff was lower than that of the flood peak of Event I, indicating that in addition to the influence of rainfall on the δ18O of the runoff, the event water may have replaced the deeper pre-event water. The apparent increase in δ18O of the stream was caused by entry of the freeze-thaw cycle from October (Wang et al., 2009).
The influencing factors of conductivity are rainfall amount, rainfall duration, soil moisture before rainfall, and runoff depth (Figure 5). This is consistent with the results of some previous studies (Meriano et al., 2011; Pan et al., 2018). The number of rainfall events and rainfall are less at the beginning of the sampling period, which is conducive to the infiltration of rainfall (Hoeg et al., 2000; Carey and Quinton, 2005; Mueller et al., 2016), so the conductivity shows an increasing trend. The conductivity of the stream is the smallest when it reaches the peak during the summer peak period, indicating the dilution effect of rainfall (Meriano et al., 2011). The stream water conductivity value gradually increased after reaching the peak, indicating that the pre-event water (rainfall on the hillside converted into gravity water to form a higher conductivity hillside underground runoff) recharged the stream water (Penna et al., 2016; Buzek et al., 2019). With the excretion of event water, the hydraulic gradient between the water stored in the soil and the stream water decreases, resulting in a longer mean transit time (Dunn et al., 2010; Mcguire and Mcdonnell, 2010; Chatterjee et al., 2018) and sufficient water-rock interaction, and the stream water conductivity shows an increasing trend. The decrease in conductivity of Event II was greater than that of Event I, because several rainfall events occurred before Event II, and soil moisture conditions changed, which caused a certain degree of washing effect (Penna et al., 2016). The conductivity value is close to the level before the rain at the end of the observation.
4.3 Hydrograph separation
Comparing the results of IHS and CMB hydrograph separation, although IHS sampling is cumbersome and expensive, it is generally considered to be more accurate (Mcdonnell et al., 1990; Laudon and Slaymaker, 1997; Klaus and McDonnell, 2013). The overall trend of the two methods is consistent with the key nodes, so CMB, which can obtain continuous data and has a lower cost, is also a good substitute. To obtain more accurate and detailed results, CMB is not optimal compared to HIS. Because CMB not only underestimates the components of the old water when a rainfall event occurs, but also fails to respond and feedback in time when a small amount of rainfall occurs. It may be because the conductivity of the medium itself is affected by too many external factors and cannot reflect subtle changes. δ18O is a natural tracer and extremely sensitive, which can reflect extremely subtle changes in the substance itself.
Comparing Event I and Event II, it can be found that although the rainfall and rainfall duration of the two rainfall events are similar, the runoff depth and runoff composition (whether by IHS or CMB method) are significantly different. The soil moisture condition before the rainfall event is the root cause of this difference (Penna et al., 2011; Pan et al., 2018). Before the occurrence of Event I, the soil was in a relatively dry state. At the initial stage of Event I, there was less runoff and more rainfall was given priority to replenish the soil water deficit, which would lead to a lag in the response time of runoff to rainfall (Penna et al., 2011). There were 6 rainfall events in the 9 days before Event II, which increased the area of the saturated zone in the basin and enhanced the water conduction capacity, and the rainfall could be quickly converted into a full runoff (Penna et al., 2011; Penna et al., 2016). So it can be concluded: the greater the soil moisture before rainfall, the greater the new water fraction.
4.4 Fyw and MTT
Considering comparing Fyw and MTT in calculating water age at the same time, Hu et al. (2020) explained that lower Fyw and longer MTT means that the response time of water resources management has a considerable lag, which is meaningful for the evaluation of river water flow and water quality. The underlying surface of the karst system is complex, and comparing Fyw and MTT can track and quantify the flow path very well (Rusjan et al., 2019). Our research also selected both the estimation of Fyw and MTT.
This is the first time that the Fyw of a small forest watershed has been estimated in the Daxing’an Mountains, and the results obtained are consistent with the global rainfall and runoff isotope database compiled by Jasechko et al. (2016). Our research concluded that the young water score of 5.6% is lower than the global average of 26%. The first reason may be because the study basin is located in a permafrost area, and the flow of permafrost rivers is mainly controlled by the melting and freezing of the active layer (Wang et al., 2009), that is, when the active layer melts, more old water is quickly supplied to the runoff. Song et al. (2017) also illustrates this point in the permafrost regions of the Qinghai-Tibet Plateau. The second reason may be due to the strong capacity of soil water conservation in small forest watersheds (Wang et al., 2013). The larger the young water component means that it can accelerate the biological cycle process and accelerate the transfer of pollutants, thereby affecting the entire aquatic system (Jasechko et al., 2016).
Some small watershed studies have shown that MTT is generally less than 1 year (Tetzlaff et al., 2010; Muñoz-Villers et al., 2016; Rusjan et al., 2019). The 3.33 years obtained by our research were longer than those of the previous studies, probably because of the environmental attributes of the frozen soil area in the small forest watershed, and the change of the active layer will cause the change of MTT. Because slope, precipitation, snowmelt, and canopy closure are all the major controlling factors that affect the time and size of water flowing through mountainous basins (Wolock et al., 1997; Tetzlaff et al., 2010; Stockinger et al., 2017; Fang et al., 2019).
As a fragile ecosystem, these findings are of great significance to the development, utilization and protection of water resources. Our estimation of young water components and mean transit time based on isotope method is helpful for enhance understanding of the hydrological process, biological cycle, and effective protection of water resources in permafrost regions. As a sensitive permafrost region, the lower Fyw value and the higher MTT value indicate that the active layer stores and provides a lot of water resources for the stream.
5 Conclusion
This research highlights the streamflow components using daily isotope data of rainfall and runoff based on the IHS and CMB methods. The results showed that stable isotopic composition of rainfall and runoff had obvious temporal and spatial patterns. The HYSPLIT model indicated that the source of water vapor in the study area is mainly from the northwest monsoon and southeast monsoon that affect δD and δ18O. The contribution of new water and old water using isotopic hydrograph separation was 3.6%, 96.4% using isotopic hydrograph separation, while the contribution was 5.7%, 94.3% using conductivity mass balance method. However, the conductivity mass balance method was not able to capture the details of the runoff response in small rainfall events compared with isotopic hydrograph separation. The young water fraction in the study watershed varies between 1.8% and 24.5%, with the water age ranging from 58 to 8 days. The average value of the Fyw for water aged less than 65 days was 5.6%. The MTT is 3.33 years. The longer MTT and smaller Fyw mean that in the context of global climate change, permafrost aquifers become thicker, water from soil and groundwater becomes more abundant, base flow becomes larger, and transport time becomes longer. The response of permafrost regions to recent activities and the subsequent impacts of climate change is slow. These research findings provide valuable insights into a deeper understanding of the hydrological processes in permafrost regions.
Data availability statement
The original contributions presented in the study are included in the article/Supplementary materials, further inquiries can be directed to the corresponding authors.
Author contributions
XX, LD, and TC contributed to conception and design of the study. XX organized the database. XX performed the statistical analysis. XX and LD wrote the first draft of the manuscript. LD and TC wrote sections of the manuscript. All authors contributed to the article and approved the submitted version.
Funding
This study was supported by the National Natural Science Foundation of China (Nos 41901018 and 31971451), Provincial Science Foundation of Heilongjiang (No. LH 2020D003), and Provincial Postdoctoral Foundation of Heilongjiang (No. LBH-Z20106).
Acknowledgments
Thank you to Northeast Forestry University for this platform, thank you for the teacher’s training, and thank you for the help of my younger brothers and sisters.
Conflict of interest
The authors declare that the research was conducted in the absence of any commercial or financial relationships that could be construed as a potential conflict of interest.
Publisher’s note
All claims expressed in this article are solely those of the authors and do not necessarily represent those of their affiliated organizations, or those of the publisher, the editors and the reviewers. Any product that may be evaluated in this article, or claim that may be made by its manufacturer, is not guaranteed or endorsed by the publisher.
References
Araguás-Araguás, L., Froehlich, K., and Rozanski, K. (2000). Deuterium and oxygen-18 isotope composition of precipitation and atmospheric moisture. Hydrol. Process. 14, 1341–1355. doi:10.1002/1099-1085(20000615)14:8<1341::AID-HYP983>3.0.CO;2-Z
Aubeneau, A. F., Hanrahan, B., Bolster, D., and Tank, J. (2016). Biofilm growth in gravel bed streams controls solute residence time distributions. J. Geophys. Res. Biogeo. 121, 1840–1850. doi:10.1002/2016JG003333
Bansah, S., and Ali, G. (2019). Streamwater ages in nested, seasonally cold Canadian watersheds. Hydrol. Process. 33 (4), 495–511. doi:10.1002/hyp.13373
Bedaso, Z., and Wu, S. Y. (2020). Daily precipitation isotope variation in Midwestern United States: implication for hydroclimate and moisture source. Sci. Total Environ. 713, 136631. doi:10.1016/j.scitotenv.2020.136631
Bergstrom, A., Mcglynn, B., Mallard, J., and Covino, T. (2016). Watershed structural influences on the distributions of stream network water and solute travel times under baseflow conditions. Hydrol. Process. 30, 2671–2685. doi:10.1002/hyp.10792
Birkel, C., and Soulsby, C. (2016). Linking tracers, water age and conceptual models to identify dominant runoff processes in a sparsely monitored humid tropical catchment. Hydrol. Process. 30, 4477–4493. doi:10.1002/hyp.10941
Burns, D. A., Plummer, L. N., Mcdonnell, J. J., Busenberg, E., Casile, G. C., Kendall, C., et al. (2003). The geochemical evolution of riparian ground water in a forested piedmont catchment. Groundwater 41, 913–925. doi:10.1111/j.1745-6584.2003.tb02434.x
Buzek, F., Novak, M., Cejkova, B., Jackova, I., Bohdalkova, L., Veselovsky, F., et al. (2019). Assessing DOC export from a Sphagnum -dominated peatland using δ 13 C and δ 18 O-H 2O stable isotopes. Hydrol. Process. 33, 2792–2803. doi:10.1002/hyp.13528
Carey, S. K., and Quinton, W. L. (2005). Evaluating runoff generation during summer using hydrometric, stable isotope and hydrochemical methods in a discontinuous permafrost alpine catchment. Hydrol. Process. 19, 95–114. doi:10.1002/hyp.5764
Chatterjee, S., Sinha, U. K., Ansari, M. A., Mohokar, H. V., and Dash, A. (2018). Application of lumped parameter model to estimate mean transit time (MTT) of the thermal water using environmental tracer (3H): insight from uttarakhand geothermal area (India). Appl. Geochem. 94, 1–10. doi:10.1016/j.apgeochem.2018.04.013
Craig, H. (1961). Isotopic variations in meteoric waters. Science 133, 1702–1703. doi:10.1126/science.133.3465.1702
Dahlke, H. E., Lyon, S. W., Peter, J., Torbjrn, K., and Gunhild, R. (2014). Isotopic investigation of runoff generation in a glacierized catchment in northern Sweden. Hydrol. Process 28, 1–16. doi:10.1002/hyp.9668
Dansgaard, W. (1964). Stable isotopes in precipitation. Tellns 16, 436–468. doi:10.1111/j.2153-3490.1964.tb00181.x
Ding, T., and Gao, H. (2015). Relationship between winter snow cover days in Northeast China and rainfall near the Yangtze River Basin in the following summer. J. Meteorol. Res-Prc. 29, 400–411. doi:10.1007/s13351-014-4255-4
Duan, L., Man, X., Kurylyk, B., and Cai, T. (2017a). Increasing winter baseflow in response to permafrost thaw and precipitation regime shifts in Northeastern China. Water 9, 25–15. doi:10.3390/w9010025
Duan, L., Man, X., Kurylyk, B. L., Cai, T., and Li, Q. (2017b). Distinguishing streamflow trends caused by changes in climate, forest cover, and permafrost in a large watershed in northeastern China. Hydrol. Process. 31, 1938–1951. doi:10.1002/hyp.11160
Dunn, S. M., Birkel, C., Tetzlaff, D., and Soulsby, C. (2010). Transit time distributions of a conceptual model: their characteristics and sensitivities. Hydrol. Process. 24, 1719–1729. doi:10.1002/hyp.7560
Fang, Z., Carroll, R. W. H., Schumer, R., Harman, C., Wilusz, D., and Williams, K. H. (2019). Streamflow partitioning and transit time distribution in snow-dominated basins as a function of climate. J. Hydrol. 570, 726–738. doi:10.1016/j.jhydrol.2019.01.029
Feng, X., Duan, L., Kurylyk, B. L., and Cai, T. (2022). Impacts of permafrost thaw on streamflow recession in a discontinuous permafrost watershed of northeastern China. Sci. Total Environ. 847, 157624. doi:10.1016/j.scitotenv.2022.157624
Gabrielli, C. P., Morgenstern, U., Stewart, M. K., and Mcdonnell, J. J. (2018). Contrasting groundwater and streamflow ages at the maimai watershed. Water Resour. Res. 54, 3937–3957. doi:10.1029/2017WR021825
Garvelmann, J., Warscher, M., Leonhardt, G., Franz, H., Lotz, A., and Kunstmann, H. (2017). Quantification and characterization of the dynamics of spring and stream water systems in the Berchtesgaden Alps with a long-term stable isotope dataset. Environ. Earth Sci. 76, 766. doi:10.1007/s12665-017-7107-6
Gat, J. R. (1996). Oxygen and hydrogen isotopes in the hydrologic cycle. Annu. Rev. Earth Pl. Sc. 24, 225–262. doi:10.1146/annurev.earth.24.1.225
Helbig, M., Boike, J., Langer, M., Schreiber, P., Runkle, B. R. K., and Kutzbach, L. (2013). Spatial and seasonal variability of polygonal tundra water balance: lena River Delta, northern Siberia (Russia). Hydrogeol. J. 21, 133–147. doi:10.1007/s10040-012-0933-4
Hill, A. R., and Waddington, J. M. (1993). Analysis of storm run-off sources using oxygen-18 in a headwater swamp. Hydrol. Process. 7, 305–316. doi:10.1002/hyp.3360070308
Hinton, M. J., Schiff, S. L., and English, M. C. (1994). Examining the contributions of glacial till water to storm runoff using two-and three-component hydrograph separations. Water Resour. Res. 30, 983–993. doi:10.1029/93WR03246
Hoeg, S., Uhlenbrook, S., and Leibundgut, C. (2000). Hydrograph separation in a mountainous catchment-combining hydrochemical and isotopic tracers. Hydrol. Process. 14, 1199–1216. doi:10.1002/(SICI)1099-1085(200005)14:7<1199::AID-HYP35>3.0.CO;2-K
Hu, M., Zhang, Y., Wu, K., Shen, H., Chen, D., Dahlgren, R. A., et al. (2020). Assessment of streamflow components and hydrologic transit times using stable isotopes of oxygen and hydrogen in waters of a subtropical watershed in eastern China. J. Hydrol. 589, 125363. doi:10.1016/j.jhydrol.2020.125363
Jasechko, S., Kirchner, J. W., Welker, J. M., and Mcdonnell, J. J. (2016). Substantial proportion of global streamflow less than three months old. Nat. Geosci. 9, 126–129. doi:10.1038/ngeo2636
Jeelani, G., Kumar, U. S., and Kumar, B. (2013). Variation of δ18O and δD in precipitation and stream waters across the Kashmir Himalaya (India) to distinguish and estimate the seasonal sources of stream flow. J. Hydrol. 481, 157–165. doi:10.1016/j.jhydrol.2012.12.035
Jia, W., Xu, X., Yuan, R., Ma, X., and Li, Z. (2019). Variation characteristics of stable isotopes in precipitation and the environmental factors that influence them in the Shiyang River Basin of China. Environ. Earth. Sci. 78, 306. doi:10.1007/s12665-019-8307-z
Jin, H., Yu, Q., Lü, L., Guo, D., Li, Y., Yu, S., et al. (2007). Degradation of permafrost in the xing'anling mountains, northeastern China. Permafr. Periglac. 18, 245–258. doi:10.1002/ppp.589
Keesari, T., Sinha, U. K., Saha, D., Dwivedi, S. N., Shukla, R. R., Mohokar, H., et al. (2021). Isotope and hydrochemical systematics of groundwater from a multi-tiered aquifer in the central parts of Indo-Gangetic Plains, India-Implications for groundwater sustainability and security. Sci. Total Environ. 789, 147860. doi:10.1016/j.scitotenv.2021.147860
Kirchner, J. W. (2016a). Aggregation in environmental systems - Part 1: seasonal tracer cycles quantify young water fractions, but not mean transit times, in spatially heterogeneous catchments. Hydrol. Earth Syst. Sci. 20, 279–297. doi:10.5194/hess-20-279-2016
Kirchner, J. W. (2016b). Aggregation in environmental systems - Part 2: catchment mean transit times and young water fractions under hydrologic nonstationarity. Hydrol. Earth Syst. Sci. 20, 299–328. doi:10.5194/hess-20-299-2016
Klaus, J., and McDonnell, J. J. (2013). Hydrograph separation using stable isotopes: review and evaluation. J. Hydrol. 505, 47–64. doi:10.1016/j.jhydrol.2013.09.006
Kumar, N., Ramanathan, A., Keesari, T., Chidambaram, S., Ranjan, S., Soheb, M., et al. (2018). Tracer-based estimation of temporal variation of water sources: an insight from supra- and subglacial environments. Hydrological Sci. J. 63, 1717–1732. doi:10.1080/02626667.2018.1526381
Kurylyk, L., Barret, L., and Walvoord, A. (2016). Hydrologic impacts of thawing permafrost-A review. Vadose zone J. 15, 1–20. doi:10.2136/vzj2016.01.0010
Laudon, H., and Slaymaker, O. (1997). Hydrograph separation using stable isotopes, silica and electrical conductivity: an alpine example. J. Hydrol. 201, 82–101. doi:10.1016/S0022-1694(97)00030-9
Li, Q., Xing, Z., Danielescu, S., Li, S., Jiang, Y., and Meng, F. R. (2014a). Data requirements for using combined conductivity mass balance and recursive digital filter method to estimate groundwater recharge in a small watershed, New Brunswick, Canada. J. Hydrol. 511, 658–664. doi:10.1016/j.jhydrol.2014.01.073
Li, S., Yue, F., Liu, C., Ding, H., Zhao, Z., and Li, X. (2014b). The O and H isotope characteristics of water from major rivers in China. Chin. J. Geochem. 34, 28–37. doi:10.1007/s11631-014-0015-5
Li, X. F., Zhang, M. J., Ma, Q., Li, Y. J., and Wang, B. L. (2012). Characteristics of stable isotopes in precipitation over Northeast China and its water vapor sources. Environ. Sci. 33, 2924–2931. doi:10.13227/j.hjkx.2012.09.009
Li, Z., Li, Z., Qi, F., Zhang, B., Gao, W., Xue, J., et al. (2019). Runoff dominated by supra-permafrost water in the source region of the Yangtze River using environmental isotopes. J. Hydrol. 582, 124506. doi:10.1016/j.jhydrol.2019.124506
Liu, J., Fu, G., Song, X., Charles, S. P., Zhang, Y., and Wang, S. (2010). Stable isotopic compositions in Australian precipitation. J. Geophys. Res- Atmos. 115, D23307. doi:10.1029/2010JD014403
Marc, V., Didon-Lescot, J., and Michael, C. (2001). Investigation of the hydrological processes using chemical and isotopic tracers in a small Mediterranean forested catchment during autumn recharge. J. Hydrol. 247, 215–229. doi:10.1016/S0022-1694(01)00386-9
Mcdonnell, J. J., Bonell, M., Stewart, M. K., and Pearce, A. J. (1990). Deuterium variations in storm rainfall: implications for stream hydrograph separation. Water Resour. Res. 26, 455–458. doi:10.1029/WR026i003p00455
Mcguire, K. J., and Mcdonnell, J. J. (2010). Hydrological connectivity of hillslopes and streams: characteristic time scales and nonlinearities. Water Resour. Res. 46, W10543. doi:10.1029/2010WR009341
Meriano, M., Howard, K. W., and Eyles, N. (2011). The role of midsummer urban aquifer recharge in stormflow generation using isotopic and chemical hydrograph separation techniques. J. Hydrol. 396, 82–93. doi:10.1016/j.jhydrol.2010.10.041
Mueller, M. H., Alaoui, A., and Alewell, C. (2016). Water and solute dynamics during rainfall events in headwater catchments in the Central Swiss Alps under the influence of green alder shrubs and wetland soils. Ecohydrology 9, 950–963. doi:10.1002/eco.1692
Muñoz-Villers, L. E., Geissert, D. R., Holwerda, F., and McDonnell, J. J. (2016). Factors influencing stream baseflow transit times in tropical montane watersheds. Hydrol. Earth Syst. Sci. 20, 1621–1635. doi:10.5194/hess-20-1621-2016
Pan, Z., Sun, Z., Ma, R., Chang, Q., Hu, Y., Liu, Y., et al. (2018). Isotopic investigation of rainfall-runoff generation in an alpine catchment in headwater regions of heihe River,Northeast qinghai-tibet plateau. Earth Sci. 43, 4226–4236. doi:10.3799/dqkx.2018.552
Penna, D., Tromp-Van, M. H. J., Gobbi, A., Borga, M., and Dalla, F. G. (2011). The influence of soil moisture on threshold runoff generation processes in an alpine headwater catchment. Hydrol. Earth Syst. Sci. 15, 689–702. doi:10.5194/hess-15-689-2011
Penna, D., van Meerveld, H. J., Oliviero, O., Zuecco, G., Assendelft, R. S., Dalla Fontana, G., et al. (2015). Seasonal changes in runoff generation in a small forested mountain catchment. Hydrol. Process. 29, 2027–2042. doi:10.1002/hyp.10347
Penna, D., Van Meerveld, H. J., Zuecco, G., Fontana, G. D., and Borga, M. (2016). Hydrological response of an Alpine catchment to rainfall and snowmelt events. J. Hydrol. 537, 382–397. doi:10.1016/j.jhydrol.2016.03.040
Rogger, M., Chirico, G. B., Hausmann, H., Krainer, K., Brückl, E., Stadler, P., et al. (2017). Impact of mountain permafrost on flow path and runoff response in a high alpine catchment. Water Resour. Res. 53, 1288–1308. doi:10.1002/2016WR019341
Rozanski, K., Araguas-Araguas, L., and Gonfiantini, R. (1992). Relation between long-term trends of Oxygen-18 Isotope composition of precipitation and climate. Science 258, 981–985. doi:10.1126/science.258.5084.981
Rusjan, S., Sapač, K., Petrič, M., Lojen, S., and Bezak, N. (2019). Identifying the hydrological behavior of a complex karst system using stable isotopes. J. Hydrol. 577, 123956. doi:10.1016/j.jhydrol.2019.123956
Sánchez-Murillo, R., Birkel, C., Welsh, K., Esquivel-Hernández, G., Corrales-Salazar, J., Boll, J., et al. (2016). Key drivers controlling stable isotope variations in daily precipitation of Costa Rica: caribbean Sea versus Eastern Pacific Ocean moisture sources. Quat. Sci. Rev. 131, 250–261. doi:10.1016/j.quascirev.2015.08.028
Sanchez-Murillo, R., Brooks, E. S., Elliot, W. J., and Boll, J. (2015). Isotope hydrology and baseflow geochemistry in natural and human-altered watersheds in the Inland Pacific Northwest, USA. Isot. Environ. Heal. S. 51, 231–254. doi:10.1080/10256016.2015.1008468
Song, C., Wang, G., Liu, G., Mao, T., Sun, X., and Chen, X. (2017). Stable isotope variations of precipitation and streamflow reveal the young water fraction of a permafrost watershed. Hydrol. Process. 31 (4), 935–947. doi:10.1002/hyp.11077
Stockinger, M. P., Bogena, H. R., Lücke, A., Diekkrüger, B., Cornelissen, T., and Vereecken, H. (2016). Tracer sampling frequency influences estimates of young water fraction and streamwater transit time distribution. J. Hydrol. 541, 952–964. doi:10.1016/j.jhydrol.2016.08.007
Stockinger, M. P., Lücke, A., Vereecken, H., and Bogena, H. R. (2017). Accounting for seasonal isotopic patterns of forest canopy intercepted precipitation in streamflow modeling. J. Hydrol. 555, 31–40. doi:10.1016/j.jhydrol.2017.10.003
Sugimoto, A., Naito, D., Yanagisawa, N., Ichiyanagi, K., Kurita, N., Kubota, J., et al. (2003). Characteristics of soil moisture in permafrost observed in East Siberian taiga with stable isotopes of water. Hydrol. Process. 17, 1073–1092. doi:10.1002/hyp.1180
Tetzlaff, D., Seibert, J., and Soulsby, C. (2010). Inter-catchment comparison to assess the influence of topography and soils on catchment transit times in a geomorphic province; the Cairngorm mountains, Scotland. Hydrol. Process. 23, 1874–1886. doi:10.1002/hyp.7318
Throckmorton, H. M., Newman, B. D., Heikoop, J. M., Perkins, G. B., Feng, X., Graham, D. E., et al. (2016). Active layer hydrology in an arctic tundra ecosystem: quantifying water sources and cycling using water stable isotopes. Hydrol. Process. 30, 4972–4986. doi:10.1002/hyp.10883
Visser, A., Thaw, M., Deinhart, A., Bibby, R., Safeeq, M., Conklin, M., et al. (2019). Cosmogenic isotopes unravel the hydrochronology and water storage dynamics of the southern sierra critical zone. Water Resour. Res. 55, 1429–1450. doi:10.1029/2018WR023665
Wang, C., Zhao, C. Y., Zhonglin, X. U., Wang, Y., and Peng, H. (2013). Effect of vegetation on soil water retention and storage in a semi-arid alpine forest catchment. J. Arid. Land 5, 207–219. doi:10.1007/s40333-013-0151-5
Wang, G., Hu, H., and Li, T. (2009). The influence of freeze–thaw cycles of active soil layer on surface runoff in a permafrost watershed. J. Hydrol. 375, 438–449. doi:10.1016/j.jhydrol.2009.06.046
Wang, S. Y., Wang, Q. L., Wu, J. K., He, X. B., Hu, Z. F., Wang, L. H., et al. (2019). Characteristics of stable isotopes in precipitation and moisture sources in the headwaters of the Yangtze River. Huan Jing Ke Xue 40, 2615–2623. doi:10.13227/j.hjkx.201811140
Wolock, D. M., Fan, J., and Lawrence, G. B. (1997). Effects of basin size on low-flow stream chemistry and subsurface contact time in the Neversink River watershed, New York. Hydrol. Process. 11, 1273–1286. doi:10.1002/(sici)1099-1085(199707)11:9<1273::aid-hyp557>3.0.co;2-s
Woo, M. K., and Xiu, J. G. (2010). Hydrological connectivity and seasonal storage change of tundra ponds in a polar oasis environment, Canadian High Arctic. Permafr. Periglac. 17, 309–323. doi:10.1002/ppp.565
Yueqing, C., Peter, G., and Craig, T. (2016). Solute transport processes in flow-event-driven stream-aquifer interaction. J. Hydrol. 538, 363–373. doi:10.1016/j.jhydrol.2016.04.031
Zhang, R., Li, Q., Chow, T. L., Li, S., and Danielescu, S. (2012). Baseflow separation in a small watershed in New Brunswick, Canada, using a recursive digital filter calibrated with the conductivity mass balance method. Hydrol. Process. 27, 2659–2665. doi:10.1002/hyp.9417
Keywords: water age, streamflow component, permafrost region, isotope, mean transit time
Citation: Xiao X, Cai T and Duan L (2023) The age and sources of stream water in a boreal forest watershed in the permafrost region: a case study of a watershed in northeast China. Front. Earth Sci. 11:1225291. doi: 10.3389/feart.2023.1225291
Received: 22 May 2023; Accepted: 30 October 2023;
Published: 27 December 2023.
Edited by:
Gopal Krishan, National Institute of Hydrology (Roorkee), IndiaReviewed by:
Zhihua He, University of Saskatchewan, CanadaTirumalesh Keesari, Homi Bhabha National Institute, India
Girish Gopinath, Kerala University of Fisheries and Ocean Studies, India
Copyright © 2023 Xiao, Cai and Duan. This is an open-access article distributed under the terms of the Creative Commons Attribution License (CC BY). The use, distribution or reproduction in other forums is permitted, provided the original author(s) and the copyright owner(s) are credited and that the original publication in this journal is cited, in accordance with accepted academic practice. No use, distribution or reproduction is permitted which does not comply with these terms.
*Correspondence: Tijiu Cai, caitijiu1963@163.com; Liangliang Duan, liangliang.duan@nefu.edu.cn