Effect of wave disturbance on the fluid dynamics of the pump turbine in a seawater pumped storage hydroplant
 Jianyong Hu
 Qingbo Wang
 Hongge Song2,3
 - 1School of Geomatics and Municipal Engineering, Zhejiang University of Water Resources and Electric Power, Hangzhou, China
- 2Engineering Research Center of Digital Twin Basin of Zhejiang Province, Hangzhou, China
- 3College of Energy and Power Engineering, North China University of Water Resources and Hydropower, Zhengzhou, China
Compared with conventional pumped-storage hydroplants, seawater pumped-storage hydroplants are constructed in a complex marine environment. The wave disturbance may affect the safety operation of the pump turbine in the seawater pumped hydroplant via affecting the level of the free water surface. To explore the effect of wave disturbance on the operation of the pump turbine in a seawater pumped-storage hydroplant, assuming that the wave disturbance follows a sine function, on the basis of Airy’s micro-amplitude wave theory and the comprehensive characteristic curve of a pump turbine, we use sliding grid technology and the SST k–ω turbulence model to simulate the dynamics of fluid in a full-flow channel. In this study, the unsteady flow field, Q-criterion vorticity, relative pressure pulsation amplitude, and frequency of pressure pulsation are analyzed to determine the internal flow field and pressure pulsation under different wave disturbance conditions and operating loads. The results show that both the pressure pulsation in the pump turbine and its frequency domain are affected by the wave disturbance. In addition, the turbulent flow with a large flow rate tends to produce higher relative pressure pulsation under wave disturbance. Due to the large flow rate and strong static and dynamic interference in the vaneless area, the relative amplitude of the pressure pulsation is significantly affected by wave disturbance. Furthermore, the low-frequency pressure pulsation of the draft tube is superimposed with the wave disturbance frequency.
1 Introduction
A seawater pumped-storage hydroplant can not only form a stable power supply system with the support of wind and solar energy but also solve the water supply problems in ocean islands through seawater desalination. Compared with a conventional pumped-storage hydroplant, the lower reservoir of the seawater pumped-storage power station is constructed in a marine environment, whose operation is significantly affected by typhoons, extreme waves, and ocean currents (Fujihara et al., 1998; Ramos et al., 2014; Shi et al., 2015). The pump turbine is the core component of a pumped-storage hydroplant, and its hydraulic characteristics directly affect the safety operation of the pumped-storage hydroplant. Therefore, investigating the effect of wave disturbance on the fluid dynamics of the pump turbine is of significant importance for the management of the seawater pumped-storage hydroplant (Fernández et al., 2009; Yao et al., 2011).
Previous studies have demonstrated that the main factors affecting the hydraulic characteristics of a pump turbine include three parts: the dynamic and static interference, the rotating stall, and the vortex rope of the draft tube (Tanaka, 2011). The mechanism governing the dynamic and static interference is the periodic variation in the pressure and velocity of the flow channel due to the rotating turbine. Periodic changes are also present in the flow regime of the stationary guide vane zone. The dynamic and static interference is the periodic disturbances of the flow field between the rotor and the stationary guide vane. It may lead to high-amplitude pressure pulsations in the vaneless space (Xu et al., 2018). The rotating stall occurs mainly in the pump turbine under off-design pump conditions. With the decrease in the flow rate and increase in the impulse angle of the guide vane, serious flow separation occurs between the runner blades and backflow in the runner flow path gradually evolves into rotating stall masses. The stall mass also propagates downstream, causing more deliquescent vortices and secondary flows in the overflow components, such as the guide vanes and worm gear (Liu et al., 2015). The vortex rope of the draft tube often occurs when the operating conditions of the pump turbine deviate from the optimal operating conditions. In addition, the pressure pulsation caused by the vortex rope of the draft tube usually belongs to low-frequency pressure pulsation (Zhong et al., 2018). These unstable flows not only significantly reduce the pump turbine operating efficiency but also cause pump turbine fatigue damage and hydraulic resonance (Zuo and Liu., 2017).
In recent years, many research studies have been conducted on the characteristics of a pump turbine. Li et al. (2021) carried out non-constant numerical simulations of the “S"-zone operating condition of the medium specific-speed pump turbine model and found that the pressure pulsation increases gradually from the turbine operating condition to the braking condition. Under the turbine operating condition, the turbine backflow occurs mainly on the lower-ring side, while the runaway operating status backflow occurs mainly from the middle of the turbine to the lower-ring side. Under the braking condition, a rotational stall occurs, and the flow in the turbine has significant asymmetry. Hu et al. (2022) found that the pressure fluctuation is the highest in the vaneless space. Zhou et al. (2018) carried out a full-flow channel three-dimensional numerical simulation for the load rejection transition process of a pump turbine model. They found that during the load rejection transition, the rapid development of inlet reverse flow in the vane wheel increases the turbulent kinetic energy in the vaneless space, leading to dynamic and static interference between the guide vane and the vane wheel. Furthermore, the inlet reverse flow in the vane wheel led to an imbalance in the flow pattern distribution in the vane, which results in low-frequency rotational-stall pressure fluctuation. Ardizzon et al. (2016) simulated the low-frequency components caused by the rotating stall phenomenon at low flow rates and found that the draft tube flow-state change is significant when the operating load is small. The vortex rope rotation frequency is generally 1/3–1/5 of the rotation frequency (Wang et al., 2017; Yang et al., 2021). Guo et al. (2021) found that the smaller the guide vane opening, the more disordered the vortex generated in the mixed-flow turbine, thus affecting the efficient and stable operation of the turbine. Gao et al. (2021) explored the internal flow characteristics of the same tidal turbine with the guide vane opening of the crossflow unit, which showed that the rotating water flow in the draft tube at low pressure is not necessarily caused by the vortex rope. It may be caused by air masses and hydraulic imbalances at the runner outlet. Zhou et al. (2013) numerically simulated the operating characteristics of a low-head turbine by setting the inlet pressure varying cyclically. The runner speed was found to lag the inlet pressure by 1/4-cycle. By simulating the boundary conditions of the pump turbine load rejection transition process, Fu et al. (2018) found that the interstitial flow between the runner and the stationary components significantly affects the accurate simulation of the pulsating performance characteristics and non-constant vortex of the pump turbine. In addition, the effect of the interstitial flow becomes more severe when it moves closer to the low-flow conditions. Li et al. (2019) carried out numerical simulations of the full-flow channel for seven different guide vane openings of the pump turbine and found that when the guide vane opening is small, the morphology of the draft tube vortex rope is more obvious and reconfigured. When the guide vane opening is large, the circumferential velocity near the wall of the draft tube vortex rope is large, which is the main reason for turbulent kinetic energy loss at the wall of the straight cone section.
However, at present, the relevant research direction mainly focuses on the transition process and partial load operation of the pump turbine. There is a gap on investigating the operating conditions where the inlet and outlet pressures of the pump turbine vary periodically (Dewan et al., 2017; Nam et al., 2018; Zheng et al., 2018; Peng et al., 2020). Seawater pumped-storage hydroplants mainly use high-water-head and large-capacity vertical mixed-flow pump turbines, which are more likely to encounter hydraulic instability problems when the hydroplant is disturbed by high-amplitude periodic waves. The objective of this study is to investigate the flow field and pressure fluctuation in pump turbines so as to reveal how the periodic wave disturbances affect the hydraulic characteristics of the pump turbine under different operating loads. To explore the effect of wave disturbance on the operation of the pump turbine in a seawater pumped-storage hydroplant, assuming that the wave disturbance follows a sine function, on the basis of Airy’s micro-amplitude wave theory and the comprehensive characteristic curve of a pump turbine, we use sliding grid technology and the SST k–ω turbulence model to simulate the dynamics of fluid in a full-flow channel.
2 Mathematical details of the numerical scheme
2.1 Governing equations
For three-dimensional numerical simulation of unsteady flow in a pump turbine under wave disturbance, the governing equations involve the mass and momentum conservation equations.
The mass conservation equation is
The momentum conservation equation is
where
Previous studies have demonstrated the high accuracy and stability of the SST k–ω turbulence model in the numerical simulation of turbomachinery (Menter, 2009). The SST k–ω turbulence model has the advantages of both the k–ε model and k–ω model. It adopts different functions according to the characteristics of fluid at different regions; for instance, it uses the k–ω model for simulating fluid in the regions with a low Reynolds number near the side wall and uses the k–ε model for simulating fluid in the regions with a high Reynolds number in the central part of the flume, which makes it possible to simulate the characteristics of fluid under complex conditions. The SST k–ω turbulence model involves two transport equations, namely, the k-transport equation and the ω-transport equation.
The k-transport equation can be written as
The ω-transport equation can be written as
where
2.2 Airy’s micro-amplitude wave theory
Airy’s micro-amplitude wave theory is one of the most basic and widely used linearization theories to solve partial differential equations in wave problems (Janssen, 2008). It assumes that the wave amplitude is significantly smaller than the wavelength and water depth and considers the wave as a linearity wave. According to Airy’s micro-amplitude wave theory (Huang, 2011), the pressure p can be expressed by the linearized Bernoulli equation as follows:
Substituting the velocity of the micro-amplitude wave into Eq. 5, the pressure of a micro-amplitude wave can be expressed as
Eq. 6 shows that the pressure consists of two parts: the hydrostatic pressure and hydrodynamic pressure. Considering
we can obtain
where p is the pressure, ρ is the fluid density, ηk is the vertical distance between the instant free water surface and the average water surface,
2.3 Q-criterion vortex identification method
In this study, the Q-criterion (Lu et al., 2021) is used to identify the strength and structure of the vortex, which has high efficiency in vortex identification. The equation of the velocity gradient tensor is as follows:
where
where
3 Model development
3.1 Initial settings and grid division
Figure 1 shows the three-dimensional model of the pump turbine, which mainly includes five regions: spiral case, stay vanes, guide vanes, runner, and draft tube. The initial settings of the pump turbine are as follows: rated head H = 40 m, rated speed n = 760 r/min, rated flow Qr = 0.28 m3/s, runner inlet diameter D1 = 0.55 m, runner outlet diameter D2 = 0.25 m, number of runner blades Z = 7, number of stay vanes Zs = 20, and number of guide vanes Z0 = 20.
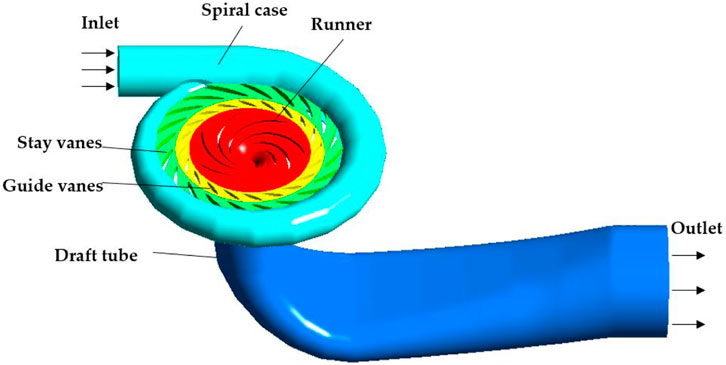
FIGURE 1. Three-dimensional model of the full-flow channel of the pump turbine.
Figure 2 shows the sketch of the grid division of the pump turbine. The grid division was conducted using Fluent Meshing software. To ensure the computing accuracy, unstructured grids are used to divide the model, and boundary-layer infilling is carried out on the walls of the runner blades, spiral case, and guide vanes. Considering the complexity of the flow pattern evolution in the runner, to accurately simulate the flow separation of the runner, the boundary-layer grid in the runner area is set with 18 layers with a minimum thickness of 0.02 mm, and the average y+ value of the whole runner wall is less than 5. To avoid the number of grids affecting the simulation results, the independence of the number of total grids to the Qr hydraulic turbine is verified (See Figure 3). When the number of grids is larger than 6 million, the calculation results tend to be stable. In addition, reducing the number of grids could decrease the calculation time. Here, the total number of grids is set to 7 million, and the minimum orthogonal quality of the grids is 0.3. Sliding grid technology is used to cope with the dynamic static interface of the runner, and data exchange is carried out between the calculation domains and the interface. The equations for calculating the head and efficiency of the turbine are shown in Eq. 12 and Eq. 13, respectively.
where
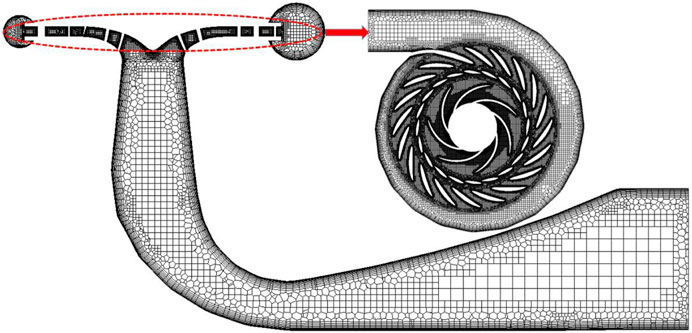
FIGURE 2. Grid division of the full-flow channel of the pump turbine.

FIGURE 3. Variation in the mesh number to the head and the efficiency of the turbine.
The operating point is determined based on the characteristic curve and similarity criterion of the pump turbine. As shown in Figure 4, this study provides insights into the working condition of the first quadrant of the pump turbine. Under the condition of rated head H = 40 m, the flow rate is adjusted by changing the guide vane opening so as to obtain different loads and outputs. As wind energy and solar energy are unstable and intermittent, it is necessary to operate the pumped-storage units under unbalanced load conditions to balance the power grid parameters. In order to compare the influence of wave disturbance on the operating status of the pump under different operating loads, this study selects three levels of guide vane openings, namely, small opening α0 = 6°, medium opening α0 = 15°, and rated opening α0 = 24°. The corresponding flows are 0.3 Qr, 0.7 Qr, and rated flow Qr, respectively.
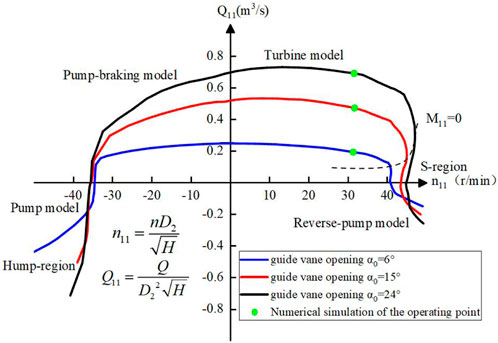
FIGURE 4. Characteristic curve of the pump turbine and the operating point of the numerical simulation.
For the wave disturbance, we select the characteristics of waves near an island in the East China Sea during the last 10 years as an example. To simplify the complexity of natural waves and quantify the effect of each influencing factor of natural waves, we assume the wave as a regular wave based on the characteristics of natural waves rather than using monitoring data of natural waves directly. According to the micro-amplitude wave theory, hydrostatic pressure and hydrodynamic pressure can be considered following sine or cosine functions. That is, the waveform basically follows a sine function, the maximum effective wave height is 10 m, and the wave period is 6 s (Yu et al., 2020). According to the relevant literature (Nanjing Hydraulic Research Institute, 2002), the pressure scale and frequency scale can be expressed as follows:
where
After a scale conversion between the modeled wave and real wave, the tail water level disturbance caused by wave disturbance in the pump turbine model is
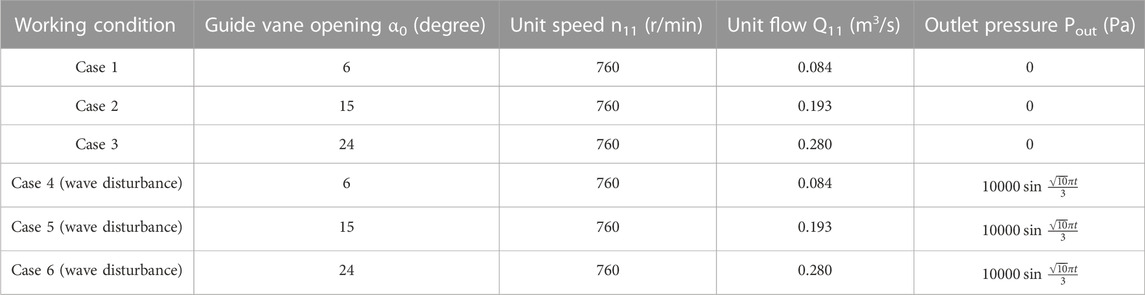
TABLE 1. Initial settings of the selected working conditions.
3.2 Boundary conditions and layout of monitoring points
In this study, Fluent 2020 R2 was used in numerical simulation. The boundary conditions of the proposed model are as follows: the spiral case inlet is set as the mass flow inlet, and the draft tube outlet is set as the pressure outlet. Based on the coupling of pressure and velocity, the SIMPLEC algorithm is used for steady calculation, and the PISO algorithm is used for unsteady calculation. The second-order upwind format is used to discretize the momentum and turbulent kinetic energy dissipation rate. All over-current components are connected through an interface. The solid wall is set as a non-slip wall condition, and the residual convergence accuracy is set to 10−5.
We first assume that the fluid has a steady flow and the result of steady-flow calculation is the initial conditions of the model. The rotating speed of the runner is 760 r/min, and the fixed time step is set to 6.579×10⁻⁴ s (rotate 3° for each time step). The maximum number of iteration steps is set to 500, and the iterative convergence is stable in 50 steps. For the situation without wave disturbance, 15 rotor rotation periods are calculated. A total of 10 rotor rotation periods are calculated for analyzing the dynamics of fluid after being stable. Under the situation with the wave disturbance, two wave disturbance periods are calculated, and the results of the second wave disturbance period are analyzed.
In order to explore how the pressure pulsation varies with the flow field in the pump turbine, monitoring points are arranged every 45° in the circumferential direction of the axial cross section of the spiral case, every 30° in the vaneless space between the guide vane and the runner, and every 0.1 m in the center of the axial plane of the draft tube. The sketch of the positions of the monitoring points is shown in Figure 5.
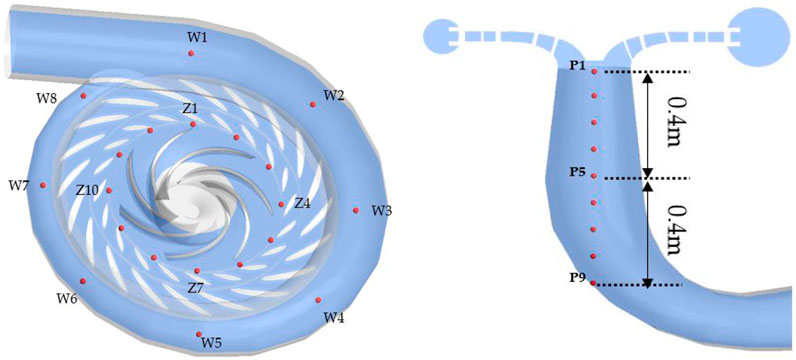
FIGURE 5. Sketch of the positions of the monitoring points in the pump turbine.
4 Results and discussion
4.1 Variation in internal flow characteristics of the pump turbine
Figure 6 shows the streamline in the guide vanes, runner, and draft tube under different operating conditions without wave disturbance. The velocity triangle corresponds to the position of the red dot in the streamline diagram, where U is the circumferential velocity, W is the relative velocity, and V is the absolute velocity. Figure 7 shows the vortex distribution in the draft tube under different operating conditions without wave disturbance.
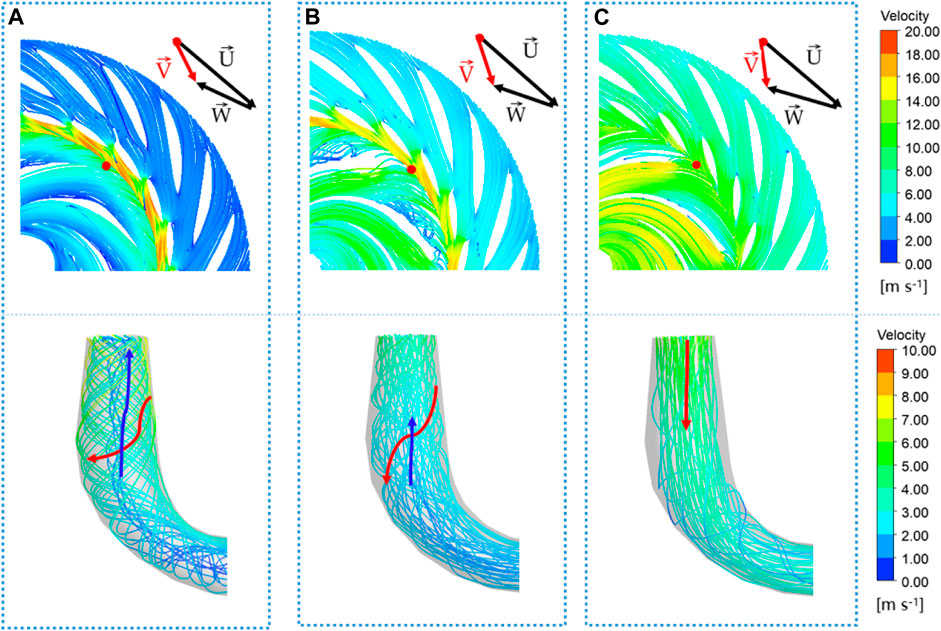
FIGURE 6. Streamline in the guide vanes, runner, and draft tube under different operating conditions without wave disturbance: (A) Case 1, 0.3 Qr; (B) Case 2, 0.7 Qr; and (C) Case 3, Qr.
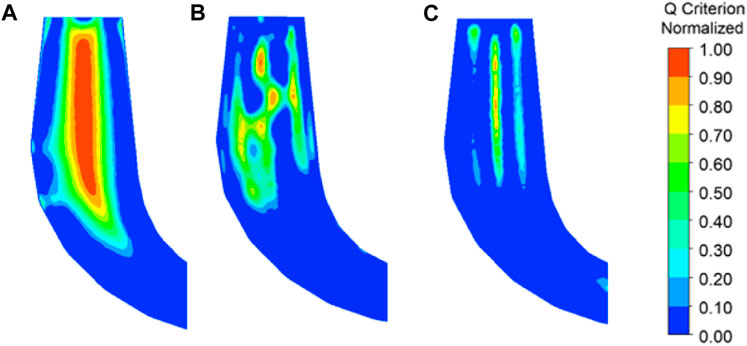
FIGURE 7. Vorticity of the draft tube under different operating conditions without wave disturbance: (A) Case 1, 0.3 Qr; (B) Case 2, 0.7 Qr; and (C) Case 3, Qr.
As shown in Figure 6A and Figure 7A, under the operating condition of 0.3 Qr, due to the small inlet flow and velocity, the inlet attack angle of the runner is large, and the water flow forms a high-speed water-retaining ring under the influence of the static and dynamic interference when it flows through the vaneless space. The generation of the high-speed water-retaining ring makes the fluid that should have flowed into the original runner rotate at high-speed flow into other runners. At this time, the circumferential velocity of the water flow on the inner wall of the draft tube is important, a rotating downward-flow state is formed on the wall of the draft tube, and a large amount of backflow is generated along the axial direction of the draft tube center. This flow state creates a high-intensity spiral vortex that almost fills the straight cone section of the draft tube. A high level of vortex in the draft tube may lead to hydraulic resonance. Therefore, the low-load operating condition should be avoided during the operation of the turbine.
As shown in Figure 6B and Figure 7B, under the operating condition of 0.7 Qr, with the increase in the guide vane opening, the high-speed water ring in the vaneless space obviously weakens, and the maximum velocity decreases obviously, which is obviously improved compared with the low-flow operating condition. However, as the water flow at the inlet of the runner cannot maintain the best angle with the runner blades, the vortex and backflow remain on the water-facing surface of the runner blades. Although the water flow in the draft tube is inclined to the axial direction, it still maintains a large circumferential velocity component, and the flow field at the bottom of the straight cone section of the draft tube is chaotic. A significant vortex is observed, while the strength of the vortex is reduced.
As shown in Figure 6C and Figure 7C, under the operating load of Qr, the water flow rate is increased, and the velocity of the fluid between the guide vane and the runner is uniform. There is no high-speed water ring in the vaneless space. In addition, the water enters the runner evenly and stably. The streamline in the draft tube is modeled with mainly axial flow, with a small circumferential velocity component. A small draft tube vortex area and low vortex strength are observed, which means that the unit runs smoothly under this operating condition.
Figure 8 shows pressure distribution in the pump turbine without wave disturbance under different operating conditions. The pressure in each working condition gradually decreases from the spiral case to the runner in the centripetal direction. In addition, the pressure gradient changes in the vaneless space. With the increase in the opening of the guide vane, the variation in pressure in the vaneless space gradually becomes stable. As the blades of the runner convert the kinetic energy of the water flow into the rotating mechanical energy of the runner, the pressure gradient in the runner is obvious, and the pressure on the water surface of the blade is generally higher than that on the back surface. The pressure on the waterfront surface of the blade is generally higher than that on the back surface, and the blade pressure gradually decreases from the inlet to the outlet, forming a negative pressure area at the blade outlet. The influence of the guide vane opening on the surface pressure of the blade is obviously less than that under the operating condition of a large opening. Under the operating condition of 0.3 Qr, as the flow rate is low and the circumferential speed is high, the water flow clings to the draft tube wall in a rotating downward-flow state. The maximum pressure area can be observed on both sides of the draft tube inlet wall, and the straight tapered section of the draft tube presents an obvious conical pressure gradient. With the increase in the guide vane opening, the flow rate increases, the conical pressure gradient of the draft tube gradually stabilizes, and both sides of the draft tube inlet wall become the minimum pressure area.
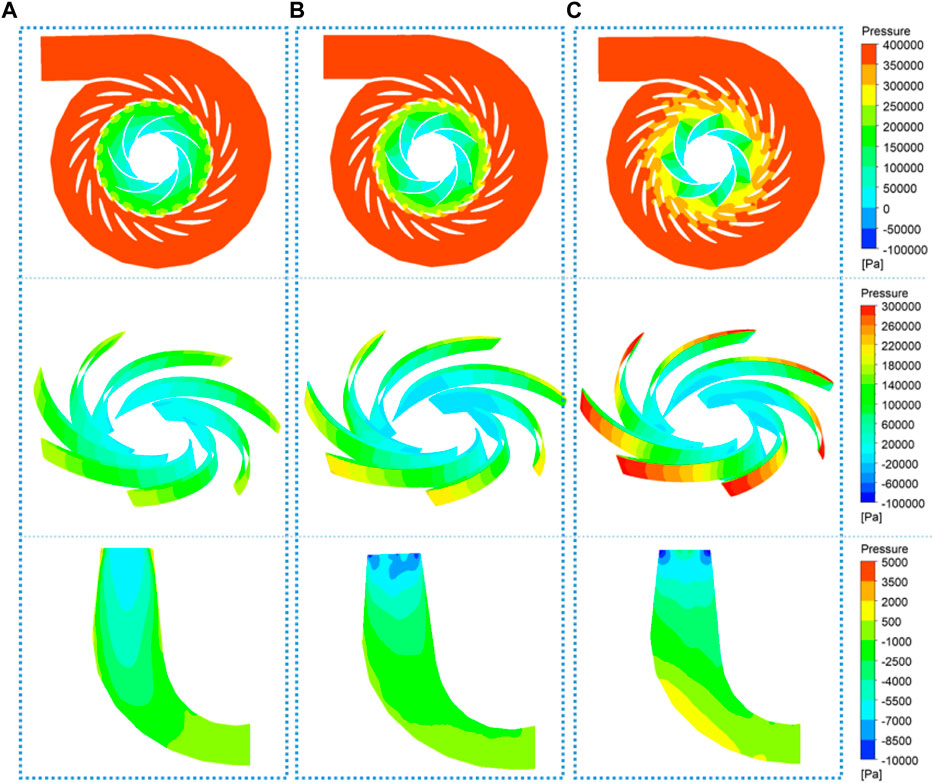
FIGURE 8. Pressure distribution of the pump turbine under different operating conditions without wave disturbance: (A) Case 1, 0.3 Qr; (B) Case 2, 0.7 Qr; and (C) Case 3, Qr.
Figure 9, Figure 10, and Figure 11 show the influence of wave disturbance on the internal flow pattern of the pump turbine under the operating condition of Qr, allowing us to analyze the streamline, pressure, and vortex of the draft tube in channels with wave disturbance. The effect of wave disturbance on the water head is relatively small. Furthermore, the wave disturbance has no obvious influence on the flow direction, velocity, and vortex distribution of the draft tube. However, the pressure at different times is obviously different. The maximum pressure occurs at T/4 and the minimum pressure occurs at 3 T/4, which confirms the sinusoidal functions of wave disturbance. Therefore, the wave disturbance only affects the pressure in the pump turbine. Its influence on the streamline, draft tube vortex rope, and pressure distribution can be neglected.
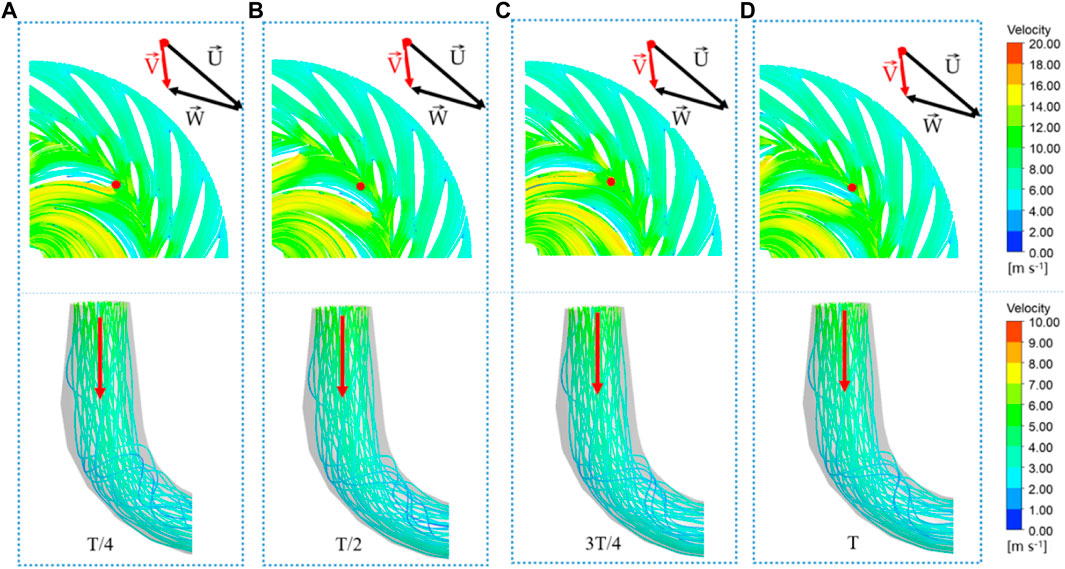
FIGURE 9. Streamline of guide vanes, runner, and draft tube under the operating condition of Qr with wave disturbance: (A) T/4, (B) T/2, (C) 3T/4, and (D) T.
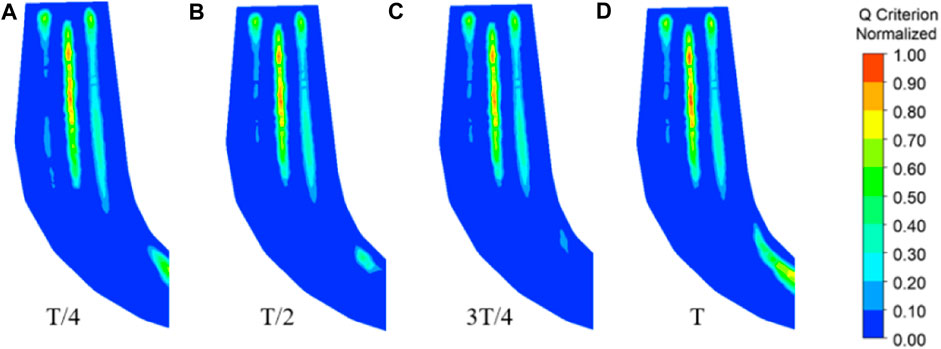
FIGURE 10. Vorticity of the draft tube under the operating condition of Qr with wave disturbance: (A) T/4, (B) T/2, (C) 3T/4, and (D) T.
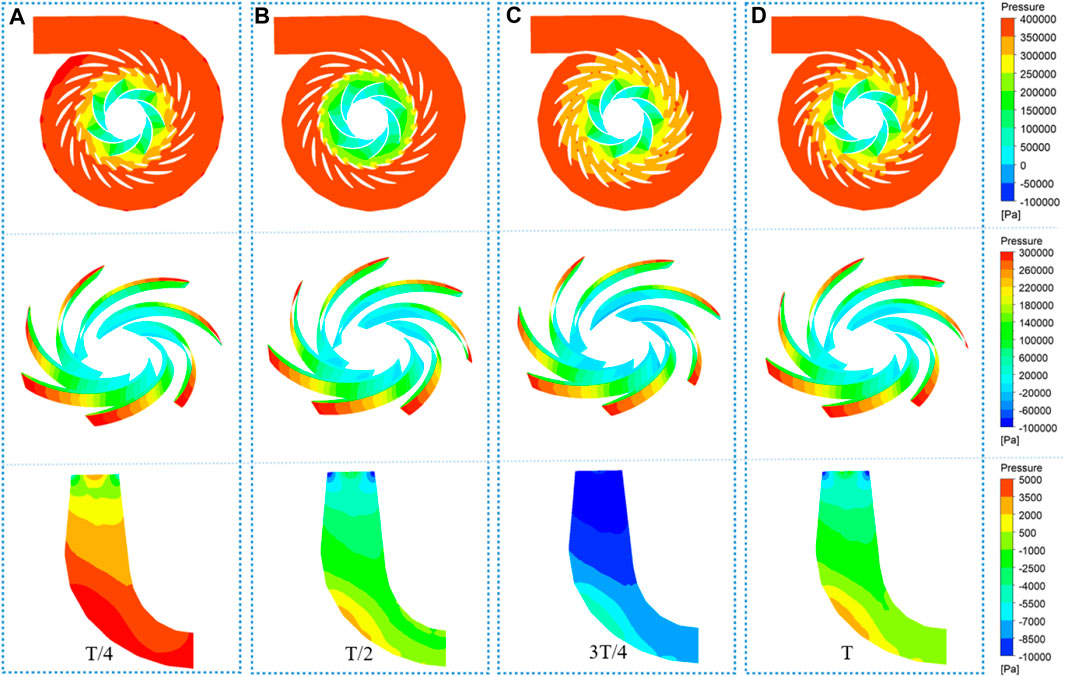
FIGURE 11. Pressure distribution of the pump turbine under the operating condition of Qr with wave disturbance: (A) T/4, (B) T/2, (C) 3T/4, and (D) T.
4.2 Quantitative analysis of the pressure pulsation
To analyze the main characteristics of the pressure pulsation, two dimensionless numbers, the relative pressure pulsation amplitude
where ΔH is the peak value of pressure pulsation, H is the water head,
Figure 12 shows the relative pressure pulsation at the monitoring points in the spiral case. For the condition without wave disturbance, the relative pressure pulsation amplitude increases with the increase in load, and the maximum value of Qr is 1.40% under the rated working condition. For the condition with wave disturbance, the relative pressure pulsation amplitude of each working condition generally increases. However, the 0.7-Qr working condition is affected by wave disturbance, and its relative pressure pulsation amplitude is almost the same as the rated working condition, which means that the relative pressure pulsation amplitude is related not only to the flow rate but also to the turbulent flow pattern.
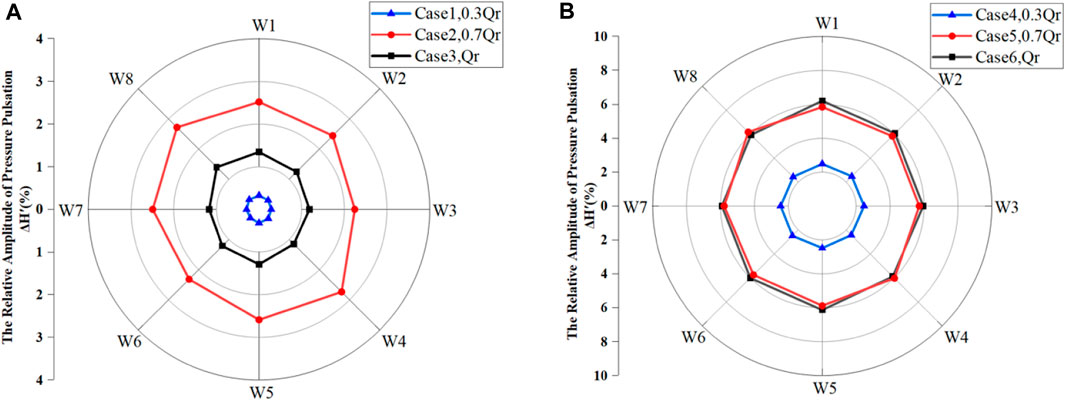
FIGURE 12. Relative pressure pulsation amplitude at the monitoring points in the spiral case: (A) without wave disturbance; (B) with wave disturbance.
Figure 13 shows the relative pressure pulsation amplitude at the monitoring points in the vaneless space. With the strong dynamic and static interference caused by the rotation of the runner blades, the relative pressure pulsation amplitude of the measuring points in the vaneless space is higher than that in other areas. For the condition without wave disturbance, the relative pressure pulsation amplitude increases with the increase in the load, and the maximum value is 16.55% under the rated working condition Qr. For the condition with the wave disturbance, the relative pressure pulsation amplitude of each working condition generally increases, and the maximum value is 21.93% under the 0.7-Qr working condition. However, due to the large relative pressure pulsation amplitude of the vaneless space under the large-flow working condition, the amplitude variation caused by wave disturbance is not significant under the rated working condition Qr. Under the 0.7-Qr working condition, part of the fluid flows with a high-speed water-retaining ring in the vaneless space, and the flow field is turbulent, which means that the pressure pulsation is obviously affected by wave disturbance.
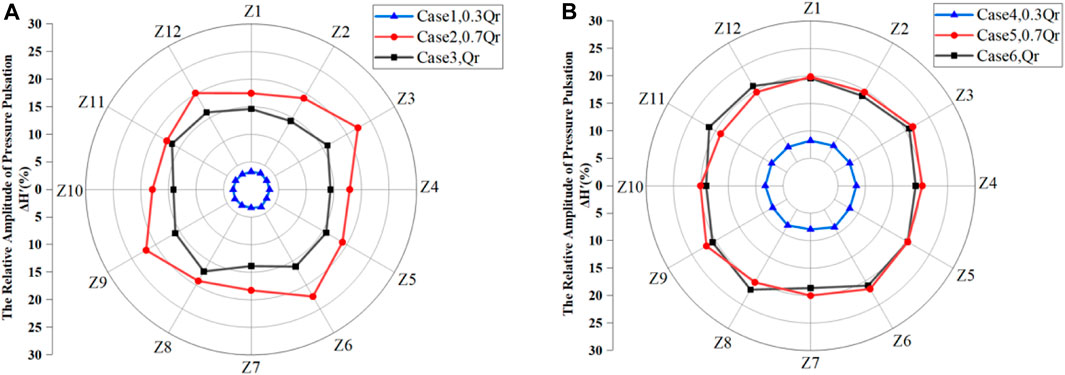
FIGURE 13. Relative pressure pulsation amplitude of the monitoring points in the vaneless space: (A) without wave disturbance; (B) with wave disturbance.
Figures 14A, B show the relative pressure pulsation amplitude at the monitoring points in the draft tube for the conditions without and with wave disturbance, respectively. Compared with other areas, the relative pressure pulsation amplitude in this area is the smallest. For the situation without wave disturbance, the relative pressure pulsation amplitude in this area is related not only to the load but also to the strength of the eccentric vortex in the draft tube. The relative pressure pulsation amplitude has a positive correlation with the strength of the eccentric vortex in the draft tube, so the maximum relative amplitude of pressure pulsation is observed at the P4 measuring point with a value of 0.75% under the working condition of 0.7 Qr. For the situation with wave disturbance, the relative amplitude of the pressure pulsation increases with the increase in load under different operating conditions, which shows that the eccentric vortex intensity of the draft tube is the main factor affecting the relative amplitude of the pressure pulsation for the case without wave disturbance.
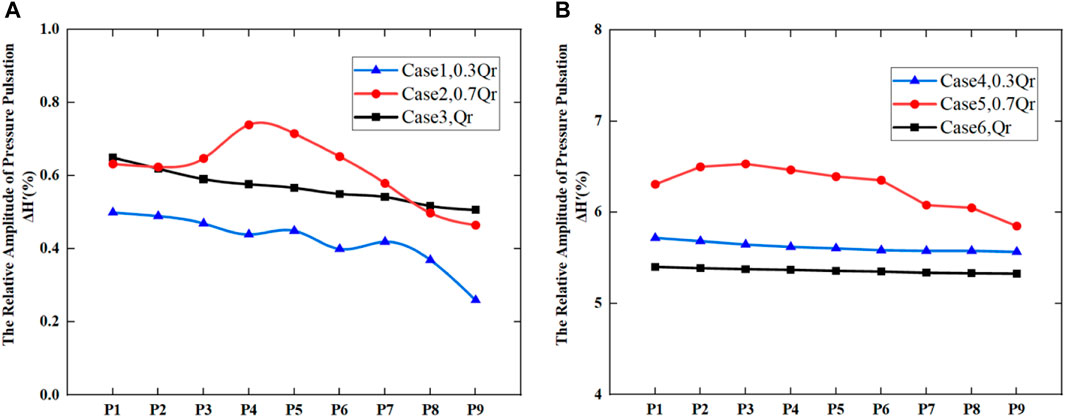
FIGURE 14. Relative pressure pulsation amplitude at the monitoring points in the draft tube: (A) without wave disturbance; (B) with wave disturbance.
4.3 The frequency domain of pressure pulsation
As the frequency domain of the pressure pulsation at the monitoring points in the same area is highly similar, the representative monitoring points are selected for analyzing the frequency domain of the pressure pulsation, based on the internal flow characteristics of the pump turbine and the relative amplitude of the pressure pulsation. The W1 monitoring point is selected in the spiral case, and the Z1 monitoring point is selected in the vaneless space. Due to the influence of the vortex rope on the draft tube, the draft tube flow pattern changes are more complicated, and the relative amplitude of the pressure pulsation is more obviously affected by the wave disturbance. Three representative monitoring points, P1 at the draft tube inlet, P5 at the center of the straight cone section, and P9 at the bottom of the elbow section, are selected to analyze the pressure fluctuation in the frequency domain.
Figure 15 shows the relationship between the pressure pulsation factor and the frequency domain at monitoring point W1 in the spiral case area. fn is the frequency conversion factor of the runner (approximately 12.7 Hz), and 0.04 fn is the wave disturbance frequency (approximately 0.527 Hz). For the situation without wave disturbance, the pressure pulsation increases with the increase in load. This is because the frequency components are complicated and numerous, and there are more low-frequency and high-amplitude pressure pulsations under the operating condition of 0.7 Qr (Case 2). For the situation with wave disturbance, the pressure pulsation has an additional wave disturbance frequency. However, the other main frequency characteristics did not change obviously. Thus, we only analyze the main frequency components under the wave disturbance (see Figure 15B). Here, the frequency of the wave disturbance is 0.04 fn, which is caused by the wave pressure propagating from the downstream to the spiral case. Furthermore, the blade frequencies 7 fn, 14 fn, and 21 fn and their multiples are mainly caused by static and dynamic interference. However, under different loads, the alternating hydraulic components acting on the runner blades are different, resulting in different amplitudes of pressure pulsation. In general, with the increase in the load, the frequency of the pressure pulsation increases. Moreover, 20 fn is the number of guide vanes multiplied by the rotation frequency. This frequency type is mainly affected by the thickness of the guide vanes and the runner blades crowding out the water flow. Thus, the water flow pressure fluctuates periodically, which is particularly obvious under the light-load condition (Cases 1 and 4). Due to the high flow rate and the influence of the high-speed water-retaining ring on the vaneless space under the working condition of Cases 2 and 5, there are more vortices and secondary flows in the spiral case area, resulting in more high-amplitude pressure pulsations similar to 3.5 fn.
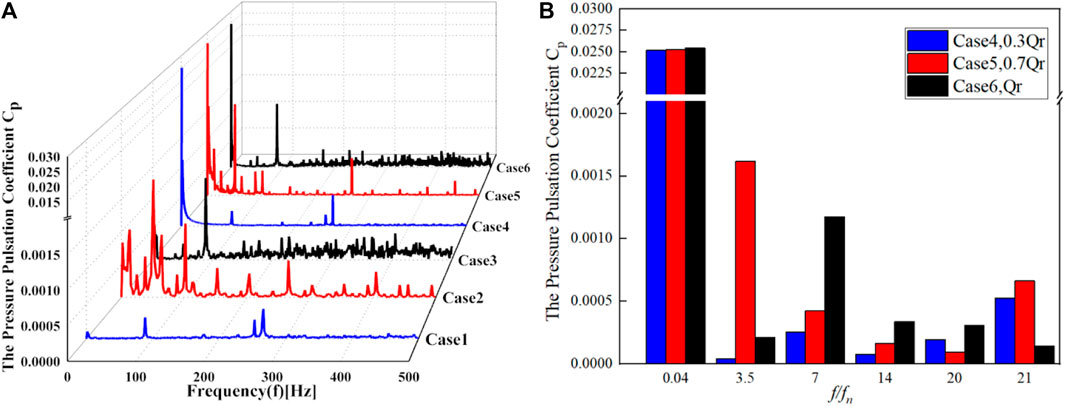
FIGURE 15. Variation in the pressure pulsation coefficient to (A) the frequency and (B) main frequency types under different operating conditions at the W1 monitoring point in the spiral case.
Figure 16A shows the frequency domain results of pressure pulsation at monitoring point Z1 in the vaneless space, and Figure 16B shows the main frequency components of pressure pulsation under wave disturbance at this monitoring point. The pressure pulsation amplitude in the vaneless space is high, mostly due to the blade frequency and its frequency multiples, indicating that the pressure pulsation in the vaneless space is mainly caused by static and dynamic interference, and the higher the load, the higher the pressure pulsation amplitude caused by the static and dynamic interference. At 0.7 Qr (Cases 2 and 5), there are many low-frequency and high-amplitude pressure pulsations; however, the other conditions do not appear, indicating that the occurrence of low-frequency and high-amplitude pressure pulsations in the vaneless space is related to the chaotic flow pattern. Due to the large pressure pulsation caused by the static and dynamic interference in the vaneless space, the main frequencies of the other two working conditions have not changed under the wave disturbance, except for the low load 0.3 Qr (Cases 1 and 4), which is still 7 fn.
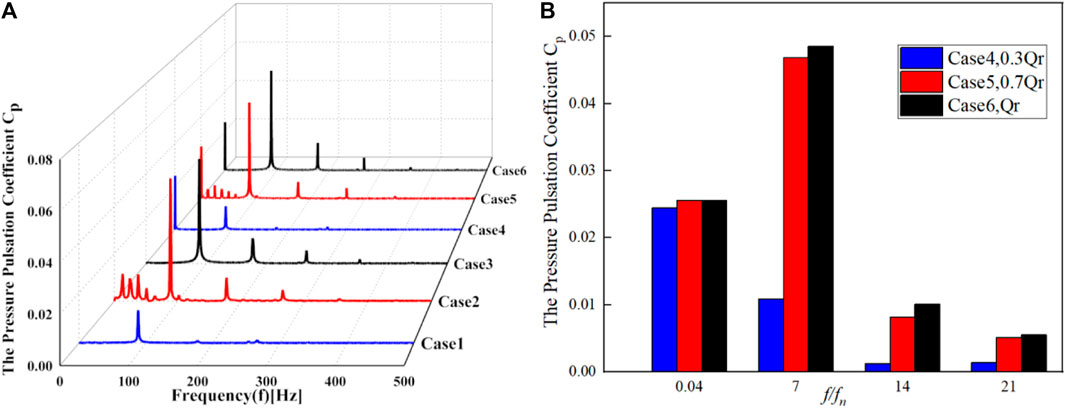
FIGURE 16. Variation in the pressure pulsation coefficient to (A) the frequency and (B) main frequency types under different operating conditions at the Z1 monitoring point in the spiral case.
Figure 17 shows the variation in the pressure pulsation coefficient to the frequency at the monitoring points P1, P5, and P9 in the draft tube. Due to the low-frequency and high-amplitude characteristics of the pressure pulsation in the draft tube, the pressure pulsation under wave disturbance is superimposed with the original pressure pulsation in the draft tube, resulting in more low-frequency and high-amplitude pressure pulsation. Therefore, the main frequency components for the two cases with and without wave disturbance are analyzed, respectively.
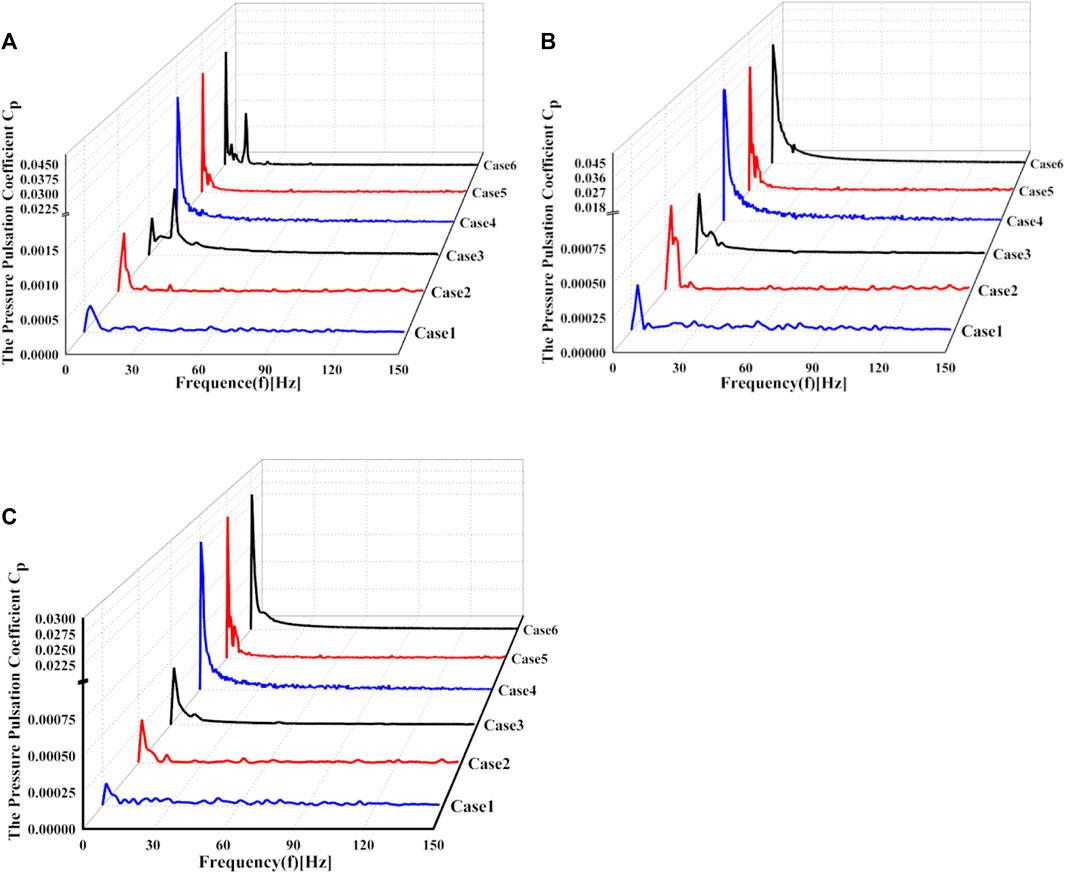
FIGURE 17. Variation in the pressure pulsation coefficient to frequency at (A) P1, (B) P5, and (C) P9 monitoring points.
Figures 18A, C, E show the main frequency components of pressure pulsation in the draft tube without wave disturbance. There is a large amplitude of pressure pulsation of 0.11 fn for all operating conditions. As a similar unsteady pressure phenomenon, many scholars have confirmed that the main frequency of the draft tube pressure pulsation of the pump turbine is approximately 0.11 fn. Under the working conditions of 0.3 Qr (Case 1) and 0.7 Qr (Case 2), the upstream monitoring points P1 and P5 have a maximum amplitude of pressure pulsation at 0.23 fn. However, under the working conditions of Qr (Case 3), the pressure amplitude corresponds to 0.23 fn, and the rotation frequency of the vortex rope is generally 1/3–1/5 of the rotation frequency, so 0.23 fn is the main frequency of the draft tube vortex rope. The runner rotating frequency is 1 fn, which is caused by the hydraulic imbalance in the runner components. This pressure pulsation has an impact on the whole draft tube. The closer to the runner, the higher the amplitude of pressure pulsation of 1 fn, and the frequency of the maximum pressure amplitude at P1 point at the draft tube inlet is 1 fn. For the frequency of 2 fn, this type of frequency is formed by the vortex and secondary flow passing through the runner, and its corresponding amplitude of pressure pulsation is small.
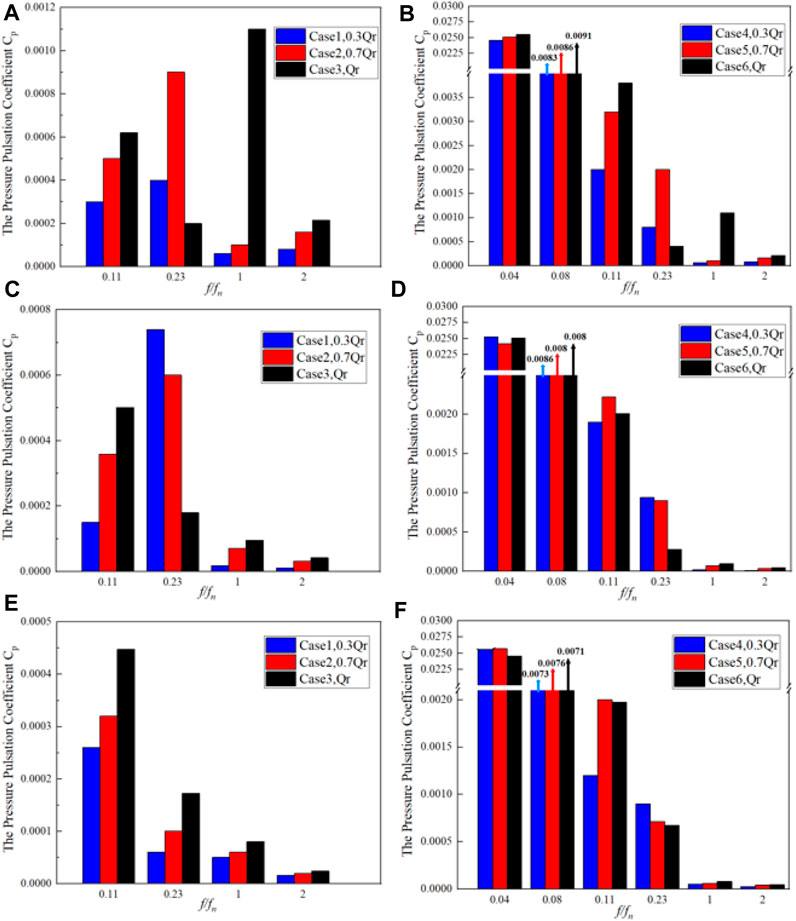
FIGURE 18. Variation in the pressure pulsation coefficient to the main frequency types at P1, P5, and P9 monitoring points under different operating conditions: (A) P1, without wave disturbance; (B) P1, with wave disturbance; (C) P5, without wave disturbance; (D) P5, with wave disturbance; (E) P9, without wave disturbance; and (F) P9, with wave disturbance.
Figures 18B, D, F show the main frequency components of pressure pulsation for the condition with wave disturbance. Under the working conditions of 0.3 Qr (Case 4) and 0.7 Qr (Case 5), the main frequency of the draft tube vortex rope is 0.23 fn, and the pressure pulsation amplitude is still high. As the monitoring point P1 is close to the runner, it is influenced by the dynamic and static interference of the runner. Hence, it has a high-pressure amplitude at the rotating frequency of 1 fn. Compared with the condition without wave disturbance, the main frequency of the pressure pulsation at each monitoring point is close to 0.527 Hz, which is the frequency of the wave disturbance. In addition, there are several high-amplitude pressure pulsations with a frequency doubling of 0.527 Hz, such as 0.08 fn. In this case, the frequency is superimposed with the original low-frequency pressure pulsation of the draft tube. Therefore, the frequency spectrum of the pressure pulsation becomes complicated. The amplitude of the high-frequency pressure pulsation above 1 fn shows no obvious variation, but the pressure amplitudes of 0.11 fn and 0.23 fn generally increase by 2–15 times. The wave disturbance has an impact on the low-frequency pressure pulsation of the draft tube.
5 Conclusion
Taking the characteristics of waves in an island in the East China Sea as an example, we carried out a numerical simulation of a pump turbine with and without wave disturbance based on the micro-amplitude wave theory and the characteristic curve of the pump turbine. The hydraulic stability of the pump turbine under three different operating conditions was compared and analyzed. The main conclusions are as follows.
(1) For the internal dynamics of the pump turbine, the high-speed water-retaining ring in the vaneless space and the strength of the draft tube vortex rope are mainly related to the inlet flow. With the inlet flow approaching the rated flow, the high-speed water-retaining ring in the vaneless space gradually disappears, and the strength of the draft tube vortex gradually decreases. With the wave disturbance, the variation in the pressure depends on the wave disturbance.
(2) For the relative pressure pulsation, the maximum value of rated working condition Qr in the vaneless space is 16.55% for the case without wave disturbance, and the maximum value of 0.7 Qr in the vaneless space is 21.93% for the case with wave disturbance. The turbulent flow with a large flow rate tends to produce a higher relative pressure pulsation for the case with wave disturbance than for the case without wave disturbance. Under the working condition of 0.7 Qr, due to the large flow and the strong static and dynamic interference in the vaneless space, the relative pressure pulsation is mostly affected by wave disturbance. For the case with wave disturbance, the strength of the eccentric vortex of the draft tube is the main factor affecting the relative pressure pulsation.
(3) For the frequency variation in the pressure pulsation, the main frequencies of the spiral case and vaneless space are the runner rotating frequency of 1 fn, the blade frequency and its frequency multiples of 7 fn, 14 fn, and 21 fn, and the secondary flow frequency of 3.5 fn. The draft tube exhibits typical characteristics of low frequency and high amplitude, with the main frequencies of the draft tube being 0.11 fn, the draft tube vortex rope being 0.23 fn, and the runner rotating frequency being 1 fn. Under the wave disturbance conditions, due to the superposition of the low-frequency pressure pulsation in the draft tube and the frequency doubling of the wave disturbance, the frequency spectrum of the pressure pulsation becomes complicated, and the amplitude of the low-frequency pressure generally increases by 2–15 times.
Data availability statement
The original contributions presented in the study are included in the article/Supplementary Material; further inquiries can be directed to the corresponding author.
Author contributions
Conceptualization: JH, QW, and JM; methodology: JH, QW, and JM; writing—original draft: JH and QW; writing—review and editing: JH, HS, and JM; supervision: HS; project administration: HS; funding acquisition: JH. All authors contributed to the article and approved the submitted version.
Funding
This work was supported by the Joint Funds of the Zhejiang Provincial Natural Science Foundation of China (No. LZJWZ22E090004).
Acknowledgments
The authors thank the reviewers for their constructive comments and suggestions.
Conflict of interest
The authors declare that the research was conducted in the absence of any commercial or financial relationships that could be construed as a potential conflict of interest.
Publisher’s note
All claims expressed in this article are solely those of the authors and do not necessarily represent those of their affiliated organizations, or those of the publisher, the editors, and the reviewers. Any product that may be evaluated in this article, or claim that may be made by its manufacturer, is not guaranteed or endorsed by the publisher.
References
Ardizzon, G., Giovanna, C., Covi, A., and Giorgio, P. (2016). Analysis of the unstable behavior of a pump-turbine in turbine mode: Fluid-dynamical and spectral characterization of the S-shape characteristic. J. Fluids Eng. 138 (2), 021105. doi:10.1115/1.4031368
Dewan, Y., Custer, C., and Ivashchenko, A. (2017). Simulation of the francis-99 hydro turbine during steady and transient operation. J. Phys. Conf. 782 (1), 012003. doi:10.1088/1742-6596/782/1/012003
Fernández Oro, J. M., González, J., Argüelles Díaz, K. M., and Guerras Colón, F. I. “Deterministic interaction between the impeller flow and both the inlet and outlet volute tongues for a double suction centrifugal pump,” in Proceedings of the ASME Fluids Engineering Division Summer Conference 2009, Vail, Colorado USA, August 2009.
Fu, X., Li, D., Wang, H., Zhang, G., Li, Z., and Wei, X. (2018). Influence of the clearance flow on the load rejection process in a pump-turbine. Renew. Energy 127, 310–321. doi:10.1016/j.renene.2018.04.054
Fujihara, T., Imano, H., and Oshima, K. (1998). Development of pump turbine for seawater pumped-storage power plant. Hitachi Rev. 47 (5), 199–202. doi:10.1061/40440(1999)67
Gao, X. (2019). Study of flow characteristics of draft tube of tidal power station. Eng. J. Wuhan. Univ. 52 (7), 594–599. doi:10.14188/j.1671-8844.2019-07-005
Guo, T., Xu, L., and Wang, W. (2021). Influence of upstream disturbances on the vortex structure of francis turbine based on the criteria of identification of various vortexes. Energies 14, 7626. doi:10.3390/en14227626
Hu, D. L., Cheng, Y. G., Zhang, P. C., Wang, X., Ding, J. H., and Zhang, X. X. (2022). Distribution features of flow patterns and pressure pulsations of pump-turbine in five operating modes on the four-quadrant plane. Front. Energy. Res. 10. doi:10.3389/FENRG.2022.880293
Huang, D. B. (2011). Fundamentals of water wave theory. Beijing, China: National Defense Industry Press.
Janssen, P. (2008). Progress in ocean wave forecasting. J. Com. Phy. 227 (7), 3572–3594. doi:10.1016/j.jcp.2007.04.029
Li, J. H., Zhang, W. W., Zhu, B. S., Li, Z. G., and Zhang, F. (2021). Study on pressure pulsation in vaneless space of pump turbine. J. Eng. Therm. 42 (5), 1213–1223.
Li, Q. F., Zhao, C. B., Long, S. C., and Quan, H. (2019). Study on the evolution of draft tube vortex rope under the runaway condition of pump turbine. Vib. Impact 38 (4), 222–228. doi:10.13465/j.cnki.jvs.2019.04.033
Liu, T., Zhang, Y. N., and Du, X. Z. (2015). Antibacterial effects and action modes of asiatic acid. J. Hydro. Power. 34 (11), 16–24. doi:10.7603/s40681-015-0016-7
Lu, J., Qian, Z., and Lee, Y. H. (2021). Numerical investigation of unsteady characteristics of a pump turbine under runaway condition. Renew. Energy. 169, 905–924. doi:10.1016/j.renene.2021.01.063
Menter, F. R. (2009). Review of the shear-stress transport turbulence model experience from an industrial perspective. Int. J. Com. Fl. Dyn. 23 (4), 305–316. doi:10.1080/10618560902773387
Nam, M. C., De, C. B., Yue, X. G., and Jin, M. R. (2018). Design optimization of hydraulic turbine draft tube based on CFD and DOE method. Environ. Sci. 136, 012019. doi:10.1088/1755-1315/136/1/012019
Nanjing Hydraulic Research Institute, (2002). JTJ/T 234-2001; wave model test regulation. Nanjing, China: Nanjing Hydraulic Research Institute.
Peng, S. Y., Li, Z. G., Li, X. R., Chai, X., Liu, D. Y., Zhao, Y. Z., et al. (2020). Flow analysis of tubular turbine draft tube based on vortex analysis. Eng. J. Wuhan. Univ. 53 (8), 679–685. doi:10.14188/j.1671-8844.2020-08-004
Ramos, H. M., Amaral, M. P., and Covas, D. I. C. (2014). Pumped-storage solution towards energy efficiency and sustainability: Portugal contribution and real case studies. J. Water Resour. Prote. 06 (12), 1099–1111. doi:10.4236/jwarp.2014.612103
Shi, W. H., Cha, H., Luo, H., and Wang, K. Y. (2015). Preliminary study on development of seawater pumped storage power station in China. China Energy 37 (12), 36–40.
Sullivan, P. P., Mcwilliams, J. C., and Melville, W. K. (2007). Surface gravity wave effects in the oceanic boundary layer: Large-eddy simulation with vortex force and stochastic breakers. J. Fl. Mech. 593, 405–452. doi:10.1017/S002211200700897X
Tanaka, H. (2011). Vibration behavior and dynamic stress of runners of very high head reversible pump-turbines. Int. J. Fluid Mach. Syst. 4 (2), 289–306. doi:10.5293/IJFMS.2011.4.2.289
Wang, Z., Zhu, B., Wang, X., and Qin, D. (2017). Pressure fluctuations in the S-shaped region of a reversible pump-turbine. Energies 10, 96. doi:10.3390/en10010096
Xu, H. Q., Lu, L., Wang, W. P., and Zhao, L. C. (2018). Study on the mechanism of pressure pulsation in the vaneless space of pump turbine. J. China Aca. Water. Res. Hydro. Res. (4), 248–256. doi:10.13244/j.cnki.jiwhr.20180217
Xu, L. C., Peng, Y. J., Tang, W., Liu, D. M., and Liu, X. B. (2022). Flow characteristics and pressure pulsation in the S characteristic area of model pump turbine. Chin. J. Hydro. 37 (2), 213–225. doi:10.16076/j.cnki.cjhd.2022.02.009
Yang, J., Lv, Y., Liu, D., and Wang, Z. (2021). Pressure analysis in the draft tube of a pump-turbine under steady and transient conditions. Energies 14, 4732. doi:10.3390/en14164732
Yao, Z., Wang, F., Qu, L., Xiao, R., He, C., and Wang, M. (2011). Experimental investigation of time-frequency characteristics of pressure fluctuations in a double-suction centrifugal pump. J. Fl. Eng. Trans. ASME. 133 (10). doi:10.1115/1.4004959
Yu, J. M., Ji, Q. Y., Zheng, H., Yang, L. Y., Wang, R. Q., and Chen, C. J. (2020). The investigation of wave energy in zhoushan coastal area based on SWAN model. Mar. Fore. 37 (4), 38–49. doi:10.11737/j.issn.1003-0239.2020.04.005
Zheng, Y., Jiang, W. Q., Chen, Y. J., and Sun, O. R. (2018). Investigation on low frequency pulsating and draft tube vortex of tubular turbine. J. Trans. Chin. Soc. Agric. Mach. 49 (4), 165–171. doi:10.6041/j.issn.1000-1298.2018.04.019
Zhong, L. T., Lai, X. D., Liao, G. L., and Zhang, X. (2018). Analysis of the relationship between outlet swirl of francis turbine and draft tube vortex rope. J. Hydro. 37 (9), 7. doi:10.11660/slfdxb.20180905
Zhou, D. Q., Chen, S. F., and Li, C. (2013). Numerical simulation of operation characteristics of low-head tubular turbine. J. Irr. Dra. Mac. Eng. 2013 (10), 6. doi:10.3969/j.issn.1674-8530.2013.10.006
Zhou, Q., Xia, L., Zhang, C., Yuan, Y., and Zhu, Z. (2018). Transient pressure fluctuations and runner loadings of a model pump-turbine during a load rejection process. J. Hydraulic Eng. 49 (11), 1429–1438. doi:10.13243/j.cnki.slxb.20180706
Zuo, Z. G., and Liu, S. H. (2017). Study on flow instability of pump turbine in China. Engineering 3 (4), 162–178. doi:10.1016/J.ENG.2017.04.010
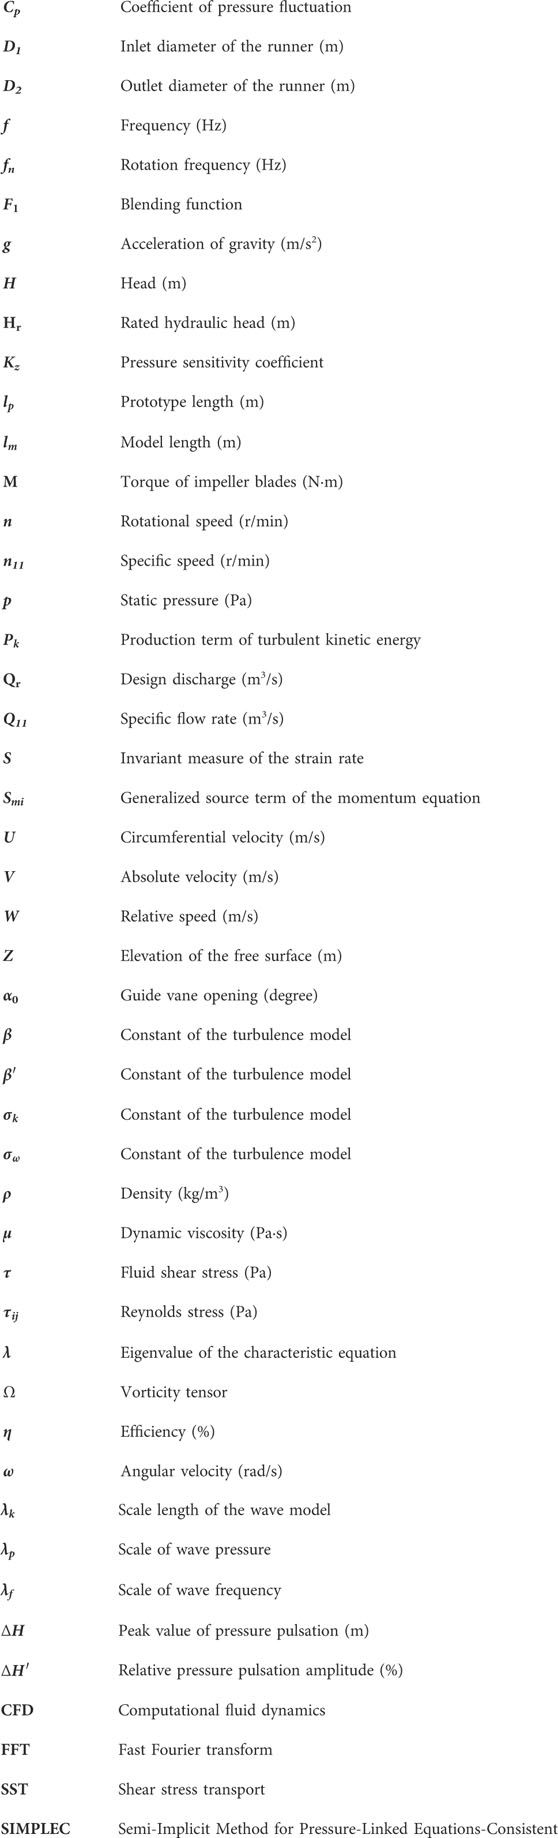
Appendix: The nomenclature
Keywords: wave disturbance, frequency domain, pump turbine, static and dynamic interference, pressure pulsation, seawater pumped-storage hydroplant
Citation: Hu J, Wang Q, Song H and Mao J (2023) Effect of wave disturbance on the fluid dynamics of the pump turbine in a seawater pumped storage hydroplant. Front. Earth Sci. 11:1220842. doi: 10.3389/feart.2023.1220842
Received: 11 May 2023; Accepted: 12 June 2023;
Published: 29 June 2023.
Edited by:
Wei Ge, Zhengzhou University, ChinaReviewed by:
Kan Kan, College of Energy and Electrical Engineering, ChinaJiachun Liu, Ningbo University, China
Copyright © 2023 Hu, Wang, Song and Mao. This is an open-access article distributed under the terms of the Creative Commons Attribution License (CC BY). The use, distribution or reproduction in other forums is permitted, provided the original author(s) and the copyright owner(s) are credited and that the original publication in this journal is cited, in accordance with accepted academic practice. No use, distribution or reproduction is permitted which does not comply with these terms.
*Correspondence: Jiahua Mao, maojh@zjweu.edu.cn