Sediment variability in intermittently extracted sandbanks in the Belgian part of the North Sea
 Lars Kint
 Florian Barette2
 - 1Operational Directorate Natural Environment (OD Nature), Royal Belgian Institute of Natural Sciences (RBINS), Brussels, Belgium
- 2Continental Shelf Service (CSS), Federal Public Service Economy (FPS Economy), Brussels, Belgium
Introduction: In the Belgian part of the North Sea, sand for beach and foreshore nourishments is extracted from the Hinder Banks, about 40 km offshore. The extraction is not screened for shells and other very coarse material, as is the case for sand extraction for industrial use. Intermittent but intensive sand extraction took place from 2012 to 2019 on the Oosthinder, and since 2019 on the Noordhinder.
Methods: To better understand sediment variability during human-induced disturbance of the seabed, both sandbanks have been monitored using multibeam bathymetry and backscatter, and Reineck box cores on board of the Research Vessel Belgica A962. Acoustic and sediment data were preferably jointly collected within a one-week period to substantiate the interrelationships.
Result: Very well-sorted medium sands with low backscatter values (−28 to −33 dB) are detected near the top of the sandbank, while (moderately) well-sorted coarser sands and shell fragments with high backscatter values (−20 to −24 dB) are detected in the deeper parts of the sandbank slope. Although natural conditions such as sandwave movement and storms may mask early sediment changes, 7 years of intermittent and intensive sand extraction on the upper parts of a gentle sandbank slope caused a seabed deepening of at least 2 m, a backscatter decrease between 5 and 8 dB, a reduction in carbonate content by 1%–5% and an increase in organic matter content by 1%–2%. Two years after the cessation of the operations, the carbonate content increased and organic matter content decreased by 1%–2%.
Discussion: Natural variability of sediments remains dependent on depth and geomorphology in both undisturbed, as well as recently and longer disturbed sandbank systems. However, a spreading of the more homogeneous, very well-sorted medium sands with limited carbonate content from the sandbank crest to the upper parts of the sandbank slope was observed, as sand extraction progressed. Subsequently, possible first signs of a slow return to the original sediment characteristics were detected.
1 Introduction
The demand for aggregates, sand and gravel, has increased over the past century to the extent that far more sand is being extracted than is naturally replenished (John, 2009). Although there is no strategic monitoring for governance, planning and management of global sand resources (UNEP, 2019), extraction activities in the North Sea are well reported and indicate gradually increasing quantities since the 1970s (ICES, 2019). Sand is increasingly considered a strategic resource, needed to meet a wide range of societal demands, but also to provide ecosystem services (UNEP, 2022). Environmental impact assessments on the marine environment are a common practice in European Member States (Peduzzi, 2014). Impacts are well inventoried (ICES, 2022) with direct and indirect consequences including morphological changes due to seabed removal (e.g., Bellec et al., 2010; Degrendele et al., 2010; Gonçalves et al., 2014; Mielck et al., 2019) and changes in suspended matter due to increased turbidity (e.g., Roman-Sierra et al., 2011; Caballero et al., 2018) resulting from “active”-overflow and “passive”-sediment plumes (e.g., Duclos et al., 2013; Van Lancker and Baeye, 2015) that are dispersed over long distances (e.g., Kim et al., 2018; Seo et al., 2018). Near-to far-field effects are described (e.g., Becker et al., 2015; Van Lancker et al., 2015; 2016) with deposition from sediment plumes potentially leading to smothering (e.g., Smith and Friedrichs, 2011; Spearman, 2015). All may affect ecosystems at varying spatial and temporal scales (e.g., Cooper et al., 2008; Waye-Barker et al., 2015).
Marine environmental protection is high on the international agenda. Several international treaties and multilateral agreements address the conservation and sustainable use of oceans and seas, such as the United Nations Convention on the Law Of the Sea (UNCLOS), which defines the basic legal framework for activities affecting seas and oceans, and the Regional Seas Programme of the United Nations Environment Programme (UNEP), which aims to address the degradation of oceans and coastal areas. In most cases, action plans are based on a regional convention and related protocols, e.g., the Commission for the Protection of the Marine Environment of the North-East Atlantic (OSPAR). Currently, about 12% of the European seas are protected through directives (Agnesi et al., 2020). The European Commission set up the Habitats Directive (HD; 92/43/EEC; European Economic Community, 1992) on the conservation of natural habitats and of wild fauna and flora, the Birds Directive (BD; 2009/147/EC; European Commission, 2009) on the conservation of wild birds. Both are intended to provide protected areas for Europe’s most valuable and threatened species and habitats (Natura 2000 network; European Commission, 2008a). The Marine Strategy Framework Directive (MSFD; 2008/56/EC; European Commission, 2008b) requires an ecosystem-based approach to protect biodiversity and to understand temporal and spatial patterns, scale and processes that interact with prevailing pressures and vulnerability. Good environmental status (GES) needs to be monitored, for which several qualitative descriptors were set up. Seafloor integrity and hydrodynamic conditions are particularly important in the context of sand extraction since changes could adversely impact benthic ecosystems (ICES, 2022). Respectively, they refer to the structure and functions of the ecosystem that need safeguarding and to currents, turbidity and/or other oceanographic parameters.
As in other countries (e.g., Italy: Cutroneo et al., 2012; UK: Cooper, 2013; Cooper and Barry, 2017; US: Nairn et al., 2004), the effect of aggregate extraction is researched in Belgian waters since the early 1980s (Van Lancker et al., 2022). Changes in bathymetry (morphology), sediment (transport) and biology (habitat) are followed up at regular intervals, anticipating on varying extraction regimes, demonstrated by electronic monitoring systems. Since 2011, sand extraction for beach and foreshore nourishment purposes as part of the Coastal Safety Plan has taken place in the most offshore areas (∼40 km from the coast). Its Environmental Impact Assessment (MUMM, 2011) concluded that more comprehensive knowledge was needed on hydrodynamics and sediment behavior in extracted sandbank areas, as there was 1) insufficient information on the sand balance; 2) no data on the impact of large-scale extraction using large vessels (with a hopper volume up to 12,500 m³); 3) only limited data on the impact of marine aggregate extraction in (very) coarse sandy environments; and 4) uncertainties on the significance of increased turbidity on the nearby Habitat Directive area, where ecologically valuable gravel beds are present. A monitoring program (Van Lancker et al., 2016; 2020) was established to assess the natural variability in sediment processes and the physical impacts of extraction activities, aligned with national and European objectives. It involved quantifying and modelling of directly impacted areas and more distant regions potentially affected by increased sediment dispersal. Advanced acoustic measurements in target areas (multibeam bathymetry and backscatter, bottom- or hull-mounted acoustic doppler current profiler, conductivity-temperature-depth profiling, optical backscatter), in-situ samples at dedicated locations (macrofaunal samples, seabed cores, water filtrations) and visual observations along transects (video frame, sediment profile imaging, footage via divers) are being used.
Monitoring seabed changes relies increasingly on the use of acoustic echo sounders. Spatially-explicit multi-parameter products (multiple sensors of a research vessel) are provided including proxies (multibeam backscatter) for seabed characteristics and substrate types (Lamarche et al., 2011). While rapid developments were made to distinguish major seafloor types from acoustic-sediment relationships (e.g., Freitas et al., 2003; Bartholomä, 2006; ICES, 2007; Foster et al., 2009), i.e., presence of hard rock or soft sediments, occurrence of faunal communities or marine habitats, and the distribution of seagrass (e.g., De Falco et al., 2010; Kloser et al., 2010; Parnum and Gavrilov, 2012; Huang et al., 2018), remote monitoring of changes in the characteristics of soft substrata is only progressing recently (e.g., Gutperlet et al., 2017; Montereale-Gavazzi et al., 2018; Wyns et al., 2021). Mostly this is due to a lack of calibrated systems (Roche et al., 2018) and limited terrain validation. Since assessing changes in broad-scale habitat types (sediment related) is a mandatory criterion in the assessment of seabed integrity (MSFD - Descriptor 6), remote monitoring of sediment changes has a huge potential to pro-actively identify areas with higher seabed disturbance. Not only can multiple seabed properties be mapped, also sediment transitions between habitats can be detected over larger areas in a short time period.
This paper presents the results of a decade of monitoring seabed changes in the near field of two offshore sand-extraction areas where intermittent but intensive extraction takes place. Changes in multibeam bathymetry and backscatter are distinguished, validated with sediment samples and assigned to natural (defined by depth and geomorphology) and/or human-induced (related to extraction) variability, which can be well depicted from the acoustic signature. Changes in seabed sediments are assessed using estimated extraction quantities and intensities, acquired multibeam bathymetry and backscatter values, and analyzed sediment parameters such as percentages of sand (with shell fragments), calcium carbonate and organic matter, mean size and sorting. Lessons-learned are highlighted, as well as future outlook for a more efficient monitoring strategy of seabed disturbance by human stressors.
2 Study area
The Hinder Banks are NNE-SSW elongated sand ridges located 30–55 km offshore in the Belgian part of the North Sea. Their summits reach heights of up to −8 m LAT (Lowest Astronomical Tide), while the intermediate troughs are up to −40 m LAT deep. The sandbanks emerge from the troughs around −27 m LAT (Kint et al., 2019) with megaripples gradually evolving into sand waves of 6–8 m height.
Medium sand, 250–500 µm, is the dominant lithological class with an enrichment of coarser sands and shell hash (Hademenos et al., 2018). In the upper parts of the sandbank, silts and clays are limited, generally less than 1%. Gravels and small pebbles are found in the troughs. The gravel stock consists mainly of sedimentary rocks such as flint, sandstone, quartzite, limestone and chalk (Veenstra, 1964; Veenstra, 1969).
The Hinder Banks are a dynamic area with bedform migration rates between 0.2 and 0.6 m per spring-neap cycle (Van Lancker et al., 2020). Measurements of tidally-induced suspended particulate matter (SPM) were similar under NE- and SW-directed currents (Van Lancker and Baeye, 2015), though higher concentrations were measured on the Oosthinder (sector 4c) than on the Noordhinder (sector 4a). In general, SPM concentrations (at 2–3 m above the seabed) are between 0.010 (neap) to 0.015 (spring) g/L on the sandbank and even up to 0.019 g/L above the crest, while around 0.005 g/L in the gullies (Van Lancker et al., 2016; Van Lancker et al., 2020). Extrapolation resulted in predictions up to 0.040 g/L near the seabed.
During the period 2010–2021, sand extraction was permitted in four dedicated sectors (Figure 1) and the volumes extracted were quantified (Figure 2; Van den Branden et al., 2022). The sand extracted in these areas is used for coastal protection in the framework of the Coastal Safety Master Plan implemented since 2011 by the coastal division of the Flemish Government (Van Lancker et al., 2022). From 2012 to 2019, most activities took place on the Oosthinder with 5.8 million m³ of sand extracted in sector 4c and 0.7 million m³ in sector 4b, cumulatively. Sand extraction on the Noordhinder only started in 2019, with the extraction of 1.5 million m³ sand in sector 4a by the end of 2020. Up to 2022, no extraction took place on the Westhinder (sector 4d). Sand is mainly extracted from the slopes and crests of the sandbanks.
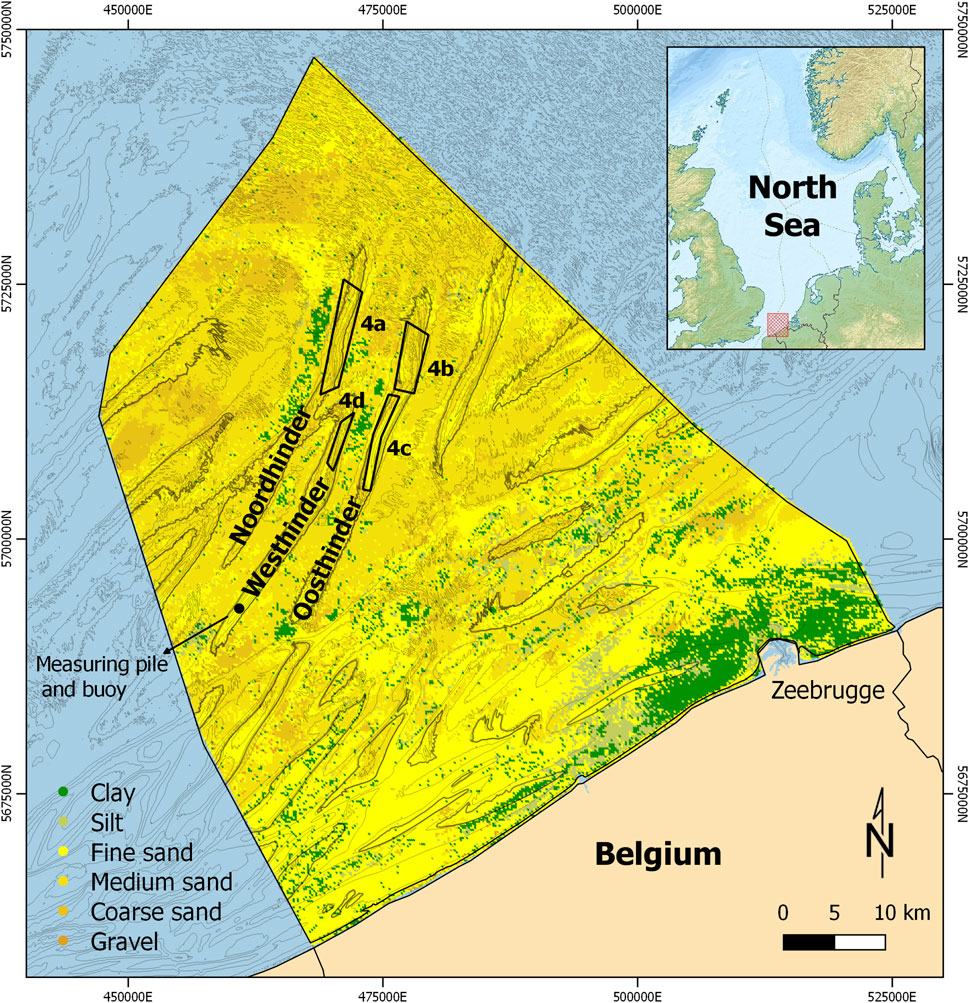
FIGURE 1. Sand-extraction sectors in the Hinder Banks in the Belgian part of the North Sea: 4a (Noordhinder), 4b and 4c (Oosthinder), and 4d (Westhinder). The lithological map represents the most probable sediment type in the first meter of a subsurface model of the Quaternary sediments (TILES Consortium, 2018a; Hademenos et al., 2018). The location of the Westhinder measuring pile and buoy is indicated.
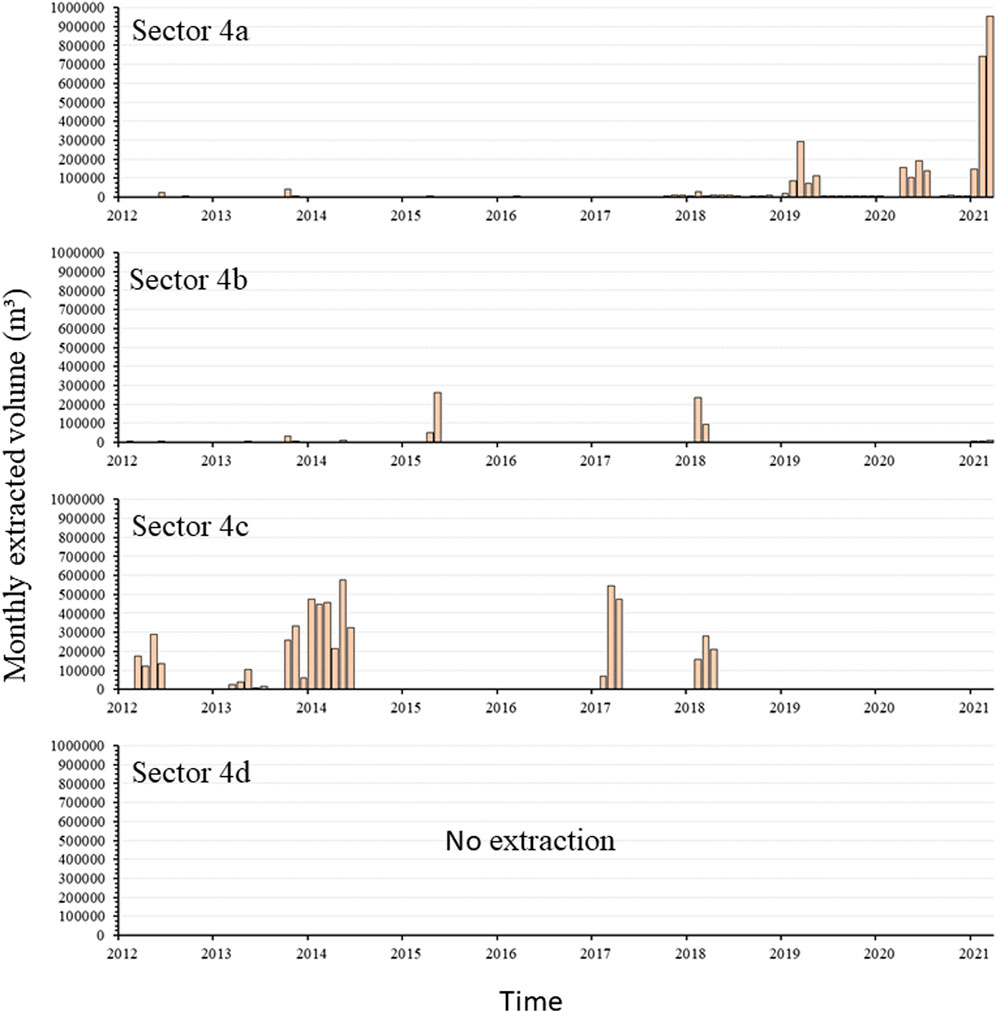
FIGURE 2. Sand-extraction monthly volumes in the four dedicated zones of the Hinder Banks (Van den Branden et al., 2022).
3 Materials and methods
Bathymetric-backscatter measurements from multibeam echosounder (MBES) and seabed sampling were carried out annually (Van Lancker et al., 2016; Van Lancker et al., 2020) (Figures 3, 4). Sector 4a and 4c, on the Noordhinder and the Oosthinder respectively, are intensively extracted zones, though with longer periods of ceased operations (i.e., months for 4a, and years for 4c). Three acoustic data series acquired in July and November 2019, and March 2021 were considered for sector 4a. Acoustic data series acquired from the intensively extracted central part of the sandbank in April and May 2012; March and October 2013; March, May and November 2014; May and December 2015; September 2017; March and September 2018; and July 2019 were considered for sector 4c. To complement the acoustic records, 14 Reineck box cores were taken in March 2019 and March 2021 within, near and outside of the intensively extracted area of sector 4a in order to have spatially well-spread sediments samples. For sector 4c, sediment sampling in March 2014, 2018, 2019 and 2021; and December 2015 resulted in five sets of 6–8 Reineck box cores. For both sectors, the time span between acoustics and the sediment sampling was kept to a minimum to limit the effect of intermittent disturbance. For each sector and each sampled location, estimates of monthly and yearly extracted volumes were obtained from the Electronic Monitoring System (EMS) on board of the aggregate extraction vessels (Van den Branden et al., 2022).
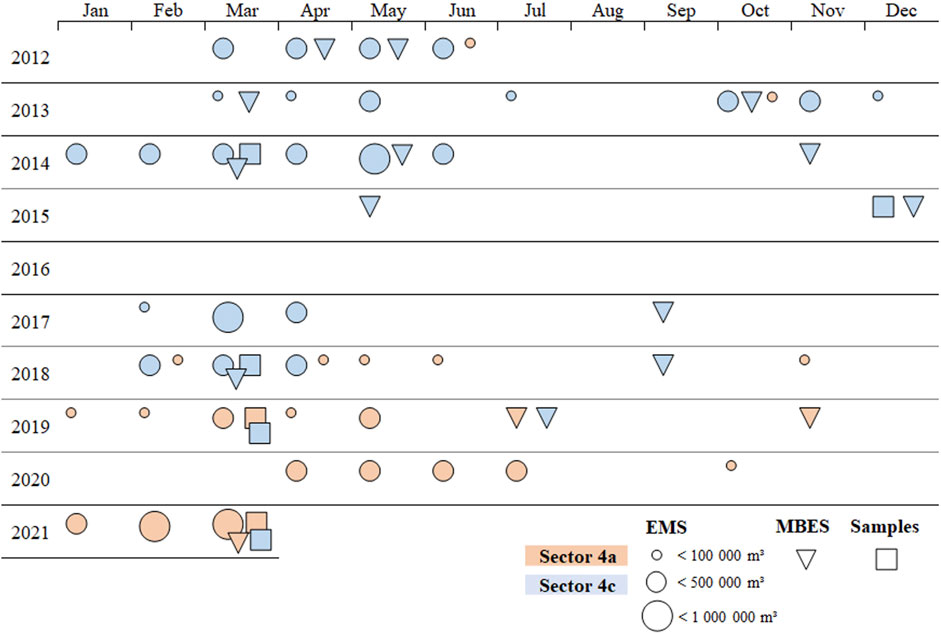
FIGURE 3. Monthly overview of the acoustic and sample monitoring from January 2012 to March 2021 in sand-extraction sector 4a (orange) and 4c (blue). EMS data were provided by RBINS-MSO, MBES data were acquired by the FPS Economy-CSS, and seabed samples were taken by RBINS-OD Nature.
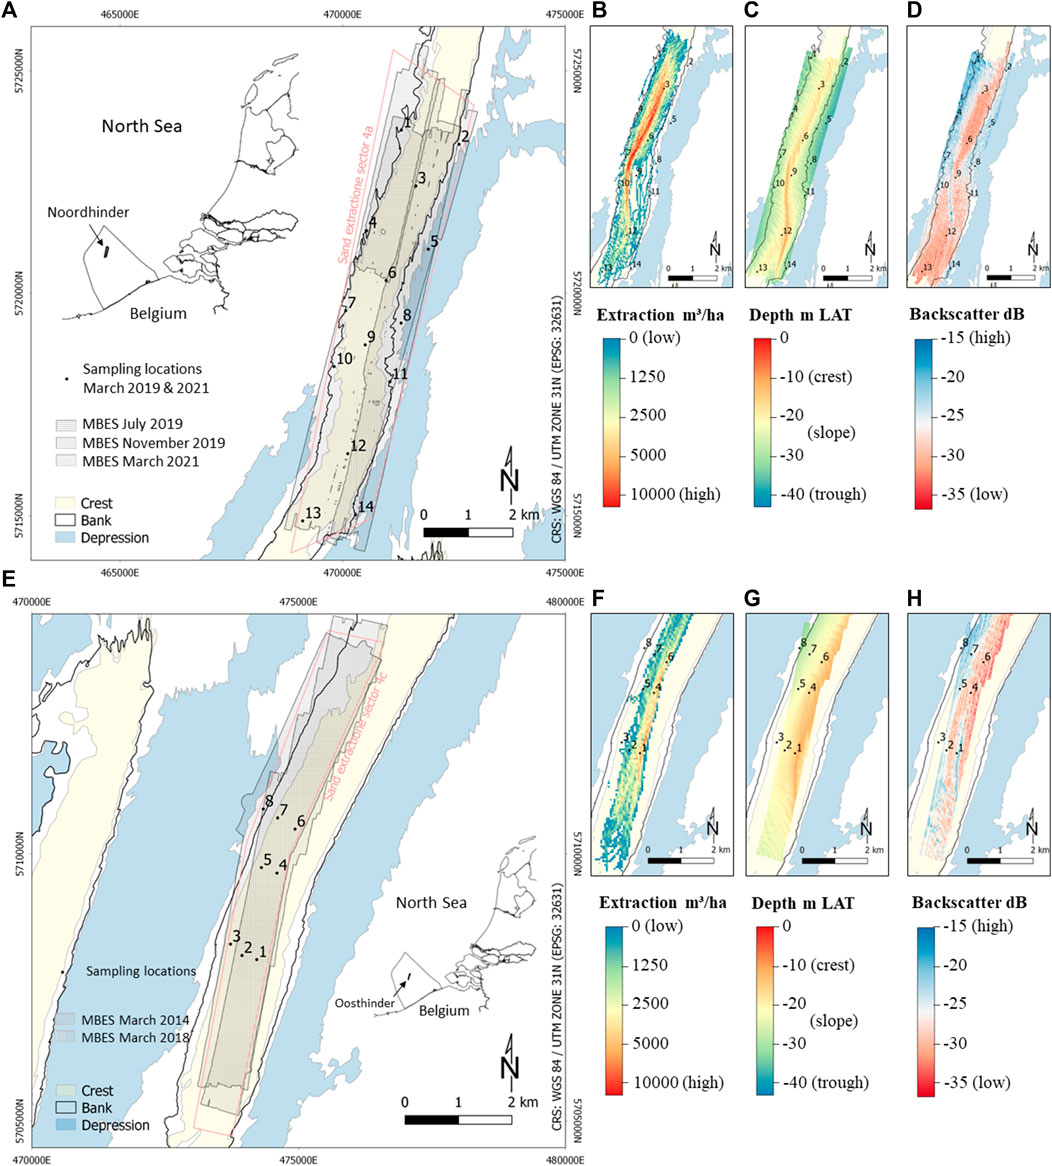
FIGURE 4. Acoustic monitoring areas and sampling locations in sand-extraction sector 4a on the Noordhinder (A-D) and sector 4c on the Oosthinder (E-H), and displayed on maps of extracted quantities over the period in m3/ha, bathymetry (depth) in m LAT, and backscatter in dB (4a: March 2021; 4c: March 2018). Bathymetric contours and morphological units are derived from Flemish Hydrography data grids.
3.1 Electronic monitoring system
Sand extraction in the Belgian part of the North Sea is monitored continuously by an automatic Electronic Monitoring System (EMS), installed on board each extraction vessel. The EMS provides spatial information on the position of the vessel, i.e., point locations every 30 s during extraction, and estimates of the volume extracted at that location (Van den Branden et al., 2022). The system is not equipped with sensors that automatically measure the extracted load. Instead, total extraction volumes in m³ are estimated per record by subdividing the hopper volume by the number of extraction records per trip (i.e., assuming a fully loaded hopper per trip). The hopper content is usually a good approximation of the effective load for each voyage (except for beach nourishments where tides and draught of the vessel are taken into account and an average volume is used) (Van den Branden et al., 2022). The algorithms for calculating the extracted volume of the hopper contents are based on the time difference between two consecutive recordings, the total duration of the trip and constant volumes (Van den Branden et al., 2022). Grids of the extracted volumes per hectare were available for each year, and for each month (Figures 4B, F).
3.2 Multibeam echosounder bathymetry and backscatter
For the period 2012–2021, RV Belgica A962 was equipped with a Kongsberg Maritime EM3002 dual-head MBES (300 kHz) for recording bathymetric (Figures 4C, G) and backscatter (Figures 4D, H) time series. The acoustic system emits acoustic waves in a fan shape (i.e., swath) beneath the transceiver and calculates the bottom depth (or bathymetry) by measuring the time it takes for the sound waves to reflect off the seabed and return to the receiver. Backscatter strength (BS) quantifies the amount of acoustic intensity that scattered back to the sonar receiver. MBES bathymetric and backscatter data were all acquired using similar acquisition settings (e.g., runtime parameters, filter and gain values). In particular, the pulse duration which determines the instantaneous insonified area that is critical for the backscatter level determination (Hughes Clarke, 2012) was kept constant. A standard workflow in the software QPS-Qimera® (v2.3.1, 2020) was used for hydrographic data processing of the MBES bathymetric dataset. It includes tide reduction to the Lowest Astronomical Tide (LAT), correction of residual offsets and filtering of outlier soundings. Taking into account the differences between conventional depth measurements (DGPS, draught and tide correction) and GNSS RTK corrected depths, an overall uncertainty of about 0.3 m was considered for all RV Belgica EM3002d surveys (Roche et al., 2017). The processing of MBES backscatter was done in the software Ifremer-SonarScope® (v5.0, 2021) and QPS-FMGT® (v7.9.5, 2020). Lamarche and Lurton (2018) proposed several steps for the analysis of time series in a monitoring context: 1) correction of the acoustic absorption effect, using seawater properties from the on-board data acquisition system; 2) correction of the instantaneous insonified area from the tide-corrected terrain model of the study site, using the real incidence angle; 3) removal of all angle-dependent corrections (e.g., the Lambert and specular adaptive corrections applied in the Kongsberg Maritime software); 4) computation of a 1 m × 1 m mosaic, averaging values within the oblique-incidence sector of ± [30°, 50°], being the most stable part of the curve and hence most discriminative to derive sediment type (Lamarche et al., 2011); and 5) extraction of the statistics (mean, standard deviation) plotted over time (i.e., angular response curves). A 50-m buffer around the sampling locations was chosen to best represent the surrounding seabed substrate in a sandwave field with wavelengths ranging from 100 to 250 m and maximum heights of 2–5 m (Terseleer et al., 2019). In oblique incidence, acoustic 300 kHz waves only penetrate sandy substrates up to around 3 cm (Huff, 2008; Lurton and Lamarche, 2015). Although the backscatter levels were not calibrated, individual backscatter data recorded with the same MBES using the same acquisition parameters and processed with a consistent procedure are robustly intercomparable (Roche et al., 2018).
3.3 Sediment analyses
Reineck box cores (RC) were taken from the seabed, subsampled using cylindrical tubes with an inner diameter of 36 mm and sliced at 1 cm intervals to account for the limited penetration depth of the multibeam. The sliced subsamples were frozen on board and later split in the laboratory for sediment analyses of organic matter, calcium carbonate and grain size. Positioning of the Reineck box cores (Figures 4A, E) were corrected for on-board operations (e.g., navigation accuracy, on-board and off-deck offsets, etc.), while underwater drift was compensated by calculating the standard deviation of the acoustic bathymetry and backscatter within a 50-m buffer.
The total content of organic matter and calcium carbonate were measured by using the slightly adapted Loss-On-Ignition (LOI) method from Dean (1974) and Heiri et al. (2001). Four grams of sediment from each slice of the samples were put in pre-weighed porcelain crucibles and dried in an oven at 105°C for 24 h. The samples were subsequently placed in a desiccator for half an hour in order to reach room temperature and were weighed. In the next step, samples were placed in a muffle furnace at 550°C for 4 h. After cooling to room temperature in a desiccator, samples were weighed again. The difference between the weight of samples at 105°C and 550°C represents the amount of organic matter. The samples were then returned to the muffle furnace and heated at 1,000°C for 5 h. The weight difference between 550°C and 1,000°C represents the amount of CO2 evolved from carbonate minerals. The actual carbonate content of a sample is calculated as the weight of CO2 lost between 550°C and 1,000°C divided by 0.44, representing the mass fraction of CO2 in CaCO3. Three replicates of a sliced sample were taken to verify the accuracy of the method.
A Malvern Mastersizer 3,000 laser particle analyzer was used for sediment analyses, allowing calculations of grain-size distributions and derived parameters as mean size and sorting. Prior to the laser measurements, the terrigenous fraction was isolated by treating the samples (in 10 mL DI water) with boiling H2O2 (2 mL, 35%) to remove organic matter (procedure adapted from Mulitza et al., 2008). Samples were boiled with sodium hexametaphosphate to ensure complete disaggregation of the particles. A 1-mm sieving was needed to separate the fine from the coarse fraction as coarse particles and shells cannot be analyzed by laser diffraction. Both fractions of the samples were dried in the oven overnight (70°C). The dry samples were then cooled down and weighed. For the fine fraction of each sample, a very small portion was introduced in the Malvern Mastersizer. Three replicates of a sliced sample were taken to quantify the accuracy of the measurements. No further particle-size analysis was performed for the limited coarse fraction of each sample. To calculate grain-size parameters representative of the entire sediment sample, results obtained by laser diffraction were recalculated accounting for the percentage of the weight of the coarse fraction. After combining the Malvern (fractions <1 mm) and sieving (fractions ≥1 mm) results, Gradistat (Blott and Pye, 2001) was used to calculate the complete particle-size distribution of each subsample, and derive sediment parameters such as percentiles (Φ5,Φ16,Φ50,Φ84,Φ95), mean size (Mz) and sorting (
3.4 Acoustic-sediment correlations
Standardized Pearson covariance matrices of 10 variables were established for sector 4a and 4c to gain better understanding on the relationships between acoustic and sediment properties on sand-extracted sandbanks. Chosen variables are the total extraction quantities (or cumulative extraction volumes) over the period in m³/ha, bathymetric depth in m LAT, backscatter values in dB, percentages of fine sand (63–250 µm), medium sand (250–500 µm) and coarse sand with shell fragments (500–2000 µm), carbonate and organic matter content, and mean size (
Only acoustic and sediment data collected jointly within a one-week period in March 2021 for sector 4a (52 MBES tracks of 5–10 km and 20 RC samples), and March 2014 and 2018, and December 2015 for sector 4c (over 100 MBES tracks of 10 km and 21 RC samples) were used for the acoustic-sediment correlations. As the penetration of the acoustic wave is estimated around a few centimeters at 300 kHz in soft sediments (Huff, 2008), an average of the upper 3 cm of the sediment cores was used to correspond best with the acoustic data. A good correlation is accepted for p-values above 0.500 or below −0.500. The range of the initial variables were standardized to the same scale so that each variable contributed equally to the correlation analysis.
4 Results
4.1 Sediment variability after a period of intensified sand extraction—sector 4a (2019–2021)
In sector 4a on the Noordhinder, 14 locations were sampled in March 2019 and 2021, and were subdivided according to 1) extraction quantities (Table 1), 2) acoustic facies (Table 2) and 3) sediment characteristics (Table 3). The acoustic and sediment characteristics clustered per geomorphological entity, i.e., crest and slopes of the sandbank, reflect the variability of the sandbank system (Figures 5, 6).
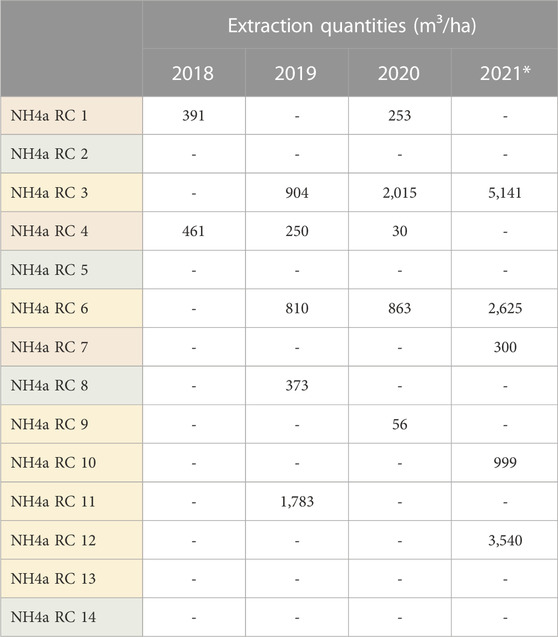
TABLE 1. Extraction quantities within a 50-m buffer of the sampling locations on the crest (yellow), Lee slope (green) and Stoss slope (red) in sector 4a. *For 2021, only data for the first 3 months.
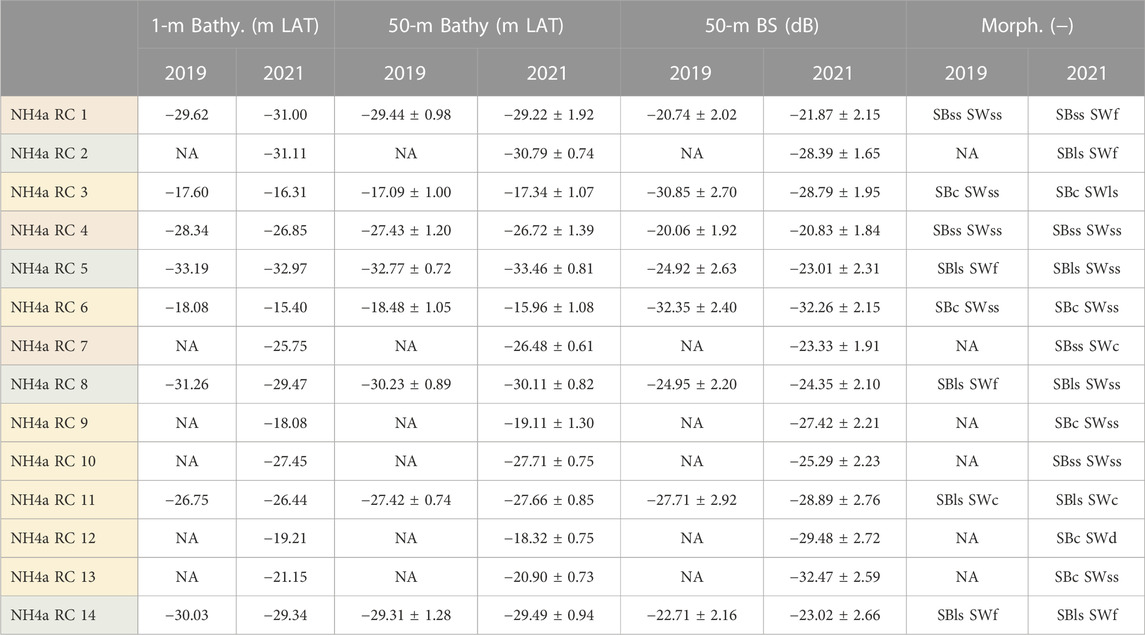
TABLE 2. Bathymetry at 1-m resolution, bathymetry at 1-m resolution within a 50-m buffer, backscatter at the angular sector of ± [30°, 50°] within a 50-m buffer, and morphological identity of the sampling locations on the crest (yellow), Lee slope (green) and Stoss slope (red) in sector 4a. Small-scale variability within 50 m is represented as the standard deviation of the bathymetry and backscatter. SB, sandbank; SW, sand wave; c, crest; d, depression; f, flat; ls, Lee slope; ss, Stoss slope; NA, Not Available.
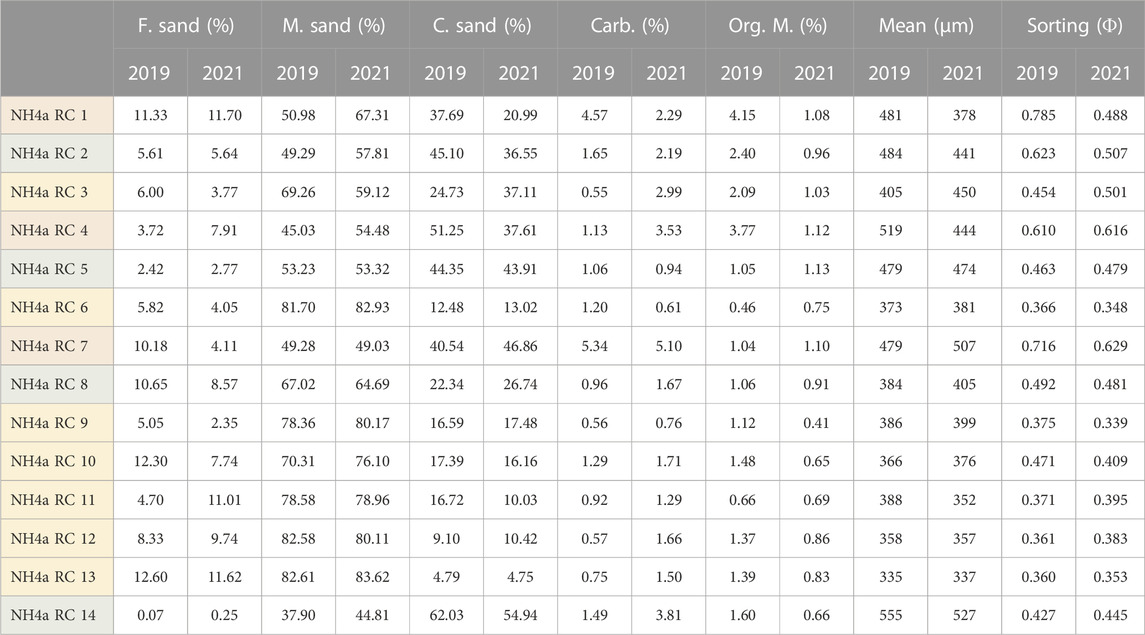
TABLE 3. Sediment parameters of the sampling locations on the crest (yellow), Lee slope (green) and Stoss slope (red) in sector 4a. The values are averaged over the upper 3 cm of the Reineck box cores. F, fine (65–250 µm); M, medium (250–500 µm); C, coarse + shell fragments (500–2000 µm); Carb, calcium carbonate; Org. M, organic matter.
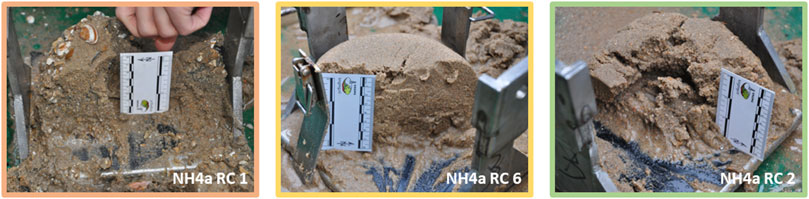
FIGURE 5. Sediment variability in sector 4a by ground-truth validation of the Stoss slope (red), crest (yellow) and Lee slope (green).
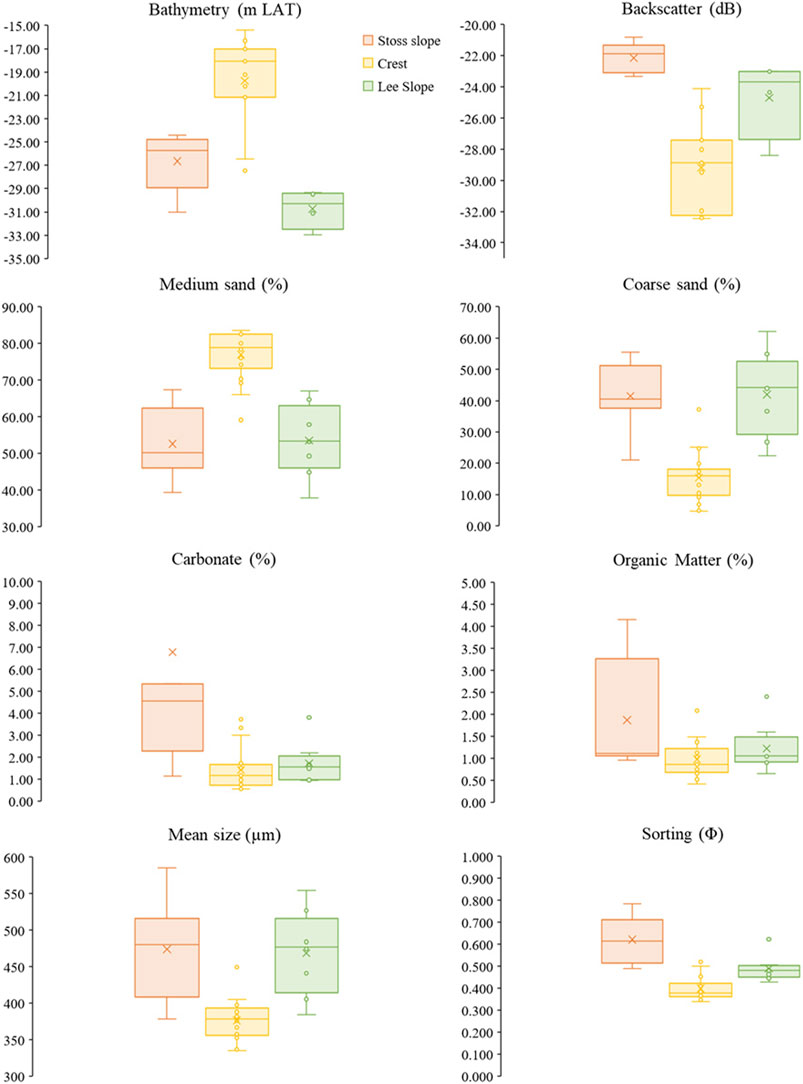
FIGURE 6. Box plots of acoustic (bathymetry and backscatter) and sediment (percentages of medium and coarse sand + shell fragments, carbonate and organic matter content, mean size and sorting) parameters from the samples taken in sector 4a during extraction in 2019 and 2021. Boxes of 75% confidence interval are drawn with a line for the median.
In the first quarter of 2021, more sand was extracted than in the previous 3 years combined (Figure 2). The intensified activities are mainly located in the northern part of the sector (Figure 4B). Total intensities since 2018 were highest for location 3 (>5,000 m³/ha), while locations 6, 10 and 12 experienced rather moderate (1,000–5,000 m³/ha) extraction activities (Table 1). Most other locations experienced lower (<1,000 m³/ha) extraction intensities.
Samples 3, 6, 9, 12 and 13 are located on the sandbank crest with depth values of −15 to −20 m LAT and low backscatter values of −28 to −33 dB (Table 2). Samples 1, 4 and 7 can be found on the western slope of the sandbank, i.e., the Stoss side. High backscatter values of −20 to −23 dB were observed at depths between −25 and −30 m LAT. For samples 2, 5, 8 and 14 on the eastern slope of the sandbank, i.e., the Lee side, bathymetry is below −30 m LAT and backscatter is intermediate, between −23 dB and −28 dB. Other samples 10 and 11 have acoustic values that vary between those of the sandbank crest and slope.
Very well-sorted (<0.400 Φ) medium sand (<400 µm) with few coarse grains (<20%) is observed in samples 6, 9, 10, 11, 12 and 13 on the sandbank crest (Table 3). After several years of sand extraction, samples 6 and 9 located north and on the top of the crest have a low carbonate content (<1.00%), while samples 10 to 13 located on the southern part of the sandbank have a high carbonate content (>1.00%). Organic matter content decreased slightly (<1.00%). Samples 1, 4 and 7 on the western Stoss slope are moderately well-sorted (>0.600 Φ) sand with high carbonate content (>3.00%), while samples 2, 5, 8 and 14 on the eastern Lee slope are well-sorted (0.400–0.500 Φ) sand with low carbonate content (<3.00%). The proportion of medium (40%–70%) and coarse (20%–50%) sand (400–550 µm) varies from north to south on the sandbank slopes. Organic matter content decreased significantly (<1.00%). A distinction between crest and slopes could be made based on mean size and sorting, but not on carbonate and organic matter content.
The most prominent deepening (dark purple) and rise (dark orange) are depicted in the depth difference map of July 2019 and March 2021 because of sandwave movement on the sandbank slope and crest, with less pronounced extraction marks (light purple) between the sand waves (Figure 7A). Although the presence of dynamic bedforms was confirmed along the SSW-NNE transect, an average deepening of about 1 m was already observed after 2 years of intermittent and intensive sand extraction (Figure 7B). The spatial analysis of slope and aspect (i.e., the orientation of the slope) in the rectangular box showed a transition from slopes in the range of 2°–6° towards more gentle slopes of 2°–4°, and the development of two dominant slope directions: SW-NE and W-E (Figure 7C). Significant changes in backscatter are hardly noticeable in the difference map (Figure 7D), because of rougher sea conditions with wave heights between 1.30 and 1.50 m (source: Meetnet Vlaamse Banken) that affected the March 2021 MBES data quality. Still, an average decrease of about 1 dB was observed along the SSW-NNE transect after 2 years of intermittent and intensive sand extraction (Figure 7E). The spatial analysis of backscatter values at 1 dB interval in the rectangular box yields two different column charts showing a bimodal distribution with two more pronounced and separated peaks in July 2019, while the distribution of March 2021 is merely flattened (Figure 7F). Transitions between backscatter ranges were not clearly identified.
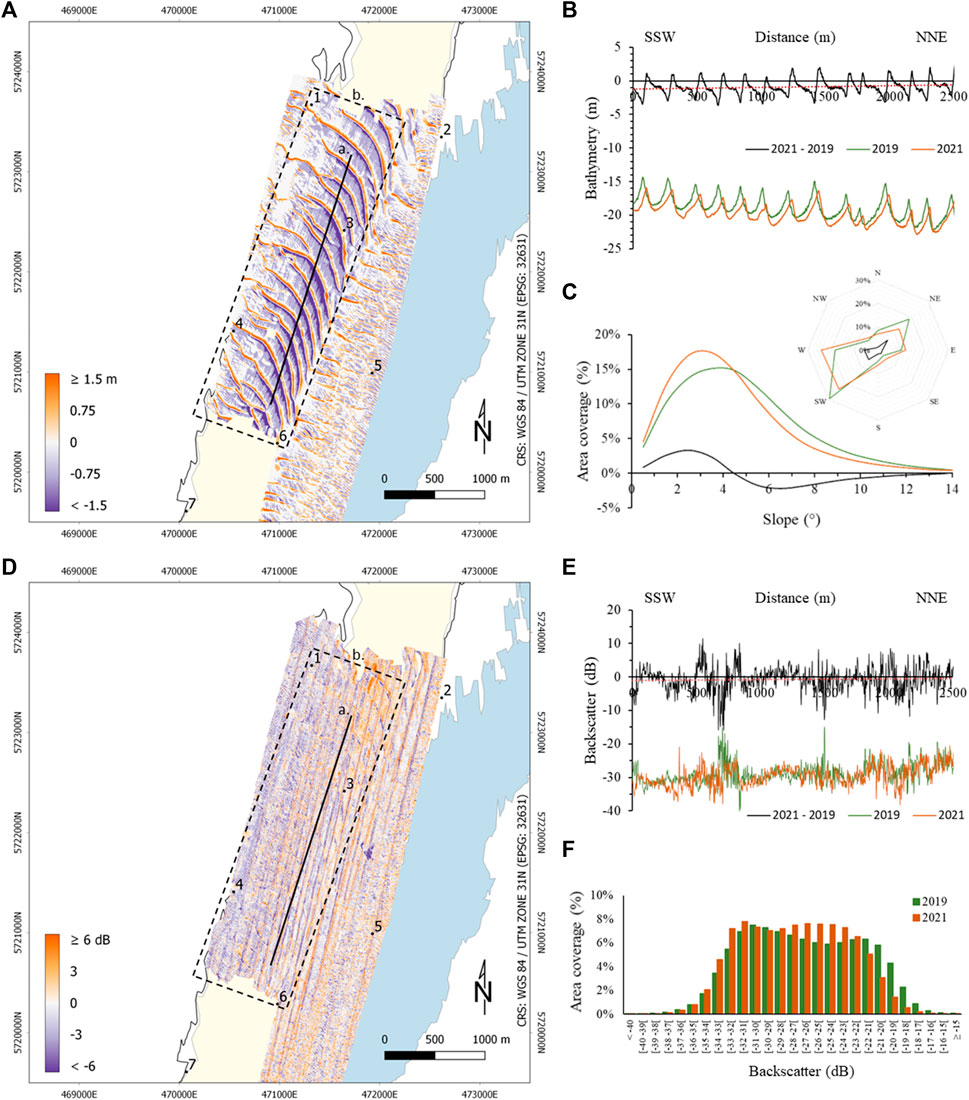
FIGURE 7. (A) Bathymetric difference between July 2019 and March 2021 in sector 4a: a. SSW-NNE transect and b. area for spatial analysis. (B) Bathymetry representation of a SSW-NNE transect showing an average deepening of 1 m (red dotted line) on a sandbank crest superimposed with sand waves. (C) Area coverage of the slope and aspect (direction of the slope) of a rectangular target area with general flattening perpendicular to the extraction tracks. (D) Backscatter difference between July 2019 and March 2021 in sector 4a: a. SSW-NNE transect and b. area for spatial analysis. (E) Backscatter representation of a SSW-NNE transect with limited decrease in acoustic volume (red dotted line). (F) Area coverage of the backscatter of a target area with a slight shift to lower acoustic values.
4.2 Sediment variability during multiple periods of intermittent sand extraction—sector 4c (2012–2021)
In sector 4c on the Oosthinder, 8 locations were repeatedly sampled between 2014 and 2021. Integrated analyses of acoustic and sediment parameters with extracted volumes are presented, reflecting the variability of the sandbank system (Figures 8, 9). The amount of data was insufficient to perform a comparative statistical analysis with box plots, as was done for sector 4a.
FIGURE 8. Sediment variability in sector 4c by ground-truth validation of the lower and upper parts of the Stoss slope (red and orange), and crest (yellow).
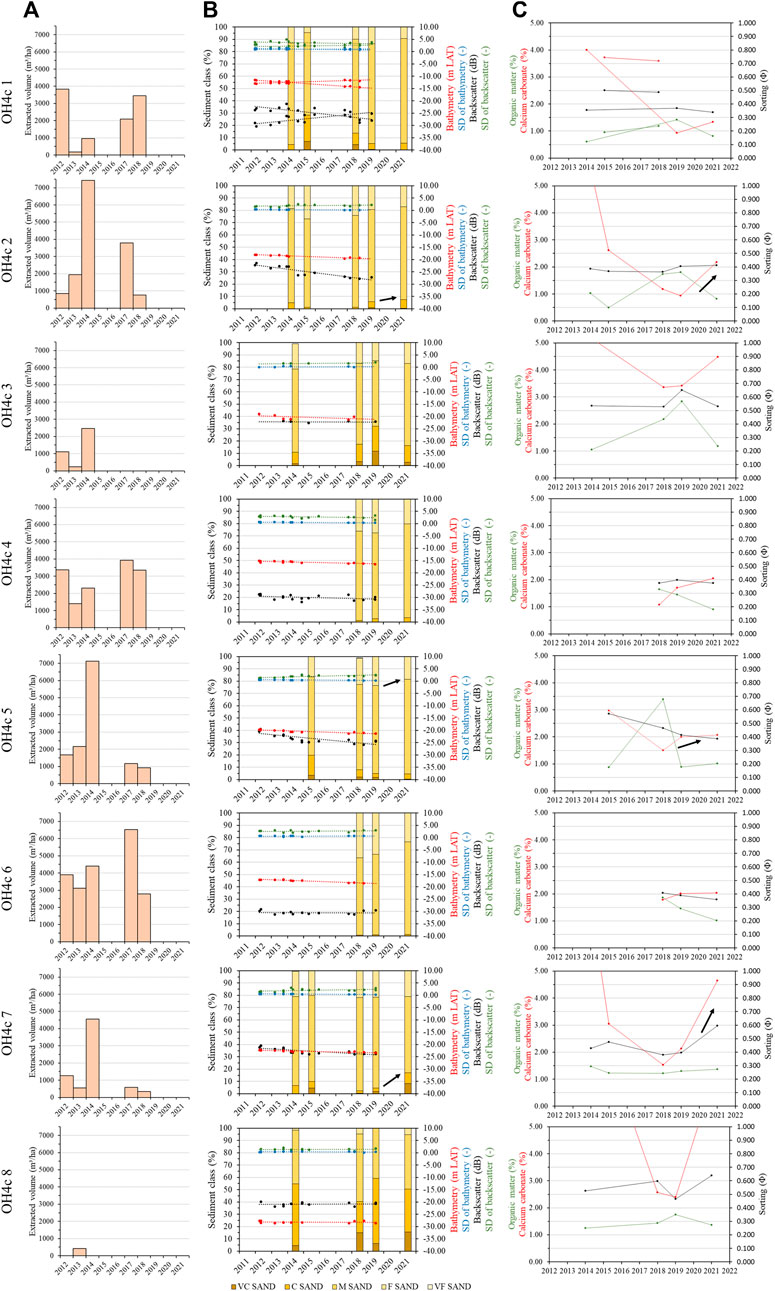
FIGURE 9. Acoustic and sediment characteristics of the 8 locations in sector 4c from April 2012 to March 2021: (A) annual sand-extraction quantities within a 50-m buffer; (B) trends of bathymetry at 1-m resolution within a 50-m buffer (red dots), backscatter at the angular sector of ± [30°, 50°] within a 50-m buffer (black dots), and spatial variation within 50 m of sampled locations represented as the standard deviation (SD) of the bathymetry (blue dots) and backscatter (green dots), completed with sand percentages (yellow to brown bars) for each sampled year; and (C) evolution of sorting values (black dots), percentages of organic matter (green dots) and calcium carbonate (red dots). Sediment data represent the upper 3 cm of the seafloor samples. Black arrows marked the increase in coarse grains and shell fragments.
Sand extraction was high from 2012 to 2014 and in the first quarter of 2017 and 2018, followed by several years of ceased operations (Figure 2, Figure 9A). The intensified activities are mainly located in the upper parts of the sandbank slope and on the crest (Figure 4F). Repeated moderate (1,000–5,000 m³/ha) to high (>5,000 m³/ha) extraction intensities occurred at sampling locations 1, 4 and 6 that are located on the crest of the sandbank. The intensity of sand extraction has been reduced from 2012 to 2019 at locations 2 (high to moderate), 3 (low to none), 5 (high to low) and 7 (moderate to low) that are located on the gentle western slope of the sandbank; i.e., the Stoss side. Limited (<1,000 m³/ha) to no sand extraction took place in the westernmost and deeper part of the sandbank (location 8).
In the time series from 2012 to 2019 (Figure 9B), no or only a limited acoustic trend can be observed at locations 3, 4, 6 and 8; i.e., a slight deepening of the seabed of less than 1 m, constant backscatter values around −20 or −30 dB, and a stability or slight increase in standard deviation of the bathymetry and backscatter. The seabed became at least 1 m deeper (−18 to −19 m LAT, −20 to −21 m LAT and −22 to −23 m LAT) and a gradual decrease in backscatter of up to 5 dB (−22 to −27 dB, −20 to −25 dB and −21 to −24 dB) was observed for locations 2, 7 and 5, respectively. This reduction is accompanied by an increase in standard deviation of the backscatter within a 50-m buffer, while the standard deviation of the bathymetry remained constant. Two trends of bathymetry and backscatter evolution at location 1 were detected. One leads to an increase of ca. 5 dB (−30 to −25 dB) and of ca. 2 m (−13 to −11 m LAT) with a small decrease in standard deviation of the backscatter, the other to a decrease of ca. 5 dB (−23 to −28 dB) and of ca. 2 m (−12 to −14 m LAT) with an increase of standard deviation of the backscatter. Here, the standard deviation of the bathymetry also remained constant.
Very well-sorted (<0.350 Φ) fine to medium sands are observed in samples 1, 2, 4, 5, 6 and 7 that are located on the crest and upper slope of the sandbank, while medium to coarse sands with moderately-well sorting (>550 Φ) are observed in sample 8 (Figure 9C). Sample 3 varies between those two sediment types. Sampling at location 1 resulted in two substrate types: a coarser substrate with low sorting (0.500 Φ) and high carbonate content (4%) in the more eastern samples (in 2015 and 2018) and a medium sand with high sorting (0.350 Φ) and reduced carbonate content (to 1%) more north and west (in 2014, 2019 and 2021). Carbonate content slightly increased (by less than 1%) after 2019. For samples 4 and 6, sorting stabilized (0.400 Φ) and carbonate content slightly increased (up to 1%). Sorting was constant at locations 2 and 7 (0.400 and 0.450 Φ), while at location 5 sorting improved (0.550–0.400 Φ). An increase in sorting value was detected at location 7 after 2019. For locations 2, 5 and 7, there is a decrease in carbonate content (by 1 to >5%) before 2018 and an increase in coarse material and carbonate content (by 1%–3%) after 2018. Sorting was low (0.550–0.650 Φ) at location 8, while carbonate content was high (2.5 to >5%). Organic matter content increased by 1%–2% between 2014 and 2019 for samples 1, 2, 3 and 5, while there is a decrease by 1%–2% after 2019 for all samples (except for samples 7 and 8).
The most prominent deepening by extraction (dark purple) is depicted in the depth difference map of April-May 2012 and July 2019, with a less pronounced sandwave movement (white to orange) (Figure 10A). After 7 years of intermittent and intensive sand extraction, an average deepening of at least 2 m was observed along the SSW-NNE transect (Figure 10B). The spatial analysis of slope and aspect (i.e., the orientation of the slope) in the rectangular box showed more gentle slopes of less than 1° in 2019, compared to slope gradients of 1°–2° in 2012 (Figure 10C). Significant changes in backscatter were observed in the difference map (Figure 10D). The SSW-NNE profile plot showed a backscatter decrease between 5 and 8 dB on the west-oriented sandbank slope near the top of the sandbank and after 7 years of intermittent and intensive sand extraction (Figure 10E). The spatial analysis of backscatter values at 1 dB interval in the rectangular box yields two different column charts showing a bimodal distribution with a small and a large pronounced peak in April-May 2012 and a skewed unimodal distribution in July 2019 (Figure 10F). A transition was observed from the backscatter range of −19 to −24 dB towards lower values of −26 to −34 dB.
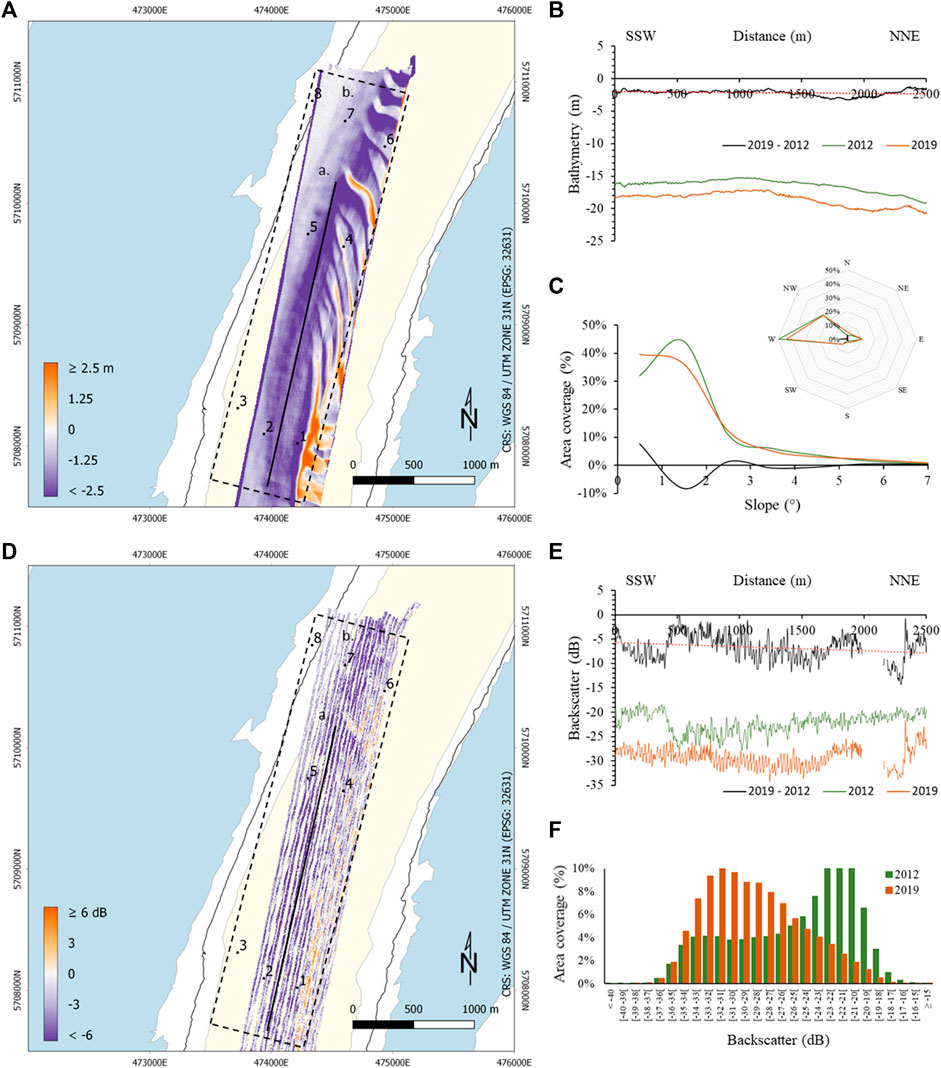
FIGURE 10. (A) Bathymetric difference between April and May 2012, and July 2019 in sector 4c: a. SSW-NNE transect and b. area for spatial analysis. (B) Bathymetry representation of a SSW-NNE transect showing an average deepening of 2 m (red dotted line) on a sandbank slope mostly without sand waves. (C) Area coverage of the slope and aspect (direction of the slope) of a rectangular target area with general flattening perpendicular to the extraction tracks. (D) Backscatter difference between April and May 2012, and July 2019 in sector 4c: a. SSW-NNE transect and b. area for spatial analysis. (E) Backscatter representation of a SSW-NNE transect with prominent decrease of at least 5 dB in acoustic volume (red dotted line). (F) Area coverage of the backscatter of a target area with a prominent shift to lower acoustic values.
4.3 Joint acoustic-sediment fingerprinting of intermittent and intensive sand-extraction areas—sector 4a and 4c
An extended correlation matrix between acoustic and sediment parameters was established (Table 4). Total extraction volumes have a positive correlation with bathymetry (+0.541), while there is no correlation with backscatter (−0.383). Sand extraction took place in the higher parts of the sandbank, where coarse sand (−0.594) decreased and fine sand (+0.697) increased as extraction and deepening progressed, resulting in a reduced mean size (−0.617). Bathymetry has a positive correlation with medium sand (+0.575), while there is a negative relationship with coarse sand (−0.570), both of which affect the mean size (−0.502). Medium sand is more common in the higher parts of the sandbank, where extraction takes place, while coarser material predominates on the slopes and in the troughs. Backscatter shows a correlation with sorting (+0.519). Medium sand (−0.783), coarse sand (+0.662), and shell material related to the carbonate content (+0.604) define the sorting. As sand extraction in sector 4a has recently started and in sector 4c sand has been extracted intermittently for long periods of time, a separate correlation matrix for the two sectors is presented. Total extraction volumes have a positive correlation with the bathymetry (+0.694) for sector 4a, while there is a negative correlation with the backscatter (−0.832) for sector 4c. Bathymetry and backscatter are more correlated in the widely sampled sector 4a (−0.639) than for dedicated sampling in sector 4c (−0.373). For sector 4a, the backscatter relates to medium sand (−0.724), coarse sand (0.680), mean size (+0.607) and sorting (+0.690), while for sector 4c it relates to fine sand (−0.732), coarse sand (+0.576), carbonate (+0.520) and mean size (+0.604). Mean size is defined by fine, medium and coarse sand, and carbonate percentage. Sorting is affected by medium and coarse sand, as well as, only for sector 4a, carbonate (+0.700) and organic matter (+0.736). Carbonate content is correlated to medium and coarse sand, organic matter, mean size and sorting. For sector 4c, additional correlations are present with total extraction (−0.537) and backscatter (+0.520). Organic matter affects mean (+0.527) and sorting (+0.736) values only for sector 4a.
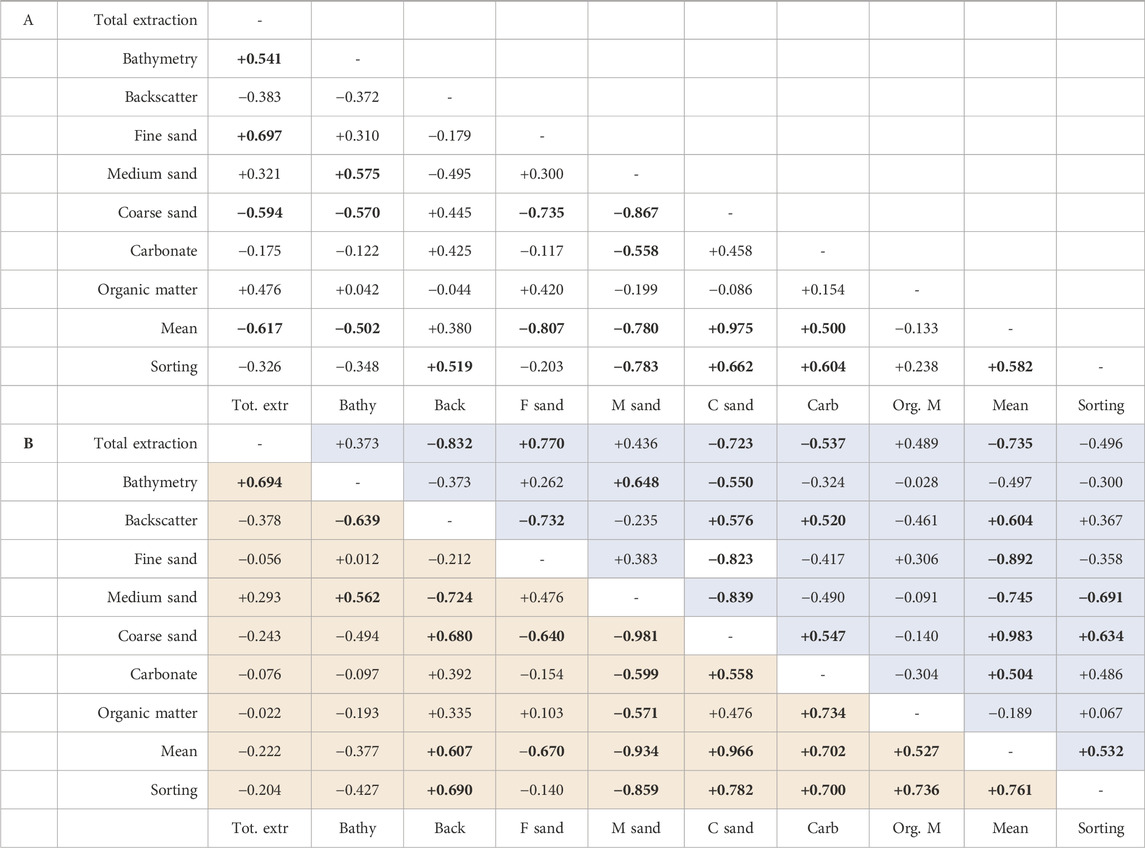
TABLE 4. Combined (A) and separated (B) Pearson correlation matrix of 10 acoustic-sediment variables for averaged acoustic data within a 50-m spatial buffer and averaged sediment data of the upper 3 cm of the core, jointly acquired for sand-extraction sector 4a (orange) and sector 4c (blue). A good correlation is accepted for p-values above 0.500 or below −0.500 (bold).
Similar sediment composition between sandbanks or sand-extraction sectors should yield similar backscatter values. However, correlations between acoustic backscatter and sand percentages along with mean size show that backscatter values are lower in sector 4a than in sector 4c, but same trends persist (Figure 11). Gradients for fine (−0.2398 and −0.2779), medium (−0.2086 and −0.0851) and coarse (+0.1714 and +0.1281) sand, as well as means size (+0.0364 and +0.0305) are comparable for sector 4a and 4c, respectively. This is not the case for carbonate (+0.2885 and +0.6582) and organic matter (+4.789 and −2.3827) content, and sorting (+26.844 and +13,141).
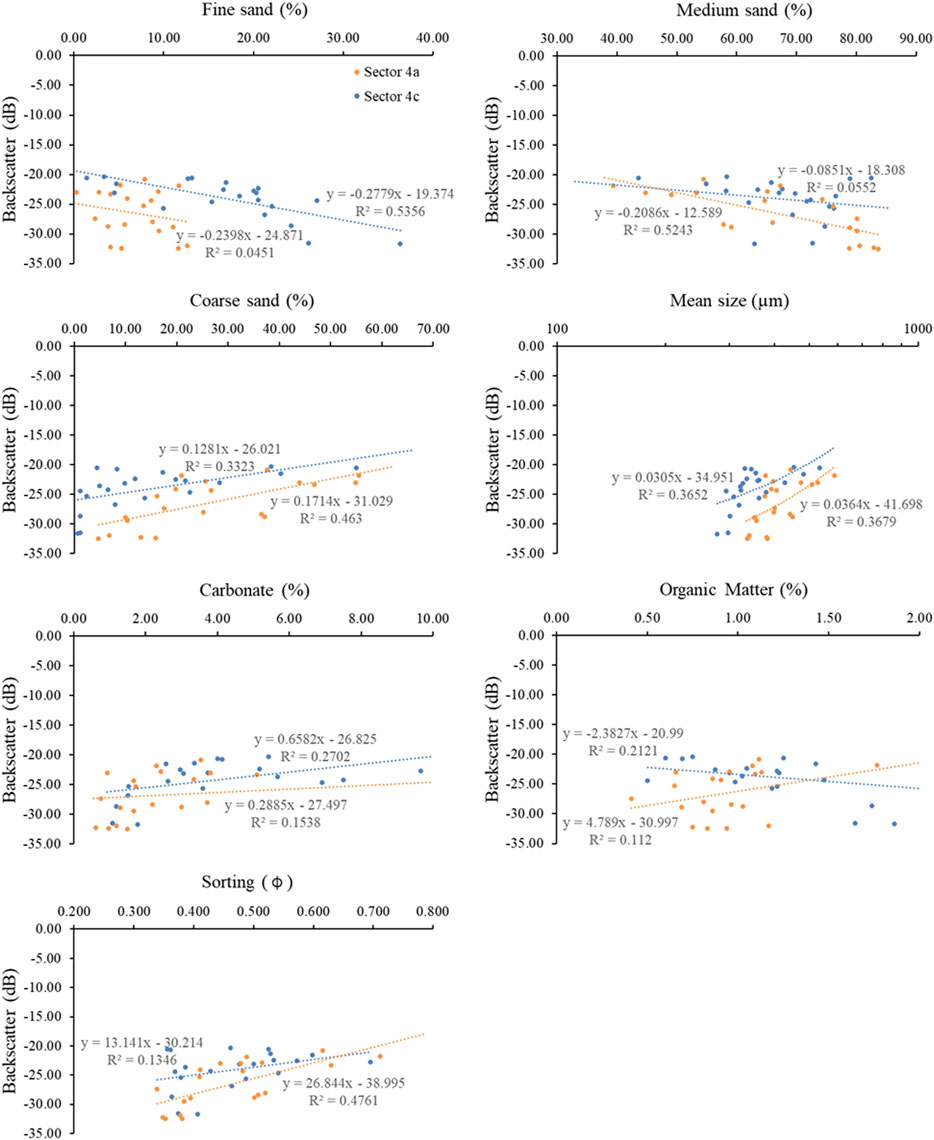
FIGURE 11. Correlations between acoustic backscatter, and percentages of sand, carbonate and organic matter content, mean size and sorting for sector 4a (orange) and 4c (blue). Fine sand consists of grains between 63 and 250 µm, medium sand of grains between 250 and 500 µm and coarse sand of grains and shell fragments between 500 and 2000 µm.
5 Discussion
Acoustic approaches are increasingly used in monitoring of seabed variability (natural and anthropogenic), as multibeam backscatter is regarded a good proxy for sediment type (Montereale Gavazzi et al., 2018; Gaida et al., 2019). Using time series of acoustic measurements and Reineck box cores for physical sampling, acoustic-sediment relationships are explored in a tidally-dominated sandbank system where intermittent, but intensive sand extraction takes place for beach and foreshore nourishment. Acoustic and sediment data would ideally yield similar trends, though relationships between the two observations deemed complex (depending on sediment composition, compaction and porosity, terrain roughness or rugosity, sea conditions, degree of mismatch in time and place, etc.). Still, the ability of using acoustic techniques to detect seabed changes is promising, although 1) the natural variability of the whole sandbank system must be well known (for morpho-sedimentary related changes); 2) the prevailing acoustic-sediment relationships must be thoroughly understood (for correlations between extraction quantities, multibeam bathymetry and backscatter, and sediment properties); and 3) possible shortcomings in acoustic-sediment monitoring must be avoided (positional errors, non-simultaneous acquisition, etc.). In the following paragraphs, results are discussed in a broader context accounting for natural variability of sediments in sandbank systems and extraction-induced seabed disturbance. Next, acoustic-sediment relationships are further refined to support remote monitoring of sediment changes in sandbank areas subdued to extraction. A future outlook, including lessons learned, is provided.
5.1 Natural variability of sediments in sandbank systems and extraction-induced seabed disturbance
Backscatter data are affected by the hardness and roughness of the seabed, defined by properties such as sediment density, heterogeneity and porosity (Jackson and Briggs, 1992; Ferrini and Flood, 2006; Sutherland et al., 2007; Lurton and Lamarche, 2015; Lamarche and Lurton, 2018). The more transitions occur between sediment grains and the water-filled pores, the greater the acoustic absorption and the weaker the backscatter response. Different seabed substrates have various acoustic and absorption properties (de Moustier and Alexandrou, 1991; Le Gonidec et al., 2003; Lamarche et al., 2011). Generally, hard rock, erratic seabed (e.g., biogenic reef) and smooth compact bottoms reflect more sound than soft substrates (e.g., sand and mud). In soft sediments, volumetric backscatter further complicates the acoustic response (Roche et al., 2017; Roche et al., 2018).
In the Hinder Banks, and sandbanks in general, low backscatter values (−28 to −33 dB) are detected near the top of the sandbank, while high backscatter values (−20 to −24 dB) are detected in the deeper parts of the sandbank slope (Table 2 and Figures 4D, H). This applies to undisturbed areas, as well as recently (e.g., sector 4a from 2019 to 2021) and longer (e.g., sector 4c from 2012 to 2019) intermittently and intensively disturbed extraction areas. However, changes in bathymetry and backscatter in the northern part of sector 4a were masked by natural conditions such as the migration of sand waves across the sandbank (Figure 7A) and a lesser data quality contaminated by air bubble reverberations caused by rougher sea conditions (Figure 7D), respectively. Yet after only 2 years, there was a 1 m drop in the seabed (Figure 7B), while no clear decrease in backscatter values could be observed (Figure 7E). After 7 years, the seafloor became at least 2 m deeper (Figure 10B) and a decrease between 5 and 8 dB in backscatter (Figure 10E) was observed in the upper parts of the sandbank slope in sector 4c. Although the sandbank was intermittently extracted (Figure 2, Figure 9A), the seabed could not recover from the disturbance in the subsequent years between two intensive extraction events. Even to the extent that the dominant backscatter classes decreased (Figure 10F) and the standard deviation of the backscatter increased. Confirmed by sampling data (see samples 2, 5 and 7 in Figure 9B), this is a clear indication of change in the sediment composition.
Theoretically, a decrease in backscatter is indicative of more sound absorption, and can result from a change in compactness and porosity of the seabed sediments. This may be caused by sand extraction since a more resistant surface layer with shell fragments and coarse material is removed (e.g., as on the western, Stoss slope of the sandbank). Sediment data from the biological monitoring did show an increase in fine sands (De Backer et al., 2017) from which Roche et al. (2017) and Wyns et al. (2021) hypothesized a gradual exposure of an underlying layer of finer sand as the result of sand extraction. However, such geological layer cannot be evidenced from present-day geological models (e.g., Hinder Banks voxel model with resolution 100 m × 100 m × 0.5 m; TILES Consortium, 2018b). A redistribution of the predominantly fine sands occurring in the top zone of the sandbank, may still add to the progressive decrease in backscatter level. A secondary effect of sand extraction is the increase in the standard deviation of the backscatter, which was shown by the increase in spatial variation within 50 m of sampled locations in some intensively extracted areas. Since, the reverse was cited by Wyns et al. (2021) in sector 4c on the Oosthinder. this observation requires further confirmation.
Sediment properties are affected by migrating sand waves and megaripples on the sandbank crest and gentle slope (Svenson et al., 2009; Bellec et al., 2019; Koop et al., 2019), especially under stormy conditions. Extraction activities remove the upper sediments, but also disturb the morphological features and cause sediment dispersal enhancing the sorting process on the seabed. Sediments of similar size are naturally segregated during transport and deposition depending on settling velocity and the transporting medium (reducing sediment density and heterogeneity, and increasing porosity).
In the Hinder Banks, and sandbanks in general, more homogeneous (very well-sorted) medium sands are detected near the top of the sandbank, while more heterogeneous (moderately to well-sorted) coarser sediments and shell fragments are present in the deeper parts of the sandbank slope (Table 3). Similar observations were made for recently (e.g., sector 4a from 2019 to 2021) and longer (e.g., sector 4c from 2012 to 2019) intermittently and intensively disturbed extraction areas. Although no sediment changes were observed during the first years of sand extraction in the northern part of sector 4a (Figure 6), carbonate content reduced by 1%–5% and organic matter content increased by 1%–2% during years of intermittent sand extraction in the upper parts of the sandbank slope in sector 4c (Figure 9C). In addition, the carbonate and organic matter contents slightly recovered by 1%–2% 2 years after the cessation of the operations.
When dredging for beach and foreshore nourishment purposes, extraction vessels typically do not screen for very coarse material, removing the coarser shells (along with most of the sediment) and releasing the embedded organic content. In other sand-extraction areas in the Belgian part of the North Sea (e.g., Flemish Banks and Thornton Bank), screening of the extracted sand and afterwards redeposition of the coarse fractions on the seabed increases the average backscatter (Kubicki et al., 2007; Cooper, 2013; De Backer et al., 2017; Roche et al., 2017; Wyns et al., 2021). Subsequently, does not screening of extracted sand lead to a decrease in backscatter? The carbonate content increased slowly after extraction, so it can be assumed that coarse sand and shell fragments forming the coarse fraction accumulated to some extent after transportation under natural conditions (including storms) from the throughs in-between sandbanks (Bøe et al., 2015). Other studies showed a redistribution of fine sands (Desprez, 2000; Krause et al., 2010; Uścinowicz et al., 2014; Wyns et al., 2021) and confirmed an increase in organic matter (Newell et al., 1998; Graca et al., 2004; Krause et al., 2010) by extraction activities (cfr. release, resuspension, segregation and settlement). A fining trend will hence depend on the material source (proportion of fine sand) and the segregation process that are dependent on the ships’ dredging specificities (e.g., small versus very large dredging vessels), as well as on the prevailing hydro-meteorological conditions. This was not obvious to derive from our results, possibly due to local hydrodynamic conditions, which are higher than in other sand-extraction areas (Vanaverbeke et al., 2000; Van Lancker et al., 2020), causing faster resuspension (Wyns et al., 2021) and the absence of deep dredging pits acting as sediment traps in which fine sediments and organic material can accumulate. Increased extraction-induced sediment dispersal towards far-field benthic habitats is of environmental impact concern. Both fining of sediment (e.g., clogging of the pores of permeable coarse sands) and sediment burial (i.e., overtopping with sand) are studied (Van Lancker et al., 2015; 2016; Montereale Gavazzi et al., 2018). Drivers and causal relationships with all human-induced sediment dispersal are under investigation.
The main sediment transition caused by years of intermittent and intensive extraction was found on the upper parts of the sandbank slope, where backscatter values dropped, carbonate content decreased and organic matter content increased. This may be related to a spreading of the more homogeneous, very well-sorted medium sands from the sandbank crest to the upper parts of the sandbank slope. However, there are signs of a slow return to the original sediment characteristics. How acoustic and sediment parameters relate to each other can be found in the next section. How hydrodynamics and sediment transport are changing due to the lowering sandbank volume is beyond the scope of this article.
5.2 Acoustic-sediment relationships in heavily extracted sandbanks
The Hinder Banks in the Belgian part of the North Sea are studied acoustically, biologically and physically (see De Mol and Vandenreyken, 2014; Degrendele and Vandenreyken, 2017; Vandenreyken, 2021). Correlations between acoustic backscatter and sediment grain size, mean and sorting in soft sediments are generally accepted (see, for example, Montereale Gavazzi et al., 2018; Gaida et al., 2019), but complex. De Falco et al. (2010) distinguished three sedimentary facies (sandy gravels, gravelly sands and slightly gravelly muddy sand) based on a factor analysis of grain size and acoustic data. Backscatter was strongly correlated to the weight percentage of coarse fractions (1–16 mm) and inversely correlated to finer sediment (0.016–0.5 mm). Huang et al. (2018) assumed that 1) an increase in grain size (resulting in an increase in heterogeneity) from very fine to medium sands would increase acoustic absorption and a decrease in backscatter response, while from medium to very coarse sands the reverse was observed (Hamilton, 1980); 2) a positive correlation exists between mean size and backscatter return (Ferrini and Flood, 2006); and 3) sorting can decrease by greater proportions of either coarser grains resulting in backscatter increase or finer grains resulting in backscatter decrease. Gaida et al. (2020) confirmed grain-size sorting patterns across rapidly generated bedforms after underwater nourishments using multibeam bathymetric and backscatter time series. Coarse sediments with shell fragments on the stoss side were observed as high acoustic classes; sandy sediments near the crests and sandy mud on the lee side and in the troughs as low acoustic classes. The extent to which backscatter can be used to resolve sediment sorting along bedforms depends on the relationship between the wavelength of the bedform and the acoustic resolution of the multibeam (Gaida et al., 2020).
Some of the above acoustic-sediment relationships are confirmed by measurements on the Hinder Banks, although rougher sea conditions in March 2021 on sector 4a caused an underestimation of the backscatter values complicating the Pearson correlations (Figure 11). Therefore, separate correlation matrices were made for both sector 4a and sector 4c (Table 4). A positive correlation between extraction and bathymetry was found from the spatially well-spreaded data of sector 4a, as most of the intensive extraction activities take place on the sandbank crest or upper parts of the Stoss slope, and are limited in the troughs or deeper parts of the sandbank slopes. A negative correlation between extraction and backscatter was derived from the acoustic time series of sector 4c, although sandbanks were extracted intermittently indicating that the seabed cannot recover from the disturbance between two intensive extraction events. Sediment parameters affect backscatter (Figure 11; Table 4). Medium sand, coarse sand, mean size and sorting are the main determining factors of the acoustic response in sector 4a. Fine sand, coarse sand and shell material related to the carbonate content, and mean size determine backscatter values in sector 4c. Both geological (e.g., grain size) and geotechnical (e.g., sorting; i.e., a proxy for porosity) parameters affect the backscatter in a recently disturbed extracted sandbank system (e.g., sector 4a from 2019 to 2021). Focusing on the upper parts of the sandbank slope and on the sandbank crest, where longer intermittent and intensive sand extraction occurred (e.g., sector 4c from 2012 to 2019), a correlation was confirmed between backscatter decrease and the decrease in carbonate content.
5.3 Future outlook for seabed monitoring
A number of recommendations and lessons learned regarding remote monitoring of sand extraction can be made. These relate to: 1) extraction within the natural variability of sandbank systems, 2) simultaneous acquisition of acoustic and sediment data, 3) proper selection of sampling equipment, 4) avoiding positioning errors and 5) and awareness of other distortions.
The natural variability of sandbank systems is best studied before the intensive sand extraction takes place, i.e., in terms of geomorphology, sandwave migration, sediment distribution and geology. However, as long as extraction takes place in the homogeneous layer on the crest, no irreversible changes or major disruptions of the sediment type are expected. This is not the case when sand is extracted in the more heterogeneous parts of the sandbank slopes. To account for spatial variability, acoustic measurements and sediment samples best cover the entire sandbank system, from trough to crest, even when human activities are very local.
Simultaneous acquisition of acoustic and sediment data improves correlation between both data types as subsequent sandwave movement and sand extraction, affecting acoustic backscatter and sediment composition, are excluded. The very large sand dunes that shape the upper parts of the sandbanks have wavelength ranges from 100 to 250 m and maximum heights from 2 to 5 m (Terseleer et al., 2019) leading to grain-size changes and sorting of the seabed sediments from trough to crest (Svenson et al., 2009; Bellec et al., 2019; Koop et al., 2019; Cheng et al., 2020). Moreover, considerable variability in individual species, biomass and taxon densities of macrobenthic communities is found on the short and steep Lee slopes of the sand waves, while the long and gentle Stoss slopes are mainly controlled by physical forces, such as grain size and permeability (Cheng et al., 2021). This also influences small-scale variability of 10–100 m within benthic communities (Cheng et al., 2021). Continuous sand extraction disrupts morphological, sedimentological and ecological systems by removing the top layer, but subsequent sediment dispersal and sediment plume formation leads to increased turbidity and finer sedimentation, which may also affect the acoustic backscatter. Acoustic-sediment relationships will also benefit from a calibrated system for multibeam bathymetry and backscatter.
Proper selection of sampling equipment is necessary to account for acoustic-sediment relationships, as multibeam with an operating frequency of 300 kHz only penetrates sandy substrates around a few centimeters (Huff, 2008; Lurton and Lamarche, 2015). Grab samples, which produce a disturbed sample of the upper 10–20 cm and having a potential outwash of fine material during retrieval, are less suitable than box cores, where the distortion is minimal and subsamples of the top centimeters can be taken (Kint et al., 2020). Although the sieved fraction above 1 mm is included into the grain size distribution of the Malvern Mastersizer 3,000 laser particle analysis, the small size of the 1-cm slices is not the best approach for quantifying shell percentages. The range of sedimentological parameters (on which fractions) should be further specified and extended to individual gravel classes, such as large shell fragments from 2 to 4 mm, 4–8 mm or even 8–16 mm.
Avoiding positioning errors is crucial for optimal correlation between acoustic and sediment data, as resampling at a precise location on the seafloor is impossible due to the navigability and maneuverability of vessels and the prevailing hydrodynamic conditions. Natural variability of seabed sediments and habitats affects the acoustic backscatter. The positional errors include navigational accuracy (instrumental error), on-board and off-deck offsets (human error) and underwater drift of the used gear (environmental error) (Kint et al., 2020). Instrumental and human errors are best corrected for on-board operations. The environmental error can be avoided by an underwater High Precision Acoustic Positioning system (e.g., HiPAP® and GAP® system) that can be attached to the frame of the lowered sampling device.
In areas of high sediment dynamics, further backscatter distortions may occur that may be unrelated to seabed changes. Suspended sediments near the bottom can be detected with the acoustic signal of the 300 kHz multibeam bathymetry and backscatter, masking the true backscatter response of the seabed (Fromant et al., 2021). High turbidity in the water column affects transmission losses (Montereale-Gavazzi et al., 2019). Seasonal biological activity in the water column (e.g., plankton) and on the seabed (related to the spawning and recruitment period of benthic species) interferes with the acoustic signal. The presence or absence of ecosystem engineers (e.g., tubeworms and some bivalves) on soft substrates strongly influences the acoustic backscatter (Degraer et al., 2008; Van Lancker et al., 2012; Holler et al., 2016; Montereale-Gavazzi et al., 2016).
Data availability statement
The datasets presented in this study can be found in online repositories. The sediment dataset enriched with bathymetry and backscatter values for each sample is available in the national data repository of the Belgian Marine Data Centre via https://doi.org/10.24417/bmdc.be:dataset:2700.
Author contributions
LK and VVL collected the sediment samples. FB, KD, and MR acquired and processed the MBES bathymetry and backscatter. LK analyzed the acoustic and sediment data. All authors discussed the results and contributed to the final manuscript by providing critical feedback and input. LK wrote the manuscript. All authors contributed to the article and approved the submitted version.
Funding
This paper is a contribution to the monitoring program of the impact of marine aggregate extraction in the Hinder Banks area (Flemish Authorities MOZ4; contract 211.177). The research was fully supported by the ZAGRI project, a federal Belgian program for continuous monitoring of sand and gravel extraction, paid from private revenues. Further, it contributes to the national Belgian Marine Strategy Framework Directive (MSFD; 2008/56/EC) monitoring program on seafloor integrity.
Acknowledgments
The crew of the RV Belgica A962 is acknowledged for the cooperation during the numerous campaigns dedicated to acoustic data acquisition and sediment sampling, as well as the Belgian Science Policy (Belspo) and RBINS-OD Nature for providing ship time. The Measurement Service Ostend (RBINS), the Continental Shelf Service (FPS Economy) and the sedimentological laboratory of the Department of Geology (Ghent University) are acknowledged for the acquisition of the EMS, processing of the MBES bathymetry and backscatter and analyzing the sediment data, respectively.
Conflict of interest
The authors declare that the research was conducted in the absence of any commercial or financial relationships that could be construed as a potential conflict of interest.
Publisher’s note
All claims expressed in this article are solely those of the authors and do not necessarily represent those of their affiliated organizations, or those of the publisher, the editors and the reviewers. Any product that may be evaluated in this article, or claim that may be made by its manufacturer, is not guaranteed or endorsed by the publisher.
References
Agnesi, S., Annunziatellis, A., Chaniotis, P., Mo, G., Korpinen, S., Snoj, L., et al. (2020). Spatial analysis of marine protected area networks in Europe’s seas III. Scientific report. Magdeburg: european environment agency. https://www.eionet.europa.eu/etcs/etc-icm/products/etc-icm-reports/etc-icm-report-3-2020-spatial-analysis-of-marine-protected-area-networks-in-europe2019s-seas-iii (accessed January 1, 2023).
Bartholomä, A. (2006). Acoustic bottom detection and seabed classification in the German Bight, southern North Sea. Geo-Marine Lett. 26, 177–184. doi:10.1007/s00367-006-0030-6
Becker, J., van Eekelen, E., van Wiechen, J., de Lange, W., Damsma, T., Smolders, T., et al. (2015). Estimating source terms for far field dredge plume modelling. J. Environ. Manag. 149, 282–293. doi:10.1016/j.jenvman.2014.10.022
Bellec, V. K., Bøea, R., Bjarnadóttir, L. R., Albretsen, J., Dolan, M., Chand, S., et al. (2019). Sandbanks, sandwaves and megaripples on spitsbergenbanken, barents sea. Mar. Geol. 416, 105998. doi:10.1016/j.margeo.2019.105998
Bellec, V. K., Van Lancker, V., Degrendele, K., Roche, M., and Le Bot, S. (2010). Geo-environmental characterization of the kwinte bank. J. Coast. Res. 51, 63–76. doi:10.2112/SI51-006.1
Blott, S. J., and Pye, K. (2001). Gradistat: A grain size distribution and statistics package for the analysis of unconsolidated sediments. Earth Surf. Process. Landforms 26, 1237–1248. doi:10.1002/esp.261
Bøe, R., Skarðhamar, J., Rise, L., Dolan, M. F., Bellec, V. K., Winsborrow, M., et al. (2015). Sandwaves and sand transport on the Barents Sea continental slope offshore northern Norway. Mar. Petroleum Geol. 60, 34–53. doi:10.1016/j.marpetgeo.2014.10.011
Caballero, I., Navarro, G., and Ruiz, J. (2018). Multi-platform assessment of turbidity plumes during dredging operations in a major estuarine system. Int. J. Appl. Earth Observation Geoinformation 68, 31–41. doi:10.1016/j.jag.2018.01.014
Cheng, C. H., Borsje, B. W., Beauchard, O., O’Flynn, S., Ysebaert, T., and Soetaert, K. (2021). Small-scale macrobenthic community structure along asymmetrical sand waves in an underwater seascape. Mar. Ecol. 42, 3. doi:10.1111/maec.12657
Cheng, C. H., Soetaert, K., and Borsje, B. W. (2020). Sediment characteristics over asymmetrical tidal sand waves in the Dutch North Sea. J. Mar. Sci. Eng. 8, 409. doi:10.3390/jmse8060409
Cooper, K. M., Barrio Froján, C. R. S., Defew, E., Curtis, M., Fleddum, A., Brooks, L., et al. (2008). Assessment of ecosystem function following marine aggregate dredging. J. Exp. Mar. Biol. Ecol. 366 (1-2), 82–91. doi:10.1016/j.jembe.2008.07.011
Cooper, K. M., and Barry, J. (2017). A big data approach to macrofaunal baseline assessment, monitoring and sustainable exploitation of the seabed. Sci. Rep. 7, 12431. doi:10.1038/s41598-017-11377-9
Cooper, K. M. (2013). Marine aggregate dredging: A new regional approach to environmental monitoring. PhD Thesis. Norwich: University of East Anglia. https://ueaeprints.uea.ac.uk/id/eprint/48093/1/PhD_THESIS_KEITH_COOPER.pdf (accessed January 1, 2023).
Cutroneo, L., Castellano, M., Pieracci, A., Povero, P., Tucci, S., and Capello, M. (2012). The use of a combined monitoring system for following a turbid plume generated by dredging activities in a port. J. Soils Sediments 12, 797–809. doi:10.1007/s11368-012-0486-0
De Backer, A., Breine, N., Hillewaert, H., Pecceu, E., Ranson, J., Van Hoey, G., et al. (2017). “Ecological assessment of intense aggregate dredging activity on the Belgian part of the North Sea,” in Belgian marine sand: A scarce resource? Editors K. Degrendele, and H. Vandenreyken (Brussels: Federal Public Service Economy), 47–66. Available at: https://economie.fgov.be/sites/default/files/Files/Entreprises/Sand/Belgian-marine-sand-a-scarce-resource-study-day-2017.pdf (Accessed January 1, 2023).
De Falco, G., Tonielli, R., Di Martino, G., Innangi, S., Simeone, S., and Parnum, I. M. (2010). Relationships between multibeam backscatter, sediment grain size and Posidonia oceanica seagrass distribution. Cont. Shelf Res. 30 (18), 1941–1950. doi:10.1016/j.csr.2010.09.006
De Mol, L., and Vandenreyken, H. (Editors) (2014). ‘Which future for the sand extraction in the Belgian part of the North Sea?'. Brussels: Federal Public Service Economy—Continental Shelf Service.
de Moustier, C., and Alexandrou, D. (1991). Angular dependence of 12-kHz seafloor acoustic backscatter. J. Acoust. Soc. Am. 90 (1), 522–531. doi:10.1121/1.401278
Dean, W. E. (1974). Determination of carbonate and organic matter in calcareous sediments and sedimentary rocks by loss on ignition: comparison with other methods. J. Sediment. Petrology 44 (1), 242–248. doi:10.1306/74D729D2-2B21-11D7-8648000102C1865D
Degraer, S., Moerkerke, G., Rabaut, M., van Hoey, G., Du Four, I., Vincx, M., et al. (2008). Very-high resolution side-scan sonar mapping of biogenic reefs of the tube-worm Lanice conchilega. Remote Sens. Environ. 112 (8), 3323–3328. doi:10.1016/j.rse.2007.12.012
Degrendele, K., Roche, M., Schotte, P., Van Lancker, V., Bellec, V. K., and Bonne, W. M. I. (2010). Morphological evolution of the Kwinte Bank central depression before and after the cessation of aggregate extraction. J. Coast. Res. 51, 77–86. doi:10.2112/SI51-007.1
Degrendele, K., and Vandenreyken, H. (Editors) (2017). Belgian marine sand: A scarce resource?. Brussels: Federal Public Service Economy—Continental Shelf Service.
Desprez, M. (2000). Physical and biological impact of marine aggregate extraction along the French coast of the eastern English channel: short- and long-term post-dredging restoration. ICES J. Mar. Sci. 57 (5), 1428–1438. doi:10.1006/jmsc.2000.0926
Duclos, P.-A., Lafite, R., Le Bot, S., Rivoalen, E., and Cuvilliez, A. (2013). Dynamics of turbid plumes generated by marine aggregate dredging:an example of a Macrotidal environment (the bay of seine, France). J. Coast. Res. 29 (6a), 25–37. doi:10.2112/JCOASTRES-D-12-00148.1
European Commission (2008b). “Directive 2008/56/EC of the European Parliament and of the Council of 17 June 2008 establishing a framework for community action in the field of marine environmental policy (Marine Strategy Framework Directive),” in Official journal of the European union (Brussels: European Commission).
European Commission (2009). “Directive 2009/147/EC of the European parliament and of the council of 30 november 2009 on the conservation of wild birds,” in Official journal of the European union (Brussels: European Commission).
European Commission (2008a). Natura 2000: Protecting Europe’s biodiversity. Brussels: Scientific report. Brussels: European Commission.
European Economic Community (1992). “Council Directive 92/43/EEC of 21 May 1992 on the conservation of natural habitats and of wild fauna and flora,” in Official journal of the European communities (Brussels: European Commission).
Ferrini, V. L., and Flood, R. D. (2006). The effects of fine-scale surface roughness and grain size on 300 kHz multibeam backscatter intensity in sandy marine sedimentary environments. Mar. Geol. 228 (1-4), 153–172. doi:10.1016/j.margeo.2005.11.010
Foster, G., Walker, B. K., and Riegl, B. M. (2009). Interpretation of single-beam acoustic backscatter using lidar-derived topographic complexity and benthic habitat classifications in a coral reef environment. J. Coast. Res. 53, 16–26. doi:10.2112/SI53-003.1
Freitas, R., Silva, S., Quintino, V., Rodrigues, A. M., Rhynas, K., and Collins, W. T. (2003). Acoustic seabed classification of marine habitats: studies in the western coastal-shelf area of Portugal. ICES J. Mar. Sci. 60 (3), 599–608. doi:10.1016/S1054-3139(03)00061-4
Fromant, G., Le Dantec, N., Perrot, Y., Floc’h, F., Lebourges-Dhaussy, A., and Delacourt, C. (2021). Suspended sediment concentration field quantified from a calibrated MultiBeam EchoSounder. Appl. Acoust. 180, 108107. doi:10.1016/j.apacoust.2021.108107
Gaida, T. C., Snellen, M., van Dijk, T. A. G. P., and Simons, D. G. (2019). Geostatistical modelling of multibeam backscatter for full-coverage seabed sediment maps. Hydrobiologia 845, 55–79. doi:10.1007/s10750-018-3751-4
Gaida, T. C., van Dijk, T. A. G. P., Snellen, M., Vermaas, T., Mesdag, C., and Simons, D. G. (2020). Monitoring underwater nourishments using multibeam bathymetric and backscatter time series. Coast. Eng. 158, 103666. doi:10.1016/j.coastaleng.2020.103666
Gonçalves, D. S., Pinheiro, L. M., Silva, P. A., Rosa, J., Rebêlo, L., Bertin, X., et al. (2014). Morphodynamic evolution of a sand extraction excavation offshore Vale do Lobo, Algarve, Portugal. Coast. Eng. 88, 75–87. doi:10.1016/j.coastaleng.2014.02.001
Graca, B., Burska, D., and Matuszewska, K. (2004). The impact of dredging deep pits on organic matter decomposition in sediments. Water, Air, Soil Pollut. 158, 237–259. doi:10.1023/B:WATE.0000044853.63461.53
Gutperlet, R., Capperucci, R. M., Bartholomä, A., and Kröncke, I. (2017). Relationships between spatial patterns of macrofauna communities, sediments and hydroacoustic backscatter data in a highly heterogeneous and anthropogenic altered environment. J. Sea Res. 121, 33–46. doi:10.1016/j.seares.2017.01.005
Hademenos, V., Stafleu, J., Missiaen, T., Kint, L., and Van Lancker, V. (2018). 3D subsurface characterisation of the Belgian continental shelf: A new voxel modelling approach. Neth. J. Geosciences 98, e1. doi:10.1017/njg.2018.18
Hamilton, E. L. (1980). Geoacoustic modeling of the sea floor. J. Acoust. Soc. Am. 68 (5), 1313–1340. doi:10.1121/1.385100
Heiri, O., Lotter, A. F., and Lemcke, G. (2001). Loss on ignition as a method for estimating organic and carbonate content in sediments: reproducibility and comparability of results. J. Paleolimnol. 25, 101–110. doi:10.1023/A:1008119611481
Holler, P., Markert, E., Bartholomä, A., Capperucci, R., Hass, H. C., Kröncke, I., et al. (2016). Tools to evaluate seafloor integrity: comparison of multi-device acoustic seafloor classifications for benthic macro fauna-driven patterns in the German bight, southern North Sea. Geo-Marine Lett. 37, 93–109. doi:10.1007/s00367-016-0488-9
Huang, Z., Siwabessy, J., Cheng, H., and Nichol, S. (2018). Using multibeam backscatter data to investigate sediment-acoustic relationships. J. Geophys. Res. Oceans 123 (7), 4649–4665. doi:10.1029/2017JC013638
Huff, L. C. (2008). “Acoustic remote sensing as a tool for habitat mapping in Alaska waters,” in Marine habitat mapping technology for Alaska. Editors J. Reynolds, and H. Greene (Alaska Sea Grant: Fairbanks).
Hughes Clarke, J. E. (2012). “Optimal use of multibeam technology in the study of shelf morphodynamics,” in Sediments, morphology, and sedimentary processes on continental shelves: Advances in Technologies, research, and applications. Editors M. Z. Li, C. R. Sherwood, and P. R. Hill (Chichester: Wiley-Blackwell), 44.
ICES (2007). Acoustic seabed classification of marine physical and biological landscapes. ICES Cooperative Research Report https://www.vliz.be/imisdocs/publications/125836.pdf (accessed January 1, 2023).286
ICES (2022). Marine aggregate extraction and the marine strategy framework directive: A review of existing research. ICES Coop. Res. Rep. 354. doi:10.17895/ices.pub.19248542
ICES (2019). Working group on the effects of extraction of marine sediments on the marine ecosystem (WGEXT). ICES Coop. Res. Rep. 1, 87. doi:10.17895/ices.pub.5733
Jackson, D. R., and Briggs, K. B. (1992). High-frequency bottom backscattering: roughness versus sediment volume scattering. J. Acoust. Soc. Am. 92, 962–977. doi:10.1121/1.403966
John, E. (2009). The impacts of sand mining in kallada river (pathanapuram taluk), Kerala. J. Basic Appl. Biol. 3 (1-2), 108–113.
Kim, N.-H., Pham, V. S., Hwang, J. H., Won, N. I., Ha, H. K., Im, J., et al. (2018). Effects of seasonal variations on sediment-plume streaks from dredging operations. Mar. Pollut. Bull. 129, 26–34. doi:10.1016/j.marpolbul.2018.02.014
Kint, L., Hademenos, V., De Mol, R., Stafleu, J., van Heteren, S., and Van Lancker, V. (2020). Uncertainty assessment applied to marine subsurface datasets. Q. J. Eng. Geol. Hydrogeology 54, 1. doi:10.1144/qjegh2020-028
Kint, L., Terseleer, N., and Van Lancker, V. (2019). “Multi-scale (or multiresolution) analysis of sandbank features optimising geomorphological mapping of sandy shelf environments: belgian part of the North Sea,” in Books of abstracts of the international conference of marine and river dune dynamics (MARID VI). Editors A. Lefebvre, T. Garlan, and C. Winter 127–133 https://www.marum.de/Binaries/Binary18548/MARIDVI-Books-of-proceedings.pdf (accessed January 1, 2023).
Kloser, R. J., Penrose, J. D., and Butler, A. J. (2010). Multi-beam backscatter measurements used to infer seabed habitats. Cont. Shelf Res. 30 (16), 1772–1782. doi:10.1016/j.csr.2010.08.004
Koop, L., Amiri-Simkooei, A., van der Reijden, K. J., O’Flynn, S., Snellen, M., and Simons, D. G. (2019). Seafloor classification in a sand wave environment on the Dutch continental shelf using multibeam echosounder backscatter data. Geosciences 9, 3. doi:10.3390/geosciences9030142
Krause, J. C., Diesing, M., and Arlt, G. (2010). The physical and biological impact of sand extraction: A case study of the western baltic sea. J. Coast. Res. 51, 215–226. doi:10.2112/SI51-020.1
Kubicki, A., Manso, F., and Diesing, M. (2007). Morphological evolution of gravel and sand extraction pits, Tromper Wiek, Baltic Sea. Coast. Shelf Sci. 71 (3-4), 647–656. doi:10.1016/j.ecss.2006.09.011
Lamarche, G., and Lurton, X. (2018). Recommendations for improved and coherent acquisition and processing of backscatter data from seafloor-mapping sonars. Mar. Geophys. Res. 39, 5–22. doi:10.1007/s11001-017-9315-6
Lamarche, G., Lurton, X., Verdier, A.-L., and Augsutin, J.-M. (2011). Quantitative characterisation of seafloor substrate and bedforms using advanced processing of multibeam backscatter—application to cook strait, New Zealand. Cont. Shelf Res. 31 (2), 93–109. doi:10.1016/j.csr.2010.06.001
Le Gonidec, Y., Lamarche, G., and Wright, I. C. (2003). Inhomogeneous substrate analysis using EM300 backscatter imagery. Mar. Geophys. Res. 24, 311–327. doi:10.1007/s11001-004-1945-9
Lurton, X., and Lamarche, G. (2015). “Backscatter measurements by seafloor-mapping sonars. Guidelines and recommendations. A collective report by members of the GeoHab Backscatter Working Group,” in Scientific report (Plouzané (Bretagne): IFREMER). https://niwa.co.nz/static/BWSG_REPORT_MAY2015_web.pdf (accessed January 1, 2023).
Mielck, F., Hass, H. C., Michaelis, R., Sander, L., Papenmeier, S., and Wiltshire, K. H. (2019). Morphological changes due to marine aggregate extraction for beach nourishment in the German Bight (SE North Sea). Geo-Marine Lett. 39, 47–58. doi:10.1007/s00367-018-0556-4
Montereale-Gavazzi, G., Madricardo, F., Janowski, L., Kruss, A., Blondel, P., Sigovini, M., et al. (2016). Evaluation of seabed mapping methods for fine-scale classification of extremely shallow benthic habitats – application to the Venice Lagoon, Italy. Italy. Estuar. Coast. Shelf Sci. 170, 45–60. doi:10.1016/j.ecss.2015.12.014
Montereale-Gavazzi, G., Roche, M., Degrendele, K., Lurton, X., Terseleer, N., Baeye, M., et al. (2019). Insights into the short-term tidal variability of multibeam backscatter from field experiments on different seafloor types. Geosciences 9, 34. doi:10.3390/geosciences9010034
Montereale-Gavazzi, G., Roche, M., Lurton, X., Degrendele, K., Terseleer, N., and Van Lancker, V. (2018). Seafloor change detection using multibeam echosounder backscatter: case study on the Belgian part of the North Sea. Mar. Geophys. Res. 39, 229–247. doi:10.1007/s11001-017-9323-6
Mulitza, S., Prange, M., Stuut, J.-B., Zabel, M., von Dobeneck, T., Itambi, A. C., et al. (2008). Sahel megadroughts triggered by glacial slowdowns of Atlantic meridional overturning. Paleoceanogr. Paleoclimatology 23, 4. doi:10.1029/2008PA001637
Mumm, (2011). “Application by the agency for Maritime and coastal services, coastal division (MDK) to obtain a concession within sector 4 (in sector 4a, 4b, 4c and 4d),” in Opinion of the council. Environmental impact assessment (Brussels: RBINS-MUMM).
Nairn, R., Johnson, J. A., Hardin, D., and Michel, J. (2004). A biological and physical monitoring program to evaluate long-term impacts from sand dredging operations in the United States outer continental shelf. J. Coast. Res. 20 (1), 126–137. doi:10.2112/1551-5036(2004)20[126:ABAPMP]2.0.CO;2
Newell, R., Seiderer, L., and Hitchcock, D. (1998). The impact of dredging works in coastal waters: A review of the sensitivity to disturbance and subsequent recovery of biological resources on the seabed. Oceanogr. Mar. Biol. Annu. Rev. 36, 127–178.
Parnum, I., and Gavrilov, A. (2012). “High-frequency seafloor acoustic backscatter from coastal marine habitats of Australia,” in Proceedings of the acoustical society of Australia, fremantle. Editor McMinn (Sydney: Australian Acoustical Society). http://www.acoustics.asn.au/conference_proceedings/AAS2012/papers/p93.pdf (accessed January 1, 2023).
Peduzzi, P. (2014). Sand, rarer than one thinks. Environ. Dev. 11, 208–218. doi:10.1016/j.envdev.2014.04.001
Roche, M., Degrendele, K., Vandenreyken, H., and Schotte, P. (2017). “Multi time and space scale monitoring of the sand extraction and its impact on the seabed by coupling EMS data and MBES measurements,” in Belgian marine sand: A scarce resource? Editors K. Degrendele, and H. Vandenreyken (Brussels: Federal Public Service Economy), 5–38. https://economie.fgov.be/sites/default/files/Files/Entreprises/Sand/Belgian-marine-sand-a-scarce-resource-study-day-2017.pdf (accessed January 1, 2023).
Roche, M., Degrendele, K., Vrignaud, C., Loyer, S., Le Bas, T., Augustin, J.-M., et al. (2018). Control of the repeatability of high frequency multibeam echosounder backscatter by using natural reference areas. Mar. Geophys. Res. 39, 89–104. doi:10.1007/s11001-018-9343-x
Roman-Sierra, J., Navarro, M., Muñoz-Perez, J. J., and Gomez-Pina, G. (2011). Turbidity and other effects resulting from trafalgar sandbank dredging and palmar beach nourishment. J. Waterw. Port, Coast. Ocean Eng. 137 (6), 332–343. doi:10.1061/(ASCE)WW.1943-5460.0000098
Seo, J. Y., Ha, H. K., Im, J., Hwang, J. H., Choi, S. M., Won, N.-I., et al. (2018). Impact of seasonal vertical stratification on the dispersion patterns of dredging plumes off the south coast of Korea. Mar. Geol. 395, 14–21. doi:10.1016/j.margeo.2017.09.005
Smith, S. J., and Friedrichs, C. T. (2011). Size and settling velocities of cohesive flocs and suspended sediment aggregates in a trailing suction hopper dredge plume. Cont. Shelf Res. 31, 50–63. doi:10.1016/j.csr.2010.04.002
Spearman, J. (2015). A review of the physical impacts of sediment dispersion from aggregate dredging. Mar. Pollut. Bull. 94 (1-2), 260–277. doi:10.1016/j.marpolbul.2015.01.025
Sutherland, T. F., Galloway, J., Loschiavo, R., Levings, C. D., and Hare, R. (2007). Calibration techniques and sampling resolution requirements for groundtruthing multibeam acoustic backscatter (EM3000) and QTC VIEW™ classification technology. Estuar. Coast. Shelf Sci. 75 (4), 447–458. doi:10.1016/j.ecss.2007.05.045
Svenson, C., Ernstsen, V. B., Winter, C., Bartholomä, A., and Hebbeln, D. (2009). Tide-driven sediment variations on a large compound dune in the jade tidal inlet channel, southeastern North Sea. J. Coast. Res. 56, 361–365. https://www.jstor.org/stable/25737598.
Terseleer, N., Degrendele, K., Kint, L., Roche, M., Van den Eynde, D., and Van Lancker, V. (2019). “Automated estimation of seabed morphodynamic parameters,” in Books of abstracts of the international conference of marine and river dune dynamics (MARID VI). Editors A. Lefebvre, T. Garlan, and C. Winter 219–224 https://www.marum.de/Binaries/Binary18548/MARIDVI-Books-of-proceedings.pdf (accessed January 1, 2023).
TILES Consortium (2018a). TILES voxel model subsurface of the Belgian part of the North Sea. Brain-Be project TILES (transnational and integrated long-term marine exploitation strategies, BR/121/A2/TILES). Brussels: Belgian Science Policy. doi:10.24417/bmdc.be:dataset:2721
TILES Consortium (2018b). TILES voxel model subsurface of the hinder Banks. Brain-Be project TILES (transnational and integrated long-term marine exploitation strategies, BR/121/A2/TILES). Brussels: Belgian Science Policy. doi:10.24417/bmdc.be:dataset:2720
UNEP (2022). Sand and sustainability: 10 strategic recommendations to avert a crisis. Scientific report. Geneva: United Nations Environment Programme.
UNEP (2019). Sand and Sustainability: Finding new solutions for environmental governance of global sand resources. Scientific report. Geneva: United Nations Environment Programme.
Uścinowicz, S., Jegliński, W., Miotk-Szpiganowicz, G., Nowak, J., Pączek, U., Przezdziecki, P., et al. (2014). Impact of sand extraction from the bottom of the southern Baltic Sea on the relief and sediments of the seabed. Oceanologia 56 (4), 857–880. doi:10.5697/oc.56-4.857
Van den Branden, R., De Schepper, G., and Naudts, L. (2022). Electronic monitoring system (EMS): Overview data report 2021 and 2003-2021. Scientific report MDO/2022-02/ZAGRI. Ostend: RBINS-MDO.
Van Lancker, V., Baeye, M., Evangelinos, D., and Van den Eynde, D. (2015). “Monitoring of the impact of the extraction of marine aggregates, in casu sand, in the zone of the Hinder Banks,” in Period 1/1 – 31/12 2014. Scientific report MOZ4-ZAGRI/I/VVL/201502/EN/SR01 (Brussels: RBINS-OD Nature). https://www.vliz.be/imisdocs/publications/ocrd/268906.pdf (accessed January 1, 2023).
Van Lancker, V., Baeye, M., Montereale Gavazzi, G., Kint, L., Terseleer, N., and Van den Eynde, D. (2020). “Monitoring of the impact of the extraction of marine aggregates, in casu sand,” in The zone of the hinder Banks (Brussels: RBINS-OD Nature). Period 1/1 – 31/12 2019 and Synthesis of results 2016-2019. Scientific report MOZ4-ZAGRI/I/VVL/2020/EN/SR01 https://www.vliz.be/imisdocs/publications/360415.pdf (accessed January 1, 2023).
Van Lancker, V., Baeye, M., Montereale-Gavazzi, G., and Van den Eynde, D. (2016). “Monitoring of the impact of the extraction of marine aggregates, in casu sand,” in The zone of the Hinder Banks. Period 1/1 –31/12 2015 and Synthesis of results 2011-2015. Scientific report MOZ4-ZAGRI/I/VVL/2016/EN/SR01 (Brussels: RBINS-OD Nature). https://www.vliz.be/imisdocs/publications/360415.pdf (accessed January 1, 2023).
Van Lancker, V., and Baeye, M. (2015). Wave glider monitoring of sediment transport and dredge plumes in a shallow marine sandbank environment. PLoS ONE 10, e0128948. doi:10.1371/journal.pone.0128948
Van Lancker, V., Moerkerke, G., Du Four, I., Verfaillie, E., Rabaut, M., and Degraer, S. (2012). “14 - fine-scale geomorphological mapping of sandbank environments for the prediction of macrobenthic occurrences, Belgian part of the North Sea,” in Seafloor geomorphology as benthic habitat. GeoHAB atlas of seafloor geomorphic features and benthic habitats. Editors P. T. Harris, and E. K. Baker (Amsterdam: Elsevier), 251–260. doi:10.1016/B978-0-12-385140-6.00014-1
Van Lancker, V., Vandenreyken, H., De Backer, A., Lauwaert, B., Lescroart, J., and De Raedemaecker, F. (2022). “Sand and gravel extraction,” in Knowledge guide coast and sea 2022 - compendium for coast and sea 67–78. https://www.vliz.be/imisdocs/publications/372572.pdf (accessed January 1, 2023).
Vanaverbeke, J., Gheskiere, T., and Vincx, M. (2000). The meiobenthos of subtidal sandbanks on the Belgian continental shelf (southern bight of the North Sea). Estuar. Coast. Shelf Sci. 51 (5), 637–649. doi:10.1006/ecss.2000.0703
Vandenreyken, H. (Editor) (2021). A 360° perspective on sea sand (Brussels: Federal Public Service Economy - Continental Shelf Service). https://economie.fgov.be/sites/default/files/Files/Entreprises/Sand/a-360-perspective-on-sea-sand-%20poceedings-study-day.pdf (accessed January 1, 2023).
Veenstra, H. J. (1969). Gravels of the southern North Sea. Mar. Geol. 7, 449–464. doi:10.1016/0025-3227(69)90017-6
Waye-Barker, G. A., McIlwaine, P., Lozach, S., and Cooper, K. M. (2015). The effects of marine sand and gravel extraction on the sediment composition and macrofaunal community of a commercial dredging site (15 years post-dredging). Mar. Pollut. Bull. 99 (1-2), 207–215. doi:10.1016/j.marpolbul.2015.07.024
Wyns, L., Roche, M., Barette, F., Van Lancker, V., Degrendele, K., Hostens, K., et al. (2021). Near-field changes in the seabed and associated macrobenthic communities due to marine aggregate extraction on tidal sandbanks: A spatially explicit bio-physical approach considering geological context and extraction regimes. Cont. Shelf Res. 229, 104546. doi:10.1016/j.csr.2021.104546
Keywords: Hinder Banks, non-screened sand extraction, intermittent disturbance, multibeam-sediment relationships, sediment variability
Citation: Kint L, Barette F, Degrendele K, Roche M and Van Lancker V (2023) Sediment variability in intermittently extracted sandbanks in the Belgian part of the North Sea. Front. Earth Sci. 11:1154564. doi: 10.3389/feart.2023.1154564
Received: 30 January 2023; Accepted: 18 August 2023;
Published: 31 August 2023.
Edited by:
Lukasz Janowski, Gdynia Maritime University, PolandReviewed by:
Philippe Blondel, University of Bath, United KingdomKatrien Van Landeghem, Bangor University, United Kingdom
Irène Mopin, Institut National des Technologies Avancées de Bretagne (ENSTA Bretagne), France
Copyright © 2023 Kint, Barette, Degrendele, Roche and Van Lancker. This is an open-access article distributed under the terms of the Creative Commons Attribution License (CC BY). The use, distribution or reproduction in other forums is permitted, provided the original author(s) and the copyright owner(s) are credited and that the original publication in this journal is cited, in accordance with accepted academic practice. No use, distribution or reproduction is permitted which does not comply with these terms.
*Correspondence: Lars Kint, lkint@naturalsciences.be