Fracture propagation induced by hydraulic fracturing using microseismic monitoring technology: Field test in CBM wells in Zhengzhuang region, Southern Qinshui Basin, China
 Jinbin Zhao1,4
  Peng Liu
- 1State Key Laboratory of Coal and CBM Co-mining, Jincheng, China
- 2State Key Laboratory of Coal Mine Disaster Dynamics and Control, Chongqing University, Chongqing, China
- 3Shanxi Lanyan Coalbed Methane Group Co., Ltd., Jincheng, China
- 4Yi'an-Lanyan Coal and CBM Co-mining Technology CO., Ltd., Jincheng, China
Hydraulic fracturing is an important technical measure for coalbed methane (CBM) development, and the propagation of fractures in the target coal seam induced by hydraulic fracturing is related to the stimulation performance in CBM recovery. Therefore, effective monitoring of fracture development during reservoir fracturing is critical for CBM engineering. In this paper, the microseismic technology was used to monitor the spatial and temporal characteristics of the fracture extension in the CBM well during hydraulic fracturing in Zhengzhuang Region, Southern Qinshui Basin, China. Based on the microseismic fracture scanning data and imaging processing, the three-dimensional shape of fractures in vertical wells after fracturing can be quantified, and for the vertical well ZHSY-1, the main fracture direction is identified as NE106°, and the fracture length is 426 m, and the fracture area of coal seam is 1.6 × 10⁵ m2. It is found that fracturing does not develop continuously in time and space with fracturing fluid injection, and the fracture regions are scattered throughout the space, and the formation and development of fracture regions are intermittent. After fracturing with a large amount of fracturing fluid injection in Well ZHSY-1, the fracture area has been significantly increased, and the well gas production has been significantly improved, which is confirmed by the field CBM well data. This study provides a field application case for studying the effect of hydraulic fracturing fracture propagation using microseismic technology, which can be used as a reference for fracturing engineering in CBM development.
1 Introduction
In recent years, the energy industry in China and even in the world is undergoing great changes, constantly moving towards clean energy (Fan et al., 2019; Fan et al., 2020a). CBM is a rapidly emerging clean, high-quality energy and industrial chemicals in recent decades (Liu et al., 2020; Yang and Liu, 2021; Li et al., 2022a), while it has as much as twenty times the greenhouse effect of carbon dioxide (Zhao et al., 2020; Li et al., 2021). China has rich CBM resources, and the proven reserves of CBM resources in coal seams buried at a depth of 2,000 m or shallower are approximately 3 × 10⁻¹² m3 (Fan et al., 2020b). Under the strategic goal of “Carbon Emissions Peak” and “Carbon Neutrality,” the exploitation and utilization of CBM is of great significance to China’s energy reform and the world environmental protection (Zheng et al., 2019; Fan et al., 2020c).
Hydraulic fracturing technique is one of the most important measures to artificially increase the production of oil and gas reserves (Li et al., 2019a; Liu et al., 2021). In order to improve the productivity of oil and gas, North American scientists firstly proposed a new hydraulic fracturing technique, stimulated reservoir volume (SRV), based on the physical characteristics of the reservoir and traditional hydraulic fracturing (Mu et al., 2014). Since the 20th century, SRV has been widely promoted in the field of oil and gas extraction, especially in the shale gas extraction, and has achieved some success (Ling et al., 2014; Wang et al., 2017; He, 2018). In the past decade, the CBM industry has also started to try to replicate this process for coal reservoir reconstruction (Ren et al., 2018; Sheng et al., 2019). Differing from the conventional hydraulic fracturing techniques for coal reservoirs, the purpose of SRV is to make natural fractures continuously expand and brittle rocks develop shear slip during hydraulic fracturing, which results in a fracture network with interlaced natural and artificial fractures, in this way to increase the reconstruction volume and improve the initial production and the final recovery rate of CBM (Maxwell et al., 2002). However, in practical engineering, the extension and distribution of fractures in coal reservoirs after SRV are unknown, and it is difficult to judge whether SRV is superior in coal reservoir reconstruction compared to conventional hydraulic fracturing (Zhao et al., 2018; Ren et al., 2019). Currently, microseismic monitoring technology has been developed in the industries of oil and gas reservoirs (He et al., 2019; Kang et al., 2021), mining and geothermal, and is commonly applied in the fields of rock damage and movement, hydraulic fracturing monitoring and ground pressure appearance monitoring (Ry et al., 2019; Li et al., 2022b), which is of great significance to prevent and control coal mine disasters and ensure the safety of mining production (Zhao et al., 2016; Zhao et al., 2023).
The principle of microseismic monitoring technology involves the collection of the acoustic signals of the coal/rock fracturing with high-precision sensors during hydraulic fracturing, and the data processing using the geophones, seismic analyzers and other equipment, and the verification the location of the fracturing source and the prediction of the next fracturing source (Ma et al., 2018; Ma et al., 2020). An earlier application of microseismic monitoring technology to diagnose fractures in underground hydraulic fracturing in coal mines was made by a Japanese scholar, Masahiro Seto. In China, the first application of microseismic monitoring technology to hydraulic fracturing monitoring was reported with the engineering applications in the Qinshui Basin in Shanxi province (Zhang et al., 2013). And after that, numerous scholars have carried out a large number of studies in the field of microseismic monitoring of hydraulic fracturing in CBM engineering. Tian et al. (2020) carred out the microseismic network monitoring and inversion of the seismic mechanism in Lu’an mining area in the Qinshui basin. Zhou et al. (2018) successively conducted the application of microseismic monitoring of underground hydraulic fracturing in coal mines and developed microseismic equipment suitable for underground monitoring (Zhou and Li, 2017). Yan et al. (2019) studied the influence range of hydraulic fracturing with the drilling method and microseismic monitoring method, and indicated that the influence range measured by microseismic monitoring was smaller than the drilling method in the soft coal seams. Jiang et al. (2019) applied the microseismic monitoring, water content detection and stress variation monitoring techniques to explore the influence range of hydraulic fracturing in coal mines (Li et al., 2019b). Some studied tried to obtain important information from microseismic monitoring and positioning inversion, such as the extension direction and extension range of fractures, which is helpful to identify and analyze the extension and distribution characteristics of hydraulic fractures (Zhang et al., 2019; Mahmoud et al., 2021). And based on the microseismic monitoring and positioning inversion data, the process parameters of hydraulic fracturing such as pumping water, sand volume and pumping pressure can be optimized, and also the risk of hydraulic fracturing in real time can be evaluated, which can improve the safety and economic efficiency of underground hydraulic fracturing in CBM development.
However, the common used verification method of conventional hydraulic fracturing is to identify the shape of the plane through microseismic fracture monitoring to obtain the basic parameters of the main fracture length and height, which is difficult to guide the actual fracturing process (Yao et al., 2014). And the definition of the effective influence area of hydraulic fracturing and the fracture propagation mechanism in the reconstruction process are still unclear. Therefore, this study carried out microseismic fracture scanning monitoring during the hydraulic fracturing of coalbed methane wells in Zhengzhuang region in Qinshui basin in China, and the spatiotemporal characteristics of fracture propagation during fracturing operation was analyzed, and the applicability of this microseismic monitoring technology was discussed, which can provide reference for relevant engineering application.
2 Materials and methods
Micro-rupture energy scanning technology is a technique specifically designed for micro-ruptures. The technique is based on three-element shallow surface burial observation, less monitoring station deployment, real-time data monitoring and 4D processing interpretation, which extends the monitoring range of traditional positioning methods and is able to quickly construct and capture micro-rupture at the surface, and it also takes it into account that microseismic mostly has shear rupture characteristics (Shen et al., 2009). In particular, to adapt to the monitoring target and monitoring environment characteristics and to avoid the limitations of the original microseismic monitoring methods, micro-rupture energy scanning technology has the following characteristics: 1) Abandoning traditional positioning processing methods with high recording requirements and using offset superposition or vector scanning. 2) Abandoning equidistant and equal-angle arrays, which may make many stations extremely noisy, and laying out station networks with discrete quiet points. 3) Using not only P-waves with small amplitude, but mainly S-waves recorded in 3-component. 4) Abandoning the commonly used natural seismometers and exploration acquisition stations, and developing special micro-ruptures suitable for microseismic. These are the main differences between the micro-rupture energy scanning technique and other microseismic monitoring methods, as well as the necessary conditions for performing micro-rupture vector scanning. The specific technical process and equipment are shown in Figure 1.

FIGURE 1. Schematic Diagram of the technical process and equipment.
2.1 Layout principle of monitoring table
With the main principle of obtaining the maximum signal-to-noise ratio (S/N), the station layout requirements are:1) The station is located approximately 1 km from the near boundary of the strong interference source, which is based on a comprehensive analysis of the various influencing factors during data collection. The influence of fracturing vehicles (groups) and similar disturbance sources (e.g., busy roads) beyond this distance should be lower than the environment noise in the vicinity of the station. 2) After excluding the influence range of all strong interference sources in the monitoring area, stations should be found according to the background quality, as shown in Table 1. 3) The far boundaries of monitoring stations should meet the requirements of background quality and the principle of being as close to the monitoring object as possible, while avoiding setting up stations on points (or small areas), straight lines or circles (Liang et al., 2015).
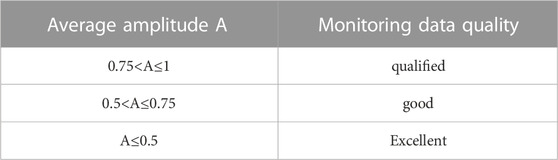
TABLE 1. Judging conditions of station background.
Table 1 above shows the average amplitude of a station record defined by quantitative determination of station record quality. The definition formula is:
2.2 Vertical well monitoring point arrangement
Three component, independent and broadband special microseismic stations located at the surface (<1 m shallow layer) were used for monitoring. In the fracture monitoring of ZHSY-1, 25 seismic stations (detector sensitivity >110 V/m/s) were used, as shown in Figure 2.
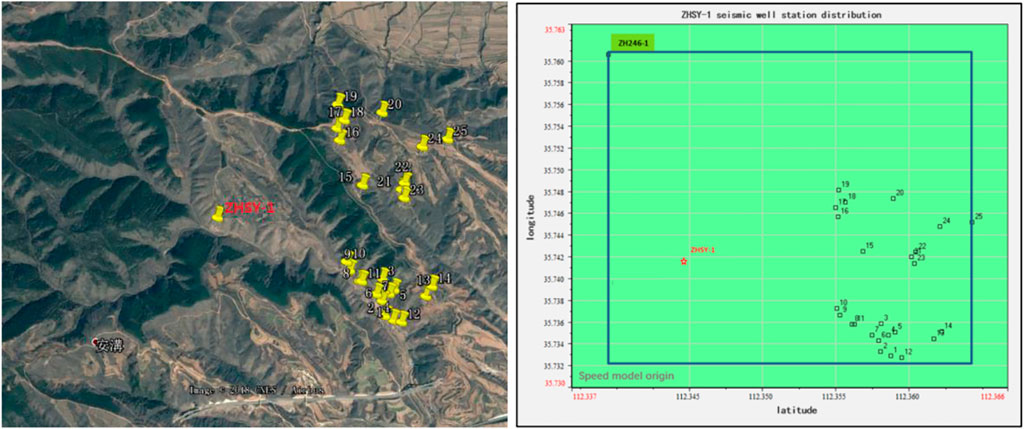
FIGURE 2. Distribution of stations.
The principles for setting up the seismic network are:1) covering the target area around the surface projection point of the fractured section uniformly and randomly; 2) reducing background noise as much as possible, i.e., avoiding fracturing vehicles, personnel, vehicles, high-voltage lines, production and construction wells, etc.; 3) ensuring reliable and continuous operation of the instruments under permissible environmental conditions; etc. However, since it is located in a densely populated area with roads and underground pipelines, the perception of “quiet” relying only on human hearing is inaccurate. For this, we used background detectors, which are portable microseismic instruments that do not need to be buried in the ground, to check possible “quiet” preset points in advance. After excluding the noise points, the layout point areas were determined within the monitoring area and the distance between stations was at least 40 m, which is twice of the maximum GPS positioning error. During the whole monitoring period, there may be several sites with high noise levels (e.g., temporary human or animal activities in the vicinity), which can be removed before the calculation.
Take the ZHSY-1 well in Zhengzhuang area of Qinshui Basin as an example, it is located near Zhengzhuang Town, Qinshui County, Shanxi Province. The wellhead is surrounded by mountains and there is a very low background noise. Since the wellhead is surrounded by mountains there are more rocks and less soil there. There is no road to the north and west of the wellhead, and there is a road to the south of the wellhead, so the measurement station is located to the east of the wellhead, as shown in Figure 2. The observation quality of background noise is excellent, as shown in Table 2 and Figure 3.
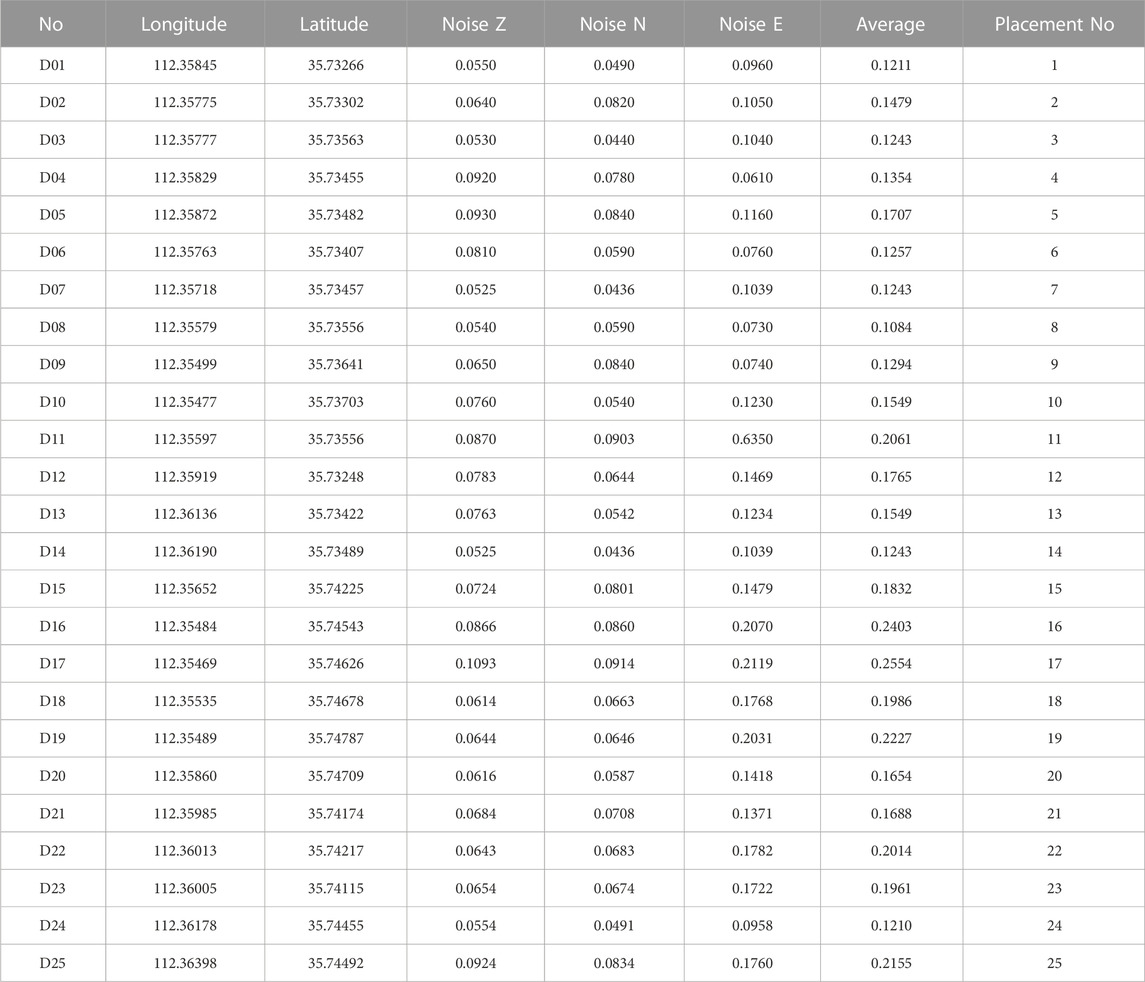
TABLE 2. Background noise of fracturing monitoring seismic station of Well ZHSY-1.
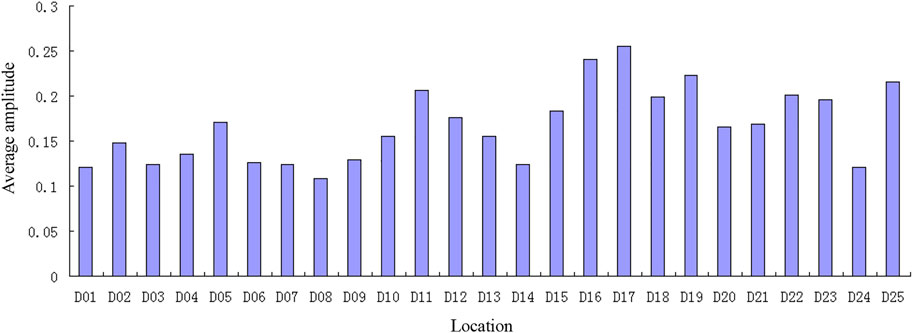
FIGURE 3. Average amplitude of station background.
2.3 Seismic wave velocity model and monitoring data processing
The seismic wave velocity model is the basis of scanning. The seismic wave velocity model is built mainly based on: 1) acoustic measurement data of relatively complete evaluation wells in the block; 2) acoustic measurement data of each well near the reservoir. The principle of the model is to obtain the P-wave velocity model of the whole target area by using the three-dimensional interpolation. Since the S-wave amplitude is large and the fracture is likely to be controlled by the tectonic principal stress field after moving slightly away from the well edge, resulting in a shear fracture, the S-wave velocity model is used in the scanning calculation. After forming the P-wave model, the S-wave velocity model can be obtained by dividing by 1.732. The 3D velocity model was obtained by interpolating the acoustic logging data from the surrounding 2 wells, as shown in Figure 4.
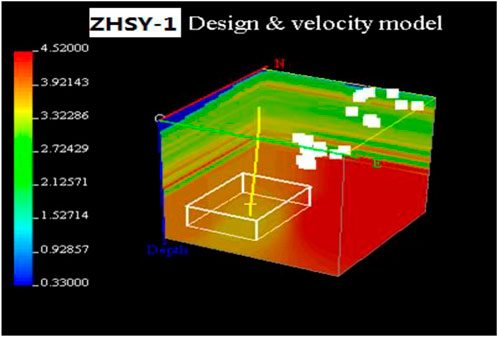
FIGURE 4. Seismic wave velocity model of ZHSY-1 well.
After obtaining the station coordinates, numerical points of the well trajectory and fracture geometry location of each section, the monitoring calculation geometric design of the section can be obtained by defining the scanning range of each section as 1000 m*1000 m*200 m. The grid for scanning calculations is 20 m, and this is the maximum value of GPS error in the field, with a time interval of 1 min, which is used to describe the temporal and spatial distribution of the fractured fractures.
Considering the accuracy and reference of the data, the obvious regular noise points that can be found in the surrounding environment should be excluded during the data collection. As shown in Figure 5, it belongs to the distribution of regular noise points recorded by the two nearby knockers.
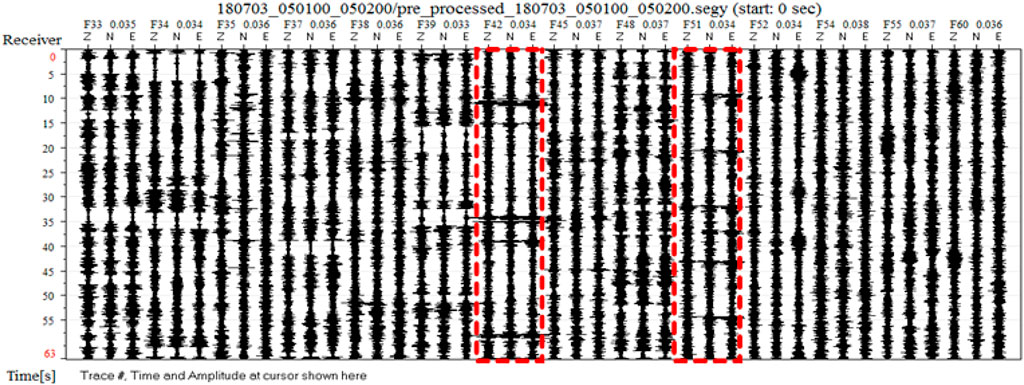
FIGURE 5. Typical data of fracturing monitoring before noise removal of Well ZHSY-1.
2.4 Monitoring results and interpretation
After the fracturing construction, the instantaneous diagram of the two-dimensional energy burst points of each phase was formed by calculating the amount of fracturing energy data, and the cumulative diagram of fracturing energy was obtained by integrating the fracturing energy of each phase, as shown in Figure 6. Finally the relevant parameters of fracturing were determined (Liang et al., 2017).
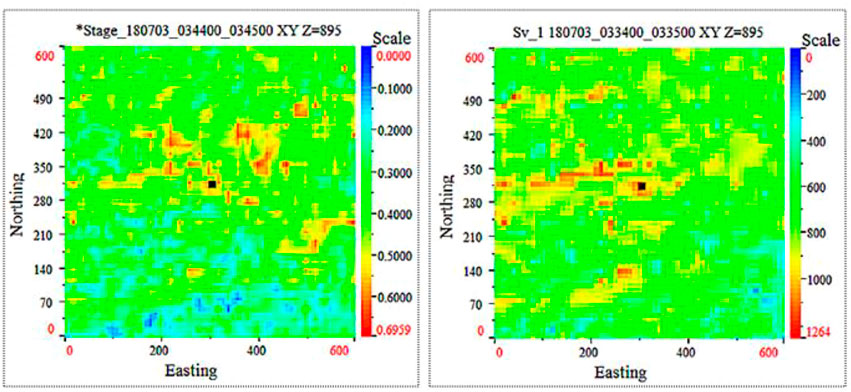
FIGURE 6. Instantaneous and cumulative fracture energy diagram at the 26th minute.
The monitoring results show that the software has sorted and filtered the data since fracturing and divided the data into data subperiods ranging from a few seconds to tens of seconds. Twenty-nine events of high-pressure fracture energy near fracturing were collected by scanning and twenty-nine sets of real-time and cumulative graphs were generated as shown in Figure 7.
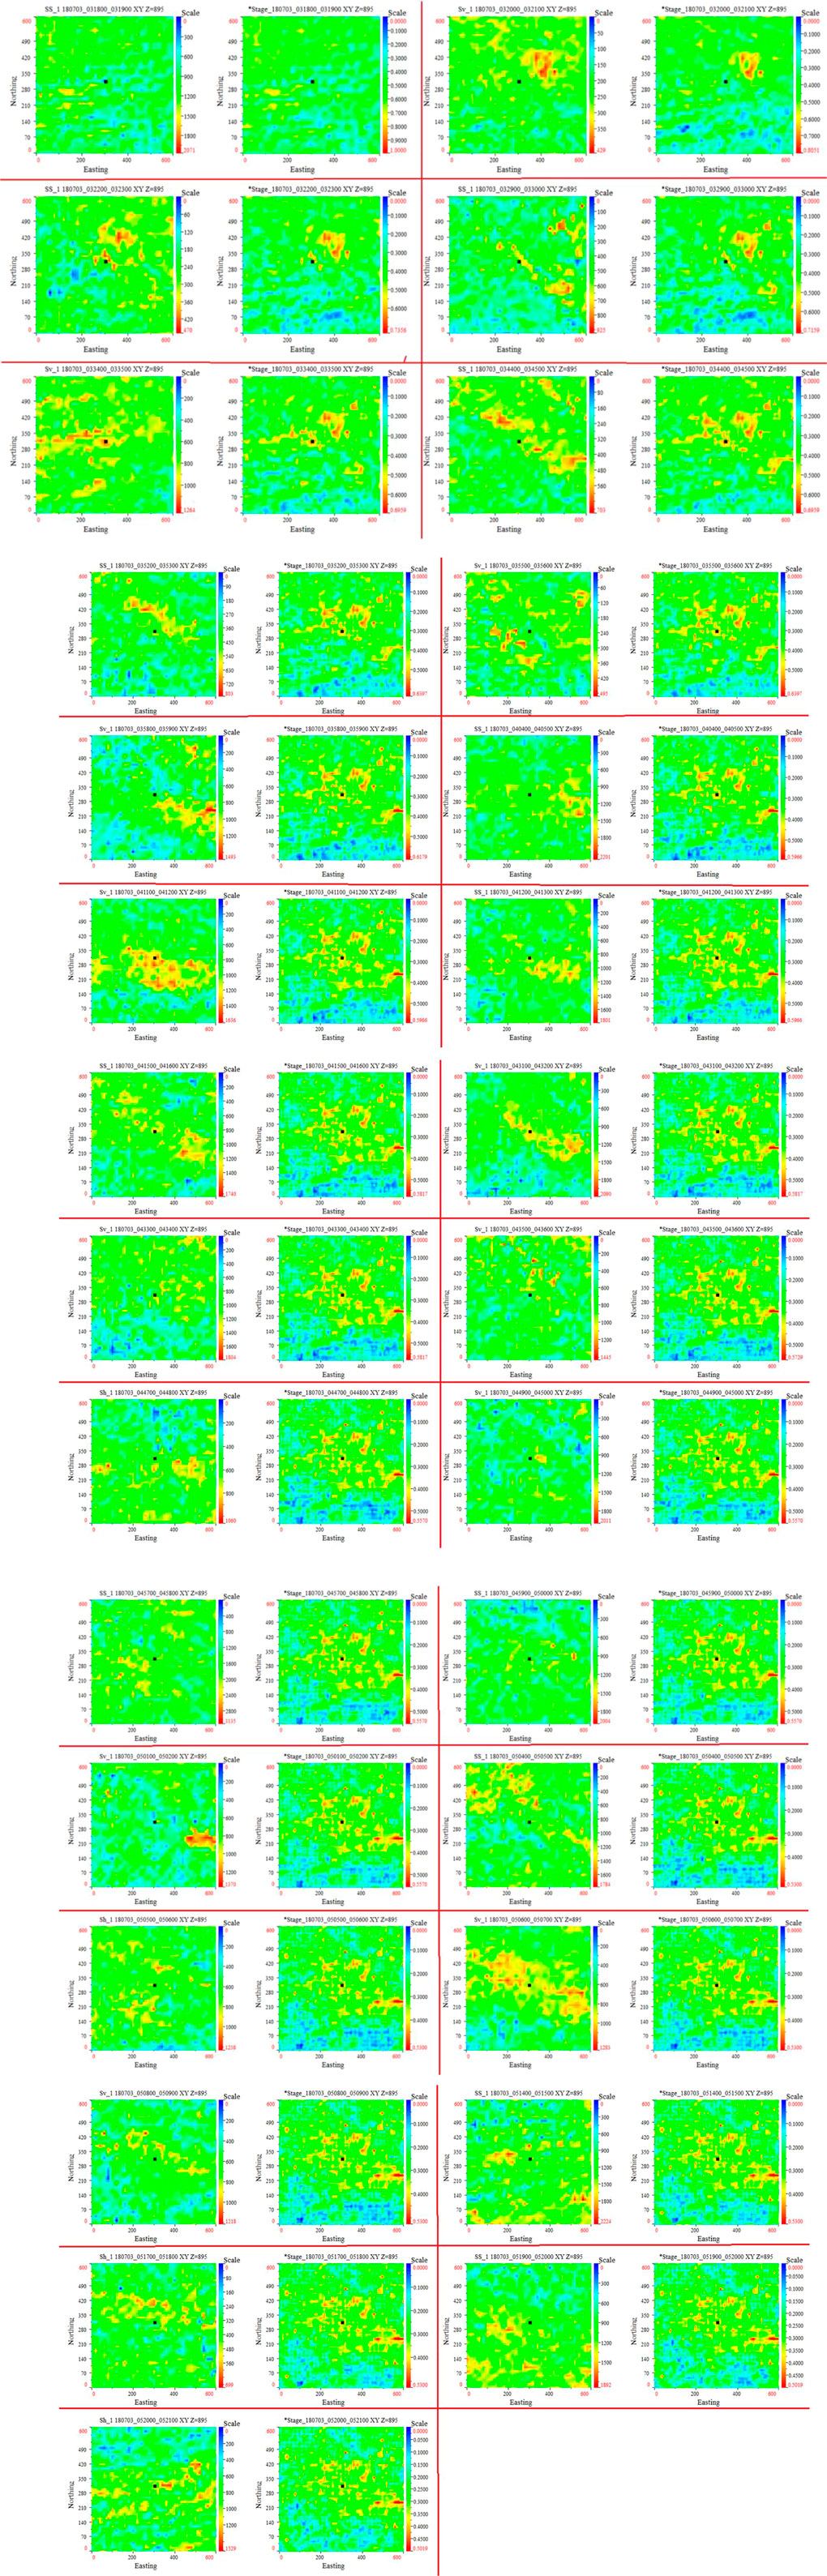
FIGURE 7. Cumulative diagram of important period of fracturing and the period to important period in the fracturing process of well ZHSY-1.
As shown in Figure 8, the main fracture direction is NE106°, the fracture length is 426 m, and the effective fracture area is about 1.60 × 10⁵ m3 by imaging calculation.
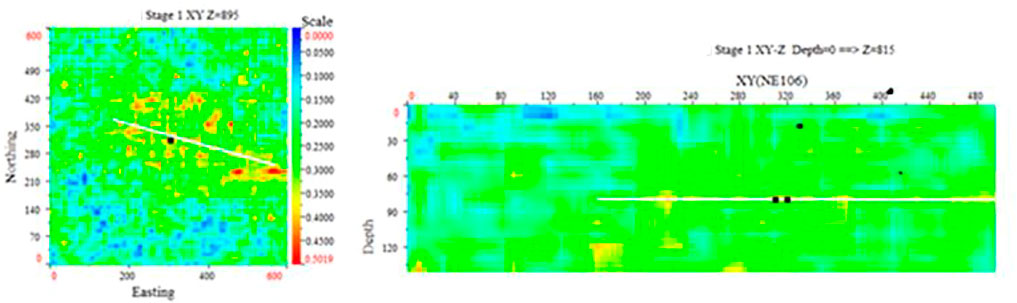
FIGURE 8. Total effect of fracturing fracture distribution in well ZHSY-1.
3 Results and discussion
3.1 Extended space-time characteristics
Combining the cumulative events collected from the volumetric fracture monitoring of well ZHSY-1 with the fracture curve of the well, the images show that most of the obvious fractures are significantly reflected in the fracture curve. Throughout the whole fracturing process, the change of fractures with time can be basically divided into several characteristic moments, as shown in Figure 9. In the 1st minute, the fracture response started from the southwest direction with an expanding fracture network. From the 3rd minute of fracturing, the response was relatively dense in the area perpendicular to the northeast direction of the well, with relatively scattered fractures around the wellhead in other directions. Starting from the 11th minute of fracturing, the response started from the northeast direction around the fractured area, and by the end of the 26th minute, the contour line of the fracture network was basically formed. During the subsequent construction, the fracture network was continuously densified. At the end of the fracturing, which was the 135th minute, the fracture network reached its final shape.
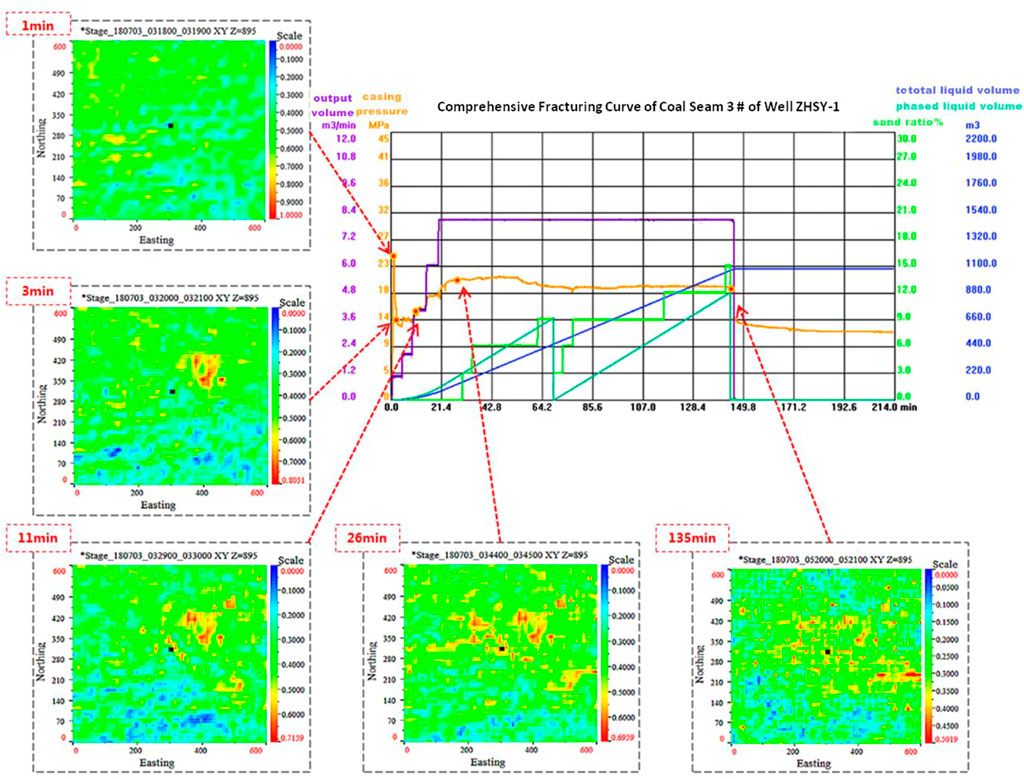
FIGURE 9. Fracturing construction curve and fracture state characteristic diagram.
Through further detailed analysis of the 29 sets of data collected, it is found that the fractures do not necessarily develop continuously in time and space strictly with the advancement of fracturing fluid. Taking the ZHSY-1 well as an example, the cumulative diagram shows that the fracture concentrated areas are southwest, northeast, northeast, southeast and northwest. After 26 min, the fracture network will be densified. On the whole, it shows that the concentrated fracture areas are jumping in space but intermittent in time. For example, after 11 min, several concentrated fracture areas in the northeast no longer show large changes in area and approach “saturation,” with more microfractures developing in this region.
3.2 Comparative analysis of fracturing performance
With the same microseismic fracture scanning technique, this vertical well was compared with conventional fracturing vertical wells ZHSY-2 and ZHSY-3 located in the same area and in the same formation. The specific parameters and post-fracturing interpretations of the three wells are shown in Table 3. The results show that the main fracture length of well ZHSY-2 is 410 m and that of well ZHSY-3 is 450 m, which is not much different from that of well ZHSY-1, but there is a significant difference in the effective fracture area.
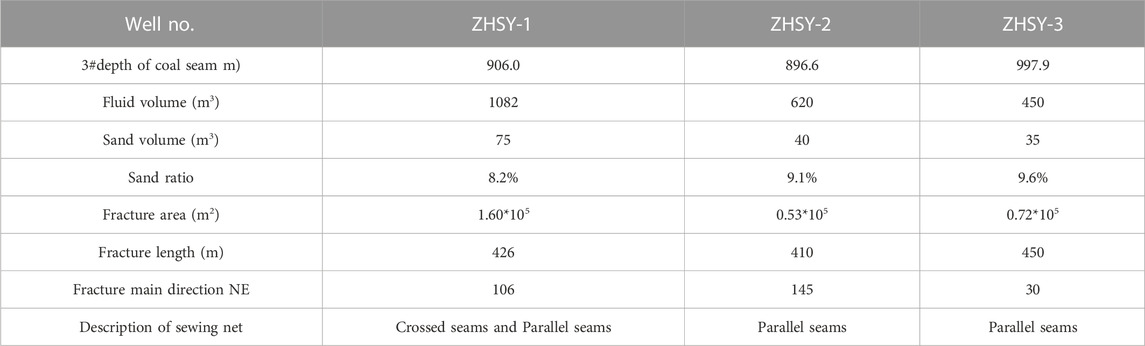
TABLE 3. Data of three wells and fracturing fractures.
The effective fracture area of fracturing can be seen as a direct reflection of the fracturing process modification. From the microseismic fracture scanning technique, it can be seen that the concentrated fracture area jumps spatially and it may be a bright irregular energy point on the cumulative map. Although there is no direct evidence that these high fracture energy points are in direct communication with each other, these points should be connected into lines, lines into pieces, and pieces into a network, which should be the effective impact area of fracturing, as shown in Figure 10. The results and calculations show that the effective fracturing area of ZHSY-2 well is about 0.53 × 10⁵ m3, and when the sand rate is close and the fluid volume is about 500 m3 less than that of ZHSY-1 volumetric fracturing well, the effective area is reduced by 67%, and the effect of SRV is obvious from the macroscopic point of view. From the microscopic point of view, the apparent high fracture energy points, which are dominated by the time axis, are hypothetically connected in the order of their appearance. It can be found that the fracturing fractures in the vertical wells of SRV are relatively differentiated, and the communication between fractures is frequent and obvious. However, due to the scale of fracturing in conventional fracturing is small, fracture communication shows a certain trend to some extent. Take the ZHSY-2 well as an example, the trend of east-west extension of the fractures is obvious.
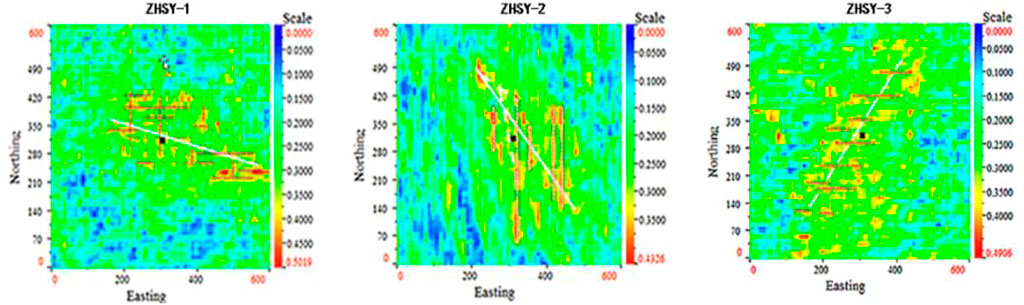
FIGURE 10. Comparison of fracture extension trend.
3.3 Gas production effect analysis
The three observation wells have been continuously and steadily discharging gas since October 2018, and a total of 8 months of gas volume data have been collected. The gas production of the three wells is shown in Figure 11.
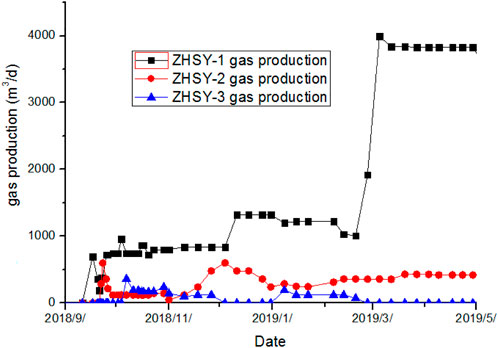
FIGURE 11. Gas production change of the CBM wells.
After 8 months of production scheduling, the production of the ZHSY-1 well was maintained at about 3,800 m3/d, the daily production of the ZHSY-2 well hovered around 200–500 m3, and the ZHSY-3 well was almost in a non-gas producing state. As shown in Figure 11, since March 1, the ZHSY-1 well started to fully drain the two coal seams, resulting in a significant increase in gas production. Coal seam 15 provided great support for the gas production of this CBM well. However, it can be seen from the gas production that the daily production of this well can be maintained at about 1,300 m3 before the combined extraction, which is still a high production well compared to the other two wells.
Among the three wells, the ZHSY-1 well has a significantly larger fracture area and richer fracture pattern than the other two wells after large displacement fracturing. To some extent, the possibility of communication and connection between fractures is greater. It is clear from Figure 10 that in addition to the direct communication between the obvious fractures and the main fractures, there is also a lot of communication between the obvious fractures and the fractures. In summary, it can be seen to some extent that the size of the fracture area will directly affect the production of natural gas.
4 Conclusion
Microseismic scanning technology was applied to monitor the hydrlic fracture process and study the fracture propagation behavior in target CBM reservoir. The orientation and shape of the main fracture can be detected with the microseismic energy scanning image, and the effective fracture area can be evaluated, which intuitively reflect the fracturing permormance. It is found that the fracture propagation was discontinuous in time and space with the injection of hydraulic fracturing fluid. Dense fracture areas continued to appear as fracturing progresses, and the fracture area developed intensively in a certain period of time, and finally reach a “stable” state. Compared with conventional fracturing wells in the same layer in the same CBM region, the length of main fractures generated by volume fracturing has no obvious change, but the effective fracture area has increased significantly, and the fracture development is more complex, which will induce the better connectivity in CBM reservoir and higher CNM yield.
Data availability statement
The original contributions presented in the study are included in the article/supplementary material, further inquiries can be directed to the corresponding author.
Author contributions
JZ: Conceptualization; writing original draft, methodology, PL: Review and editing, supervision JL: Writing original draft; field test ZC: Field test; data processing YL: Field test; data processing FL: Field test; data processing.
Funding
This work was supported by the National Natural Science Foundation of China (Grant No. 52204206), and 2020 major science and technology project in Shanxi Province: coalbed gas well damage prevention fracturing technology and fracturing effect evaluation technology (Grant No. 20201102002), and the Open Fund Project Funded by State Key Laboratory of Gas Disaster Detecting, Preventing and Emergency Controlling (Grant No. 2021SKLFF03).
Conflict of interest
Authors JZ, JL, ZC, and YL were employed by Yi'an-Lanyan Coal and CBM Co-mining Technology CO., Ltd.
FL was employed by Shanxi Lanyan Coalbed Methane Group Co., Ltd.
The remaining authors declare that the research was conducted in the absence of any commercial or financial relationships that could be construed as a potential conflict of interest.
Publisher’s note
All claims expressed in this article are solely those of the authors and do not necessarily represent those of their affiliated organizations, or those of the publisher, the editors and the reviewers. Any product that may be evaluated in this article, or claim that may be made by its manufacturer, is not guaranteed or endorsed by the publisher.
References
Fan, J., Jiang, D., Liu, W., Wu, F., Chen, J., and Daemen, J. (2019). Discontinuous fatigue of salt rock with low-stress intervals. Int. J. Rock Mech. Min. Sci. 115 (3), 77–86. doi:10.1016/j.ijrmms.2019.01.013
Fan, J., Liu, P., Li, J., and Jiang, D. (2020). A coupled methane/air flow model for coal gas drainage: Model development and finite-difference solution. Process Saf. Environ. Prot. 141, 288–304. doi:10.1016/j.psep.2020.05.015
Fan, J., Liu, W., Jiang, D., Chen, J., Tiedeu, W. N., and Daemen, J. J. K. (2020). Time interval effect in triaxial discontinuous cyclic compression tests and simulations for the residual stress in rock salt. Rock Mech. Rock Eng. 53, 4061–4076. doi:10.1007/s00603-020-02150-y
Fan, J., Xie, H., Chen, J., Jiang, D., Li, C., Ngaha Tiedeu, W., et al. (2020). Preliminary feasibility analysis of a hybrid pumped-hydro energy storage system using abandoned coal mine goafs. Appl. Energy 258, 114007. doi:10.1016/j.apenergy.2019.114007
He, H. (2018). Practice of Re-fracturing with network energization for horizontal well in tight oil reservoir. Spec. Oil Gas. Reserv. 25, 170–174.
He, Y., Jiang, D., Chen, J., Liu, R., Fan, J., and Jiang, X. (2019). Non-monotonic relaxation and memory effect of rock salt. Rock Mech. Rock Eng. 52, 2471–2479. doi:10.1007/s00603-018-1718-4
Jiang, Z., Li, Q., Hu, Q., Chen, J., Li, X., Wang, X., et al. (2019). Underground microseismic monitoring of a hydraulic fracturing operation for CBM reservoirs in a coal mine. Energy Sci. Eng. 7, 986–999. doi:10.1002/ese3.329
Kang, Y., Fan, J., Jiang, D., and Li, Z. (2021). Influence of geological and environmental factors on the reconsolidation behavior of fine granular salt. Nat. Resour. Res. 30, 805–826. doi:10.1007/s11053-020-09732-1
Li, C., Nie, B., Zhang, Z., Liu, X., Zhao, Z., Zhang, C., et al. (2022). Experimental study of the structural damage to coal treated by a high-voltage electric pulse discharge in water. Energy Fuels 36, 6280–6291. doi:10.1021/acs.energyfuels.2c01199
Li, L., Liu, D., Cai, Y., Wang, Y., and Jia, Q. (2021). Coal structure and its implications for coalbed methane exploitation: A review. Energy Fuels 35, 86–110. doi:10.1021/acs.energyfuels.0c03309
Li, L., Tan, J., Wood, D. A., Zhao, Z., Becker, D., Lyu, Q., et al. (2019). A review of the current status of induced seismicity monitoring for hydraulic fracturing in unconventional tight oil and gas reservoirs. Fuel 242, 195–210. doi:10.1016/j.fuel.2019.01.026
Li, N., Huang, B., Zhang, X., Yuyang, T., and Li, B. (2019). Characteristics of microseismic waveforms induced by hydraulic fracturing in coal seam for coal rock dynamic disasters prevention. Saf. Sci. 115, 188–198. doi:10.1016/j.ssci.2019.01.024
Li, Z., Mao, H., Li, B., Zhou, X., Liao, G., and Chen, J. (2022). Stability analysis and fracture mechanism of surrounding rock in a hydraulic tunnel based on microseismic monitoring. Appl. Sci. 12, 9362–9414. doi:10.3390/app12189362
Liang, B., Cheng, B., and Wu, Z. (2017). Data processing automatically in vector scanning for microseismic. Prog. Geophys 32, 377–386.
Liang, B., Shen, C., and Leng, C. (2015). Development of microseismic monitoring for hydro-fracturing. Prog. Geophys 30, 401–410.
Ling, Y., Li, X., and Mu, L. (2014). New progress in fracturing technologies for tight sandstone gas reservoirs in the sulige gas field. Nat. Gas. Ind. 34, 66–72.
Liu, J., Sheng, J. J., Emadibaladehi, H., and Tu, J. (2021). Experimental study of the stimulating mechanism of shut-in after hydraulic fracturing in unconventional oil reservoirs. Fuel 300, 120982. doi:10.1016/j.fuel.2021.120982
Liu, W., Zhang, X., Fan, J., Zuo, J., Zhang, Z., and Chen, J. (2020). Study on the mechanical properties of man-made salt rock samples with impurities. J. Nat. Gas. Sci. Eng. 84, 103683. doi:10.1016/j.jngse.2020.103683
Ma, T., Lin, D., Tang, C., Yadav, K. P., and Feng, Z. (2020). Microseismic monitoring, positioning principle, and sensor layout strategy of rock mass engineering. Geofluids 2020, 1–20. doi:10.1155/2020/8810391
Ma, T. H., Tang, C. A., Tang, S. B., Kuang, L., Yu, Q., Kong, D. Q., et al. (2018). Rockburst mechanism and prediction based on microseismic monitoring. Int. J. Rock Mech. Min. Sci. 110, 177–188. doi:10.1016/j.ijrmms.2018.07.016
Mahmoud, A., Gowida, A., Aljawad, M. S., Al-Ramadan, M., and Ibrahim, A. F. (2021). Advancement of hydraulic fracture diagnostics in unconventional formations. Geofluids 2021, 1–17. doi:10.1155/2021/4223858
Maxwell, S. C., Urbancic, T. I., and Steinsberger, N. (2002). Microseismic imaging of hydraulic fracture complexity in the barnett shale. Proc. - SPE Annu. Tech. Conf. Exhib., 965–973.
Mu, H., Liu, X., and Liu, J. (2014). Application of volume fracturing to reconstruction of tight sandstone reservoir. Nat. Gas. Explor Dev. 37, 56–60+63.
Ren, L., Lin, R., Zhao, J., Rasouli, V., and Yang, H. (2018). Stimulated reservoir volume estimation for shale gas fracturing: Mechanism and modeling approach. J. Pet. Sci. Eng. 166, 290–304. doi:10.1016/j.petrol.2018.03.041
Ren, L., Su, Y., Zhan, S., Meng, F., and Zhao, G. (2019). Fully coupled fluid-solid numerical simulation of stimulated reservoir volume (SRV)-fractured horizontal well with multi-porosity media in tight oil reservoirs. J. Pet. Sci. Eng. 174, 757–775. doi:10.1016/j.petrol.2018.11.080
Ry, R. V., Sahara, D. P., Rohaman, M., Suhendi, C., Palgunadi, K. H., Widiyantoro, S., et al. (2019). Implementation of GMSTech - a new practical software for microseismic data processing - for estimating event source parameters. J. Phys. Conf. Ser. 1204, 012096–6. doi:10.1088/1742-6596/1204/1/012096
Shen, C., Liang, B., and Li, Z. (2009). Principle of vector scanning technique for micro-fractures. Acta Pet. Sin. 30, 744–748.
Sheng, G., Su, Y., and Wang, W. (2019). A new fractal approach for describing induced-fracture porosity/permeability/compressibility in stimulated unconventional reservoirs. J. Pet. Sci. Eng. 179, 855–866. doi:10.1016/j.petrol.2019.04.104
Tian, L., Cao, Y., Liu, S., Shi, B., Liu, J., and Elsworth, D. (2020). Coalbed methane reservoir fracture evaluation through the novel passive microseismic survey and its implications on permeable and gas production. J. Nat. Gas. Sci. Eng. 76, 103181. doi:10.1016/j.jngse.2020.103181
Wang, X., Yang, B., and Wang, R. (2017). Beneficial exploration based on geology-engineering integration in low-saturation oil reservoirs of Tuha Oilfield. China Pet. Explor 22, 38–45.
Yan, J., Pang, C., and Duan, J. (2019). Microseismic monitoring of underground hydraulic fracturing range in coal seam and analysis of influencing factors. Coal Geol. Explor 47, 92–97.
Yang, Y., and Liu, S. (2021). Integrated modeling of multi-scale transport in coal and its application for coalbed methane recovery. Fuel 300, 120971. doi:10.1016/j.fuel.2021.120971
Yao, W., Dou, W., and Chen, J. (2014). Application of fracture monitoring technology in CBM fracturing. China Coalbed Methane 11, 35–38.
Zhang, B., Tian, X., Ji, B., Zhao, J., Zhu, Z., and Yin, S. (2019). Study on microseismic mechanism of hydro-fracture propagation in shale. J. Pet. Sci. Eng. 178, 711–722. doi:10.1016/j.petrol.2019.03.085
Zhang, P., Wu, J., Sun, H., et al. (2013). Analysis the result of the downhole microseismic monitoring technique in coabed methane well fracturing. Sci. Technol. Eng. 13, 2–7.
Zhao, W., Cheng, Y., Jiang, H., Jin, K., Wang, H., and Wang, L. (2016). Role of the rapid gas desorption of coal powders in the development stage of outbursts. J. Nat. Gas. Sci. Eng. 28, 491–501. doi:10.1016/j.jngse.2015.12.025
Zhao, W., Wang, K., Ju, Y., Fan, L., Cao, H., Yang, Y., et al. (2023). Quantification of the asynchronous gas diffusivity in macro-/micropores using a Nelder-Mead simplex algorithm and its application on predicting desorption-based indexes. Fuel 332, 126149. doi:10.1016/j.fuel.2022.126149
Zhao, W., Wang, K., Liu, S., Ju, Y., Zhou, H., Fan, L., et al. (2020). Asynchronous difference in dynamic characteristics of adsorption swelling and mechanical compression of coal: Modeling and experiments. Int. J. Rock Mech. Min. Sci. 135, 104498. doi:10.1016/j.ijrmms.2020.104498
Zhao, Y. L., Zhang, L. H., and Shan, B. C. (2018). Mathematical model of fractured horizontal well in shale gas reservoir with rectangular stimulated reservoir volume. J. Nat. Gas. Sci. Eng. 59, 67–79. doi:10.1016/j.jngse.2018.08.018
Zheng, C., Jiang, B., Xue, S., Chen, Z., and Li, H. (2019). Coalbed methane emissions and drainage methods in underground mining for mining safety and environmental benefits: A review. Process Saf. Environ. Prot. 127, 103–124. doi:10.1016/j.psep.2019.05.010
Zhou, D., Jiang, Y., and Guo, K. (2018). Microseismic monitoring technology and application to hydraulic fracturing in shihao coal mine. Adv. Porous Flow. 08, 7–13. doi:10.12677/apf.2018.81002
Keywords: coalbed methane, hydraulic fracturing, fracture extension, microseismic technology, CBM production
Citation: Zhao J, Liu P, Li J, Chen Z, Li Y and Li F (2023) Fracture propagation induced by hydraulic fracturing using microseismic monitoring technology: Field test in CBM wells in Zhengzhuang region, Southern Qinshui Basin, China. Front. Earth Sci. 11:1130280. doi: 10.3389/feart.2023.1130280
Received: 28 December 2022; Accepted: 30 January 2023;
Published: 08 February 2023.
Edited by:
Alexandre Chemenda, UMR7329 Géoazur (GEOAZUR), FranceReviewed by:
Wei Zhao, China University of Mining and Technology, ChinaHao Xu, Chengdu University of Technology, China
Copyright © 2023 Zhao, Liu, Li, Chen, Li and Li. This is an open-access article distributed under the terms of the Creative Commons Attribution License (CC BY). The use, distribution or reproduction in other forums is permitted, provided the original author(s) and the copyright owner(s) are credited and that the original publication in this journal is cited, in accordance with accepted academic practice. No use, distribution or reproduction is permitted which does not comply with these terms.
*Correspondence: Peng Liu, rocliu@cqu.edu.cn