Bayesian estimation of glacier surface elevation changes from DEMs
 Gregoire Guillet1,2*
  Tobias Bolch1,3
- 1School of Geography and Sustainable Development, University of St Andrews, St Andrews, United Kingdom
- 2Civil and Environmental Engineering, University of Washington, Seattle, WA, United States
- 3Institute of Geodesy, Graz University of Technology, Graz, Austria
Accurate estimates of glacier surface elevation changes are paramount for various aspects of the study of the cryosphere, from glacier flow and thickness estimates to hydrological forecasts and projections of sea-level-rise. We present a novel probabilistic framework to filter outliers and estimate uncertainties in glacier surface elevation changes computed from the subtraction of digital elevation models (DEM). Our methodology frames outlier filtering as a Bayesian inference problem, thus characterizing the state of knowledge on glacier surface elevation changes through the posterior distribution as the combination of glacier volume variation observations and prior knowledge arising from previously collected data and/or modeled results. We validate this technique with experiments using Gaussian random fields to generate artificial noise in glacier surface elevation variation observations and show that the model satisfactorily culls the simulated outliers. Surface elevation change estimates are consistent with results computed from widely-used outlier filtering and uncertainty estimation techniques. The Bayesian framework allows unifying DEM error models with physical considerations on glacier surface elevation changes within a simple, statistically coherent model preventing temporal correlation and additional biases in other techniques. On the basis of these results, we discuss the implications of DEM uncertainty and offer suggestions for the glaciological community.
1 Introduction
The increasing collection of surface elevation datasets has created a vast archive for the study of the cryosphere. Digital elevation datasets have now become ubiquitous in the study of glaciers (Hubbard et al., 2000; Bolch et al., 2011; King et al., 2019; Shean et al., 2020; Hugonnet et al., 2021), ice caps (Bingham and Rees, 1999; Moholdt and Kääb, 2012; Papasodoro et al., 2015) and ice sheets (Davis and Ferguson, 2004; Whitehead et al., 2013; Shean et al., 2019; Simonsen et al., 2021) and present a significant opportunity to further our understanding of ice dynamics, cryosphere/climate relationships, and future sea level rise (Gardner et al., 2012). Lately, efforts have primarily focused on producing new and more accurate digital elevation models (DEMs) from the air- and space-borne optical or radar sensors (Muskett et al., 2009; Moholdt and Kääb, 2012; Neckel et al., 2014; Leinss and Bernhard, 2021; Knuth et al., 2023) and widespread processing techniques (Noh and Howat, 2015; Mertes et al., 2017; Mölg and Bolch, 2017; Bhushan et al., 2021; Janowski et al., 2021). This has resulted in studies quantifying glacier elevation changes on longer timescales (Bolch et al., 2011; King et al., 2020; Bhattacharya et al., 2021), broader spatial scales (Brun et al., 2017; Shean et al., 2020; Hugonnet et al., 2021), and with higher temporal and spatial resolutions (Brun et al., 2016; Hugonnet et al., 2021).
Studies estimating glacier surface elevation change rely on DEMs of disproportionate quality as their initial data originate from different sensors (Toutin, 2008; González-Moradas and Viveen, 2020), are processed using various algorithms (Futamura et al., 2002; Beyer et al., 2018; Bhushan et al., 2021), collected at inconsistent spatial resolutions (Bolch et al., 2011; Shean et al., 2020; Bhattacharya et al., 2021) or contain spurious elevations due to cloud coverage (Bolch et al., 2005; Brun et al., 2017). These limitations can introduce substantial bias and uncertainties in the information derived from glacier surface elevation changes computed by differencing two or more DEMs (Paul et al., 2017; Podgórski et al., 2019; Hugonnet et al., 2022). Typical biases affecting DEMs generated from radar and optical sensors are described in greater detail in Section 2. Mitigating biases on the information derived from DEM differences has recently been the focus of substantial efforts (e.g., Hugonnet et al., 2022).
The first step in an accurate surface elevation change analysis is the removal of 3-dimensional shifts between input DEMs by aligning the datasets. The co-registration algorithm proposed by Nuth and Kääb (2011) is the most widely used means of eliminating 3D shifts when differencing DEMs (Paul et al., 2017). Although the robustness of registration techniques addresses grid-wide elevation shifts, coregistration alone cannot filter isolated residual biases in DEMs. Residual biases typically arise from atmospheric conditions at data acquisition (Vaze et al., 2010; Gardelle et al., 2012), sensor-specific biases (Oksanen and Sarjakoski, 2005; Girod et al., 2017), as well as physical properties of the observed terrain (Dall et al., 2001; Li et al., 2021b) all of which require removal. There are a wide variety of outlier filtering methodologies and most rely on statistical thresholds using different metrics or accuracy measures: Pieczonka and Bolch (2015) use an elevation-dependent sigmoid function, Gardelle et al. (2013); Shangguan et al. (2015) use hypsometric (100 m elevation band) standard deviation, Brun et al. (2017); Braun et al. (2019); Hugonnet et al. (2021) rely on the hypsometric normalized median absolute deviation (NMAD) (Höhle and Höhle, 2009); Shean et al. (2020) remove outliers from input datasets using triangulation error and absolute elevation difference compared to a reference DEM (Wang and Kääb, 2015).
Uncertainties in remotely-sensed glacier quantities (thickness or velocity changes, for example,) are usually estimated through pixel-wise or spatially integrated geostatistical methods over a specific spatial domain. The most widely used methodology for spatially-integrated uncertainty estimation (see, e.g., Fischer et al. (2015); Dehecq et al. (2020); King et al. (2021)) was proposed by Rolstad et al. (2009) and describes the uncertainty associated with the rate of elevation change as proportional to the root of the standard deviation of elevation change over static reference surfaces. The estimation of pixel-wise uncertainties often relies on the use of terrain morphometrics such as slope (Carlisle, 2005; Milan et al., 2011) or ruggedness (Kyriakidis et al., 1999) as a descriptor of error. Hugonnet et al. (2022) characterize and propagate uncertainty through a spatial inference framework, relying on off-glacier “stable terrain” as a proxy for error analysis. Most frameworks for culling outliers and estimating uncertainties rely on the implicit assumption that glacier surface elevation changes vary smoothly and are normally distributed in space and time. Gaussianity in glacier surface elevation changes is, however, more often than not an unrealistic assumption, since most glacier volume variations measurement-error distributions are either positively skewed (Brun et al., 2016) or present heavy tails (Vincent et al., 2016; Vijay and Braun, 2018), due, for example, to the unstable flowing regime of surge-type glaciers. Surge-type glaciers typically show abrupt variations in their flowing regime, alternating between periods of high velocity (up to 5 m/day, lasting months to years) and quasi-stagnant (years to decades) flow (e.g. Truffer et al., 2021). Therefore, accounting for non-Gaussian elevation changes and errors in the DEM differencing process and quantifying the uncertainties on the surface elevation changes is crucial.
Bayesian methods have recently gained significant momentum in the glaciological community as they allow the combination of various sources of information within a single statistically coherent framework (see, for example, Zammit-Mangion et al., 2015; Brinkerhoff et al., 2016; Guillet et al., 2020; Werder et al., 2020; Zhang and Cressie, 2020; Gopalan et al., 2021). This paper presents a method to derive probabilistic estimates of glacier surface elevation changes by conditioning glacier volume variation observations on previously available knowledge of glacier surface elevation changes (i.e., previously published data and/or surface mass balance model outputs). We present the estimation of glacier thickness change as a Bayesian inference problem, which allows for quantifying uncertainties resulting from DEM errors. By unifying physical knowledge of glacier surface elevation changes with simple DEM error modeling within a statistically coherent probabilistic framework, we produce pixel-wise probability distributions of glacier surface elevation change to measure glacier surface elevation change uncertainty. We present validation results that test key aspects of the proposed methodology, with an emphasis on study zones where surge-type glaciers are likely to severely alter the elevation change signal.
2 Digital elevation measurements and their uncertainties
The broad range of satellite sensors allows for generating an ever-increasing volume of glacier digital elevation products. Most products used in glaciology are either point clouds acquired by altimeters (either laser or radar, such as ICESat and ICESat-2 or Cryosat-2) or gridded elevation products generated from optical (ASTER, Pléiades, WorldView) or radar sensors (SRTM C/X-bands, TanDEM-X). In this work, we focus on deriving estimates of glacier surface elevation changes, relying solely on the subtraction of DEMs and not considering products from radar or laser altimeters. However, we wish to mention that the method presented throughout this paper can readily be extended to glacier changes measured from altimeters, provided that sensor-related uncertainties can be modeled satisfactorily.
In addition, we stress that this paper proposes a method to unify DEM post-processing steps within a consistent probabilistic framework, further emphasizing the use of widely available products. Uncertainties in DEM generation and pre-processing steps cannot be expected to be included. For more information regarding this topic, we refer the reader to the works of Paul et al. (2017), Hugonnet et al. (2022) and Berthier et al. (2023) for example, as well as individual documentation for specific DEM generation pipelines.
2.1 DEMs from optical sensors
DEMs from optical sensors are plagued by data gaps and artifacts resulting from failed matching during DEM generation (Paul et al., 2017; Hugonnet et al., 2022), which represent a major source of aberrant elevation change signal in the DEM of Difference (DoD). They typically are the consequence of homogeneous surfaces lacking contrast (shadow, snow, clouds, fog) and mainly affect DEMs processed from 8-Bit sensors (such as ALOS-PRISM, ASTER missions (see Raup et al. (2015) for more). Artifacts arise further when spatial resolution is increased beyond the capabilities of the original data (Paul et al., 2017). Any artifact affecting one of the DEMs used to quantify glacier surface elevation at a given time will be propagated into the gridded thickness change product.
2.2 DEMs from radar sensors
While DEMs derived from radar interferometry are not restricted by daylight or atmospheric conditions, such as clouds and fog, they are vulnerable to phase unwrapping errors due to foreshortening, layover, and shadow effects caused by the surrounding steep topography (e.g., Eineder, 2003; Shugar et al., 2010). More prominently, radar signals are known to penetrate ice and dry snow to varying depths (Dall, 2007; Gardelle et al., 2012; Dehecq et al., 2016), depending on the physical properties of the land surface (e.g., snow moisture content) and the signal (e.g., Berthier et al., 2006; Rott et al., 2021). The Shuttle Radar Topography Mission (SRTM) DEM is a well-documented example elevation-dependant of radar penetration, as its global coverage has been used in numerous studies (Berthier et al., 2006; Gardelle et al., 2012; Pieczonka and Bolch, 2015; Bolch et al., 2017; Li et al., 2021a). The DEM was created from C-band SAR data collected in February 2000 and thus has extensive snow cover over most mountain regions of the northern hemisphere.
In this paper, we propose a methodology that addresses uncertainties related to optical sensors and radar penetration. We do so through a probabilistic approach (see Section 3) relying on the unification of error modeling for DEMs from both optical and radar sensors (Section 3.1) with available knowledge on glacier thickness changes (Section 3.2) within a statistically consistent framework.
3 Bayesian formulation
Let us consider the DEM subtraction problem for two 3-D aligned DEMs from which we compute the glacier surface elevation change Z over a given period T as follows:
Where z(t) is the digital representation of surface elevation, observed at a finite set of locations s over a spatial domain
Since DEMs are inherently imperfect representations of the true, exact underlying ground surface (unknown and inaccessible), Z(s, T) correspondingly carries an uncertainty that propagates in surface elevation change calculations. The true and unknown surface elevation change, hereafter denoted X, is thus a latent variable that we aim to infer from its direct measurement Z:
where e(s, t) is the unknown difference between the observed and the “true” surface elevation change. In a recent publication, Hugonnet et al. (2022) relied on inferential methods from stable ground to characterize e(s, t). Here, we opt for a different approach and aim to provide a probabilistic estimate of the “true” glacier elevation change X from observations of Z, conditioned only on data- and model-based knowledge on glacier surface elevation changes.
Any known information available about X before considering Z is called prior information and is hereafter denoted I. I here mainly includes assumptions or previous knowledge about glacier dynamics. The Bayesian DEM subtraction problem amounts to finding p(X|Z, I) which is the probability density of X conditional to knowing both Z and I, also known as the posterior probability density function (PDF) of X. More formally, applying Bayes’ theorem to our problem, we can write:
The right-hand side of Eq. (3) comprises three terms playing distinct roles in the inference process.
p(Z|X, I) is called the likelihood. It represents the probability density of observing the glacier surface elevation changes as described by Z and a defined error model (see Section 3.1) if we assume the true glacier thickness change X and I to be known. This term captures all the measurement errors related to different topographic parameters (terrain roughness, slope, aspect, etc.) and cloud cover (see Section 3.1).
p(X|I) is called the prior and encodes all a priori information assumed about X, gathered from knowledge on the physics of glaciers and glacier dynamics. We discuss the prior term in greater detail in Section 3.2.
Finally, p(Z|I) is a normalizing constant independent from X and ensuring ∫p(X|Z, I)dX = 1. Its value is of no practical significance for this work. We shall thus neglect it and remember that the posterior PDF (Eq. (3)) is defined up to a normalizing constant.
3.1 Likelihood
The first ingredient of Bayesian inference is the likelihood, which captures the DEM-related errors by describing the probability of observing Z under a given error model and prior information I: p(Z|X, I). In the present case, the likelihood aims to model measurement error sources in digital elevation datasets.
In this work, we want to be able to deal with mixed radar and optical datasets and will construct simple empirical models for 3 sources of errors:
• Terrain morphology
• Radar penetration for radar datasets
• Low-contrast areas and cloud obscuration for optical datasets
For both radar and optical sensors, terrain morphology and sample density have been documented as first-order controls of DEM error and uncertainty (Aguilar et al., 2005; Wise, 2011; Mukherjee et al., 2013; Hubacek et al., 2016; Hugonnet et al., 2022). We thus follow the findings of Heritage et al. (2009); Wheaton et al. (2010); Milan et al. (2011) documenting the effect of terrain morphology on DEM errors and use terrain roughness (largest inter-cell difference for a central pixel and its surrounding cell (Darnell et al., 2008)–hereafter denoted r) as the main parameter for the DEM error model. We assume that the DEM errors are uncorrelated across pixels, increasing with roughness r such that their standard deviation is described by an increasing function g(r). Given a true elevation change X, we therefore set for sources of errors coming from terrain morphology only:
i.e., Z follows Student’s scaled t-distribution with mean X, standard deviation g(r), and degrees of freedom k = 5. Using a Student instead of Gaussian distribution follows the well-established practice for robust inference as they present similar properties, but the Student-t features heavier tails and is thus more robust to outliers (Gelman et al., 2013). In this context, the parameter k can be freely chosen to set the weight of the tails. In practice, 3 ≤ k ≤ 10 values are recommended for inference problems (Gelman et al., 2013); we here choose to use k = 5 since it provides a good balance between mass around the mean and in the tails.
g(r) encodes the dependence of the standard deviation of DEM errors on the local terrain roughness r. For simplicity, we use the same g(r), whether the DEMs sources are radar or optical, as a first approximation of the general form and value of the error. We calibrate g(r) as described in Supplementary Appendix SA.1.1 based on empirical data and general estimates of DEM uncertainties; we stress that the goal is not to obtain a very accurate model but to capture the main uncertainties and overall dependence on terrain morphology.
As mentioned in Section 2.2, another common source of biases in glacier surface elevation changes is the penetration of C-band radar beams into snow/firn/ice in DEMs derived from radar sensors. We here model radar penetration depth at each pixel s as a Gaussian distribution, with elevation-dependent median PDD(z) and constant standard deviation σPDD. We use the empirical equations of Li et al. (2021a) as a functional form of the elevation-dependent median (see Section 4.4 for more). To account for snow penetration depth (PDD) in datasets coming from radar sensors, we modify Eq. 4 to:
where ϵ1 = 1 if DEM1 has snow penetration (e.g., a radar dataset), and 0 otherwise; and ϵ2, is similarly defined for DEM2. This amounts to shifting the expected value of Z to account for the mean penetration PDD(z) at the pixel s in the two DEMs, and increasing the standard deviation to account for the standard deviation σPDD in radar penetration. We set a constant σPDD = 0.5 m and define PDD(z) according to results from Li et al. (2021a) (e.g., Equation 14 for the Western Kunlun Shan); some models for PDD(z) are presented in Supplementary Appendix SA.1.2.
Finally, for DEMs derived from optical sensors, low-contrast areas or clouds are an additional source of errors, as mentioned in Section 2.1. These cannot be captured using a morphometrics-based model since the aberrant elevation change signal is not correlated with terrain complexity. We propose to capture those effects separately in the likelihood using a simple model. We typically expect the aberrant elevation change signal to be either markedly positive or negative, depending on whether the low contrast regions are located on DEM1 or DEM2 and with greater absolute value than the glacier change signal. Given a pixel s, we consider three possible cases: either pixel s of only DEM1 is a low-contrast artifact (event C1), or pixel s of only DEM2 is an artifact (event C2), or the pixel is a low-contrast artifact in neither DEM (event C0). We neglect the case where the same pixel is affected on both DEMs. Under these three disjoint scenarios, we therefore have three conditional likelihoods: p(Z|X, Cq, I), q = 0, 1, 2. Note that in the case C0, there are no low-contrast artifacts, and the likelihood is given by Eq. 5 which accounts for terrain-related errors and possible snow penetration:
We detail our model for the conditional likelihoods p(Z|X, Cq, I), q = 1, 2 in Supplementary Appendix SA.1.3. Finally, we obtain the full likelihood as a mixture of conditional likelihoods on the disjoint cases Cq, q = 0, 1, 2:
We obtain p(C1|I) and p(C2|I) from the DEM’s metadata (valid pixel mask for ASTER scenes, for example); for a radar DEM, we set the corresponding p(Cq|I) = 0. We also take p(C0|I) = 1 − p(C1|I) − p(C2|I).
3.2 Prior
We now turn to the description of the prior term, p(X|I) in Eq. (3), capturing all information on X known regardless of any information from the observed surface elevation changes Z. I may contain information obtained directly from already existing datasets, from modeled results, or more theoretical considerations of glacier surface elevation changes, for example.
In the present work, we form our prior over glacier surface elevation change in two steps. We first consider existing datasets from other studies to form the median of the prior probability distribution. In a second step, we define the variance as a simple model of glacier surface elevation changes, capturing contrasting elevation change patterns often documented in dynamically unstable glaciers.
The wealth of data produced by recent studies quantifying glacier volume changes (Brun et al., 2017; Braun et al., 2019; Shean et al., 2020; Hugonnet et al., 2021) provides valuable a-priori information for our inference process. Given the data gaps present and the use of higher order polynomials used to minimize errors in Brun et al. (2017), we only consider the datasets from Shean et al. (2020) (Available at https://zenodo.org/record/3600624) and Hugonnet et al. (2021) (available at https://www.sedoo.fr/theia-publication-products/?uuid=c428c5b9-df8f-4f86-9b75-e04c778e29b9) as potential prior information.
To derive our prior formulation, we first compute the median and 70% interpercentile range (distance between the 15th and 85th percentile) of the yearly surface elevation change rate for 100 m elevation bins for all glaciers in High Mountain Asia (HMA) for 2000–2018 for both the Shean et al. (2020) and Hugonnet et al. (2021) datasets (Figure 1), using another DEM as elevation reference (Copernicus DEM in the present case, see Section 4.1.2).
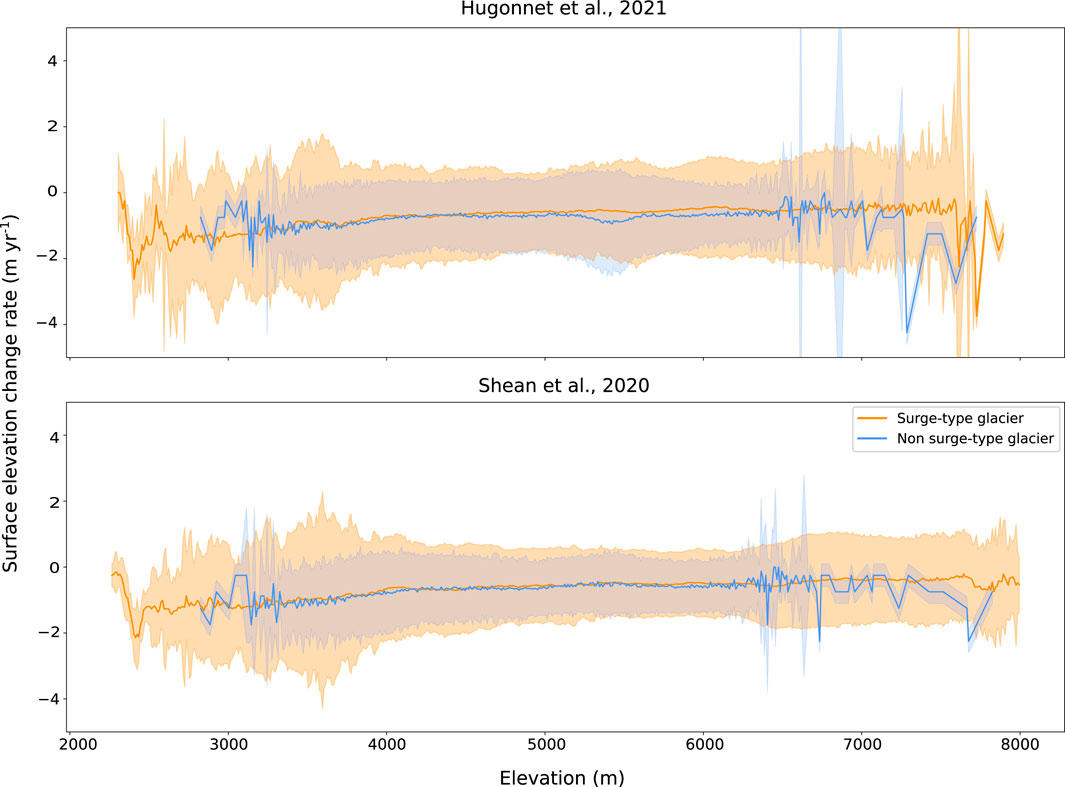
FIGURE 1. Distribution of surface elevation change rates per 100-m elevation bins from Hugonnet et al. (2021) (top) and Shean et al. (2020) (bottom) over HMA, for the 2000–2018 period. Solid lines are medians, while shaded areas represent the inter-percentile range between the 15th and 85th percentiles of each 100 m elevation bin.
Glaciers are then divided into surge-type and non-surge-type groups, using the surge-type glacier inventory generated by Guillet et al. (2022). Both datasets present an elevation-dependant median, with constant variance for stable glaciers and elevation-dependant variance for surge-type glaciers (Figure 1). The latter results from surges, especially towards lower altitudes. However, both datasets implicitly assume that thickness changes are constant over time by representing glacier thickness change as rates rather than totals over the 2000–2018/2019 period. This does not reflect the wealth of observed surge behavior, in which sudden destabilization of a glacier will lead to a rapid (over the course of months to years) dynamical thickening of up to several hundreds of meters (Bolch et al., 2017; Steiner et al., 2018; Guo et al., 2020; Muhammad and Tian, 2020). While Hugonnet et al. (2021) provide additional surface elevation change records resolved over 5-year intervals, they suffer from similar caveats and do not adequately represent possible surge-induced surface elevation changes.
We define p(X|I) as a Student-t distribution with k = 5 degrees of freedom, an empirical median derived from the Shean et al. (2020) dataset and use Eq. 19 as a scaling parameter to control the standard deviation of the distribution:
Equations for μ(z) and σX(z) are described in Supplementary Appendix A.2; see Eqs 18, 19, respectively.
The prior distribution defined here is “weakly” informative. The purpose of formulating a relatively weak prior is to explicitly regularize the inference process and thus keep estimated glacier thickness changes within a reasonable range of values, compatible with known variations resulting from dynamical thickening. A weaker prior thus allows one to capture glacier surface elevation changes resulting from a wider range of phenomena, such as dynamical thinning or thickening within a single model. Assuming that one is interested in estimating glacier thickness changes for non-surge-type glaciers, the weak prior formulation can easily be modified to constrain surface elevation changes more strictly (see Supplementary Appendix A.2).
We have now specified the likelihood (Eqs (6), (7) and Eq. 16, 17 in Supplementary Appendix A.1) and the full prior (Eq. (8), with terms discussed in Supplementary Appendix A.2). Therefore, we can evaluate the univariate posterior probability density on X using Eq. (3) for any Z(s, T). The pixel-wise estimate of the glacier thickness change is finally computed by cumulative trapezoidal numerical integration as the median of the univariate posterior probability density function.
Another descriptor of the posterior probability density function commonly used in Bayesian inference problems is the Maximum A Posteriori (MAP) which corresponds to the mode of the posterior distribution. In the present study, we use the median and the associated 90% credible interval (range of values in which one can expect the latent variable to lie, with a probability of 0.9) as the posterior probability density is multimodal. Identifying the highest mode can therefore be impossible since, in some cases, the different modes are equal (Lehmann and Casella, 2006; Casella and Berger, 2021). Even if the highest mode can be identified, it is unlikely to be representative of the posterior distribution. Although the posterior probability density median is not always the most probable value, it allows, alongside the credible interval, to better characterize the posterior PDF in its entirety, and thus provide a clearer picture of the uncertainty associated with each surface elevation change estimate.
4 Case study and results
In this section, we set up experiments to demonstrate and evaluate key points of the presented methodology. First, we consider outlier filtering by simulating errors within a DoD to reflect biases that could exist in glacier surface elevation changes computed from DEMs derived from radar and optical sensors (Section 4.2). In the second step, we test our prior formulation and the overall sensitivity of the technique to the prior parameters (Section 4.3). We then investigate our complete uncertainty estimation framework implementation by comparing our results with already published studies (Section 4.4). All experiments are independent of one another and re-use the same publicly available input DEMs.
4.1 Presentation of experiments and data
4.1.1 Overview of experiments
We test our methodology using data from the Western Kunlun Shan in the northwestern Tibetan Plateau (Figure 2). Lying south of the Tarim Basin and west of the Karakoram range, Western Kunlun Shan is one of the most glacierized regions of High Mountain Asia, containing a wide range of glacier types from cirque, valley, and piedmont glaciers to ice caps. While the northern slopes present long and relatively steep glaciers flowing into deeply incised valleys, its southern slopes present a more gradual elevation gradient. Surges have been reported to affect 18 glaciers (63% of the glacierized area), both in the northern and southern slopes of the Western Kunlun Shan (Guan et al., 2022; Guillet et al., 2022). The diverse elevation gradients and widespread complex thickness change signal resulting from dynamical instabilities make the Western Kunlun Shan a good test case for our methodology. The RGI (V6.0, RGI Consortium (2017)) outlines used in this study comprise 399 glaciers covering a total area close to 3,000 km2.
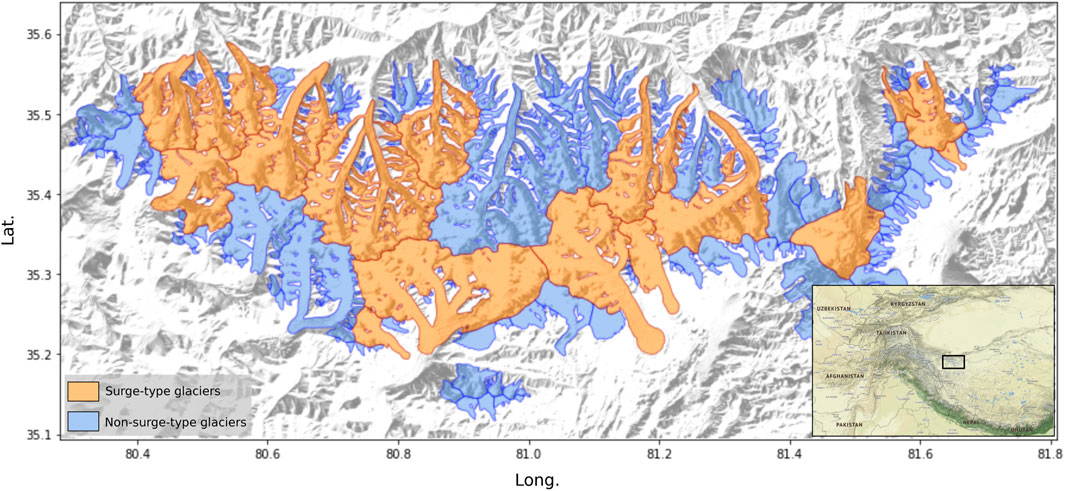
FIGURE 2. Location of the Western Kunlun Shan. Glaciers are represented by their outlines from the RGI v6.0. The classification of surge-type glaciers is from Guillet et al. (2022). Hillshade is generated from COP-DEM. Location Map data is copyrighted by OpenStreetMap contributors and available from https://www.openstreetmap.org.
For each experiment, we use the prior parameters described in Table 1 unless otherwise specified.
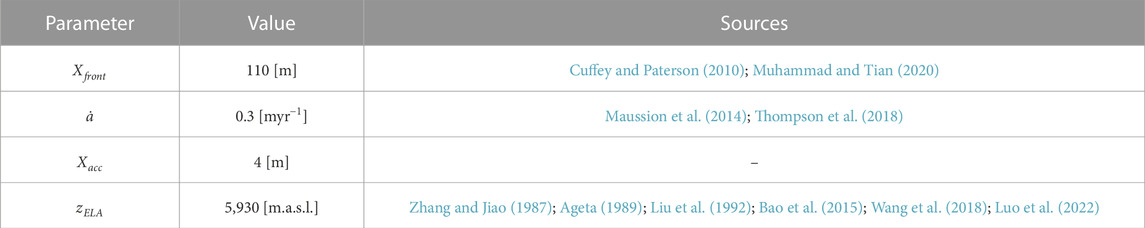
TABLE 1. Prior parameters used in the experiments.
4.1.2 Data
4.1.2.1 NASADEM
The NASADEM (hereafter referenced as NAS30) was released in 2020 and consisted of a reprocessing of the Shuttle Radar Topography Mission (SRTM, 30 m) DEM using ASTER GDEM2, advanced interferometric techniques and ground control points derived from the ICESat laser altimeter to fill existing data voids and to improve the geolocation accuracy (Crippen et al., 2016; NASA, 2020). The SRTM DEM was originally produced with WGS84 geographic coordinates, with elevation as a height measure relative to the Earth Gravitational Model 1996 (EGM96) geoid (Farr and Kobrick, 2000). We use NAS30, with its improved spatial coverage, to represent elevations from 2000. NAS30 also allows us to test the penetration correction implemented within our likelihood due to its well-known problem of C-band radar penetration into snow at higher altitudes.
4.1.2.2 Copernicus DEM
The Copernicus DEM is based on DEMs generated from TanDEM-X data acquired between December 2010 and January 2015 and went through significant post-processing, including spikes and holes removal, void filling, as well as correction of implausible terrain structures and random biases (AIRBUS, 2020a). Validated against ICESat GLAS measurements, the Copernicus DEM presents an average vertical RMSE of 1.68 m (AIRBUS, 2020b). The Copernicus DEM is provided in WGS84 geographic coordinates, using EGM2008 as a vertical reference datum. We follow Liang et al. (2022) and use the Copernicus 1 arcsec (30 m, hereafter referred to as COP30 and available at https://spacedata.copernicus.eu/collections/copernicus-digital-elevation-model) as a representation of glacier surface elevation in 2013.
4.2 Outlier filtering
We first compute glacier surface elevation changes from the coregistered NAS30 and COP30 DEMs to validate the posterior-based filter. Note that while we are aware of the radar penetration problems arising from the use of DEMs generated from radar sensors, this experiment solely focuses on testing the ability of our methodology to recover the underlying surface elevation change map in complex glaciological contexts. Therefore, we do not consider the potential radar penetration problem in this experiment but do so in the one presented in Section 4.4. The computed surface elevation changes are further used as reference DoD.
Gaussian random fields (GRFs) have been widely used to model measurement biases and random fluctuations in physical properties in spatially correlated data (Haran, 2011; Hristopulos, 2020). To mimic noise observed in glacier surface elevation changes, we simulate biases using a two-dimensional zero-mean stationary Gaussian random field:
where s1, s2 … sn are samples from the DEM
4.2.1 Gaussian random field with scale-invariant power spectrum
In this experiment, we use a GRF with a power spectrum of the form:
where ω is the conjugate of the distance d through the Fourier transform. n here controls the spatial correlation of the random field. n = 1 provides the most realistic simulated noise (see Figure 3).
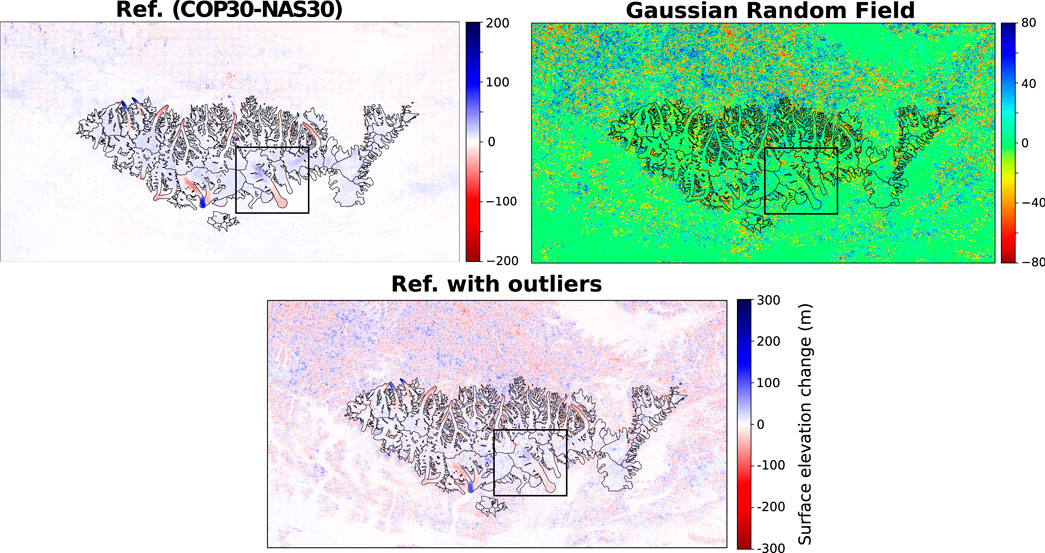
FIGURE 3. Example of simulated errors using a heteroscedastic GRF with scale-invariant power spectrum with n = 1. Glacier outlines originate from the RGI v6.0. Ref. stands for reference DoD. Box represents the extent of Figure 4.
4.2.2 Gaussian random field with Gaussian power spectrum
In this experiment, we derive a Gaussian power spectrum for the GRF from Hugonnet et al. (2022). In Eqs 15, 16, they proposed an analytical form of an empirical variogram relying on two different models: Gaussian at short ranges and spherical models at longer ranges. Hugonnet et al. (2022) further report the decorrelation of 95% of variance on flowing glacier ice for distances greater than 38 m. For the sake of simplicity, we here neglect the remaining 5% of variance and assume a variogram of the form:
with s = 1 being the sill for standardized elevation differences and r = 38 m. From this, we can derive the covariance function:
To model this covariance function, we take the power spectrum to be:
where
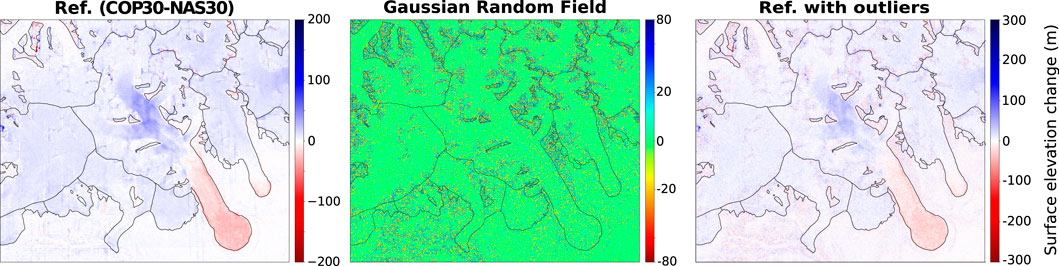
FIGURE 4. Example of simulated noise using the heteroscedastic GRF with Gaussian power spectrum. Glacier outlines originate from the RGI v6.0. Ref. stands for reference DoD. Closeup from Figure 3.
Figures 5, 6 show the surface elevation change maps with simulated noise and compares them to the posterior distribution. Qualitatively, the proposed methodology satisfactorily culls the artificial noise in the scale-invariant and Gaussian cases. We further note that additional spurious elevation change in the reference map has been filtered alongside the added noise.

FIGURE 5. (A) Elevation change maps for the Western Kunlun Shan (left). Closeup of the elevation change map in the area delineated by the black box (right). Reference glacier thickness change computed from the difference between COP30 and NAS30. (B) Reference glacier thickness change with noise added from the Gaussian random field. (C) Estimated noise-free surface elevation change map. (D) Difference between third and second rows. Note that the filter has culled noise present in the reference map. SI and G, respectively, refer to scale invariant and Gaussian. Both refer to the power spectrum of the Gaussian random field used in each case.
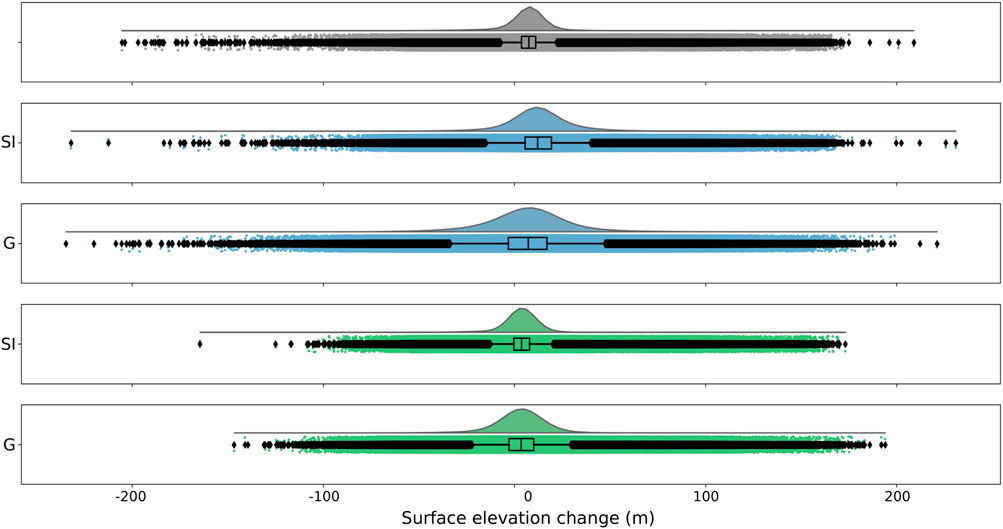
FIGURE 6. Distributions of the reference surface elevation change (top, grey), the surface elevation changes with added noise from Gaussian (G) and scale invariant (SI) power spectrum random field (center, blues), the medians of the posterior on glacier surface elevation changes for each test case (bottom, greens). The boxes show the quartiles of each distribution, and the whiskers extend to show the rest of the distribution.
More quantitatively, the medians of the reference DoD (gray, Figure 6) and surface elevation change maps with Gaussian and scale invariant noise are 7.5, 7.3, and 12 m, respectively, over the considered period. Medians of the posterior on glacier surface elevation changes for the scale invariant (n = 1) and Gaussian power spectra are consistent, with medians of 3.7 and 3.5 m, respectively. We note a wider spread for the Gaussian power spectrum case. The most likely explanation for this is high-valued artificial noise at relatively low elevations, typically below the Equilibrium Line Altitude (ELA) (Figure 5). Given the weaker prior below the ELA (see section Supplementary Appendix SA.2), our methodology does not consider these pixels outliers. Still, they are affected with greater uncertainty, as demonstrated by the distribution of widths of the 90% credible regions (Figure 7). While a weaker prior allows to accommodate a wider range of surface elevation change patterns, it does so at the cost of additional variance.
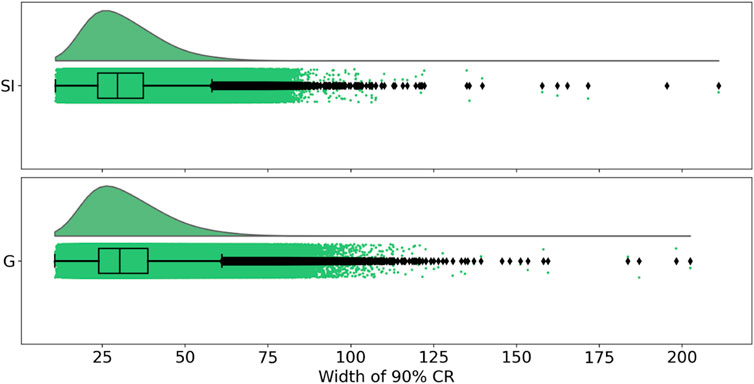
FIGURE 7. Distributions of the width of 90% credible regions for the scale invariant (SI) and Gaussian (G) cases.
4.3 Prior selection and sensitivity
4.3.1 Impact of the ELA on the posterior on surface elevation changes
We first compute the reference elevation change over the Western Kunlun Shan by culling outliers from the COP30-NASA30 surface elevation change map. Then, elevation changes over the Western Kunlun Shan are estimated for various ELA values: 5,600, 5,700, 6,000, 6,200, and 6,500 m (see Table 1). These values purposely lie outside of the expected interval for both end-of-summer transient snowlines (5,900–6,100 m) and equilibrium line (5930 m) altitudes to test the effect of “extreme” hyperparameter values on the filter’s performance.
The resulting posterior distributions for surface elevation change maps computed with ELAs equal to 5,600 and 5,700 m present an important bias toward 0 values compared to the reference DoD, with median surface elevation changes of 0.0 and 1.3 m and interpercentile range (IPR, between the 25th and 75th percentile) of 4.2 and 5.3 m respectively during the 2000–2013 period (Figure 8). As expected, the distributions of widths of 90% credible regions are similarly biased towards smaller values, with medians of 18 (ELA 5600 m) and 22 m (ELA 5700 m) and IPR of 9 m. This bias in filtered surface elevation change and width of 90% credible regions directly results from the altitude of the equilibrium line in these examples, as it is lower than the terminus for 269 glaciers of the 399 in this example.
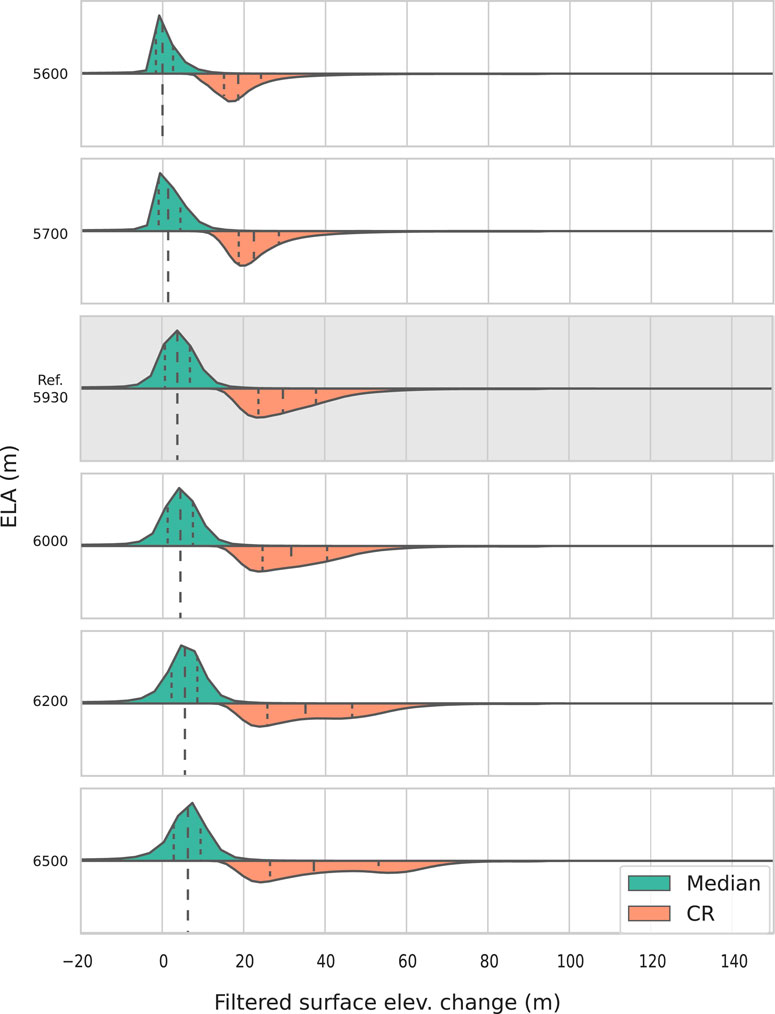
FIGURE 8. Distributions of the median (green) and width of a 90% credible region (CR, between the 5% and 95% percentile, orange) filtered surface elevation changes for different ELA values. The gray background indicates the reference DoD. Note the heavily biased distributions for ELAs of 5,600 and 5,700 m. Note that the inverse representation of the CR distributions is for readability only.
Strong similarities exist between the posterior distributions for the reference and surface elevation change maps computed with ELA = [6,000, 6,200]. The distributions are consistent with each other, presenting median surface elevation changes close to 3.8 (reference DoD), 4.3 (ELA = 6,000 m), and 5.4 m (ELA = 6,200 m), and IPR of 6.1, 6.2, 6.3 m, respectively, over the 2000–2013 period. The distribution of widths for the 90% credible regions is more conservative, with medians close to 29.7 (reference DoD), 31.5 (ELA 6,000 m), and 35 m (ELA 6,200 m) and IPR ranging from 14.1 to 20 m.
Finally, the posterior distribution on surface elevation change computed with an ELA=6,500 m presents a median of 6.3 m. The distribution of widths of 90% credible regions is significantly wider, with an IPR of 26 m during the 2000–2013 period.
4.3.2 Impact of errors in the reference DEM
As defined by Eq. (8), the prior captures knowledge on pixel-wise glacier thickness change, given a certain elevation and glacier ELA (see section Supplementary Appendix SA.2). Elevation
To test for the impact of errors ϵs on our prior formulation, we first define
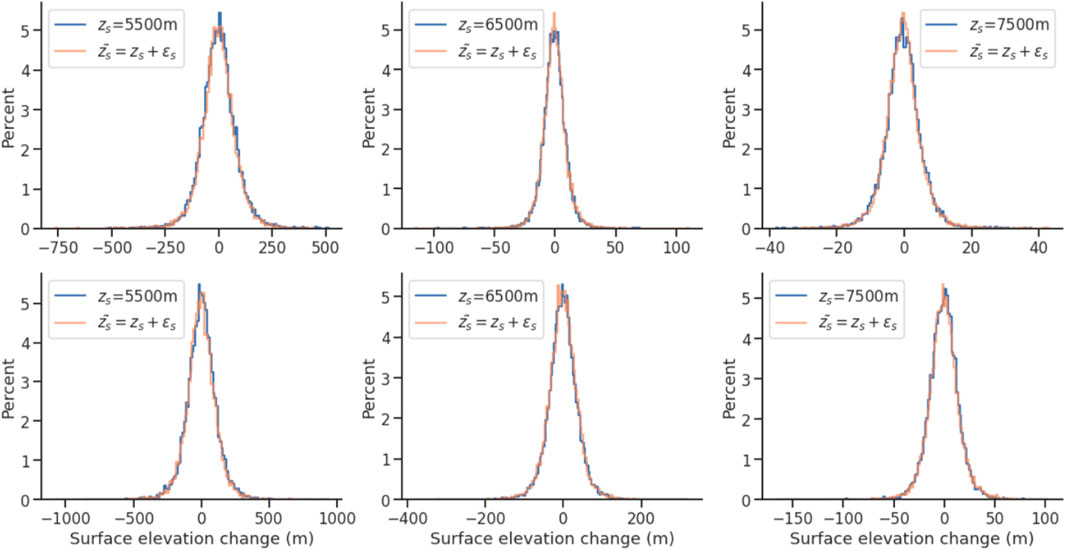
FIGURE 9. Distributions of realizations of the prior probabilities on X given zs (blue) and
4.4 Comparison with other glacier surface elevation changes in the Western Kunlun Shan
Finally, we estimate glacier thickness changes using all the features presented in our methodology (Figure 10). Here, we thus further account for the well-known problem of radar C-band and X-band snow penetration.
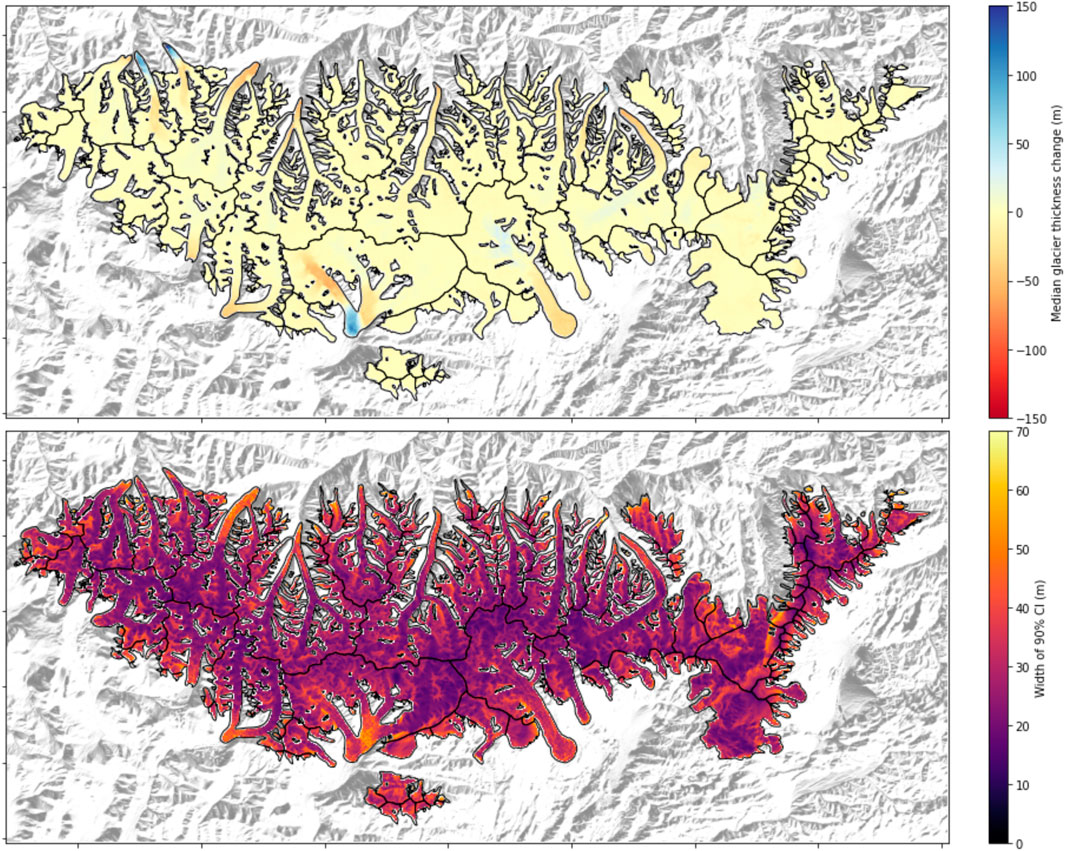
FIGURE 10. Maps of the median pixel-wise elevation change (top) and pixel-wise 90% credible interval for the Western Kunlun Shan case study, between 2000 (NASADEM) and 2013 (COP-DEM). Hillshade is generated from COP-DEM.
The correction is parameterized using the results from Li et al. (2021a) empirically describing the radar penetration depth in the Western Kunlun Shan as linearly dependent on the altitude, with a function of the form:
where PDD is the penetration depth difference of the C/X-Band STRM and z is the elevation. We follow the method of Liang et al. (2022) and apply a similar correction to the NAS30 and COP30 DEMs.
Comparing results between uncertainties estimated from frequentist and Bayesian approaches is not straightforward, as initial assumptions and design philosophies strongly differ. While describing the posterior distribution as a single-value estimate is not representative of Bayesian methods, we can nevertheless compare the median of the posterior distribution on glacier surface elevation changes with similar products published previously (Figure 11). In the following, we further express our results as glacier surface elevation change rates for consistent comparison with the other studies. However, we want to restate that computing rates over periods greater than the duration of the active surge phase implies constant surface elevation changes over the considered time interval. This does not adequately represent surge-type dynamics and directly contradicts the observed surge behavior (Benn et al., 2019; Guillet et al., 2022).
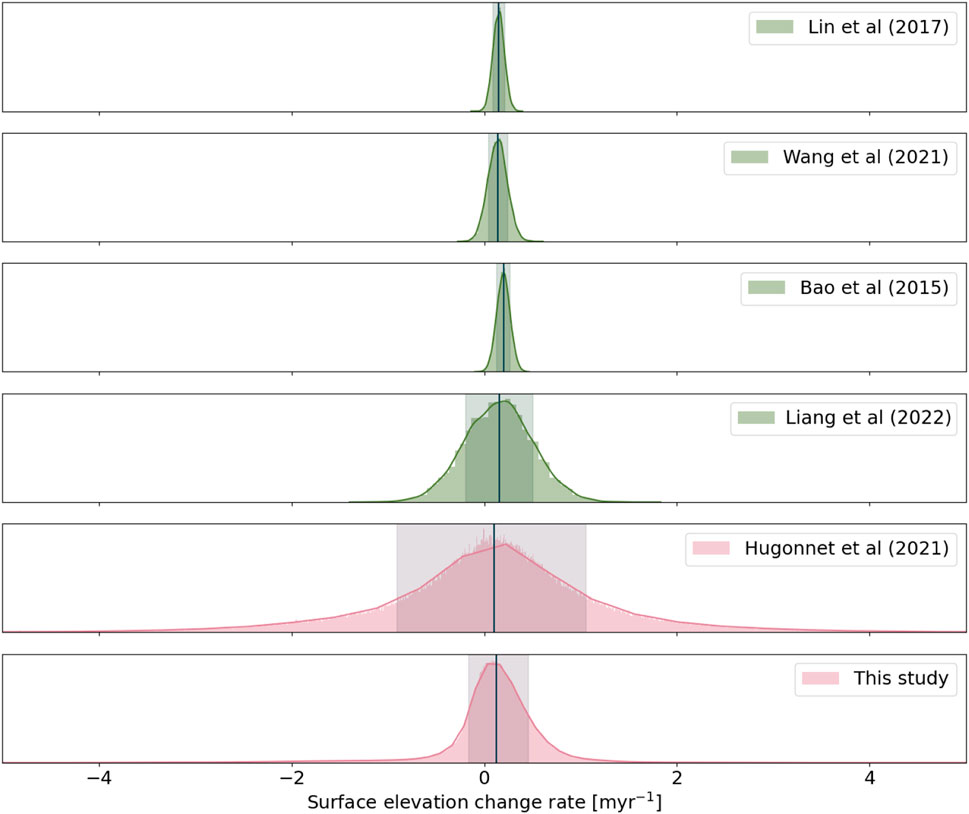
FIGURE 11. Comparison between distributions of glacier surface elevation change rates computed from the studies described in this section. Solid black lines represent medians, and vertical grey spans represent the inter-percentile range between the 16th and 84th percentiles. Distributions in green are Gaussian generated using the median and standard deviation provided by the authors in their respective studies. Distributions in red are directly generated using available data. Note how Gaussian distributions (green) fail to represent the heavy tails observed in glacier surface elevation change.
Over the 2000–2013 period, we find a general glacier thickening in the Western Kunlun Shan of
Figure 11 further illustrates a common problem in reporting glacier thickness changes as Gaussian distributions. Without access to the data, we generated distributions from the means and standard deviations reported in Bao et al. (2015); Lin et al. (2017); Wang et al. (2021) and Liang et al. (2022). We observe that the heavy tails in the distributions generated from the Hugonnet et al. (2021) data and our results (reds in Figure 11) are not adequately captured when relying on the metrics provided Bao et al. (2015); Lin et al. (2017); Wang et al. (2021) and Liang et al. (2022) (greens in Figure 11). This further exemplifies the major caveats in reporting glacier surface elevation changes and rates as means and standard deviations, as they are not representative measures of a non-Gaussian distribution’s central tendency and dispersion.
5 Discussion
In this paper, we proposed a proof of concept demonstrating that Bayesian modeling, allowing for the unification of outlier filtering and uncertainty estimation within a statistically coherent framework, can be successfully applied to remote sensing of glacier changes. We characterized the state of knowledge on glacier surface elevation changes through the posterior distribution as the combination of glacier volume variation observations, prior knowledge from scientific knowledge, and previously collected data. This contrasts with the more common approaches used in remote sensing of glacier changes relying on static control surfaces to characterize or minimize errors through the use of different accuracy measures (Pieczonka and Bolch, 2015; Braun et al., 2019; Shean et al., 2020; Hugonnet et al., 2021), higher-order polynomials (Brun et al., 2017) or inference processes (Hugonnet et al., 2022).
The method further alleviates the problems raised by approaches that rely on regression methods and dense DEM time-series to compute glacier thickness changes (Brun et al., 2017; Hugonnet et al., 2021). While such methods maximize the likelihood of their given statistical model (linear trend or Gaussian process) to explain the observed data, the lack of regularization likely leads to overfitting, as Gaussian process models require fine-tuning of the kernel functions and their hyperparameters (Rasmussen and Williams, 2005). The robustness of estimates computed from Gaussian process models typically suffers from high variability in sampling rate or important temporal data gaps. In the Bayesian model, formulating an a priori knowledge with known and naturally interpretable parameters regularizes the inference process, making it more robust and immune to spurious spatial and temporal correlations. A logical next step would be to unify the proposed methodology with the time-series approach of Hugonnet et al. (2021) within a Bayesian updating/data assimilation framework. Such a scheme would allow a fully probabilistic formulation of the geodetic mass balance of glaciers, incorporating the quantification of uncertainties related to data, glacier area change, and ice volume-to-mass conversion.
The Bayesian inferential paradigm incorporates previous knowledge and physical considerations on the studied latent process and provides a natural interpretation of credible intervals (credible regions or sets). Indeed, contrary to the frequentist confidence interval, the Bayesian credible region quantifies the range of values within which the latent variable falls with a particular probability. In addition, the flexibility of the Bayesian approach allows one to modify the framework’s ingredients as new knowledge becomes available. The proposed Bayesian model can readily be extended to any other type of digital surface elevation dataset, such as laser altimetry or InSAR, provided that the errors associated with each sensor can be modeled satisfactorily. As an example, a model estimating glacier or ice sheet thickness change from laser altimetry would have to account for errors resulting from geomorphometry (surface roughness, etc., Harding et al. (1994); Brunt et al. (2019)), vertical ice flow (surface submergence/emergence, Hubbard et al. (2000); Enderlin et al. (2022)) and the physical nature of the land surface (firn densification and water content, Smith et al. (2023)).
In Section 4.4, we showed that the presented method can successfully estimate glacier surface elevation changes and associated uncertainties. By comparing our results with previous efforts to quantify surface elevation changes in the Western Kunlun Shan, we found discrepancies in the distributions of single-value estimates of glacier surface elevation changes. However, these discrepancies can be explained by the difference in input data and the more conservative approach to defining weak priors for all glaciers in the study region. The latter can be addressed by introducing finer glacier-specific priors relying, for example, on existing surge-type glacier inventories. Due to the inherently different nature of the uncertainties estimated between various methodologies, it is impossible to compare the uncertainties directly. Furthermore, we demonstrated that the proposed methodology satisfactorily characterizes the state of knowledge on glacier surface elevation changes from observations and prior information and provides estimates of glacier surface elevation change that are broadly consistent with previous results. The presented uncertainties (i.e., the width of credible regions) are likely overestimated since each surface elevation change pixel is considered independent of its surroundings and the information provided by neighboring observations is not considered. Future improvements to the presented methodology typically include incorporating important findings from Hugonnet et al. (2022), such as accounting for long-range spatial correlation in errors and refining the error descriptors used in the likelihood.
Finally, we recommend that researchers follow the examples established by recent efforts (Hugonnet et al., 2021) and the present study and abandon reporting changes in glacier thickness and geodetic mass balance through means and standard deviations. Glacier instabilities, such as surges and other dynamical ice mass redistribution phenomena, are prime examples that glacier changes are not smooth in space or time (Krabill et al., 2004; Csatho et al., 2014). Implying Gaussianity in the distribution of changes in glacier thickness does not reflect the diversity of observed behaviors and further suggests constant variance throughout the studied zone and period. Researchers should aim to describe their results through robust gridded estimates of the central value (the median, for example) and associated spread (an inter-percentile range or the Median Absolute Deviation, MAD) of the thickness change distribution, similar to the results of Hugonnet et al. (2021) or presented in Figure 10. Finally, we wish to emphasize that probabilistic methods, such as the one proposed here, present an adaptable alternative to frequentist approaches when estimating observable glacier quantities from imperfect observations, as they allow for the specification of intuitive error structures, constrained by prior knowledge derived from physical principles of glacier dynamics.
6 Conclusion
This paper presented a novel method for estimating glacier surface elevation changes based on a Bayesian formulation of the DEM subtraction problem. Driven by the goal of providing robust probabilistic estimates of glacier surface elevation changes computed from the subtraction of DEMs in complex glaciological contexts, we introduced models for errors in input data relying on geomorphometrics and conditioned observations using available scientific knowledge on glacier changes. We integrated these ingredients into a statistically consistent Bayesian framework, which can readily be extended to other data types (i.e., measurements from laser altimeters) and sources of uncertainty, provided that they can be modeled satisfactorily.
We applied and tested the method using glaciers in the Western Kunlun Shan, located at the northwestern edge of the Tibetan Plateau and known for its many surge-type glaciers. Our method produced estimates of glacier surface elevation changes consistent with previously published results. Combining Bayesian outlier filtering with probabilistic uncertainty models, the method consistently estimates glacier surface elevation changes in complex glaciological contexts while propagating the associated uncertainties. Although the examples presented in this study focus on dynamically unstable surge-type glaciers, the methodology is readily useable for all glaciological contexts.
Efforts are needed to extend the Bayesian framework to effectively assimilate further glacier observations in the model, such as glacier velocities, and to refine the integration of spatially correlated information, such as surrounding pixels. The increased availability of glacier products derived from satellite sensors (e.g., digital elevation models, surface velocities) and computing power provide the scientific community with large volumes of quantitative physical information. As presented in this study, Bayesian methods are valuable tools for building sophisticated models to estimate glacier quantities from remotely-sensed data while providing an adaptable framework to estimate and control uncertainties in the results.
Data availability statement
The original contributions presented in the study are included in the article/Supplementary Material, further inquiries can be directed to the corresponding author.
Author contributions
GG and TB designed the study. GG designed the methodology, implemented the code, performed the simulations, analyzed the results, and generated the figures. GG wrote the paper with the support of TB. All authors contributed to the article and approved the submitted version.
Funding
This study was supported by the Swiss National Science Foundation (200021E 177652/1) within the DFG Research Unit GlobalCDA (FOR2630) framework.
Acknowledgments
The authors would like to thank the reviewers and the Editor, Alun Hubbard, for their feedback and comments, which have significantly improved the manuscript. We also would like to thank Owen King, Thomas Guillet, Romain Hugonnet, and Fanny Brun for helpful exchanges and constructive comments on earlier versions of the manuscript.
Conflict of interest
The authors declare that the research was conducted in the absence of any commercial or financial relationships that could be construed as a potential conflict of interest.
Publisher’s note
All claims expressed in this article are solely those of the authors and do not necessarily represent those of their affiliated organizations, or those of the publisher, the editors and the reviewers. Any product that may be evaluated in this article, or claim that may be made by its manufacturer, is not guaranteed or endorsed by the publisher.
Supplementary material
The Supplementary Material for this article can be found online at: https://www.frontiersin.org/articles/10.3389/feart.2023.1076732/full#supplementary-material
References
Ageta, Y. (1989). Mass balance studies on chongce ice cap in the west kunlun mountains. Bull. glacier Res. 7, 37–43.
Aguilar, F. J., Agüera, F., Aguilar, M. A., and Carvajal, F. (2005). Effects of terrain morphology, sampling density, and interpolation methods on grid DEM accuracy. Photogrammetric Eng. Remote Sens. 71, 805–816. doi:10.14358/PERS.71.7.805
AIRBUS (2020a). Copernicus DEM: Copernicus digital elevation model product handbook. AO/1-9422/18/I-LG.
AIRBUS (2020b). Copernicus DEM: Copernicus digital elevation model validation report. AO/1-9422/18/IL G.
Bao, W.-j., Liu, S.-y., Wei, J.-f., and Guo, W.-q. (2015). Glacier changes during the past 40 years in the west kunlun Shan. J. Mt. Sci. 12, 344–357. doi:10.1007/s11629-014-3220-0
Benn, D. I., Jones, R. L., Luckman, A., Fürst, J. J., Hewitt, I., and Sommer, C. (2019). Mass and enthalpy budget evolution during the surge of a polythermal glacier: a test of theory. J. Glaciol. 65, 717–731. doi:10.1017/jog.2019.63
Berthier, E., Arnaud, Y., Vincent, C., and Remy, F. (2006). Biases of srtm in high-mountain areas: implications for the monitoring of glacier volume changes. Geophys. Res. Lett. 33. doi:10.1029/2006gl025862
Berthier, E., Floricioiu, D., Gardner, A. S., Gourmelen, N., Jakob, L., Paul, F., et al. (2023). Measuring glacier mass changes from space-a review. Rep. Prog. Phys. 86, 036801. doi:10.1088/1361-6633/acaf8e
Beyer, R. A., Alexandrov, O., and McMichael, S. (2018). The ames stereo pipeline: NASA’s open source software for deriving and processing terrain data. Earth Space Sci. 5, 537–548. doi:10.1029/2018EA000409
Bhattacharya, A., Bolch, T., Mukherjee, K., King, O., Menounos, B., Kapitsa, V., et al. (2021). High Mountain Asian glacier response to climate revealed by multi-temporal satellite observations since the 1960s. Nat. Commun. 12, 4133. doi:10.1038/s41467-021-24180-y
Bhushan, S., Shean, D., Alexandrov, O., and Henderson, S. (2021). Automated digital elevation model (DEM) generation from very-high-resolution Planet SkySat triplet stereo and video imagery. ISPRS J. Photogrammetry Remote Sens. 173, 151–165. doi:10.1016/j.isprsjprs.2020.12.012
Bingham, A. W., and Rees, W. G. (1999). Construction of a high-resolution DEM of an Arctic ice cap using shape-from-shading. Int. J. Remote Sens. 20, 3231–3242. doi:10.1080/014311699211723
Bolch, T., Kamp, U., and Olsenholler, J. (2005). “Using ASTER and SRTM DEMs for studying geomorphology and glaciation in high mountain areas,” in Oluić, marinko. New strategies for European remote sensing. Rotterdam: millpress, 119-127. Editor M. Oluić (Rotterdam: Millpress), 119–127. doi:10.5167/uzh-137249
Bolch, T., Pieczonka, T., and Benn, D. I. (2011). Multi-decadal mass loss of glaciers in the Everest area (Nepal Himalaya) derived from stereo imagery. Cryosphere 5, 349–358. doi:10.5194/tc-5-349-2011
Bolch, T., Pieczonka, T., Mukherjee, K., and Shea, J. (2017). Brief communication: glaciers in the Hunza catchment (Karakoram) have been nearly in balance since the 1970s. Cryosphere 11, 531–539. doi:10.5194/tc-11-531-2017
Braun, M. H., Malz, P., Sommer, C., Farías-Barahona, D., Sauter, T., Casassa, G., et al. (2019). Constraining glacier elevation and mass changes in South America. Nat. Clim. Change 9, 130–136. doi:10.1038/s41558-018-0375-7
Brinkerhoff, D. J., Aschwanden, A., and Truffer, M. (2016). Bayesian inference of subglacial topography using mass conservation. Front. Earth Sci. 4, 8. doi:10.3389/feart.2016.00008
Brun, F., Berthier, E., Wagnon, P., Kääb, A., and Treichler, D. (2017). A spatially resolved estimate of High Mountain Asia glacier mass balances from 2000 to 2016. Nat. Geosci. 10, 668–673. doi:10.1038/ngeo2999
Brun, F., Buri, P., Miles, E. S., Wagnon, P., Steiner, J., Berthier, E., et al. (2016). Quantifying volume loss from ice cliffs on debris-covered glaciers using high-resolution terrestrial and aerial photogrammetry. J. Glaciol. 62, 684–695. doi:10.1017/jog.2016.54
Brunt, K., Neumann, T., and Smith, B. (2019). Assessment of icesat-2 ice sheet surface heights, based on comparisons over the interior of the antarctic ice sheet. Geophys. Res. Lett. 46, 13072–13078. doi:10.1029/2019gl084886
Carlisle, B. H. (2005). Modelling the spatial distribution of DEM error. Trans. GIS 9, 521–540. doi:10.1111/j.1467-9671.2005.00233.x
Cogley, J. G., Arendt, A., Bauder, A., Braithwaite, R., Hock, R., Jansson, P., et al. (2010). Glossary of glacier mass balance and related terms.
Crippen, R., Buckley, S., Agram, P., Belz, E., Gurrola, E., Hensley, S., et al. (2016). Nasadem global elevation model: methods and progress. Int. Archives Photogrammetry, Remote Sens. Spatial Inf. Sci. 41, 125–128. doi:10.5194/isprs-archives-XLI-B4-125-2016
Csatho, B. M., Schenk, A. F., van der Veen, C. J., Babonis, G., Duncan, K., Rezvanbehbahani, S., et al. (2014). Laser altimetry reveals complex pattern of Greenland ice sheet dynamics. Proc. Natl. Acad. Sci. 111, 18478–18483. doi:10.1073/pnas.1411680112
Dall, J. (2007). Insar elevation bias caused by penetration into uniform volumes. IEEE Trans. Geoscience remote Sens. 45, 2319–2324. doi:10.1109/tgrs.2007.896613
Dall, J., Madsen, S. N., Keller, K., and Forsberg, R. (2001). Topography and penetration of the Greenland ice sheet measured with airborne SAR interferometry. Geophys. Res. Lett. 28, 1703–1706. doi:10.1029/2000GL011787
Darnell, A. R., Tate, N. J., and Brunsdon, C. (2008). Improving user assessment of error implications in digital elevation models. Comput. Environ. Urban Syst. 32, 268–277. doi:10.1016/j.compenvurbsys.2008.02.003
Davis, C., and Ferguson, A. (2004). Elevation change of the Antarctic ice sheet, 1995-2000, from ERS-2 satellite radar altimetry. IEEE Trans. Geoscience Remote Sens. 42, 2437–2445. doi:10.1109/TGRS.2004.836789
Dehecq, A., Gardner, A. S., Alexandrov, O., McMichael, S., Hugonnet, R., Shean, D., et al. (2020). Automated processing of declassified KH-9 hexagon satellite images for global elevation change analysis since the 1970s. Front. Earth Sci. 8, 516. doi:10.3389/feart.2020.566802
Dehecq, A., Millan, R., Berthier, E., Gourmelen, N., Trouvé, E., and Vionnet, V. (2016). Elevation changes inferred from tandem-x data over the mont-blanc area: impact of the x-band interferometric bias. IEEE J. Sel. Top. Appl. Earth Observations Remote Sens. 9, 3870–3882. doi:10.1109/jstars.2016.2581482
Eineder, M. (2003). Efficient simulation of sar interferograms of large areas and of rugged terrain. IEEE Trans. Geoscience Remote Sens. 41, 1415–1427. doi:10.1109/tgrs.2003.811692
Enderlin, E. M., Elkin, C. M., Gendreau, M., Marshall, H., O’Neel, S., McNeil, C., et al. (2022). Uncertainty of icesat-2 atl06-and atl08-derived snow depths for glacierized and vegetated mountain regions. Remote Sens. Environ. 283, 113307. doi:10.1016/j.rse.2022.113307
Farr, T. G., and Kobrick, M. (2000). Shuttle radar topography mission produces a wealth of data. Eos, Trans. Am. Geophys. Union 81, 583–585. doi:10.1029/eo081i048p00583
Fischer, M., Huss, M., and Hoelzle, M. (2015). Surface elevation and mass changes of all Swiss glaciers 1980–2010. Cryosphere 9, 525–540. doi:10.5194/tc-9-525-2015
Futamura, N., Takaku, J., Suzuki, H., Iijima, T., Tadono, T., Matsuoka, M., et al. (2002). High resolution DEM generation from ALOS PRISM data -algorithm development and evaluation. IEEE Int. Geoscience Remote Sens. Symposium 1, 405–407. doi:10.1109/IGARSS.2002.1025054
Gardelle, J., Berthier, E., and Arnaud, Y. (2012). Impact of resolution and radar penetration on glacier elevation changes computed from DEM differencing. J. Glaciol. 58, 419–422. doi:10.3189/2012JoG11J175
Gardelle, J., Berthier, E., Arnaud, Y., and Kääb, A. (2013). Region-wide glacier mass balances over the Pamir-Karakoram-Himalaya during 1999–2011. Cryosphere 7, 1263–1286. doi:10.5194/tc-7-1263-2013
Gardner, A., Moholdt, G., Arendt, A., and Wouters, B. (2012). Accelerated contributions of Canada’s Baffin and Bylot Island glaciers to sea level rise over the past half century. Cryosphere 6, 1103–1125. doi:10.5194/tc-6-1103-2012
GDAL/OGR contributors (2021). GDAL/OGR geospatial data abstraction software library. Open Source Geospatial Foundation. Available at: https://github.com/OSGeo/gdal/blob/master/CITATION.
Gelman, A., Carlin, J. B., Stern, H. S., Dunson, D. B., Vehtari, A., and Rubin, D. B. (2013). “Models for robust inference,” in Bayesian data analysis Third edn. (Chapman and Hall/CRC), 439–473.
Girod, L., Nuth, C., Kääb, A., McNabb, R., and Galland, O. (2017). MMASTER: improved ASTER DEMs for elevation change monitoring. Remote Sens. 9, 704. doi:10.3390/rs9070704
González-Moradas, M. d. R., and Viveen, W. (2020). Evaluation of ASTER GDEM2, SRTMv3.0, ALOS AW3D30 and TanDEM-X DEMs for the Peruvian Andes against highly accurate GNSS ground control points and geomorphological-hydrological metrics. Remote Sens. Environ. 237, 111509. doi:10.1016/j.rse.2019.111509
Gopalan, G., Zammit-Mangion, A., and McCormack, F. (2021). A review of bayesian modelling in glaciology. arXiv preprint arXiv:2112.13663.
Guan, W., Cao, B., Pan, B., Chen, R., Shi, M., Li, K., et al. (2022). Updated surge-type glacier inventory in the west kunlun mountains, Tibetan plateau, and implications for glacier change. J. Geophys. Res. Earth Surf. 127, e2021JF006369. doi:10.1029/2021JF006369
Guillet, G., Guillet, T., and Ravanel, L. (2020). Camera orientation, calibration and inverse perspective with uncertainties: a Bayesian method applied to area estimation from diverse photographs. ISPRS J. Photogrammetry Remote Sens. 159, 237–255. doi:10.1016/j.isprsjprs.2019.11.013
Guillet, G., King, O., Lv, M., Ghuffar, S., Benn, D., Quincey, D., et al. (2022). A regionally resolved inventory of High Mountain Asia surge-type glaciers, derived from a multi-factor remote sensing approach. Cryosphere 16, 603–623. doi:10.5194/tc-16-603-2022
Guo, L., Li, J., Li, Z.-w., Wu, L.-x., Li, X., Hu, J., et al. (2020). The surge of the hispar glacier, central Karakoram: SAR 3-D flow velocity time series and thickness changes. J. Geophys. Res. Solid Earth 125, e2019JB018945. doi:10.1029/2019JB018945
Haran, M. (2011). “Gaussian random field models for spatial data,” in Handbook of Markov chain Monte Carlo (Chapman and Hall/CRC), 449–478.
Harding, D. J., Bufton, J. L., and Frawley, J. J. (1994). Satellite laser altimetry of terrestrial topography: vertical accuracy as a function of surface slope, roughness, and cloud cover. IEEE Trans. Geoscience Remote Sens. 32, 329–339. doi:10.1109/36.295048
Heritage, G. L., Milan, D. J., Large, A. R., and Fuller, I. C. (2009). Influence of survey strategy and interpolation model on dem quality. Geomorphology 112, 334–344. doi:10.1016/j.geomorph.2009.06.024
Höhle, J., and Höhle, M. (2009). Accuracy assessment of digital elevation models by means of robust statistical methods. ISPRS J. Photogrammetry Remote Sens. 64, 398–406. doi:10.1016/j.isprsjprs.2009.02.003
Holmes, K. W., Chadwick, O. A., and Kyriakidis, P. C. (2000). Error in a USGS 30-meter digital elevation model and its impact on terrain modeling. J. Hydrology 233, 154–173. doi:10.1016/S0022-1694(00)00229-8
Hristopulos, D. T. (2020). “Random fields for spatial data modeling: a primer for scientists and engineers,” in Advances in geographic information science (Dordrecht: Springer Netherlands). doi:10.1007/978-94-024-1918-4
Hubacek, M., Kovarik, V., and Kratochvil, V. (2016). “Analysis of influences of terrain relief roughness on DEM accuracy generated fom lida in the Czech republic territory,” in The international archives of the photogrammetry, remote sensing and spatial information Sciences, XLI-B4, 25–30. doi:10.5194/isprs-archives-XLI-B4-25-2016
Hubbard, A., Willis, I., Sharp, M., Mair, D., Nienow, P., Hubbard, B., et al. (2000). Glacier mass-balance determination by remote sensing and high-resolution modelling. J. Glaciol. 46, 491–498. doi:10.3189/172756500781833016
Hugonnet, R., Brun, F., Berthier, E., Dehecq, A., Mannerfelt, E. S., Eckert, N., et al. (2022). “Uncertainty analysis of digital elevation models by spatial inference from stable terrain,” in IEEE journal of selected topics in applied Earth observations and remote sensing, 1–17. doi:10.1109/JSTARS.2022.3188922
Hugonnet, R., McNabb, R., Berthier, E., Menounos, B., Nuth, C., Girod, L., et al. (2021). Accelerated global glacier mass loss in the early twenty-first century. Nature 592, 726–731. doi:10.1038/s41586-021-03436-z
Janowski, L., Tylmann, K., Trzcinska, K., Rudowski, S., and Tegowski, J. (2021). “Exploration of glacial landforms by object-based image analysis and spectral parameters of digital elevation model,” in IEEE transactions on geoscience and remote SensingSensing, 1–17. doi:10.1109/TGRS.2021.3091771
King, O., Bhattacharya, A., Bhambri, R., and Bolch, T. (2019). Glacial lakes exacerbate himalayan glacier mass loss. Sci. Rep. 9, 18145–18149. doi:10.1038/s41598-019-53733-x
King, O., Bhattacharya, A., and Bolch, T. (2021). The presence and influence of glacier surging around the Geladandong ice caps, North East Tibetan Plateau. Adv. Clim. Change Res. 12, 299–312. doi:10.1016/j.accre.2021.05.001
King, O., Bhattacharya, A., Ghuffar, S., Tait, A., Guilford, S., Elmore, A. C., et al. (2020). Six decades of glacier mass changes around Mt. Everest are revealed by historical and contemporary images. One Earth 3, 608–620. doi:10.1016/j.oneear.2020.10.019
Knuth, F., Shean, D., Bhushan, S., Schwat, E., Alexandrov, O., McNeil, C., et al. (2023). Historical structure from motion (hsfm): automated processing of historical aerial photographs for long-term topographic change analysis. Remote Sens. Environ. 285, 113379. doi:10.1016/j.rse.2022.113379
Krabill, W. e., Hanna, E., Huybrechts, P., Abdalati, W., Cappelen, J., Csatho, B., et al. (2004). Greenland ice sheet: increased coastal thinning. Geophys. Res. Lett. 31. doi:10.1029/2004gl021533
Kyriakidis, P. C., Shortridge, A. M., and Goodchild, M. F. (1999). Geostatistics for conflation and accuracy assessment of digital elevation models. Int. J. Geogr. Inf. Sci. 13, 677–707. doi:10.1080/136588199241067
Lehmann, E. L., and Casella, G. (2006). Theory of point estimation. Springer Science & Business Media.
Leinss, S., and Bernhard, P. (2021). TanDEM-X:Deriving InSAR height changes and velocity dynamics of great aletsch glacier. IEEE J. Sel. Top. Appl. Earth Observations Remote Sens. 14, 4798–4815. doi:10.1109/JSTARS.2021.3078084
Li, C., Jiang, L., Liu, L., and Wang, H. (2021a). Regional and altitude-dependent estimate of the SRTM C/X-Band radar penetration difference on High Mountain Asia glaciers. IEEE J. Sel. Top. Appl. Earth Observations Remote Sens. 14, 4244–4253. doi:10.1109/JSTARS.2021.3070362
Li, J., Li, Z.-W., Hu, J., Wu, L.-X., Li, X., Guo, L., et al. (2021b). Investigating the bias of TanDEM-X digital elevation models of glaciers on the Tibetan Plateau: impacting factors and potential effects on geodetic mass-balance measurements. J. Glaciol. 67, 1–14. doi:10.1017/jog.2021.15
Liang, Q., Wang, N., Yang, X., Chen, A., Hua, T., Li, Z., et al. (2022). The eastern limit of ‘Kunlun-Pamir-Karakoram Anomaly’ reflected by changes in glacier area and surface elevation. J. Glaciol. 1, 1167–1176. doi:10.1017/jog.2022.30
Lin, H., Li, G., Cuo, L., Hooper, A., and Ye, Q. (2017). A decreasing glacier mass balance gradient from the edge of the Upper Tarim Basin to the Karakoram during 2000–2014. Sci. Rep. 7, 6712. doi:10.1038/s41598-017-07133-8
Liu, C., Li, S., and Shi, Y. (1992). Glacial and lake fluctuations in the area of the west Kunlun mountains during the last 45 000 years. Ann. Glaciol. 16, 79–84. doi:10.3189/1992AoG16-1-79-84
Luo, J., Ke, C.-Q., and Seehaus, T. (2022). The west kunlun glacier anomaly and its response to climate forcing during 2002–2020. Remote Sens. 14, 3465. doi:10.3390/rs14143465
Maussion, F., Scherer, D., Mölg, T., Collier, E., Curio, J., and Finkelnburg, R. (2014). Precipitation seasonality and variability over the Tibetan plateau as resolved by the high Asia reanalysis. J. Clim. 27, 1910–1927. doi:10.1175/JCLI-D-13-00282.1
Mertes, J. R., Gulley, J. D., Benn, D. I., Thompson, S. S., and Nicholson, L. I. (2017). Using structure-from-motion to create glacier DEMs and orthoimagery from historical terrestrial and oblique aerial imagery. Earth Surf. Process. Landforms 42, 2350–2364. doi:10.1002/esp.4188
Milan, D. J., Heritage, G. L., Large, A. R. G., and Fuller, I. C. (2011). Filtering spatial error from DEMs: implications for morphological change estimation. Geomorphology 125, 160–171. doi:10.1016/j.geomorph.2010.09.012
Moholdt, G., and Kääb, A. (2012). A new DEM of the Austfonna ice cap by combining differential SAR interferometry with ICESat laser altimetry. Polar Res. 31, 18460. doi:10.3402/polar.v31i0.18460
Mölg, N., and Bolch, T. (2017). Structure-from-Motion using historical aerial images to analyse changes in Glacier Surface elevation. Remote Sens. 9, 1021. doi:10.3390/rs9101021
Muhammad, S., and Tian, L. (2020). Mass balance and a glacier surge of Guliya ice cap in the western Kunlun Shan between 2005 and 2015. Remote Sens. Environ. 244, 111832. doi:10.1016/j.rse.2020.111832
Mukherjee, S., Mukherjee, S., Garg, R. D., Bhardwaj, A., and Raju, P. L. N. (2013). Evaluation of topographic index in relation to terrain roughness and DEM grid spacing. J. Earth Syst. Sci. 122, 869–886. doi:10.1007/s12040-013-0292-0
Muskett, R. R., Lingle, C. S., Sauber, J. M., Post, A. S., Tangborn, W. V., Rabus, B. T., et al. (2009). Airborne and spaceborne DEM- and laser altimetry-derived surface elevation and volume changes of the Bering Glacier system, Alaska, USA, and Yukon, Canada, 1972–2006. J. Glaciol. 55, 316–326. doi:10.3189/002214309788608750
Neckel, N., Kropáček, J., Bolch, T., and Hochschild, V. (2014). Glacier mass changes on the Tibetan Plateau 2003–2009 derived from ICESat laser altimetry measurements. Environ. Res. Lett. 9, 014009. doi:10.1088/1748-9326/9/1/014009
Noh, M.-J., and Howat, I. M. (2015). Automated stereo-photogrammetric DEM generation at high latitudes: surface Extraction with TIN-based Search-space Minimization (SETSM) validation and demonstration over glaciated regions. GIScience Remote Sens. 52, 198–217. doi:10.1080/15481603.2015.1008621
Nuth, C., and Kääb, A. (2011). Co-registration and bias corrections of satellite elevation data sets for quantifying glacier thickness change. Cryosphere 5, 271–290. doi:10.5194/tc-5-271-2011
Oien, R. P., Rea, B. R., Spagnolo, M., Barr, I. D., and Bingham, R. G. (2022). Testing the area–altitude balance ratio (aabr) and accumulation–area ratio (aar) methods of calculating glacier equilibrium-line altitudes. J. Glaciol. 68, 357–368. doi:10.1017/jog.2021.100
Oksanen, J., and Sarjakoski, T. (2005). Error propagation of DEM-based surface derivatives. Comput. Geosciences 31, 1015–1027. doi:10.1016/j.cageo.2005.02.014
Papasodoro, C., Berthier, E., Royer, A., Zdanowicz, C., and Langlois, A. (2015). Area, elevation and mass changes of the two southernmost ice caps of the Canadian Arctic Archipelago between 1952 and 2014. Cryosphere 9, 1535–1550. doi:10.5194/tc-9-1535-2015
Paul, F., Bolch, T., Briggs, K., Kääb, A., McMillan, M., McNabb, R., et al. (2017). Error sources and guidelines for quality assessment of glacier area, elevation change, and velocity products derived from satellite data in the Glaciers_cci project. Remote Sens. Environ. 203, 256–275. doi:10.1016/j.rse.2017.08.038
Pieczonka, T., and Bolch, T. (2015). Region-wide glacier mass budgets and area changes for the Central Tien Shan between ∼1975 and 1999 using Hexagon KH-9 imagery. Glob. Planet. Change 128, 1–13. doi:10.1016/j.gloplacha.2014.11.014
Podgórski, J., Kinnard, C., Petlicki, M., and Urrutia, R. (2019). Performance assessment of TanDEM-X DEM for mountain glacier elevation change detection. Remote Sens. 11, 187. doi:10.3390/rs11020187
Rasmussen, C. E., and Williams, C. K. (2005). “Model selection and adaptation of hyperparameters,” in Gaussian processes for machine learning (MIT Press), 105–128.
Raup, B. H., Andreassen, L. M., Bolch, T., and Bevan, S. (2015). Remote sensing of glaciers. Remote Sens. Cryosphere, 123–156. doi:10.1002/9781118368909.ch7
RGI Consortium (2017). Randolph glacier inventory–a dataset of global glacier outlines: version 6.0. Colorado, USA: Global Land Ice Measurements from Space. Tech. Rep.
Rolstad, C., Haug, T., and Denby, B. (2009). Spatially integrated geodetic glacier mass balance and its uncertainty based on geostatistical analysis: application to the western Svartisen ice cap, Norway. J. Glaciol. 55, 666–680. doi:10.3189/002214309789470950
Rott, H., Scheiblauer, S., Wuite, J., Krieger, L., Floricioiu, D., Rizzoli, P., et al. (2021). Penetration of interferometric radar signals in antarctic snow. Cryosphere 15, 4399–4419. doi:10.5194/tc-15-4399-2021
Shangguan, D. H., Bolch, T., Ding, Y. J., Kröhnert, M., Pieczonka, T., Wetzel, H. U., et al. (2015). Mass changes of southern and northern inylchek glacier, central tian Shan, Kyrgyzstan, during ∼1975 and 2007 derived from remote sensing data. Cryosphere 9, 703–717. doi:10.5194/tc-9-703-2015
Shean, D. E., Bhushan, S., Montesano, P., Rounce, D. R., Arendt, A., and Osmanoglu, B. (2020). A systematic, regional assessment of High Mountain Asia glacier mass balance. Front. Earth Sci. 7. doi:10.3389/feart.2019.00363
Shean, D. E., Joughin, I. R., Dutrieux, P., Smith, B. E., and Berthier, E. (2019). Ice shelf basal melt rates from a high-resolution digital elevation model (DEM) record for Pine Island Glacier, Antarctica. Cryosphere 13, 2633–2656. doi:10.5194/tc-13-2633-2019
Shugar, D. H., Rabus, B. T., and Clague, J. J. (2010). Elevation changes (1949–1995) of black rapids glacier, Alaska, derived from a multi-baseline insar dem and historical maps. J. Glaciol. 56, 625–634. doi:10.3189/002214310793146278
Simonsen, S. B., Barletta, V. R., Colgan, W. T., and Sørensen, L. S. (2021). Greenland ice sheet mass balance (1992–2020) from calibrated radar altimetry. Geophys. Res. Lett. 48, e2020GL091216. doi:10.1029/2020GL091216
Smith, B. E., Medley, B., Fettweis, X., Sutterley, T., Alexander, P., Porter, D., et al. (2023). Evaluating Greenland surface-mass-balance and firn-densification data using icesat-2 altimetry. Cryosphere 17, 789–808. doi:10.5194/tc-17-789-2023
Steiner, J. F., Kraaijenbrink, P. D. A., Jiduc, S. G., and Immerzeel, W. W. (2018). Brief communication: the Khurdopin glacier surge revisited – extreme flow velocities and formation of a dammed lake in 2017. Cryosphere 12, 95–101. doi:10.5194/tc-12-95-2018
Thompson, L. G., Yao, T., Davis, M. E., Mosley-Thompson, E., Wu, G., Porter, S. E., et al. (2018). Ice core records of climate variability on the third pole with emphasis on the guliya ice cap, western kunlun mountains. Quat. Sci. Rev. 188, 1–14. doi:10.1016/j.quascirev.2018.03.003
Toutin, T. (2008). ASTER DEMs for geomatic and geoscientific applications: a review. Int. J. Remote Sens. 29, 1855–1875. doi:10.1080/01431160701408477
Truffer, M., Kääb, A., Harrison, W. D., Osipova, G. B., Nosenko, G. A., Espizua, L., et al. (2021). “Chapter 13 - glacier surges,” in Snow and ice-related hazards, risks, and disasters. Editors W. Haeberli, and C. Whiteman Second Edition (Elsevier), 417–466. doi:10.1016/B978-0-12-817129-5.00003-2
Vaze, J., Teng, J., and Spencer, G. (2010). Impact of DEM accuracy and resolution on topographic indices. Environ. Model. Softw. 25, 1086–1098. doi:10.1016/j.envsoft.2010.03.014
Vijay, S., and Braun, M. (2018). Early 21st century spatially detailed elevation changes of Jammu and Kashmir glaciers (Karakoram–Himalaya). Glob. Planet. Change 165, 137–146. doi:10.1016/j.gloplacha.2018.03.014
Vincent, C., Wagnon, P., Shea, J. M., Immerzeel, W. W., Kraaijenbrink, P., Shrestha, D., et al. (2016). Reduced melt on debris-covered glaciers: investigations from changri nup glacier, Nepal. Cryosphere 10, 1845–1858. doi:10.5194/tc-10-1845-2016
Wang, D., and Kääb, A. (2015). Modeling Glacier elevation change from DEM time series. Remote Sens. 7, 10117–10142. doi:10.3390/rs70810117
Wang, Q., Yi, S., and Sun, W. (2021). Continuous estimates of glacier mass balance in High Mountain Asia based on ICESat-1,2 and GRACE/GRACE follow-on data. Geophys. Res. Lett. 48, e2020GL090954. doi:10.1029/2020GL090954
Wang, Y., Hou, S., Huai, B., An, W., Pang, H., and Liu, Y. (2018). Glacier anomaly over the western kunlun mountains, northwestern Tibetan plateau, since the 1970s. J. Glaciol. 64, 624–636. doi:10.1017/jog.2018.53
Werder, M. A., Huss, M., Paul, F., Dehecq, A., and Farinotti, D. (2020). A Bayesian ice thickness estimation model for large-scale applications. J. Glaciol. 66, 137–152. doi:10.1017/jog.2019.93
Wheaton, J. M., Brasington, J., Darby, S. E., and Sear, D. A. (2010). Accounting for uncertainty in dems from repeat topographic surveys: improved sediment budgets. Earth Surf. Process. landforms J. Br. Geomorphol. Res. Group 35, 136–156. doi:10.1002/esp.1886
Whitehead, K., Moorman, B. J., and Hugenholtz, C. H. (2013). Brief Communication: low-cost, on-demand aerial photogrammetry for glaciological measurement. Cryosphere 7, 1879–1884. doi:10.5194/tc-7-1879-2013
Wise, S. (2011). Cross-validation as a means of investigating DEM interpolation error. Comput. Geosciences 37, 978–991. doi:10.1016/j.cageo.2010.12.002
Zammit-Mangion, A., Rougier, J., Schön, N., Lindgren, F., and Bamber, J. (2015). Multivariate spatio-temporal modelling for assessing Antarctica’s present-day contribution to sea-level rise. Environmetrics 26, 159–177. doi:10.1002/env.2323
Zhang, B., and Cressie, N. (2020). Bayesian inference of spatio-temporal changes of arctic sea ice. Bayesian Anal. 15, 605–631. doi:10.1214/20-BA1209
Keywords: glacier surface elevation change, bayesian methods, glacier surges, uncertainty estimation, probabilistic framework
Citation: Guillet G and Bolch T (2023) Bayesian estimation of glacier surface elevation changes from DEMs. Front. Earth Sci. 11:1076732. doi: 10.3389/feart.2023.1076732
Received: 21 October 2022; Accepted: 02 November 2023;
Published: 05 December 2023.
Edited by:
Alun Hubbard, University of Oulu, FinlandReviewed by:
Massimo Menenti, Delft University of Technology, NetherlandsRamanathan Alagappan, Jawaharlal Nehru University, India
Copyright © 2023 Guillet and Bolch. This is an open-access article distributed under the terms of the Creative Commons Attribution License (CC BY). The use, distribution or reproduction in other forums is permitted, provided the original author(s) and the copyright owner(s) are credited and that the original publication in this journal is cited, in accordance with accepted academic practice. No use, distribution or reproduction is permitted which does not comply with these terms.
*Correspondence: Gregoire Guillet, gregguillet@gmail.com