Redox controls on H and N speciation and intermolecular isotopic fractionations in aqueous fluids at high pressure and high temperature: Insights from in-situ experiments
 Celia Dalou1*
  Charles Le Losq
 Evelyn Füri
- 1Université de Lorraine, CNRS, CRPG, Nancy, France
- 2Université Paris Cité, Institut de Physique Du Globe de Paris, CNRS, Paris, France
- 3Université de Lorraine, CNRS, GeoRessources, Nancy, France
Aqueous magmatic fluids are essential to the transport of hydrogen (H), carbon (C), and nitrogen (N) from the mantle to the surface, during which changes in pressure, temperature, and redox conditions affect the chemical speciation and intermolecular isotopic fractionations of H, C, and N. Here, we performed a series of hydrothermal diamond-anvil cell experiments to evaluate the role of pressure, temperature, and redox conditions on the speciation and intermolecular fractionations of H and N during the decompression and cooling of aqueous fluids from 780 MPa to 800°C to 150 MPa and 200°C. We used Raman spectroscopy to investigate the distribution and exchange reactions of H and N isotopologues between water, methane, ammonia, and di-nitrogen molecules under changing physicochemical conditions. Our experiments show that upon decompression, a C- and N-bearing fluid will preferentially degas D-rich methane and 15N-rich N2, depleting the residual aqueous fluid in those isotopes. If this fluid precipitates N-rich (i.e., NH4+-bearing) minerals, the observed N isotopic fractionation is opposite to that during N2 degassing, enriching the aqueous fluid in 15N. Because these fractionations result from changes in H, C, and N speciation in the aqueous fluid, their magnitudes depend on redox conditions as well as pressure and temperature. Our new in-situ experimental results are consistent with the large H and N isotopic fractionations observed between water, methane, and ammonia species in aqueous fluids at high pressures and temperatures, although the magnitude of the fractionations in our experiments cannot be quantified. Nonetheless, our results suggest that statistical thermodynamic models likely underestimate isotopic fractionation effects for isotopic molecules under these conditions, and should account for solubility and isotopic effects of the solvent associated with the solvation of water, methane, and ammonia isotopologues in aqueous fluids.This work has significant implications for interpreting isotopic measurements of natural samples from hydrothermal systems because it offers insights into isotopic fractionations in multicomponent and multiphase systems under hydrothermal temperatures and pressures.
1 Introduction
The geochemical cycling of hydrogen (H), carbon (C), and nitrogen (N) are central to the geological processes leading to Earth’s habitability. The speciation and valences of these elements in different phases determine whether they behave as siderophile, lithophile, or atmophile elements (e.g., Gaillard et al., 2021), thus controlling their partitioning between Earth’s main reservoirs (core, mantle, atmosphere). Magmatic fluids and melts are central to the transport of these elements among the different reservoirs. Knowledge of the speciation and solubility of H and N in magmatic fluids and melts is thus critical to understanding, tracing, and predicting the geochemical cycling of H and N.
The speciation of H and N in magmatic fluids and melts depends on temperature, pressure, oxygen fugacity, pH, and the individual concentration of the species involved (Hirschmann et al., 2012; Mikhail and Sverjensky, 2014; Dalou et al., 2019). In aqueous fluids, the speciation of H and N significantly affects their partitioning behavior between the fluid and coexisting silicate minerals or melts (Li and Keppler, 2014; Li et al., 2015), and thus their recycling between Earth’s interior and surface. It is commonly accepted that N mostly dissolves in aqueous fluids as N2 and NH3, whereas H can dissolve as H2O, H2, NH3, and CH4 (e.g., Li and Keppler, 2014; Mikhail and Sverjensky, 2014; Mikhail et al., 2017; Sokol et al., 2017). This knowledge is based mostly on estimations of relative species abundances in quenched samples after equilibration at high-pressure and high-temperature (HP-HT) conditions. However, although the quenching process certainly causes structural changes in the fluids, and thus likely affects the solubility and speciation of H and N (e.g., Foustoukos and Mysen, 2013), only a few studies have examined in-situ H and N speciation in aqueous fluids at HP-HT during hydrothermal diamond-anvil cell (HDAC) experiments (McCubbin et al., 2014; Chen et al., 2019). These studies confirmed the effects of P-T and fO2 conditions on the relative proportions of N2, NH3, H2, and CH4 in aqueous fluids.
In addition to controlling their exchanges between aqueous fluids and other phases (melts, minerals, gases) during H and N recycling or degassing, the speciation of H and N in fluids exerts an important control on their isotopic fractionations (Busigny and Bebout, 2013; Foustoukos and Mysen, 2013; Dalou et al., 2015). However, most H and especially N isotopic fractionation factors have been derived from theoretical calculations (Busigny and Bebout, 2013) but are not relevant to mineral-fluid-gas (i.e., hydrothermal) systems. Indeed, these studies are based on statistical mechanics models calculated for the ideal behavior of gases between species with zero intermolecular forces, and therefore fail to account for solubility, molar volume, and vapor pressure induced fractionations produced by intermolecular interactions with functional groups within the condensed phases (e.g., Richet et al., 1977; Chialvo and Horita, 2003; Van Hook, 2006). Because H and N isotopic fractionations are key tools for tracing gas or fluid exchanges via fluxing or degassing in a magmatic system, as well as the transport of other materials through the mantle or crust (e.g., melt-versus fluid-induced metasomatism via percolation or infiltration, serpentinizatio; e.g., Pineau et al., 1998; Hauri, 2002; Manning, 2004; Dalou et al., 2022), it is important to better constrain the effects of P-T, fO2, and fluid composition on H and N isotopic fractionations in aqueous fluids, and therefore their speciation in fluids.
To address this problem and avoid quench-related issues, we here examined the speciation of H, D, 14N, and 15N in aqueous fluids at HP-HT via in-situ Raman spectroscopy observations of fluids equilibrated in a HDAC at pressures up to 780 MPa and temperatures up to 800°C. Our new data allow us to better constrain the effects of P-T and fO2 conditions during the ascent of aqueous fluids, and of the formation of bubbles on H and N isotopologues’ speciation.
2 Methods
2.1 Hydrothermal diamond-anvil cell experiments
Experiments were performed using a HDAC (Bassett et al., 1994, 1996) model V installed at the CRPG’s Experimental Cosmochemistry and Magmatology facility (Nancy, France). The HDAC is equipped with low-fluorescence 1 mm culet diamonds. Samples were placed into 125 µm thick iridium gaskets with a central hole 500 μm in diameter. The HDAC was externally heated by Mo wire heaters placed around the tungsten carbide seats, distributing the heat homogeneously throughout the sample chamber (±1°C accuracy). The temperature in the HDAC was monitored to within 1°C with chromel–alumel thermocouples in contact with the upper and lower diamond anvils. At the imposed temperature, the pressure inside the cell is governed by the PVT relationship of the aqueous fluid (Mysen, 2010). We performed three experiments in which we first heated the chamber to 800°C and then cooled it to 200°C (i.e., the lowest temperature at which we performed Raman spectroscopy measurements) in 100°C decrements. The volume of the sample chamber being fixed, increasing temperature results in increasing pressure. In the first experiment (experiment A), it was possible to derive the pressure in the chamber from the pressure/temperature-dependent one-phonon Raman shift of a synthetic 13C diamond placed within the gasket (Schiferl et al., 1997). This method was calibrated over the ranges 0.1–1,500 MPa and 25–800°C with an uncertainty of about ±40 MPa (Eq. 1 in Mysen and Yamashita, 2010), considering the ±1°C error on temperature. We determined that the pressure decreased from 776 to 154 (±37) MPa as temperature decreased from 800 to 200°C (Figure 1), with a rate of 40°C/min for all three experiments. In the two other experiments, the 13C diamonds were either too small or covered by another phase (probably NiO) and could not be observed. Therefore, the pressure was not determined for experiment B and C.
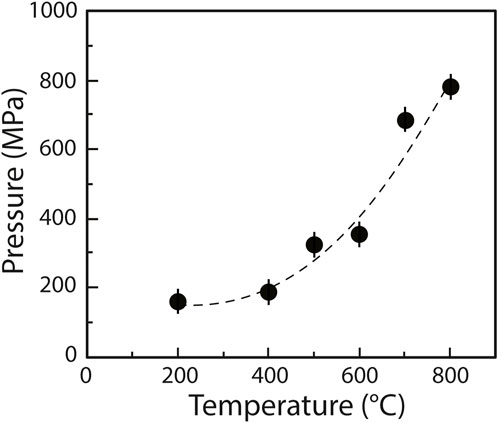
FIGURE 1. Pressure/temperature trajectory (starting at HP-HT) of experiment A, fitted using a second order polynomial. The experiment was quenched at 200°C; no 13C analysis was performed at lower temperatures.
All three experiments started with a different fluid composition (see Section 2.2) and a gas bubble. To achieve similar fluid densities in each experiment, which would guarantee similar P-T trajectories, the fluid density was controlled by bleeding air into the sample chamber and checking when the gas bubble disappeared during heating. In experiments A, B, and C, the gas bubbles disappeared at 300, 280, and 365°C, respectively, during heating, and they reappeared between 300 and 270°C during cooling in all experiments. This suggests that all three experiments experienced comparable, though not identical, P-T trajectories. If an iridium gasket is not perfectly centered between the two HDAC diamonds, the center of a gasket can deform and/or shrink upon heating, changing the overall volume of a sample, and by extension its P-T trajectory. This may explain the difference observed between bubbles disappearance and reappearance for experiment C.
2.2 Experimental procedure
The experiments were designed to yield deuteroammonia and deuteromethane species via the decomposition of urea (CH4N2O; Sigma Aldrich, 98%) into a H2O:D2O (2:1 to 3:1 by volume) aqueous solution at HP-HT. Experiment A contained solely 14N:15N urea (about 1:1 by volume), the H2O:D2O fluid, and a synthetic 13C diamond. To isolate the measured Raman peaks related to N species in experiment A, experiment B contained solely the H2O:D2O fluid and Si5C12H36 (tetrakis (trimethylsilyl) silane; Alfa Aesar, 98%; natural D/H abundance). Experiment C contained a mixture of the same 14N:15N urea, H2O:D2O fluid, and Si5C12H36, but also NiO powder (a few µg). The addition of NiO powder in experiment C ensured more oxidized conditions than in experiments A and B, via the reaction NiO ⇔ Ni + 1/2O2. The compositions of the experiments are summarized in Table 1. Contrary to Foustoukos and Mysen (2013), the complete decomposition of Si5C12H36 did not result in the precipitation of SiO2 crystals around 600°C during cooling; instead, around 530°C during cooling, an unidentified NH4+–bearing crystal precipitated.
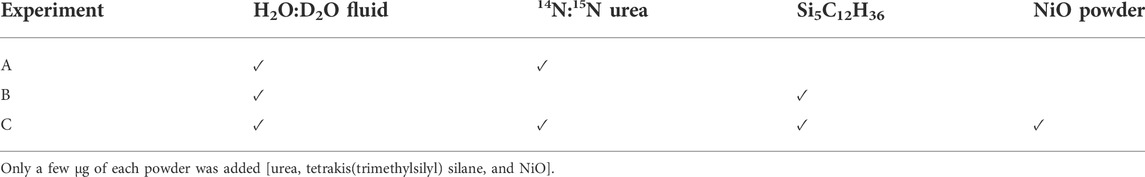
TABLE 1. Summary of starting compositions used in the three HDAC experiments.
2.3 Raman spectroscopy
We used a Raman LabRAM HR microspectrometer (Horiba Jobin Yvon) at GeoRessources (Nancy, France) equipped with an Ar+ laser (Stabilite 2017; Spectra-Physics) with about 200 mW of output and an excitation line at 514.53 nm. A ×50 objective lens (Plan Apo SL, Mitutoyo) was employed for both visual microscopic examination and spectroscopic analysis. Measurements were performed with grating settings of 600 grooves/mm centered at 1,400 cm−1 for 13C diamond analysis and to cover the 500–1,500 cm−1 and 1,450–4,200 cm−1 ranges for the fluid (and gasket) analyses. The wavenumber resolution was ±3 cm−1. For the 13C diamond analysis, twenty 5-s acquisitions were collected, whereas thirty 4-s acquisitions were collected for the fluid (and gasket) analyses.
Because the 2000–4,000 cm−1 portion of sample Raman spectra is dominated by the second-order diamond signal from the diamond cell (Figure 2A), we recorded two spectra at each P-T condition: one from the fluid (Figure 2A, red) and one from the upper diamond by analyzing the Ir gasket (Figure 2A, black). To subtract the diamond spectrum from that of the fluid, we followed a procedure similar to that in Dalou et al. (2015): we fit the diamond spectrum to that of the fluid in portions devoid of sample signals (blue in Figure 2B) using a model that combines a seventh-order polynomial background, a linear adjustment of the diamond-sample intensities, and a linear Raman shift correction (Figure 2B). The diamond signals were then subtracted from the fluid signals (Figure 2C). Corrected fluid spectra are presented in Figure 3.
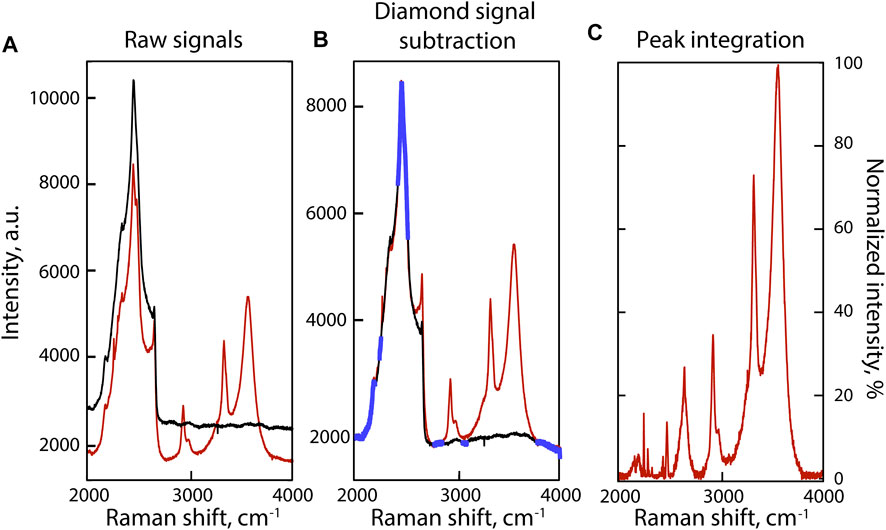
FIGURE 2. Example of signal processing of the 2000–4,000 cm−1 portion of the Raman spectrum of the fluid phase at 800°C in experiment C. (A) Baseline correction of the Raman spectra of the fluid, i.e., the combined signal of the fluid and the HDAC diamond (red spectrum), and the HDAC diamond (black spectrum) at HP-HT. (B) Raman spectra of the fluid (red) and HDAC diamond (black) after baseline correction. Portions of the spectra highlighted in blue are devoid of sample signal and were used to fit the diamond spectrum to that of the fluid. (C) Raman spectrum of the fluid after subtraction of the HDAC diamond signal.
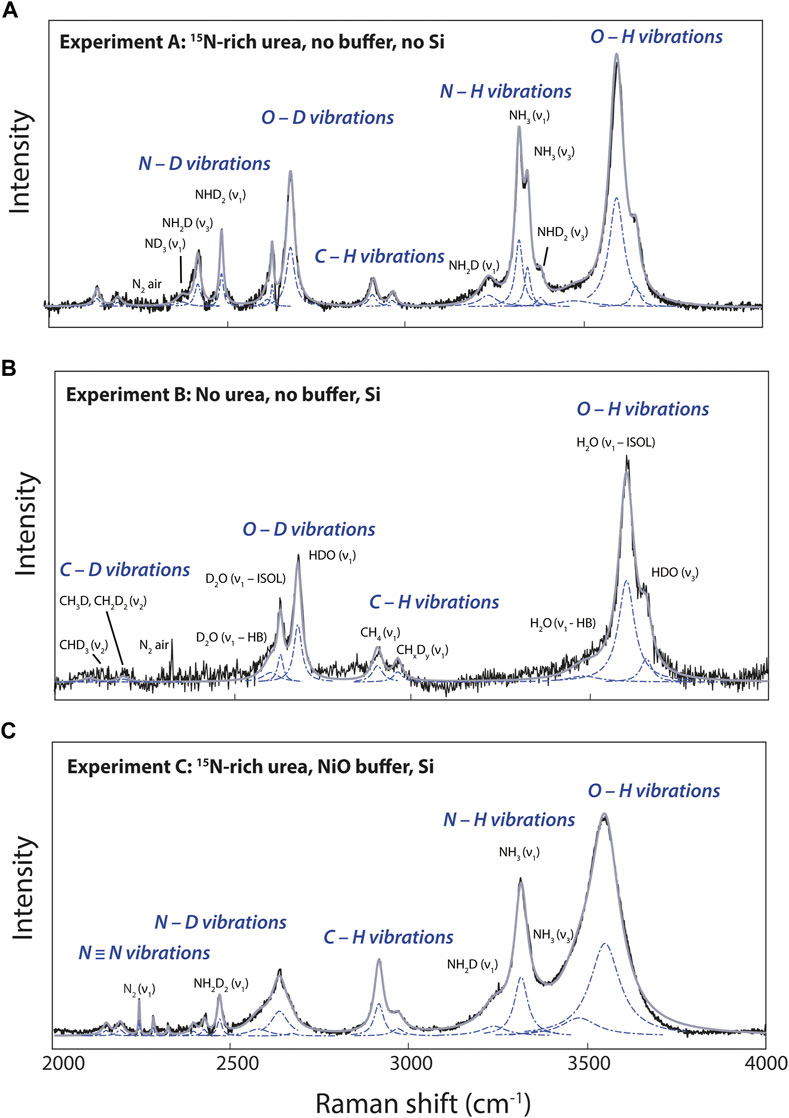
FIGURE 3. Examples of curve-fitted Raman spectra in the 2000–4,000 cm−1 portion of Raman spectra of fluids at 800°C in experiments (A), (B) and (C). Black curves are the raw spectra, blue dashed curves the fitted Lorentzian, and gray curves the results of curve fitting. Peak assignments are discussed in the Section 3.1.
Curve-fitting of the Raman spectra was performed using the IGOR software package from Wavemetrics. In this procedure, the location (Raman shift), bandwidth, and band intensity were treated as independent variables, and χ2 minimization of was used as the convergence criterion. Fits were judged to be satisfactory when the intensity difference between the spectra and the fits decreased to below 5%. However, in the 2000–2,300 cm−1 range of the spectra, the signal-to-noise ratio was lower than 1:2, and we often had difficulty bringing the difference between the fit and the spectra to below 20%. Spectra acquired from 400 to 200°C during cooling of experiments A and C, and from 500 to 200°C during cooling of experiment B, could not be fitted with such accuracy as they present low signal-to-noise ratios (Figure 4A); therefore, we neither present nor discuss the results of those attempted fits. Only the fits performed between 800 and 500°C are presented for the three experiments.
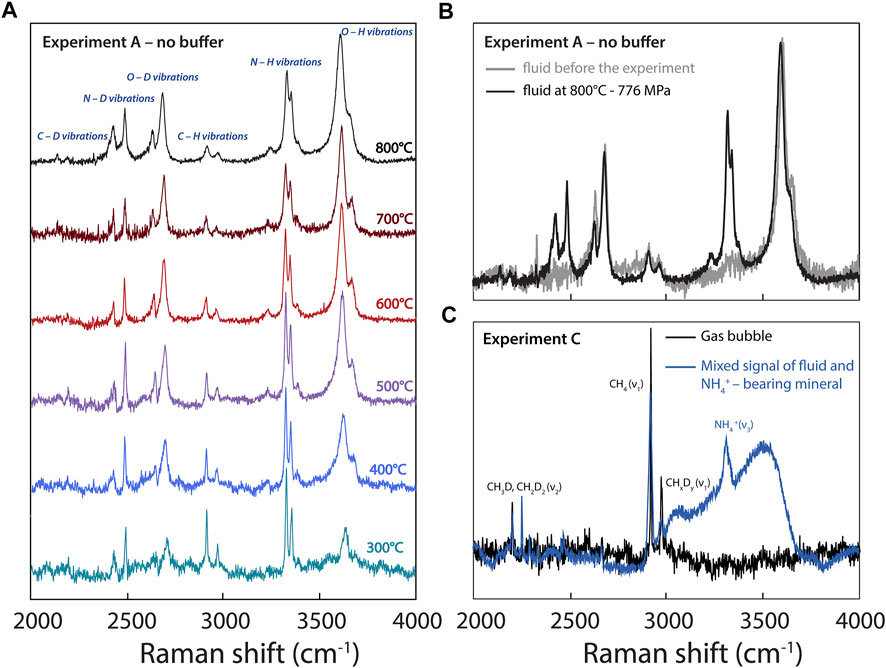
FIGURE 4. (A) Raman spectra acquired during experiment A at different temperatures (decreasing from 800 to 300°C). (B) Comparison of spectra acquired in the fluid of experiment A prior to the experiment at room temperature, showing the absence of N-related vibrations, and at 800°C. (C) Spectra acquired in experiment C at 300°C, showing CHxDy-related vibrations in a gas bubble and a signal obtained in a NH4+-bearing crystalline phase apparently contaminated by the fluid signal.
3 Results and discussion
We collected Raman spectra of the 500–1,500 cm−1 and 1,450–4,200 cm−1 wavenumber ranges, but only the latter included Raman bands that changed in the presence of N (Figure 3) and with changing redox and P-T conditions in the fluid (Figure 4). Therefore, the 1,450–4,200 cm−1 wavenumber range appears to be the most relevant for assessing the effects of physicochemical conditions on the speciation of H and N in fluids.
3.1 Peak assignments
The 1,450–4,200 cm−1 wavenumber range, and more precisely the 2000–4,000 cm−1 wavenumber range, presents vibration modes of D-bearing CH4, NH3, and H2O molecules, and of 15N-bearing N2 in fluids depending of various experimental conditions (Figure 3). According to Foustoukos and Mysen (2013), the 2000–2,400 cm−1 wavenumber range accommodates the bands of the asymmetric stretching and bending vibrations of CHD3 (2,129 cm−1) and CH3D–CH2D2 (∼2,175 cm−1), whereas at higher wavenumbers, we observed the vibrations of CH4 (2,901 cm−1) and CHxDy (2,950 cm−1). Following Foustoukos and Mysen (2012), we identified the vibration modes of H2O, D2O, HDO assigned to OH and OD stretching (Figure 3). The asymmetric band near 3,600 cm−1 is assigned to O–H stretching vibrations from H2O molecules (noted ν1—HB), from broken hydrogen bonds in OH− groups (noted ν1—ISOL), and HDO molecules around 3,580, 3,615, and 3,650 cm−1, respectively. The OD stretching vibration modes in D2O molecules (noted ν1—HB), OD− groups (noted ν1—ISOL), and HDO molecules are located around 2,610, 2,640, and 2,690 cm−1, respectively (Figure 3).
Comparing N-bearing experiment A to N-free experiment B (Figures 3A,B), we identified and assigned the different H–D isotopologues of NH3 according to Ceccaldi and Leicknam (1968): ND3 (∼2,350 cm−1), NH2D (2,420 and 3,230 cm−1), NH3 (3,320 and 3,345 cm−1), and ND2H (2,480 and 3,365 cm−1). Under more oxidizing conditions, experiment C shows N2 vibrations associated with 15N≡15N at 2,246 cm−1, 15N≡14N at 2,285 cm−1, and 14N≡14N at 2,327 cm−1 (Figure 3C). No other peaks related to other possible forms of oxidized N, whether in the form of nitrosyl groups or nitrate, were observed near 2,100 and 1,050 cm−1 (Kloprogge et al., 2002; Roskosz et al., 2006).
3.2 Effects of temperature, composition, and redox conditions
Figure 4 highlights changes in the Raman peaks in experiment A with decreasing T and P conditions from 800 to 300°C and from 776 to 154 ± 40 MPa, respectively. Overall, the H2O and D2O peaks broaden due to an increase in intermolecular hydrogen bonding (Foustoukos and Mysen, 2013), whereas the peaks assigned to CHxDy (deuteromethane) and NHxDy (deuteroammonia) species become narrower with decreasing temperature (Figure 4A). This is probably due to a simple thermal narrowing effect (i.e., the disappearance of “hot bands” with decreasing temperature; e.g., Butterworth et al., 2019) diminishing the overlap between isotopologues (Foustoukos and Mysen, 2013). In addition, with decreasing temperature, we observe an overall increase in the intensities and areas of the peaks assigned to CHxDy and NHxDy vibrations relative to those of peaks assigned to H2O and D2O vibrations (Figure 4A).
3.2.1 Hydrogen and deuterium bonding in fluids
To monitor the effect of temperature (and pressure) on the progress of reactions in the H2O-D2O-CH4-NH3 system, we fit the identified peaks using Lorentzian bands in all spectra with a signal-to-noise ratio better than 1:2 (Figure 3). We fit four bands to the peaks assigned to isolated and hydrogen-bonded O-H stretching signals in (H,D)2O (Figure 3B). Hydrogen in (H,D)2O molecules forms hydrogen bonds with surrounding anions such as O, C, and N, affecting the wavenumber of the O-H stretching signal (e.g., see Novak, 1974). In fluids containing O, C, and N, we thus expect the formation of (C,N,O)···(H,D)O (··· representing a hydrogen bond) due to hydrogen bonding in the (H,D)2O component of the fluid phase (Walrafen, 1968; Walrafen et al., 1996).
Based on the relative distribution of the integrated intensities of the bands assigned to the different isotopic moieties, we can constrain the stability of the different types of hydrogen bonds. Assuming that the relative normalized differential Raman scattering cross sections (σj) of the O-H and O···H-O ν1 vibrations are equivalent, as well as those of the O-D and O···D-O ν1 vibrations, the mole fraction ratio of isolated and hydrogen-bonded groups, XHYDR/XISOL, should be equal to the integrated intensity ratio: i.e., XHYDR/XISOL = AHYDR/AISOL. However, the σj of the H2O and D2O ν1 vibrations are not equivalent (Zarei et al., 2018). Therefore, we analyzed pure H2O, pure D2O, and a 1:1 mixture of H2O and D2O by Raman spectroscopy with the same settings used for the HDAC experiments. This allowed us to determine σj for H2O, D2O, and HDO at 25°C (Table 2), following Xj = Aj/σj to compare to the H2O and D2O groups (Figure 5). Although the σj values increase with increasing temperature, the increase is weak for wavenumbers higher than the N2 vibration band (Garcia-Baonza et al., 2012), and we therefore ignore this effect in the following discussion. From the correlation of ln (AISOL/AHB) with 103/T, we estimated the enthalpies of rupture of the intermolecular hydrogen bonds (ΔH) in aqueous fluids (Figure 5; Foustoukos and Mysen, 2012). Overall, (N,C,O)···HO hydrogen bonds are stronger than (N,C,O)···DO hydrogen bonds (2.4–3.9 kJ mol−1 versus 0.8–1.3 kJ mol−1). As temperature increases, the (N,C,O)···HO hydrogen bonds become even stronger, suggesting the formation of H-bonded clusters that are more polar, larger, and denser (Foustoukos and Mysen, 2012). Although we cannot decipher the effect of pressure from our results, Foustoukos and Mysen (2012) reported that its effect on the enthalpy of (N,C,O)···HO and (N,C,O)···DO bond breakage was negligible compared to that of temperature.
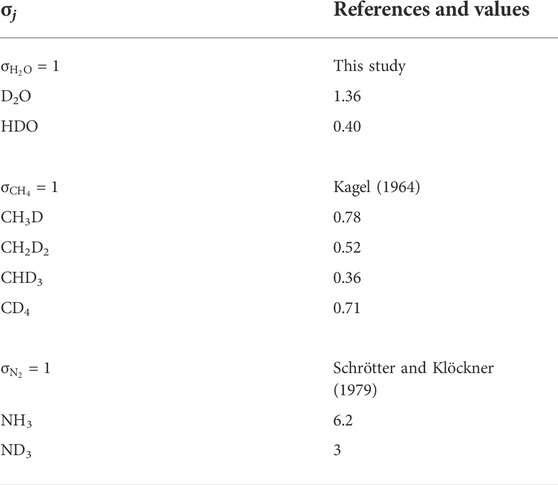
TABLE 2. Relative normalized differential Raman scattering cross sections σj of fundamental stretching vibration modes at 25°C.
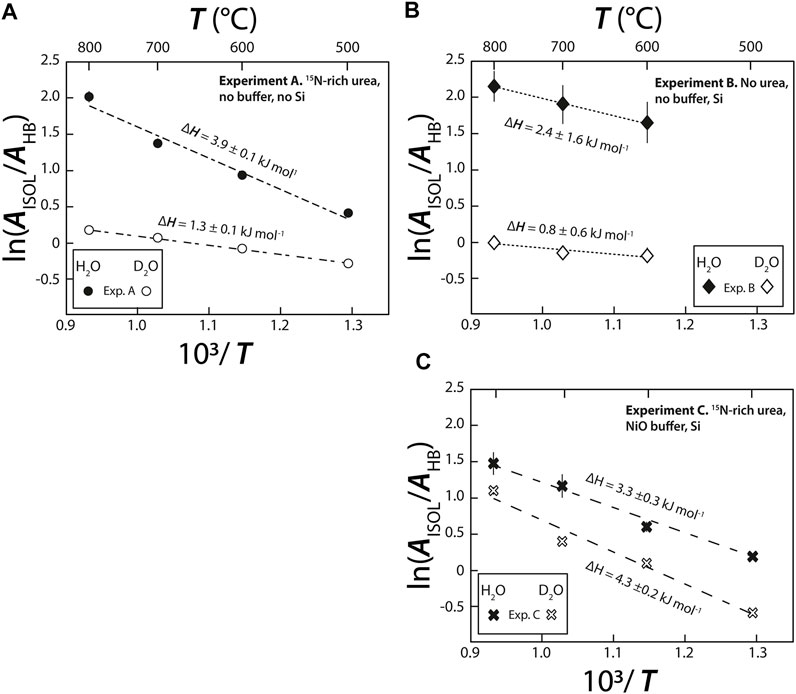
FIGURE 5. Van’t Hoff plot of integrated peak areas of bands assigned to broken isolated H bonds (AISOL) and intact (AHB) hydrogen bonds in both D2O and H2O molecules vs. 103/T, in (A–C) experiments (A), (B) and (C), respectively. The enthalpy required to rupture hydrogen bonds (ΔHHB) was calculated from the slope of the linear regressions using Isoplot. The uncertainties on ΔHHB of experiment B are related to the fact that i the signal for this experiment is noisier than for the experiment (A) and (C); producing large uncertainties on the maximal intensities of H2O (ν1–HB) and H2O (ν1–ISOL) bands (Figure 3) and, ii. the isoplot linear regressions were performed with only three data points with large uncertainties.
In all three experiments, ΔH (Figure 5) values were on the same order of magnitude as those previously obtained for D/H fractionations in the H2-H2O system between 400 and 700°C (5.2 ± 0.1 kJ mol−1 for H2O and 1.7 ±0.1 kJ mol−1 for D2O; Foustoukos and Mysen, 2012). Notably, ΔH values for the N-free C-bearing fluid (2.4 ±1.6 kJ mol−1 for H2O and 0.8 ±0.6 kJ mol−1 for D2O) are lower than those in N-bearing fluids (3.3–3.9 ±0.3 kJ mol−1 for H2O and 1.3 to 4.3 ±0.2 kJ mol−1 for D2O, this study) or in the H2-H2O system (Foustoukos and Mysen, 2012). In short, we found that ΔHO···HO > ΔHN···HO > ΔHC···HO, indicating the relative stability of intermolecular hydrogen bonding. Although, hydrogen bonding typically occurs when positively charged hydrogen atoms are located between partially negatively charged oxygen atoms, in HT fluids, they can also form C···HO and N···HO bonds. It is also very likely that C···HN and N···HN bonds form, although given the abundance of H2O, these bonds should be negligible. Consistent with observations of F···HO and Cl···HO bonds in HT fluids (Bondarenko et al., 2006; Dalou et al., 2015; Foustoukos, 2016), the stabilities of O···HO, N···HO, and C···HO hydrogen bonds are governed by the decreasing difference in electronegativity between O (3.44), N (3.04), and C (2.5) relative to H (2.1). This trend is also observed for (N,C,O)···DO bonding between our experiments A and B and that of Foustoukos and Mysen (2012). However, the ΔH value of (N,C,O)···DO bonding in experiment C was higher (4.3 ±0.2 kJ mol−1) than that of (N,C,O)···HO bonding in the same experiment (3.3 ±0.3 kJ mol−1), those of both (N,C,O)···DO and (N,C,O)···HO bonding in experiments A and B, and those obtained by Foustoukos and Mysen (2012). In addition, in our N-bearing experiments, the difference between ln (AISOL/AHYDR) for O···HO and O···DO increased with increasing T in experiment A but decreased in experiment C (Figure 5). Although the reasons for these difference remain unclear, we assume that Si(OH)4 and Si(OD)4 complexes formed in experiment C, which would stabilize OD bonds compared to OH bonds as T increases. Hence, the temperature and composition (C, N, and Si content) of fluids have variable effects on the strength and polarity of O···HO and O···DO intermolecular bonds. Indirectly, this implies that they have a significant influence on intermolecular D/H isotopic fractionations.
3.2.2 Carbon and nitrogen bonding in fluids
The abundances of H/D methane and ammonia isotopologues were calculated from the integrated peak areas by summing the integrated peak areas of their C-D and C-H vibrations for CHxDy species (as in Foustoukos and Mysen 2013), and N-D and N-H vibrations for NHxDy species. For example, the integrated peak area for NH2D was calculated by summing the integrated peak areas of the bands at 2,420 cm−1 and 3,230 cm−1. For these methane and ammonia species, we used the σj values at 25°C proposed by Kagel (1964) for CHxDy species (Foustoukos and Mysen 2013) and those of Schrötter and Klöckner (1979) for N2 and NHxDy species (Table 2), and calculated the relative abundances (mole fractions) of species as Xj = Aj/σj. We observed a decrease in abundances in the order CH4 > CH3D > CH2D2 > CHD3, which is in agreement with Foustoukos and Mysen (2012), and NH3 > NH2D > NHD2 > ND3. These trends are consistent with the higher activation energy required to form C-D bonds relative to C-H bonds (Anslyn and Dougherty, 2006); we assume the same is true for N-D bonds relative to N-H bonds.
The abundances of CH4 relative to CHxDy and of NH3 relative to ND3 (as determined from their respective Raman band areas) decrease with increasing temperature (Figure 6), implying that increasing temperature drives the exchanges of C-H and C-D and of N-H and N-D. By extension, this implies that increasing temperature decreases the intramolecular D/H fractionations in CHxDy and NHxDy species. This temperature effect on intramolecular D/H fractionations in CHxDy species is similar in experiments A and B, but is significantly stronger in experiment C. Similarly, the effect of T on the relative abundances of NH3 and ND3 species is noticeably stronger in experiment C than in experiment A. These trends imply the two following reactions:
as proposed by Foustoukos and Mysen (2013), and.
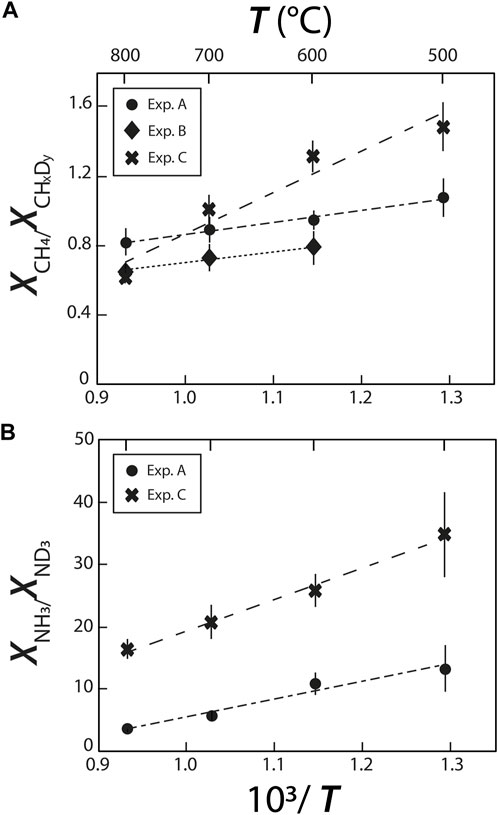
FIGURE 6. Relative species abundances of (A) deuteromethane and (B) deuteroammonia species, reflecting variations of H-D exchanges with changes in temperature and fluid composition.
both reactions shifting to the right with decreasing T.
The more pronounced effect of T in experiment C is not straightforward to understand. We may infer, as we did for O···HO and O···DO intermolecular bonds, that the presence of Si in experiment C favors isotopic exchanges, or that it favors the formation of Si-H bonds at higher temperatures reducing the abundances of CH4 relative to CHxDy and of NH3 relative to ND3. Another possibility is that oxidizing conditions prevailing in experiment C favors isotopic exchanges, which would be consistent with what was observed by Mysen (2018), who observed a greater temperature effect on D/H exchanges between an aqueous fluid and a silicate melt under oxidizing conditions than under reducing conditions.
3.3 Redox effects on N speciation in HT fluids
Despite several attempts to control fO2 in HDAC experiments (e.g., Mysen and Yamashita, 2010; Chen et al., 2019), it remains challenging. Here, to produce more oxidizing conditions in experiment C than those in experiments A and B, we added NiO powder as an oxidizing agent. The more oxidizing conditions in experiment C were confirmed by the presence of N2 and all its isotopologues (14N≡14N, 15N≡14N, and 15N≡15N), which were absent in experiment A. The presence of molecular N2, alongside with amine groups and molecular NH3, suggests that we reached intermediate redox conditions, illustrated with the magnetite-wüstite buffer (Mysen et al., 2014). In comparison, in experiments A and B, the absence of N2 vibrations implies that these experiments are under more reducing conditions such as those defined by the iron-wüstite buffer (Mysen et al., 2014). In oxidized N- bearing melts or fluids, N may also exist as NO or bound nitrosyl groups, vibrating near 2,100 and 2,200 cm−1 (Roskosz et al., 2006), although we did not detect any Raman signals in this frequency range in any of our fluids. Other species may include NH2− and NH2−, which vibrate in the same range as NHxDy species (3,390 cm−1; e.g., Mysen and Fogel, 2010; Mosenfelder et al., 2019). Although, the presence of such bands cannot be ruled out in experiment C (Figure 3), they are clearly absent from the Raman spectra of experiment A.
Using the relative normalized differential Raman scattering cross sections of Schrötter and Klöckner (1979) for N2, NH3, and H2O, we calculated the variations of the mole fraction ratios
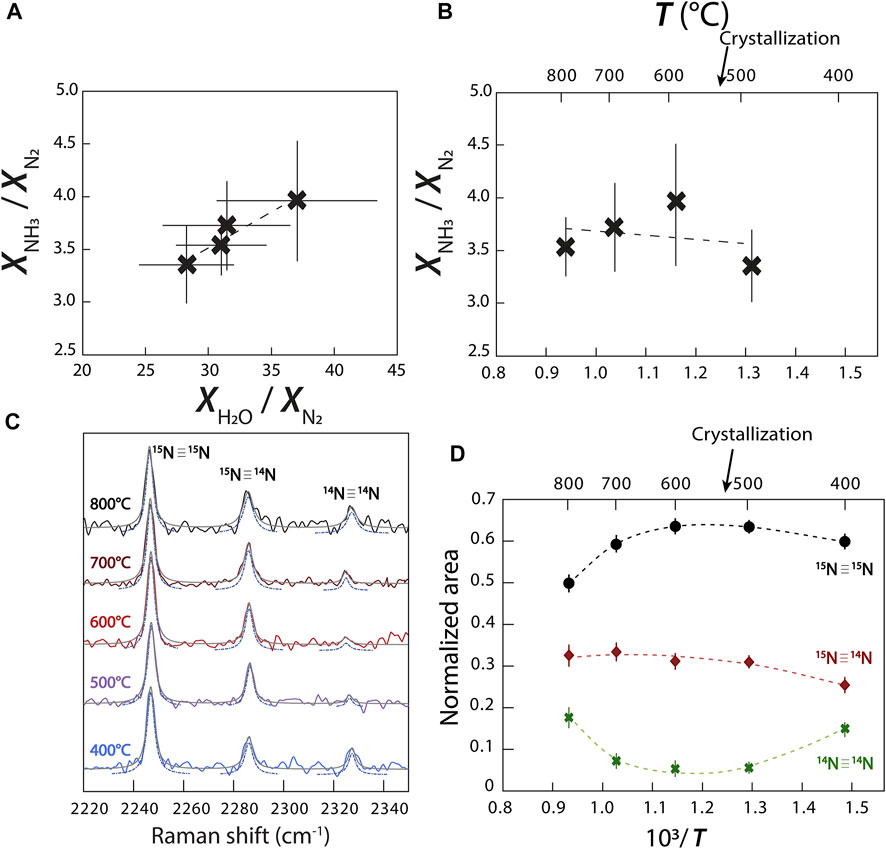
FIGURE 7. Variations of the abundances of N species and isotopologues. (A)
However, contrary to Chen et al. (2019), this reaction does not imply the continuous conversion of N2 to NH3 with decreasing temperature. We observed a more complicated relationship in which
Another possibility is that of a chain reaction, similar to that for NH3 oxidation (Song et al., 2016):
This reaction has been observed experimentally at <300°C (reviewed in Li et al., 2009), but seems unlikely to have occurred in our experiments because it requires significant amounts of NO or N2O that simply do not appear in our Raman spectra. As described in Li et al. (2009), the more direct oxidation of NH3 into N followed by the recombination of 2 N atoms into N2, or the recombination of NHx to form an intermediate N2H4 that is subsequently oxidized to form N2, such as:
may also have occurred. It is unclear how to decipher between reactions (3–6) without directly observing a change in oxygen fugacity (Eq. 3) or the presence of NH2 in our fluid. In other words, the variation observed in Figures 7A,B implies the transformation of NH3 to N2, but is insufficient information to conclude which exact reaction occurred in our experiments.
3.4 Nitrogen isotopic fractionation with decreasing P-T conditions of the fluid
Due to the abundance of N in experiment C, our spectra have well defined bands of N2 isotopologues (14N≡14N, 15N≡14N, and 15N≡15N), allowing us to observe variations of their respective abundances with changing temperature (Figure 7C). Assuming that the σj of 14N≡14N, 15N≡14N, and 15N≡15N vibrations are equivalent, we calculated the changing molar volumes of
4 Implications and conclusion
Our new in-situ experimental results support large hydrogen and nitrogen isotopic fractionations between water, methane, and ammonia species at HP-HT in aqueous fluids, although we were unable to quantify the magnitude of the fractionation. The quantification would require accurately fit 14N-H, 15N-H, 14N-D, and 15N-D vibrations in ammonia species, which is not possible with the resolution of our spectra considering that the Raman shift between these vibrations is smaller than 8 cm−1. We observed large variations in the abundances of deuteroammonia and deuteromethane species with changes in temperature, fluid composition, and redox conditions, and these variations were easily distinguishable by Raman spectroscopy. These observations suggest that statistical thermodynamic models underestimate isotopic fractionation effects for isotopic molecules by discarding solubility and isotopic effects of the solvent associated with the solvation of H/D water, methane, and ammonia isotopologues in aqueous fluids, as was previously established by Foustoukos and Mysen (2013) for methane species.
We successfully determined the effect of redox conditions on N speciation in fluids at HP-HT and were able to trace variations in the relative abundances of N2 and NH3 with decreasing temperature in an oxidized methane- and ammonia-bearing aqueous fluid. With decreasing P-T conditions, the N2/NH3 abundance ratio decreased, accompanied by a decreasing N isotopic fractionation between NH3 and N2,
Our findings have direct implications for understanding the geochemical cycling of H and N: they allow better constraining the effects of P-T-fO2 conditions on the speciation of H and N isotopologues during the ascent of, and the formation of bubbles from, an aqueous fluid. As a C- and N-bearing aqueous fluid ascends throughout the crust to Earth’s surface, it exsolves N2 and CH4 bubbles (Figure 4C; Mikhail and Sverjensky, 2014; Dalou et al., 2022), producing positive gas-fluid H and N isotopic fractionations, ΔD and Δ15N. In other words, a C- and N-bearing fluid will preferentially degas D-rich methane and 15N-rich N2, depleting the residual aqueous fluid in D and 15N. This is in agreement with the highly variable isotopic compositions of S and other volatile elements in natural hydrothermal fluids, which are depleted in heavy isotopes compared to their associated vapor (e.g., Stefánnson et al., 2017; Kleine et al., 2021). Because large isotopic fractionations are associated with changes in the speciation of volatile elements between phases (e.g., NH3 to N2), this implies that, in more oxidized fluids in which N is solely dissolved as N2, smaller in magnitude and negative gas-fluid Δ15N values are expected (Graham’s law). However, because hydrothermal or metamorphic fluids under crustal conditions reach highly oxidized conditions, nitrogen and carbon oxide species may become stable, whereas the gas-fluid ΔD value would no longer be controlled by CH4 degassing, but probably by the depressurization boiling of water.
In decompressing and cooling N-rich fluids, isotopic fractionations occur between aqueous, gaseous, and mineral species. In our experiments, the observed N isotopic fractionation between a NH4+-bearing mineral and the aqueous fluid was opposite that expected between a vapor phase and the aqueous fluid. Because NH4+ is the predominant N species in crustal minerals (substituting for K+, Na+, and Ca+; Busigny and Bebout, 2013), such NH4+–N2 and NH4+–NH3 isotopic fractionations are relevant to mineral-fluid interactions in geothermal systems.
Although, this study does not provide quantitative constraints on equilibrium fractionation factors and the kinetics of isotopic exchanges, it improves our understanding of isotopic fractionations in multicomponent and multiphase systems under hydrothermal temperatures and pressures. These constraints will aid in the interpretation of isotopic measurements of natural samples from hydrothermal systems.
Data availability statement
The original contributions presented in the study are included in the article/supplementary material, further inquiries can be directed to the corresponding author.
Author contributions
CD have made the starting fluids, the experiments, the acquisition of the Raman spectra and drafted the manuscript. CL performed the treatment of Raman spectra and edited the manuscript. EF edited the manuscript, and finalized the manuscript with CD, MC set up the Raman spectroscopy lab to adapt the HDAC, helped in the acquisition of the Raman spectra and edited the manuscript.
Acknowledgments
We are grateful to Delphine Lequin for her help, support, and technical assistance in the installation and maintenance of the HDAC lab at the CRPG. We thank Julien Dubois at the CRPG, and Pascal Robert at GéoRessources for their assistance with the HDAC temperature controller. We also thank William Bassett, Dionysis Foustoukos, and Bjorn Mysen for their advice during the initial setup of the HDAC lab at the CRPG, and Joseph Lai for synthetizing the 13C diamonds. We thank Robert Dennen for thorough English editing. This work was supported by the European Research Council under the European Union’s Horizon 2020 research and innovation program (Grant Agreement no. 715028). This is CRPG contribution 2826.
Conflict of interest
The authors declare that the research was conducted in the absence of any commercial or financial relationships that could be construed as a potential conflict of interest.
Publisher’s note
All claims expressed in this article are solely those of the authors and do not necessarily represent those of their affiliated organizations, or those of the publisher, the editors and the reviewers. Any product that may be evaluated in this article, or claim that may be made by its manufacturer, is not guaranteed or endorsed by the publisher.
References
Anslyn, E. V., and Dougherty, D. A. (2006). Modern physical organic chemistry. Sausalito, California: University science books.
Bassett, W. A., Shen, A. H., Bucknum, M., and Chou, I. M. (1994). A new diamond anvil cell for hydrothermal studies to 2.5 GPa and from −190 to 1200 °C. Rev. Sci. Instrum. 64, 2340–2345. doi:10.1063/1.1143931
Bassett, W. A., Wu, T. C., Chou, I. M., Haselton, T., Frantz, J. D., Mysen, B. O., et al. (1996). The hydrothermal diamond anvil cell (HDAC) and its applications. Mineral Spectrosc. A tribute Roger G. Burns 5, 261–272.
Bondarenko, G. V., Gorbaty, Y. E., Okhulkov, A. V., and Kalinichev, A. G. (2006). Structure and hydrogen bonding in liquid and supercritical aqueous NaCl solutions at a pressure of 1000 bar and temperatures up to 500 °C: A comprehensive experimental and computational study. J. Phys. Chem. A 110 (11), 4042–4052. doi:10.1021/jp0537198
Busigny, V., and Bebout, G. E. (2013). Nitrogen in the silicate Earth: Speciation and isotopic behavior during mineral–fluid interactions. Elements 9 (5), 353–358. doi:10.2113/gselements.9.5.353
Butterworth, T. D., Amyay, B., Bekerom, D. V. D., Steeg, A. V. D., Minea, T., Gatti, N., et al. (2019). Quantifying methane vibrational and rotational temperature with Raman scattering. J. Quantitative Spectrosc. Radiat. Transf. 236, 106562. doi:10.1016/j.jqsrt.2019.07.005
Ceccaldi, M., and Leicknam, J. P. (1968). Raman spectra of ordinary and deuterated liquid ammonias (No. CEA-R--3586). Gif-sur-Yvette, France: CEA Saclay.
Chen, Q., Zhang, Z., Wang, Z., Li, W. C., Gao, X. Y., Ni, H., et al. (2019). In situ Raman spectroscopic study of nitrogen speciation in aqueous fluids under pressure. Chem. Geol. 506, 51–57. doi:10.1016/j.chemgeo.2018.12.016
Chialvo, A. A., and Horita, J. (2003). Isotopic effect on phase equilibria of atomic fluids and their mixtures: A direct comparison between molecular simulation and experiment. J. Chem. Phys. 119 (8), 4458–4467. doi:10.1063/1.1594178
Dalou, C., Deligny, C., and Füri, E. (2022). Nitrogen isotope fractionation during magma ocean degassing: Tracing the composition of early Earth’s atmosphere. Geochem. Perspect. Lett. 20, 27–31. doi:10.7185/geochemlet.2204
Dalou, C., Hirschmann, M. M., Jacobsen, S. D., and Le Losq, C. (2019). Raman spectroscopy study of COHN speciation in reduced basaltic glasses: Implications for reduced planetary mantles. Geochimica Cosmochimica Acta 265, 32–47. doi:10.1016/j.gca.2019.08.029
Dalou, C., Le Losq, C., and Mysen, B. O. (2015). In situ study of the fractionation of hydrogen isotopes between aluminosilicate melts and coexisting aqueous fluids at high pressure and high temperature–Implications for the δD in magmatic processes. Earth Planet. Sci. Lett. 426, 158–166. doi:10.1016/j.epsl.2015.06.032
Foustoukos, D. I., and Mysen, B. O. (2012). D/H fractionation in the H2–H2O system at supercritical water conditions: Compositional and hydrogen bonding effects. Geochimica Cosmochimica Acta 86, 88–102. doi:10.1016/j.gca.2012.03.003
Foustoukos, D. I., and Mysen, B. O. (2013). H/D methane isotopologues dissolved in magmatic fluids: Stable hydrogen isotope fractionations in the Earth’s interior. Am. Mineralogist 98 (5-6), 946–954. doi:10.2138/am.2013.4419
Foustoukos, D. I. (2016). On the ionic strength and electrical conductivity of crustal brines. Chem. Geol. 447, 183–190. doi:10.1016/j.chemgeo.2016.10.040
Gaillard, F., Bouhifd, M. A., Füri, E., Malavergne, V., Marrocchi, Y., Noack, L., et al. (2021). The diverse planetary ingassing/outgassing paths produced over billions of years of magmatic activity. Space Sci. Rev. 217 (1), 22. doi:10.1007/s11214-021-00802-1
Garcia-Baonza, V., Rull, F., and Dubessy, J. (2012). “Raman spectroscopy of gases, water and other geological fluids,” in Raman spectroscopy applied to Earth sciences and cultural heritage, 12. doi:10.1180/EMU-notes.12.8
Hauri, E. (2002). SIMS analysis of volatiles in silicate glasses, 2: Isotopes and abundances in Hawaiian melt inclusions. Chem. Geol. 183 (1-4), 115–141. doi:10.1016/s0009-2541(01)00374-6
Hirschmann, M. M., Withers, A. C., Ardia, P., and Foley, N. T. (2012). Solubility of molecular hydrogen in silicate melts and consequences for volatile evolution of terrestrial planets. Earth Planet. Sci. Lett. 345, 38–48. doi:10.1016/j.epsl.2012.06.031
Kagel, R. O. (1964). Vibrational intensity studies. (Parts I and II). Minneapolis, Minnesota: University of Minnesota.
Kleine, B. I., Gunnarsson-Robin, J., Kamunya, K. M., Ono, S., and Stefánsson, A. (2021). Source controls on sulfur abundance and isotope fractionation in hydrothermal fluids in the Olkaria geothermal field, Kenya. Chem. Geol. 582, 120446. doi:10.1016/j.chemgeo.2021.120446
Kloprogge, J. T., Wharton, D., Hickey, L., and Frost, R. L. (2002). Infrared and Raman study of interlayer anions CO32−, NO3−, SO42− and ClO4− in Mg/Al-hydrotalcite. Am. Mineralogist 87 (5-6), 623–629. doi:10.2138/am-2002-5-604
Li, L., Cartigny, P., and Ader, M. (2009). Kinetic nitrogen isotope fractionation associated with thermal decomposition of NH3: Experimental results and potential applications to trace the origin of N2 in natural gas and hydrothermal systems. Geochimica Cosmochimica Acta 73 (20), 6282–6297. doi:10.1016/j.gca.2009.07.016
Li, Y., Huang, R., Wiedenbeck, M., and Keppler, H. (2015). Nitrogen distribution between aqueous fluids and silicate melts. Earth Planet. Sci. Lett. 411, 218–228. doi:10.1016/j.epsl.2014.11.050
Li, Y., and Keppler, H. (2014). Nitrogen speciation in mantle and crustal fluids. Geochimica Cosmochimica Acta 129, 13–32. doi:10.1016/j.gca.2013.12.031
Likhacheva, A. Y., Veniaminov, S. A., and Paukshtis, E. A. (2004). Thermal decomposition of NH4-analcime. Phys. Chem. Minerals 31 (5), 306–312. doi:10.1007/s00269-004-0388-9
Manning, C. E. (2004). The chemistry of subduction-zone fluids. Earth Planet. Sci. Lett. 223 (1-2), 1–16. doi:10.1016/j.epsl.2004.04.030
Mathieu, J. P., and Poulet, H. (1960). Les frequences fondamentales de vibration de l'ion NH4+. Spectrochim. acta 16 (6), 696–703. doi:10.1016/0371-1951(60)80120-8
McCubbin, F. M., Sverjensky, D. A., Steele, A., and Mysen, B. O. (2014). In-situ characterization of oxalic acid breakdown at elevated P and T: Implications for organic COH fluid sources in petrologic experiments. Am. Mineralogist 99 (11-12), 2258–2271. doi:10.2138/am-2014-4947
Mikhail, S., Barry, P. H., and Sverjensky, D. A. (2017). The relationship between mantle pH and the deep nitrogen cycle. Geochimica Cosmochimica Acta 209, 149–160. doi:10.1016/j.gca.2017.04.007
Mikhail, S., and Sverjensky, D. A. (2014). Nitrogen speciation in upper mantle fluids and the origin of Earth's nitrogen-rich atmosphere. Nat. Geosci. 7 (11), 816–819. doi:10.1038/ngeo2271
Mosenfelder, J. L., Von Der Handt, A., Füri, E., Dalou, C., Hervig, R. L., Rossman, G. R., et al. (2019). Nitrogen incorporation in silicates and metals: Results from SIMS, EPMA, FTIR, and laser-extraction mass spectrometry. Am. Mineralogist 104 (1), 31–46. doi:10.2138/am-2019-6533
Mysen, B. O., and Fogel, M. L. (2010). Nitrogen and hydrogen isotope compositions and solubility in silicate melts in equilibrium with reduced (N + H)-bearing fluids at high pressure and temperature: Effects of melt structure. Am. Mineralogist 95 (7), 987–999. doi:10.2138/am.2010.3364
Mysen, B. O. (2018). Mass transfer in the Earth’s interior: Fluid-melt interaction in aluminosilicate–C–O–H–N systems at high pressure and temperature under oxidizing conditions. Prog. Earth Planet. Sci. 5 (1), 6. doi:10.1186/s40645-017-0161-6
Mysen, B. O., Tomita, T., Ohtani, E., and Suzuki, A. (2014). Speciation of and D/H partitioning between fluids and melts in silicate-DOHCN systems determined in-situ at upper mantle temperatures, pressures, and redox conditions. Am. Mineralogist 99 (4), 578–588. doi:10.2138/am.2014.4575
Mysen, B. O., and Yamashita, S. (2010). Speciation of reduced C–O–H volatiles in coexisting fluids and silicate melts determined in-situ to ∼1.4 GPa and 800 °C. Geochimica Cosmochimica Acta 74 (15), 4577–4588. doi:10.1016/j.gca.2010.05.004
Novak, A. (1974). “Hydrogen bonding in solids correlation of spectroscopic and crystallographic data,” in Large molecules (Berlin, Heidelberg: Springer), 177–216.
Pineau, F., Shilobreeva, S., Kadik, A., and Javoy, M. (1998). Water solubility and D/H fractionation in the system basaltic andesite–H2O at 1250°C and between 0.5 and 3 kbars. Chem. Geol. 147 (1-2), 173–184. doi:10.1016/s0009-2541(97)00180-0
Richet, P., Bottinga, Y., and Javoy, M. (1977). A review of hydrogen, carbon, nitrogen, oxygen, sulphur, and chlorine stable isotope fractionation among gaseous molecules. Annu. Rev. Earth Planet. Sci. 5 (1), 65–110. doi:10.1146/annurev.ea.05.050177.000433
Roskosz, M., Mysen, B. O., and Cody, G. D. (2006). Dual speciation of nitrogen in silicate melts at high pressure and temperature: An experimental study. Geochimica Cosmochimica Acta 70 (11), 2902–2918. doi:10.1016/j.gca.2006.03.001
Schiferl, D., Nicol, M., Zaug, J. M., Sharma, S. K., Cooney, T. F., Wang, S. Y., et al. (1997). The diamond 13C/12C isotope Raman pressure sensor system for high-temperature/pressure diamond-anvil cells with reactive samples. J. Appl. Phys. 82 (7), 3256–3265. doi:10.1063/1.366268
Schrötter, H. W., and Klöckner, H. W. (1979). Raman scattering cross sections in gases and liquids, 123–166.
Sokol, A. G., Palyanov, Y. N., Tomilenko, A. A., Bul'bak, T. A., and Palyanova, G. A. (2017). Carbon and nitrogen speciation in nitrogen-rich C–O–H–N fluids at 5.5–7.8 GPa. Earth Planet. Sci. Lett. 460, 234–243. doi:10.1016/j.epsl.2016.11.050
Song, Y., Hashemi, H., Christensen, J. M., Zou, C., Marshall, P., Glarborg, P., et al. (2016). Ammonia oxidation at high pressure and intermediate temperatures. Fuel 181, 358–365. doi:10.1016/j.fuel.2016.04.100
Stefánsson, A., Hilton, D. R., Sveinbjörnsdóttir, Á. E., Torssander, P., Heinemeier, J., Barnes, J. D., et al. (2017). Isotope systematics of Icelandic thermal fluids. J. Volcanol. Geotherm. Res. 337, 146–164. doi:10.1016/j.jvolgeores.2017.02.006
Van Hook, W. A. (2006). Condensed matter isotope effects. ChemInform 37 (42), 119. doi:10.1002/chin.200642248
Walrafen, G. E. (1968). Raman spectral studies of HDO in H2O. J. Chem. Phys. 48 (1), 244–251. doi:10.1063/1.1667910
Walrafen, G. E., Yang, W. H., Chu, Y. C., and Hokmabadi, M. S. (1996). Raman OD-stretching overtone spectra from liquid D2O between 22 and 152 °C. J. Phys. Chem. 100 (4), 1381–1391. doi:10.1021/jp952134i
Keywords: hydrogen, nitrogen, aqueous fluids, high pressure, oxygen fugacity, Raman spectroscopy, HDAC
Citation: Dalou C, Le Losq C, Füri E and Caumon M-C (2022) Redox controls on H and N speciation and intermolecular isotopic fractionations in aqueous fluids at high pressure and high temperature: Insights from in-situ experiments. Front. Earth Sci. 10:973802. doi: 10.3389/feart.2022.973802
Received: 20 June 2022; Accepted: 13 July 2022;
Published: 16 August 2022.
Edited by:
Carla Tiraboschi, University of Münster, GermanyReviewed by:
Jin Liu, Center for High Pressure Science and Technology Advanced Research, ChinaManuela Borchert, Institut für Mineralogie, Westfälische Wilhelms-Universität, Germany
Copyright © 2022 Dalou, Le Losq, Füri and Caumon. This is an open-access article distributed under the terms of the Creative Commons Attribution License (CC BY). The use, distribution or reproduction in other forums is permitted, provided the original author(s) and the copyright owner(s) are credited and that the original publication in this journal is cited, in accordance with accepted academic practice. No use, distribution or reproduction is permitted which does not comply with these terms.
*Correspondence: Celia Dalou, celia.dalou@univ-lorraine.fr