Source Model for the 2022 Qinghai Menyuan Ms 6.9 Earthquake Based on D-InSAR
 Jiangtao Liao
 Chuntao Liang1,2*
  Chengming Ye
- 1Key Laboratory of Earth Exploration and Information Techniques (Chengdu University of Technology), Ministry of Education, Chengdu, China
- 2State Key Laboratory of Geohazard Prevention and Geoenvironment Protection (Chengdu University of Technology), Chengdu, China
On 8 January 2022, an Ms 6.9 earthquake occurred in Menyuan County, Qinghai Province, China. This earthquake ruptured a patch of the Qilian-Haiyuan fault in the northeast margin of the Qinghai-Tibet Plateau. In order to understand the seismogenic structure of this earthquake and analyze the fault activity, we use differential synthetic aperture radar interferometry (D-InSAR) technology to obtain a complete co-seismic displacement field on the surface, and use pixel tracking algorithm to extract the trace of the ruptured fault. The slip distribution of the seismogenic fault was inverted using the steepest descent method, and the Coulomb stress change caused by the earthquake was also calculated. Surface deformation results show that the Menyuan earthquake produced obvious surface displacements in an area of 50 × 40 km2. The displacements are mainly distributed in the western segment of the Lenglongling fault and the eastern segment of the Tolaishan fault. The maximum displacements in the ascending and descending orbits in the LOS direction are 59.7 and 94.7 cm, respectively. The co-seismic slip results show that the strike, dip and average slip angles of the seismogenic fault are 108°, 79° dipping to SW, and 4°, respectively. On the whole, the fault is mainly of left-lateral, with a small amount of thrust component and only one co-seismic rupture center in our inversion result. The rupture center is located at a depth of ∼5 km below the surface, and the maximum slip is 3.1 m. The total seismic moment released by this earthquake is 1.28 × 10¹⁹ N·m, and the corresponding moment magnitude is 6.67. Finally, the static Coulomb stress change results show that parts of the Lenglongling fault, the Tolaishan fault, the Sunan-Qilian fault and the Minyue-Damaging fault are loaded, emphasizing the importance for earthquake risk assessment of these fault.
Introduction
At 01:45 on 8 January 2022, a magnitude 6.9 earthquake occurred in Menyuan County, Haibei Prefecture, Qinghai Province (37.77 N, 101.26 E) with a focal depth of 10 km. The epicenter is 54 km away from Menyuan County, with an average altitude of about 3,674 m within 5 km (http://www.cenc.ac.cn/). The area is sparsely populated. Nine people were injured in the earthquake. Many buildings, including the Lanxin Railway, were severely damaged with a maximum intensity of IX (China Earthquake Administration; Lu et al., 2022). As of April 1, two aftershocks of magnitude 5 or above were recorded, which occurred 26 min and 4 days after the earthquake, respectively, and the Ms 5.2 earthquake was the largest aftershock on January 12.
This earthquake occurred on the Qilian-Haiyuan fault zone on the northeastern margin of the Qinghai-Tibet Plateau (Figure 1). Since the Cenozoic, the northeastern margin of the Qinghai-Tibet Plateau has expanded into the mainland under the double effects of the continuous northeast compression of the Indian plate and the resistance of the adjacent strong Alashan block (Zhang et al., 2003; Shi et al., 2018). The GPS velocity field shows that the crustal displacement of the northeastern margin of the Qinghai-Tibet Plateau is NE-EW, and the continuous northward expansion is the major tectonic cause for the frequent occurrence of strong earthquakes in this area (Wang and Shen, 2020). Qilian-Haiyuan fault is a large active fault in the study area, which is dominated by strike-slip. It starts from the Muli-Jiangcang fault in the west, and stretches eastward as the Tuolaishan fault, the Lenglongling fault, the Jinan fault, the Qianghe fault, the Maomaoshan fault, the Laohushan fault, the Haiyuan fault, the Liupanshan fault. Since 1900, two M ≥ 8 earthquakes have occurred on this fault—Haiyuan M 81/2 earthquake in 1920 and the Gulang M 8 earthquake in 1927 (Zhu et al., 2022). The Menyuan Ms 6.9 earthquake occurred in a region with a risk code of A3 in the middle part of Qilian Mountains (Xu et al., 2017). It is located at the intersection of the Lenglongling fault and the Tolaishan fault (Fan et al., 2022; Xu et al., 2022; Yang et al., 2022). The Lenglongling fault is connected to the Jinqianghe fault in the east and the Tolaishan fault in the west. It is a Holocene sinistral strike-slip and thrust fault with a strike of NWW and a total length of about 150 km (Xu et al., 2016). On 26 August1986 and 21 January2016, two historical earthquakes of M 6.4 occurred on a blind thrust fault developed on the northeast of Lenglongling fault, at 28 and 33 km from this epicenter, respectively (Liu et al., 2019; He et al., 2020).
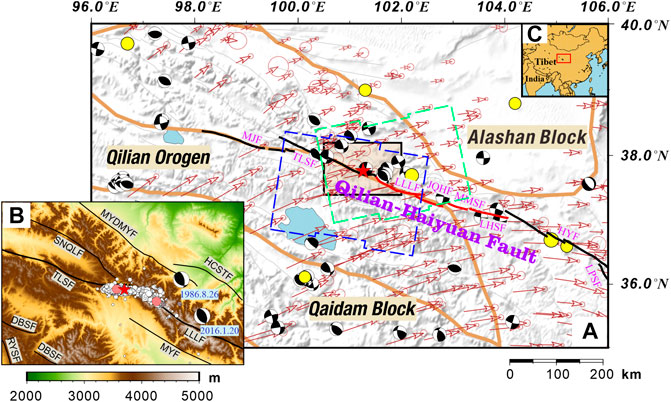
FIGURE 1. Tectonic backgrounds of the Menyuan Ms 6.9 earthquake. (A) The green and blue dashed rectangles represent the data coverage of ascending and descending orbits of Sentinel-1 satellites, respectively; the black rectangle represents the scope of the study area. The black and red solid lines constitute together the Qilian-Haiyuan Fault, and the latter is seen as the Tianzhu Gap (Gaudemer et al., 1995). The yellow circles represent historical earthquakes with surface wave magnitude (Ms) larger than 7 since 1900 (data from Sichuan Earthquake Administration). Black beach balls represent focal mechanisms of M ≥ 5.0 events (Global CMT, since 1976). Brown arrows represent the GPS velocity field with respect to the Eurasian frame (Wang and Shen, 2020). The red star represents the Ms 6.9 earthquake. The background image is DEM from SRTM (Farr and Kobrick, 2000). (B) Topography of the study area [black box in Figure (A)] and aftershock distribution. The mainshock is marked by the red star. Pink circles represent two Ms ≥ 5.0 aftershocks (Yang et al., 2022); black beach balls represent the focal mechanisms of two Ms 6.4 Menyuan earthquakes in 1986 and 2016. The solid black line represents the surface fault trace (Xu et al., 2016). (C) Geographical location of the study area. The red box marks the extent of figure (A). MJF: Muli-Jiangcang Fault, TLSF: Tuolaishan Fault, LLLF: Lenglongling Fault, JQHF: Jinqianghe Fault, MMSF: Maomaoshan Fault, LHSF: Laohushan Fault, HYF: Haiyuan Fault, LPSF: Liupanshan Fault, SNQLF: Sunan-Qilian Fault, MYDMYF: Minyue-Damaying Fault, HCSTF: Huangcheng-Shuangta Fault, MYF: Menyuan Fault, DBSF: Dabanshan Fault, RYSF: Riyueshan Fault.
After the Menyuan Ms 6.9 earthquake, some scientific research teams responded quickly, and made significant research achievements in the field geological surveys, precise location of aftershocks, focal mechanism solutions, fault slip distribution, regional Coulomb stress changes, regional deep structures and so on (Feng et al., 2022; Liang et al., 2022; Pan et al., 2022; Peng et al., 2022; Wang et al., 2022; Yang et al., 2022; Zhu et al., 2022). Field investigation reveals that the surface rupture mainly includes linear shear cracks, oblique tension cracks, tension shear cracks, extrusion bulge and other types. It is the rupture of the left-order part of the left-lateral strike-slip fault under the tensile stress regime, and it is considered that the fault is ruptured bilaterally initiating from the compressional bend (Li et al., 2022a; Pan et al., 2022). The aftershock location results show a distinct spatiotemporal migration exist from the west to the east (Fan et al., 2022; Xu et al., 2022; Yang et al., 2022). Focal mechanism results show that the earthquake is a strike-slip type. Further, the source characteristics of aftershocks vary from the mainshock zone to the east side. Focal mechanisms of aftershocks near the mainshock are similar to that of the mainshock, and the reverse component increases to the east side obviously (Liang et al., 2022). The finite fault inversion results show that the fault is dominated by left-lateral strike-slip with a maximum slip of 3.5 m. The Coulomb stress change results show that the earthquake is located at the positive stress zone of the 2016 Menyuan earthquake (Li et al., 2022b; Peng et al., 2022). The historical strong earthquakes on the northeastern margin of the Qinghai-Tibet Plateau have a stress loading effect on the Muli-Jiangcang and Tuolaishan faults in the western segment of the Qilian-Haiyuan fault zone, as well as the Jinqianghe-Laohushan fault in the middle segment (Zhu et al., 2022). In addition, the thickness of crust changes dramatically in the eastern part of the Qilian block, and this earthquake is located at the transition zone where physical properties of the crustal medium rapidly change (Wang et al., 2022).
Results above show that the fault structure is complex. Some problems still remained unclear. For example, the influence of the earthquake on the adjacent faults is not resolved. Previous studies mainly focused on quick disaster emergency response after the earthquake. The ascending orbit images used in the InSAR-based deformation observation only covered part of the rupture area, so the interferogram was incomplete. Would the results be improved by using ascending orbit data that completely covered the rupture zone?
In this paper, the co-seismic displacement field is obtained by D-InSAR technology, using the data of synthetic aperture radar (SAR) in ascending and descending orbits covering the seismic rupture area. At the same time, based on Pixel Tracking technology, the range and azimuth offset maps of the ascending and descending orbits are obtained, and the surface fault traces are also extracted. Then, the linear inversion of the distributed slip model is carried out. Based on the finite fault model, the Coulomb stress change caused by the earthquake are calculated. Finally, and the stress condition of the adjacent faults after the earthquake is analyzed.
InSAR Data and Processing
According to the principle of minimum time interval of SAR data coverage, the Level 1 Single-Look Complex data (SLC) in Sentinel-1 Interferometric Wide (IW) mode is used. The ascending orbit (T128A) and the descending orbit (T33D) each contain two images to form an interferometry pair. The detailed parameters of the image pairs are shown in Table 1. The time baselines of the satellite images of the ascending and descending orbits are both 12 days. The ascending orbit image pair were collected 3 days before and 9 days after the earthquake. The descending orbit image pair were collected 10 days before and 2 days after the earthquake. So, more afterslip is included in the ascending orbit pair. In addition, the corresponding spatial perpendicular baselines of the two pairs of images are both less than 60 m, indicating that the topographic phase has little influence on the interferometry phase, increasing the sensitivity of the deformation phase.
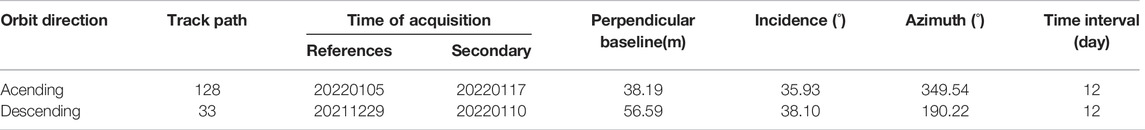
TABLE 1. Basic parameters of the SAR data.
In this paper, the open-source software ISCE (InSAR Scientific Computing Environment, Rosen et al., 2012) is used for two-pass differential interference processing of the SAR data in ascending and descending orbits. Firstly, the software achieves accurate image registration through enhanced spectral diversity (ESD) algorithm (Fattahi et al., 2017), which makes the azimuth matching accuracy higher than 0.001 pixels, avoiding the phase jump caused by adjacent image bursts, and greatly improving the reliability of interference results. The precise orbit (POEORB) data of European Space Agency (ESA) is used to eliminate orbit errors (https://scihub.copernicus.eu/). The 30-m resolution SRTM elevation data product published by NASA was used to simulate the terrain phase, and the interferogram is obtained by the second difference. In order to improve the signal-to-noise ratio of the interferograms, the multi-look ratio of range direction and azimuth direction is set as 5:1. A weighted power spectrum adaptive algorithm for phase filtering (Goldstein and Werner, 1998). Then, the phase unwrapping is carried out based on the minimum cost flow algorithm, to obtain the geocoded Line Of Sight (LOS) displacement. The atmospheric errors in InSAR measurement mainly come from the influence of the ionosphere and troposphere, and the ionosphere has less influence on the C band due to the relatively short wavelength (Gray et al., 2000). Therefore, the tropospheric atmospheric delay model provided by the General Atmospheric Correction Online Service (GACOS) of Newcastle University was used for atmospheric correction (Yu et al., 2018). The residual error of orbit will produce long wavelength noise, so a linear trend is removed from the line of sight (LOS) displacement result. Finally, the co-seismic LOS deformation field after atmospheric correction and detrending is obtained. (Supplementary Figure S1).
Coseismic Deformation
In this paper, D-InSAR technology was used to obtain the interferograms of the ascending and descending orbit SAR data (Figure 2). Except for a small incoherent area in the deformation center caused by deformation jump on the fault trace, strong coherence is preserved among the most area, showing continuous interference fringes. Both ascending and descending interferograms show the typical “butterfly shape” of strike slip rupture (Figures 2A,C). The deformation zone is about 50 × 40 km2, mainly along the Lenglongling fault and the eastern section of Tuolaishan fault.
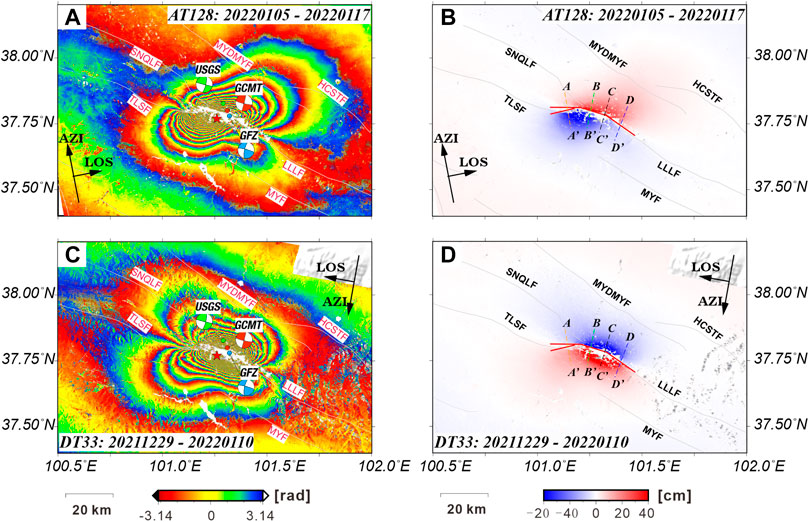
FIGURE 2. Interferogram and co-seismic deformation field (LOS direction) of Menyuan Ms 6.9 earthquake. (A,C) are the interferograms of T128 ascending orbit and T33 descending orbit, respectively. Focal mechanism solutions from GCMT, GFZ, and USGS are displayed with the red, blue, and green focal spheres. The red star marks the epicenter of the mainshock. (B,D) are the LOS co-seismic deformation fields of T128 ascending orbit and T33 descending orbit, respectively. The dashed lines labeled by (A–D) are four cross-fault profiles shown in Figure 3, and the red solid lines represent the seismogenic faults. Black arrows indicate satellite flight direction (AZI) and right-looking observation direction (LOS).
For an earthquake, the co-seismic deformation fields of ascending and descending orbits are different, which is mainly caused by the difference of incidence angle and flight azimuth (Hu et al., 2010). The relation between three component of deformation and the LOS displacement is:
Where
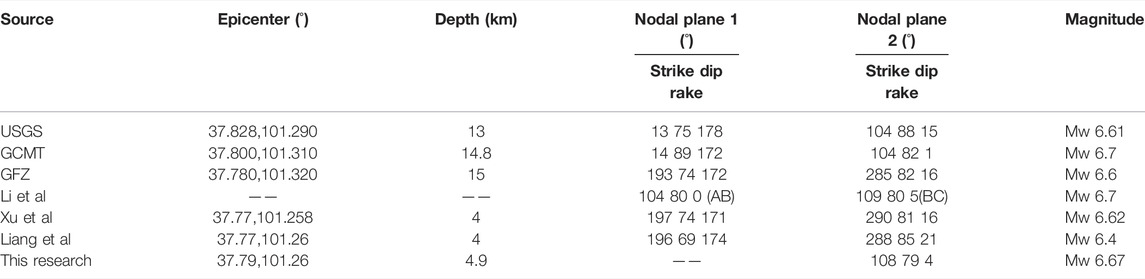
TABLE 2. Focal mechanism solutions of the Menyuan Ms 6.9 earthquake.
Figure 3 shows four displacement profiles in the ascending and descending tracks. The displacement gradually decreases away from the fault. Compared with the AA’ and DD’ sections far from the epicenter, BB “and CC” sections near the epicenter have obviously larger relative displacements, indicating that the ground deformation caused by the earthquake decreases from the center to both sides. The surface displacement caused by the Menyuan Ms 6.9 earthquake gradually decreased from the center of the rupture zone to both ends, and the displacement on both sides of the cross-fault was opposite in direction but similar in size, indicating that the seismogenic fault has a high dip Angle.
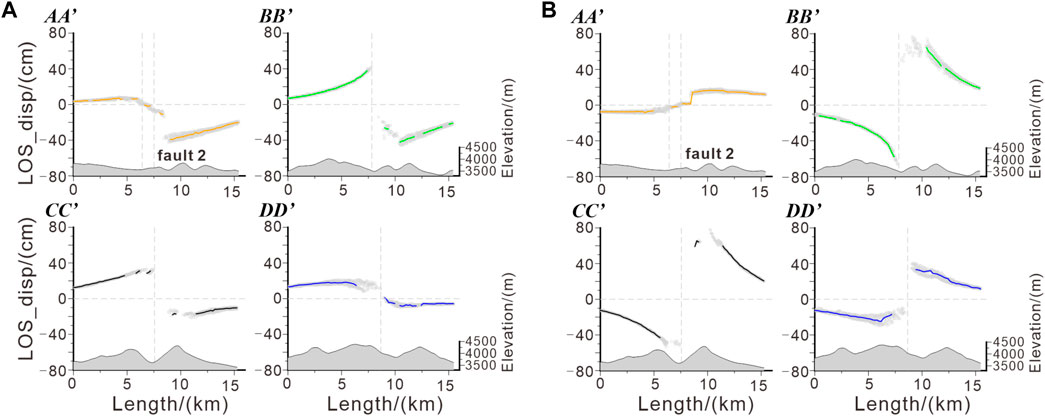
FIGURE 3. Co-seismic displacement profiles of the Menyuan Ms 6.9 earthquake (LOS direction). (A) Cross-fault displacement profiles of the T128 ascending orbit, with profile location shown in Figure 2; (B) Cross-fault displacement profiles of the T33 descending orbit. Gray circles are the data within 1 km along the profile. The vertical gray dotted line indicates the location of the faults, of which the southern branch fault (fault2) is located about 1 km south from the main fault.
Fault Geometry Constraints and Slip Distribution Inversion
After the Menyuan Ms 6.9 earthquake, different institutions and researchers quickly conducted focal mechanism inversion, and the results were somewhat different (Table 2). Xu et al. (2022) and Liang et al. (2022) have used more waveform data to obtain a more reliable solution of focal mechanism, which shows that the focal depth was shallow, both at 4 km. Compared with the teleseismic records, InSAR observations can provide more near-field constraints for the inversion of fault geometry and slip distribution. In order to determine the fine motion characteristics of seismogenic faults, the down-sampling process is carried out on the basis of co-seismic surface displacement, and then the slip distribution of the fault is inverted based on the classical elastic dislocation model.
InSAR co-seismic deformation field usually contains millions of points, and adjacent observation points have strong spatial continuity (Hanssen, 2001; Ji et al., 2017). In order to improve the calculation efficiency and reduce the influence of unreliable values in inversion, filter and downsampling preprocess are applied to the LOS displacement data. Firstly, the interferograms of ascending and descending orbit are masked according to the coherence. Sampling points with coherence greater than 0.5 are extracted to ensure the high quality co-seismic deformation data (Yu et al., 2020). Then, an adaptive quadtree method based on gradient variation is applied to downsample the co-seismic deformation data (Decriem et al., 2010; Bagnardi and Hooper, 2018). For each point, independent incidence and azimuth angles are used. This method retains the main characteristics of the original deformation field completely, and reduces the number of sampling points in the far field. Finally, 872 LOS displacement samples of the ascending orbit and 908 LOS displacement samples of the descending orbit are obtained (Supplementary Figure S2).
Spatial Characteristics of the Fault
Fault traces on the surface are extracted from the range and azimuth offset map. Amplitude pixel tracking method is used to obtain the range and azimuth offset of the Menyuan Ms 6.9 earthquake (Figure 4). The basic principle of this method is to calculate the pixel offsets in the range direction and azimuth direction according to the cross-correlation of amplitudes on the basis of sub-pixel registration of two SAR images (Hu et al., 2010). This method greatly compensates the insensitivity of InSAR to the north-south ground displacement, and helps to explain the incoherent phenomenon caused by the local large rupture near the fault. The azimuth offset results of T128 ascending and T33 descending orbits are opposite on both sides of the fault, showing a sharp color discontinuity (Figures 4B,D). Utilizing the offset maps with the boundary between positive and negative offset values, the surface traces of seismogenic fault can be extracted by outlining the discontinuity (Zhang et al., 2011; Hua et al., 2021). The finally obtained surface trace is composed of two faults (Figures 2B,D), of which the average strike of the small south branch is 77°, and the main north fault is 108°, with a total length of 49.5 km.
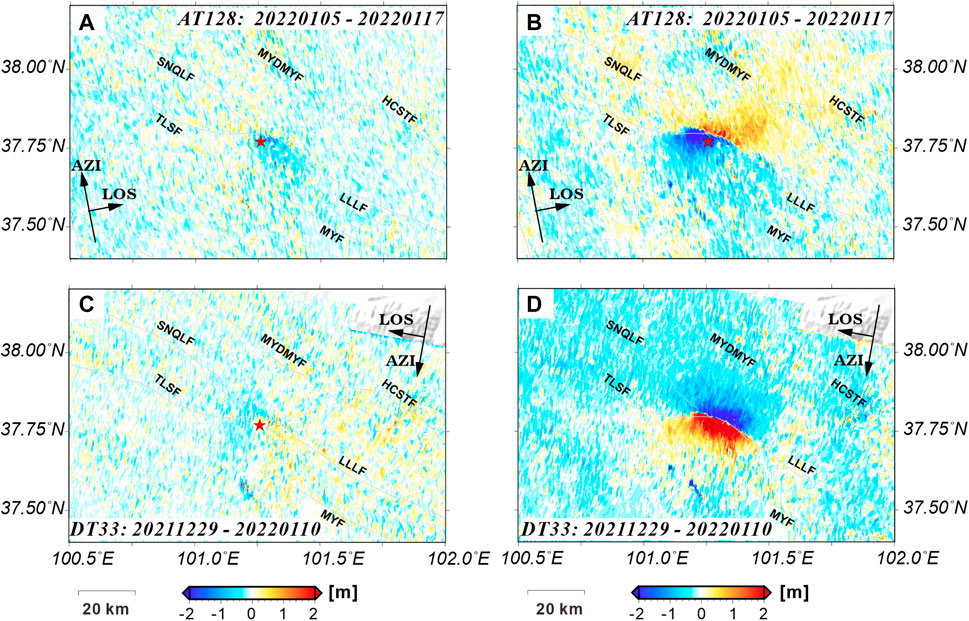
FIGURE 4. The results of the Pixel-Tracking method for the ascending and descending orbit amplitudes. (A,C) are the range offset of the T128 ascending orbit and the T33 descending orbit, respectively, and the positive and negative values indicate the decreasing and increasing of the horizontal surface displacement along the distance direction from the satellite and to the target point (the range direction); (B,D) are the azimuth offset of the T128 ascending orbit and the T33 descending orbit, respectively, and the positive and negative values represent the forward and backward displacement of the horizontal displacement along the flight direction of the satellite, respectively. The red star indicates the epicenter. Black arrows indicate satellite flight direction (AZI) and right-looking observation direction (LOS).
In the addition, the four profiles of the co-seismic deformation fields of the ascending and descending orbits (Figure 3) show that the displacements on both sides of the cross fault are approximately complementary. The existing focal mechanism solutions show that the dip angle of the seismogenic fault is close to vertical (Table 2), so the range of dip angle is set to 70°–90°. In order to select the optimal dip angle, a grid search with step of 1° was conducted in the inversion (Li et al., 2018), and the optimal dip angle was obtained as 79° (Figure 5A).
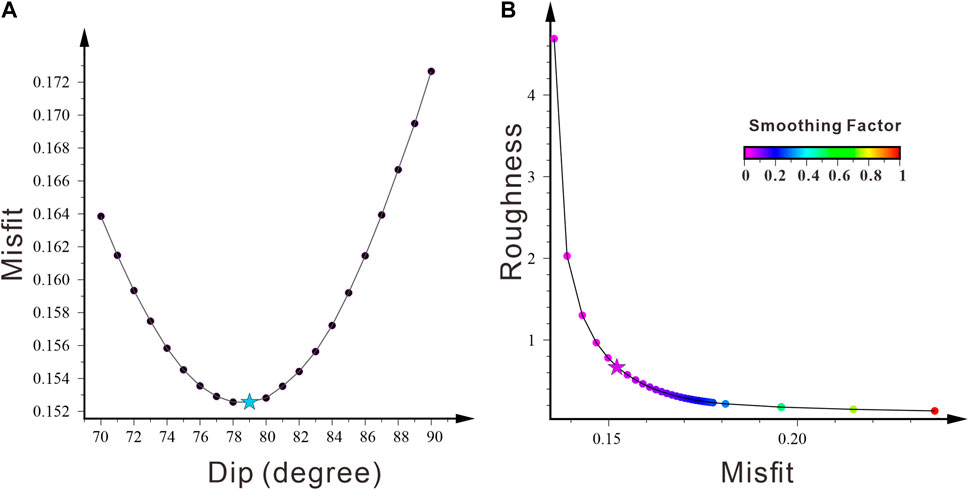
FIGURE 5. Determination of the optimal fault dip angle and the smoothing factor. (A) The misfit-dip curve. The light blue star indicates the optimal dip angle of 79°. (B) The model roughness and the fitting residual curve. The star indicates the best smoothing factor of 0.05.
Distributed Slip Model
According to the uniform isotropic elastic half-space dislocation model, the slip on the seismogenic fault plane can be linearly projected to the earth’s surface by Green’s function (Okada, 1985). The relationship between the slip distribution of the fault and the co-seismic displacement field is as follows:
where
Generally speaking, the inversion of fault parameters includes the location, length, width, depth, strike and dip angle of the fault, and the slip vector on the fault, which is a highly nonlinear problem. Usually “two-step” inversion is adopted. Firstly, geometric parameters of seismogenic faults are resolved using a nonlinear inversion method (Bagnardi and Hooper, 2018). Then, according to the linear relationship between
In this paper, the Steepest Descent Method (SDM) inversion method (Wang et al., 2013) was used to solve the rake and slip size of each discrete sub-fault in the distribution slip model. This method has been widely used in GPS and InSAR co-seismic displacement inversion (Chen et al., 2018; Shi et al., 2019; Yu et al., 2020; He et al., 2022). SDM is an iterative optimization algorithm with better convergence and less dependence on the initial value. In order to minimize the objective function in each calculation, a step size proportional to the negative gradient is used in each iteration.
Meanwhile, in order to ensure smoothness and continuity between each sub-faults, a smoothing factor is added in the inversion process, and the objective function is as follows:
where
In the process of inversion, Poisson’s ratio is set to 0.25, the top depth of the fault is 0 km, and the dip angle is 79° (Figure 5A). Referring to the focal mechanisms of the mainshock (USGS, GCMT, and GFZ), the slip angle is empirically constrained to -15°–25° to accelerate the convergence. According to the relocation results of aftershocks, the aftershock concentrates at 5–10 km depth, and a few of aftershocks occurred between 11 and 20 km depth (Xu et al., 2022; Yang et al., 2022). Thus, the width of the fault was set to 20 km corresponding to the depth of 19.6 km. Then, the whole fault plane is divided into a 2 × 2 km rectangle, with 250 sub-faults in total. The maximum slip is set at 10 m. At the same time, the weight of ascending and descending orbit deformation was set to 0.8:1, taking into account the impact of afterslip in the ascending displacement. Independent incidence and azimuth angles are used for each sampling point (Zhang et al., 2011).
In order to further ensure the stability and reduce the uncertainty of the inversion, a grid search method was adopted to obtain the L-curve between model roughness and fitting residual for a series of smoothing factor (Figure 5B). Consequently, the optimal smoothing factor 0.05 was selected.
Figure 6 shows the fault slip distribution of the Menyuan Ms 6.9 earthquake. On the whole, the joint inversion results of ascending and descending orbits are similar to those of Yang et al. (2022), but different from those of Li et al. (2022a). This may be related to the difference in the geometry of faults. It can be seen from the slip distribution results that the slip is mainly concentrated in the strike range of 12–30 km, and 0–10 km along the dip. The maximum slip is 3.12 m at a depth of about 5 km, and the average slip of the main fault is 0.48 m (Supplementary Figures S3–S5).
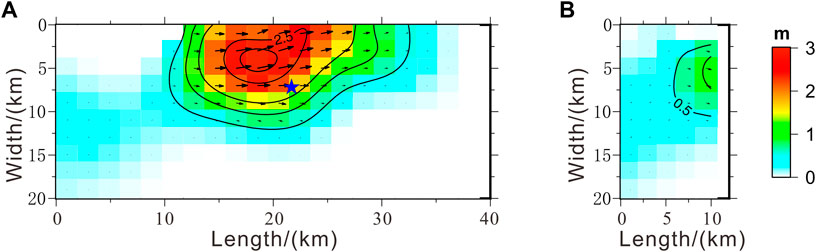
FIGURE 6. Fault slip distribution of the Menyuan Ms 6.9 earthquake. (A,B) are the slip distributions of the main fault and the minor branch fault along the fault strike, respectively; black arrows represent the slip vector, and its direction represents the movement direction of the hanging wall relative to the foot wall; the blue star indicates the location of the mainshock determined by Yang et al. (2022).
Slip directions of fault patches show that the rupture is mainly sinistral strike-slip. In the slip center on the main fault, a small amount of thrust slip component exists.The inversion results show that the seismic moment is 1.28 × 10¹⁹ N·m, and the equivalent moment magnitude is 6.67, consistent with the GCMT result.
In the joint inversion results of ascending and descending orbits, the correlation coefficient between the observed and the simulated deformation is 98.87%. The root mean square error (RMSE) ascending descending orbits are 5.5 and 5.6 cm, respectively.
As can be seen from the spatial distribution of residuals (Figures 7C,F), the fitting residuals are small in the whole. The largest residuals appear in the area near the surface rupture zone. This may be caused by displacement errors from strong incoherence in the zone and the complexity of the very shallow rupture.
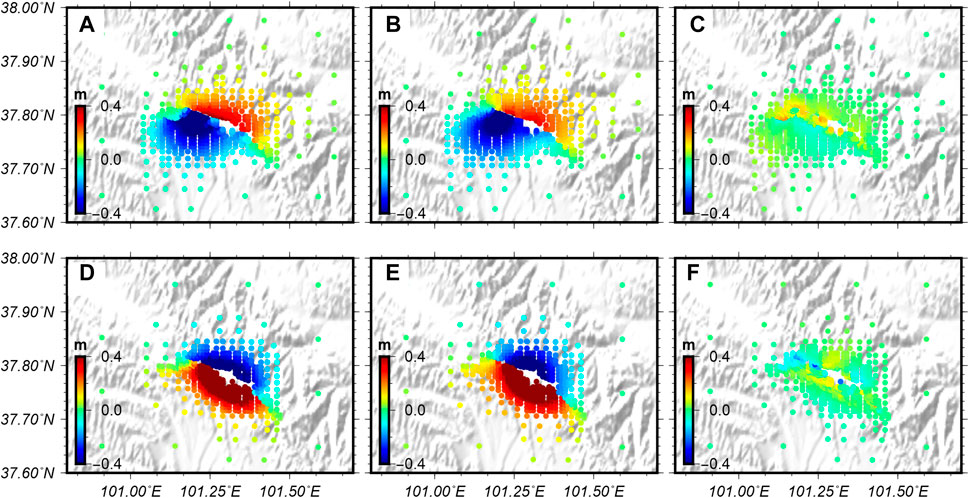
FIGURE 7. Fitting results in distributed slip model inversion. (A–C) represent the observed deformation, simulated deformation and the fitting residual of the T128 ascending orbit, respectively; (D–F) are same for the T33 descending orbit. The background image is DEM.
Figure 8 shows the histogram of fitting residuals. The distribution of ascending fitting residual is more concentrated (Figure 8A). Except for a few large residuals in the descending orbit, most of the residuals are close to zero, showing approximate Gaussian distribution. The ascending average fitting residual error is 1.52 cm with the variance of 2.8 mm, and the descending average fitting residual error is −0.93 cm with the variance of 3.1 mm.
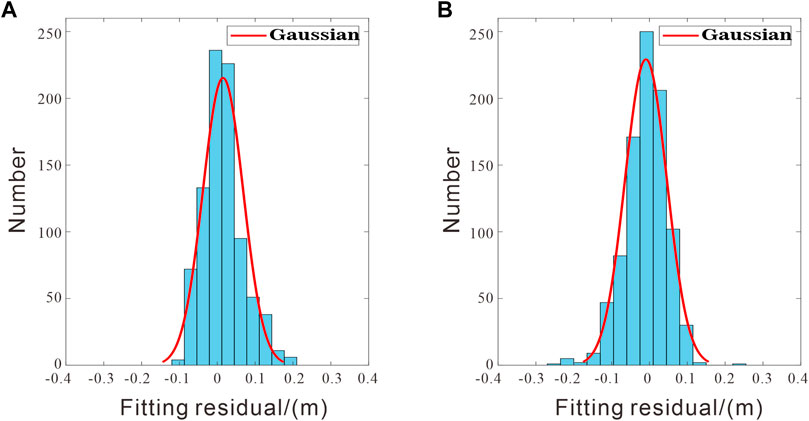
FIGURE 8. Histograms of the fitting residuals. (A,B) represent the fitting residual histograms of the inversion results of the T128 ascending orbit and the T33 descending orbit. The red solid line indicates the Gaussian distribution curve fitted by the distribution.
Discussion
Regional Seismogenic Environment and Source Characteristics
From the perspective of historical earthquakes, there were two Ms 6.4 earthquakes in 1986 and 2016 around the Lenglongling fault (Figure 1). Coulomb stress analysis results show that the 2016 Menyuan Ms 6.9 earthquake has a loading effect on the 2022 Menyuan Ms 6.9 earthquake (Li et al., 2022a; Peng et al., 2022). Judging from the trace of shallow fault, Menyuan Ms 6.9 earthquake occurred at the intersection of Tolaishan fault and Lenglongling fault (Figure 1B), which belongs to the compression-bending zone on the Qilian-Haiyuan fault zone, and is prone to stress concentration (Pan et al., 2022). Geological survey shows that although the Tuolaishan fault and Lenglongling fault are mainly left-lateral strike-slip faults, their slip rates are different: the eastern segment of the former is about 3–4 mm/a, while the latter is about 6.4 ± 0.7 mm/a (Guo et al., 2017). P-wave velocity structure shows that there is an obvious low-velocity zone below the earthquake source (Wang et al., 2022; Xu et al., 2022), and the eastern part of the Qilian Mountains is located at the region where crustal thickness changes dramatically. This makes the source region favorable to stress concentration (Wang et al., 2022).
Based on the co-seismic deformation field of the ascending and descending orbits obtained by InSAR, the fault slip distribution is inverted. Its focal mechanism shows that the Ms 6.9 earthquake was a sinistral strike-slip event with a small amount of thrust component. The average strike of the seismogenic faults was 108°, and the dip angle was 79°. The average rake is 4° and there is only one rupture center (Figure 6). Combining the spatial position of the maximum slip (Figure 6A) and the deformation coverage shown in the co-seismic deformation field (Figure 2D) and azimuth offset (Figure 4D) of T33 descending orbit, we can conclude that the seismogenic fault of this earthquake is the west part of the Lenglongling fault. It is belonged to a left-stepped echelon fault system, forming a tensional zone with the adjacent Tolaishan fault. Stress transfer between the faults is likely to occur, which may be the cause of surface rupture at the eastern end of Tolaishan fault (Pan et al., 2022).
To sum up, under the continuous northward expansion of the northeastern margin of the Tibetan Plateau, the shallow faults in the area around Menyuan are characterized by compressing and bending with inconsistent slip rates. In the deep crust, great differences of physical properties exist. In addition, the historical earthquake had a stress loading effect on the rupture. These conditions may jointly promote the strain accumulation in the western segment of Lenglongling fault and ultimately lead to the occurrence of this earthquake.
The Relationship Among Aftershock, Surface Rupture Traces and Co-seismic Slip Distribution
Figure 9 is the surface rupture trace delineated according to the obvious amplitude azimuth offset and the boundary between positive and negative displacement in the co-seismic deformation field (Figures 2B,D). Its overall shape is similar to the surface rupture distribution map shown by Peng et al. (2022). Coupled with the relocation of aftershocks, it is revealed that this earthquake produced obvious surface rupture. According to the aftershock distribution in Figures 9A,B the aftershocks in 2–9 days after the earthquake continued to expand in the SE direction along the surface rupture trace and are concentrated in the eastern section of the fault. Aftershocks are evenly distributed on both sides of the fault in the eastern segment. However, aftershocks are mainly distributed on the south side of the in the middle and western segment, indicating a possible deflection of the fault.
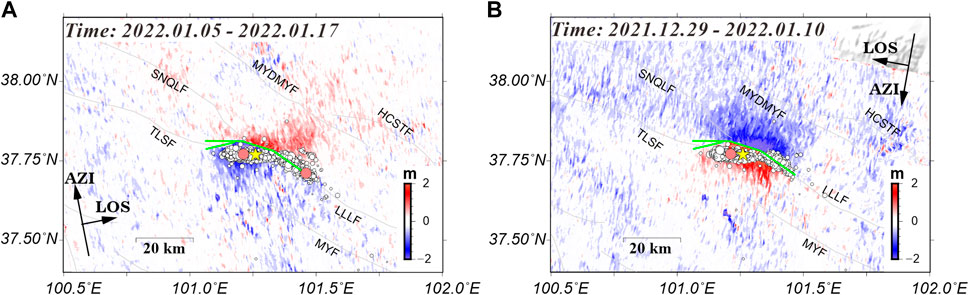
FIGURE 9. Surface rupture traces and aftershock distribution. (A) The background image is the azimuth offset of the ascending orbit, and the small white circles represent the aftershocks in 9 days after the mainshock (Yang et al., 2022); (B) The background image is the azimuthal offset of the descending orbit, the white small circles represent the aftershocks of 2 days after the earthquake (Yang et al., 2022). Green lines denote the seismogenic faults; the yellow star represents the epicenter of the mainshock; pink circles represent two aftershocks with magnitude≥ 5.0, which occurred on January 8 and 12 from left to right, respectively.
At the same time, there is an obvious varying dipping angles from east to west in the aftershock profiles (Figure 10). The fault plane is determined by surface rupture and distribution of aftershocks. We tested a new fault geometry that each section has a different dip angle (Supplementary Figure S6). However, the results are similar to those obtained with uniform 79° dip (Supplementary Figures S7, S8) and the correlation coefficient between the observed and the simulated deformation is also over 98%. So 79° may be the average of these dips.
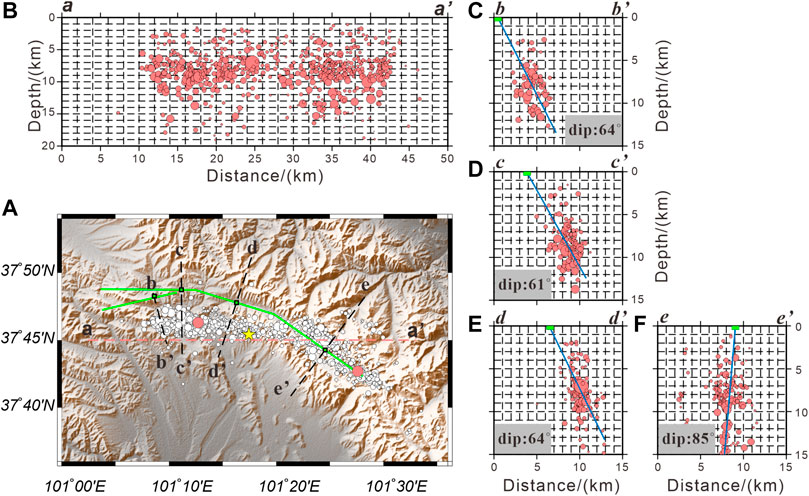
FIGURE 10. Dip angles determined from aftershock profiles of different fault sections. (A) Green lines, the yellow star and pink circles denote the seismogenic faults, the epicenter of the mainshock and two aftershocks with magnitude ≥ 5.0, respectively. (B–F) represent the five aftershocks profiles (aa’, bb’, cc’, dd’, ee’). Fault positions are marked by the green rectangles.
The aftershock (purple solid circles) is projected onto the seismogenic fault surface (Figure 11). The results show that the aftershock extended along the east and west sides from the source location within the depth range of 2–12 km. Meanwhile, the main shock depth (7.05 km) was close to the depth (5 km) where the maximum slip of the fault was 3.12 m. In addition, most of aftershocks occurred in the position where the co-seismic slip was small.
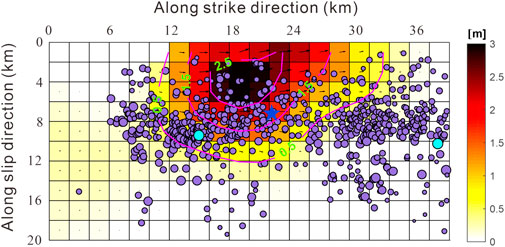
FIGURE 11. Fault slip model of the main fault and aftershocks. Red lines represent the contour of the slip; the blue star represents the mainshock location determined by Yang et al. (2022); the cyan circles denote two aftershocks with magnitude ≥ 5.0.
Therefore, the stress release associated with the aftershocks was either triggered by the mainshock or it was a compensation to the stress release associated with the mainshock.
Regional Seismic Hazard Assessment
In general, after an earthquake of moderate magnitude or above, the co-seismic dislocation of the fault will cause static co-seismic permanent deformation, which will change the Coulomb stress in the near and far field. the Coulomb failure stress change
where
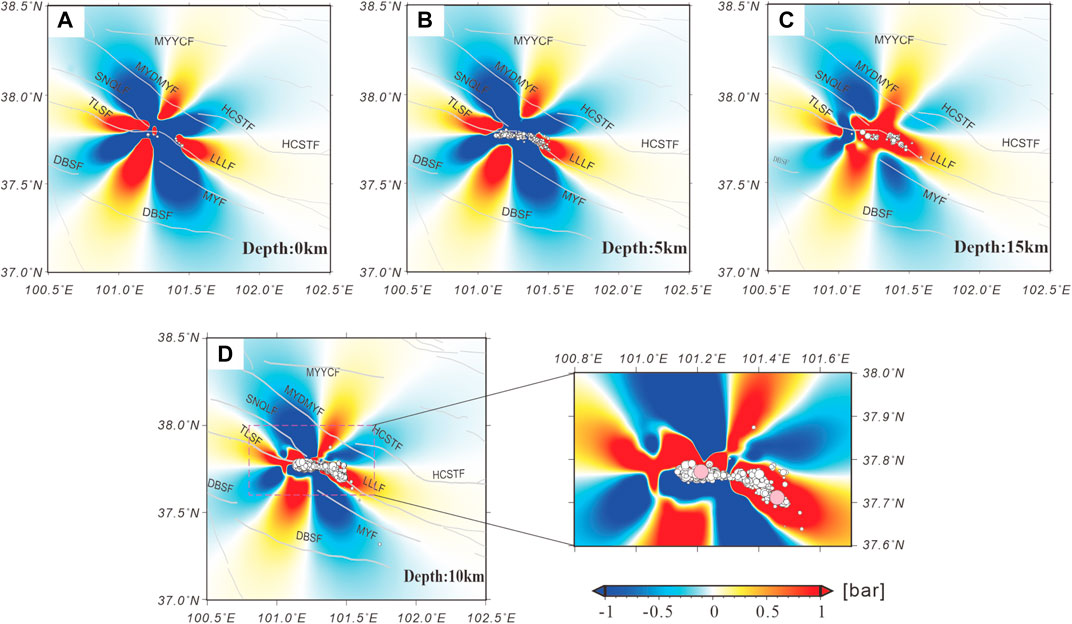
FIGURE 12. Regional co-seismic static Coulomb stress changes at different depths. (A–D) represent the changes of static Coulomb stress at depths of 0, 5, 15, and 10 km, respectively. White circles represent aftershocks in 10 days after the earthquake, including two M ≥ 5 aftershocks (pink circles) (Yang et al., 2022), which are located at the specified depth within 2 km up and down; the gray solid lines indicate the fault traces in this area.
The receiver fault was set as seismogenic fault itself (strike = 108°, dip angle = 79°, dip angle =4°) with a friction coefficient of 0.4 (King et al., 1994). The co-seismic Coulomb stress changes at the depths of 0, 5, 10 and 15 km are calculated respectively (Figure 12). The results show that the coulomb stress loading region is mainly distributed in the eastern segment of Tuolaishan fault and the western segment of Lenglongling fault, and a few parts of the Minyue-Damaying fault, Minyue-Yongchang fault and Daban Mountain fault in the NS direction. The static Coulomb stress change at 10 km shows that the largest aftershock (Ms 5.2) occurred in the positive area of the Lenglongling fault 4 days after the mainshock. The aftershock mainly migrated towards to SE direction (Fan et al., 2022; Yang et al., 2022), which may be caused by stress loading yielded by the mainshock.
There are many faults in this area, and the stress disturbance at the depth of 10 km on six faults is also calculated (Figure 13). The results show that some parts of the Lenglongling fault, the Tolaishan fault, the Sunan-Qilian fault, and the Minyue-Damaying fault are loaded, indicating high seismic risk in the future. At the same time, the whole Qilian-Haiyuan fault (Figure 1A), the Jinqianghe-Maomaoshan-Laohushan fault is located in the “Tianzhu Gap” between the present earthquake and the Haiyuan earthquake in 1920 (Gaudemer et al., 1995; Li et al., 2017), so the risk of these faults is also worth noting.
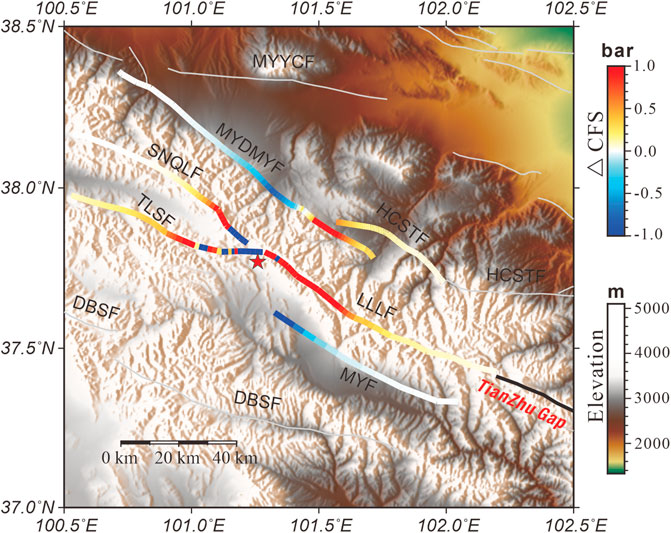
FIGURE 13. Static Coulomb stress changes on the surrounding faults at depth of 10 km. The colored lines represent the changes of the static Coulomb stress on the surrounding faults caused by the dislocation of the seismogenic fault, and the positive represent the stress loading. Fault parameters are from Xu et al. (2016). The calculation parameters are: Menyuan Fault (reverse fault, dip 45°, rake 90°); Lenglongling Fault (left-lateral, dip 90°, rake 0°); Tolaishan Fault (left-lateral, dip 90°, rake 0°); Sunan-Qilian Fault (reverse fault, dip 45°, rake 90°); Minyue-Damaying fault (reverse fault, dip 45°, rake 90°); Huangcheng-Shuangta Fault (reverse fault, dip 45°, rake 90°). Grey lines indicate the fault traces in this area; black line indicates the “Tianzhu Gap”, including the LLLF and the JQHF, MMSF, LHSF to its east. The background image is DEM.
Conclusion
In this paper, the co-seismic deformation field (LOS direction) of Menyuan Ms 6.9 earthquake in 2022 is obtained by D-InSAR technology. The co-seismic slip distribution of the fault is inverted by the Steepest Descent Method, and the disturbance of Coulomb stress changes on the surrounding faults is calculated and analyzed. This provides a reference for further research on the seismogenic property and seismic risk of the Qilian-Haiyuan fault. The main conclusions are as follows:
1) The seismogenic fault of the Menyuan Ms 6.9 earthquake is the western segment of Lenglongling fault, and surface deformation filed caused by the co-earthquake is 50 km by 40 km approximately. According to the distribution of ground deformation in the LOS direction and azimuth offsets of the ascending and descending orbits. The Menyuan Ms 6.9 earthquake can be identified as a sinistral strike-slip event.
2) The co-seismic slip distribution shows that the main seismogenic fault strike 108°, dip 79° and rake 4°. The slip is concentrated at a depth of 0–10 km, with an average slip of 0.48 m and the maximum slip of 3.12 m, which is located at a depth of about 5 km. The seismic moment is 1.28 × 10¹⁹ N·m, and the corresponding moment magnitude is Mw 6.67.
3) The results of Static Coulomb stress changes show that some parts of Lenglongling fault, Tolaishan fault, Sunan-Qilian fault, and Minyue-Damaying fault are loaded by the Menyuan Ms 6.9 earthquake. Risk of strong earthquake on these faults in the future deserves attention.
Data Availability Statement
Publicly available datasets were analyzed in this study. This data can be found here: https://search.asf.alaska.edu/#/.
Author Contributions
JL processed the SAR data and wrote the manuscript; CL contributed to the conception of the research and result analysis; CW contributed to invert the slip distribution and calculate the Coulomb stress changes; FC contributed the related code and beautified the figures; CY and YY helped the result analysis with constructive discussions.
Funding
This research was funded by the National Natural Science Foundation of China (Grants 4217040570, 41674059).
Conflict of Interest
The authors declare that the research was conducted in the absence of any commercial or financial relationships that could be construed as a potential conflict of interest.
Publisher’s Note
All claims expressed in this article are solely those of the authors and do not necessarily represent those of their affiliated organizations, or those of the publisher, the editors and the reviewers. Any product that may be evaluated in this article, or claim that may be made by its manufacturer, is not guaranteed or endorsed by the publisher.
Acknowledgments
Sentinel-1A SAR data are provided by the European Space Agency. The historical earthquake catalogue is provided by Zhang Zhiwei, Sichuan Earthquake Administration. SDM inversion program is provided by professor Wang Rongjiang. Aftershocks data is provided by Yang Hongfeng, The Chinese University of Hong Kong. GMT software is used to create most figures in the paper.
Supplementary Material
The Supplementary Material for this article can be found online at: https://www.frontiersin.org/articles/10.3389/feart.2022.948661/full#supplementary-material
References
Bagnardi, M., and Hooper, A. (2018). Inversion of Surface Deformation Data for Rapid Estimates of Source Parameters and Uncertainties: A Bayesian Approach. Geochem. Geophys. Geosyst. 19 (7), 2194–2211. doi:10.1029/2018GC007585
Chen, W., Qiao, X., Liu, G., Xiong, W., Jia, Z., Li, Y., et al. (2018). Study on the Coseismic Slip Model and Coulomb Stress of the 2017 Jiuzhaigou MS 7.0 Earthquake Constrained by GNSS and InSAR Measurements. Chin. J. Geophys. 61 (5), 2122–2132. doi:10.6038/cjg2018L0613
Decriem, J., Árnadóttir, T., Hooper, A., Geirsson, H., Sigmundsson, F., Keiding, M., et al. (2010). The 2008 May 29 Earthquake Doublet in SW Iceland. Geophys. J. Int. 181 (2), 1128–1146. doi:10.1111/j.1365-246X.2010.04565.x
Fan, L., Li, B., Liao, S., Jiang, C., and Fang, L. (2022). High-Precision Relocation of the Aftershock Sequence of the January 8, 2022, MS 6.9 Menyuan Earthquake. Earthq. Science 35 (2), 138–145. doi:10.1016/j.eqs.2022.01.021
Farr, T. G., and Kobrick, M. (2000). Shuttle Radar Topography Mission Produces a Wealth of Data. Eos Trans. AGU 81 (48), 583–585. doi:10.1029/EO081i048p00583
Fattahi, H., Agram, P., and Simons, M. (2017). A Network-Based Enhanced Spectral Diversity Approach for TOPS Time-Series Analysis. IEEE Trans. Geosci. Remote Sens. 55 (2), 777–786. doi:10.1109/TGRS.2016.2614925
Feng, W., He, X., Zhang, Y., Fang, L., Samsonov, S., and Zhang, P. (2022). Seismic Faults of the 2022 Mw6.6 Menyuan, Qinghai Earthquake and Their Implication for the Regional Seismogenic Structures. Chin. Sci. Bull. 617. doi:10.1360/tb-2022-015
Feng, W., and Li, Z. (2010). A Novel Hybrid PSO/simplex Algorithm for Determining Earthquake Source Parameters Using InSAR Data. Prog. Geophys. 25 (4), 1189–1196. doi:10.3969/j.issn.1004-2903.2010.04.007
Fukahata, Y., and Wright, T. J. (2008). A Non-linear Geodetic Data Inversion Using ABIC for Slip Distribution on a Fault with an Unknown Dip Angle. Geophys. J. Int. 173 (2), 353–364. doi:10.1111/j.1365-246X.2007.03713.x
Gaudemer, Y., Tapponnier, P., Meyer, B., Peltzer, G., Shunmin, G., Zhitai, C., et al. (1995). Partitioning of Crustal Slip between Linked, Active Faults in the Eastern Qilian Shan, and Evidence for a Major Seismic Gap, the ‘Tianzhu Gap’’, on the Western Haiyuan Fault, Gansu (China). Geophys. J. Int. 120 (3), 599–645. doi:10.1111/j.1365-246X.1995.tb01842.x
Goldstein, R. M., and Werner, C. L. (1998). Radar Interferogram Filtering for Geophysical Applications. Geophys. Res. Lett. 25 (21), 4035–4038. doi:10.1029/1998GL900033
Gray, A. L., Mattar, K. E., and Sofko, G. (2000). Influence of Ionospheric Electron Density Fluctuations on Satellite Radar Interferometry. Geophys. Res. Lett. 27 (10), 1451–1454. doi:10.1029/2000GL000016
Guo, P., Han, Z., Jiang, W., and Mao, Z. (2017). Holocene Left-Lateral Slip Rate of the Lenglongling Fault, Northeastern Margin of the Tibetan Plateau. Seismol. Geol. 39 (2), 323–341. doi:10.3969/j.issn.0253-4967.2017.02.005
Hanssen, R. F. (2001). “Stochastic Model for Radar Interferometry. Radar Interferometry. Data Interpretation and Error Analysis,” in Remote Sensing and Digital Image Processing (Dordrecht: Kluwer Academic Publishers) 2. doi:10.1007/0-306-47633-9
He, X., Zhang, Y., Shen, X., Zheng, W., Zhang, P., and Zhang, D. (2020). Examination of the Repeatability of Two Ms 6.4 Menyuan Earthquakes in Qilian-Haiyuan Fault Zone (NE Tibetan Plateau) Based on Source Parameters. Phys. Earth Planet. Interiors 299, 106408. doi:10.1016/j.pepi.2019.106408
He, Y., Wang, T., Fang, L., and Zhao, L. (2022). The 2020 Mw 6.0 Jiashi Earthquake: Coinvolvement of Thin-Skinned Thrusting and Basement Shortening in Shaping the Keping-Tage Fold-And-Thrust Belt in Southwestern Tian Shan. Seismol. Res. Lett. 93 (2A), 680–692. doi:10.1785/0220210063
Hu, J., Li, Z., Zhu, J., Ren, X., and Ding, X. (2010). Inferring Three-Dimensional Surface Displacement Field by Combining SAR Interferometric Phase and Amplitude Information of Ascending and Descending Orbits. Sci. China Earth Sci. 53 (4), 550–560. doi:10.1007/s11430-010-0023-1
Hua, J., Zhao, D., Shan, X., Qu, C., Zhang, Y., Gong, W., et al. (2021). Coseismic Deformation Field, Slip Distribution and Coulomb Stress Disturbance of the 2021 Mw7.3 Maduo Earthquake Using Sentinel-1 InSAR Observations. Seismol. Geol. 43 (3), 677–691. doi:10.3969/j.issn.0253-4967.2021.03.013
Ji, L., Liu, C., Xu, J., Liu, L., Long, F., and Zhang, Z. (2017). InSAR Observation and Inversion of the Seismogenic Fault for the 2017 Jiuzhaigou MS 7.0 Earthquake in China. Chin. J. of Geophys. 60 (10), 4069–4082. doi:10.6038/cjg20171032
King, G. C. P., Stein, R. S., and Lin., J. (1994). Static Stress Changes and the Triggering of Earthquakes. Bull. - Seismol. Soc. Am. 84 (3), 935–953. doi:10.1016/0148-9062(95)94484-2
Li, N., Zhao, Q., and Sun, H. (2018). InSAR Observation Results of the 2015 Tajikistan MS 7.4 Earthquake and its Tectonic Significance. J. Geodesy Geodyn. 38 (1), 43–47. doi:10.14075/j.jgg.2018.01.010
Li, Y., Gan, W., Wang, Y., Chen, W., Zhang, K., Liang, S., et al. (2017). Seismogenic Structure of the 2016 MS 6.4 Menyuan Earthquake and its Effect on the Tianzhu Seismic Gap. J. Geodesy Geodyn. 37 (8), 792829. doi:10.14075/j.jgg.2017.08.005
Li, Z., Gai, H., Li, X., Yuan, D., Xie, H., Jiang, W., et al. (2022a). Seismogenic Fault and Coseismic Surface Deformation of the Menyuan MS 6. 9 Earthquake in Qinghai, China. Acta Geol. Sin. 96 (01), 330–335. doi:10.19762/j.cnki.dizhixuebao.202212410.1111/1755-6724.14727
Li, Z., Han, B., Liu, Z., Zhang, M., Yu, C., Chen, B., et al. (2022b). Source Parameters and Slip Distributions of the 2016 and 2022 Menyuan,Qinghai Earthquakes Constrained by InSAR Observations. Geomatics Inf. Sci. Wuhan Univ. 47 (6), 887–897. doi:10.13203/j.whugis20220037
Liang, S., Zou, L., Liu, Y., and Zhang, X. (2022). Determination of the Focal Mechanism Solutions of the Earthquakes with MS ≥4.0 Occurred in the Mainland of China in January 2022. Prog. Earthq. Sci. 52 (02), 89–94. doi:10.19987/j.dzkxjz.2022-021
Liu, Y., Xu, C., and Wen, Y. (2019). InSAR Observation of Menyuan Mw5.9 Earthquake Deformation and Deep Geometry of Regional Fault Zone. Geomatics Inf. Sci. Wuhan Univ. 44 (7), 1035–1042. doi:10.13203/j.whugis20190069
Lu, D., Chen, K., and Xi, N. (2022). Earthquake Ground Motion Intensity Map of the Menyuan, Qinghai M6.9 Earthquake on 8 January 2022. Prog. Earthq. Sci. 52 (02), 57–59. doi:10.19987/j.dzkxjz.2022-019
Okada, Y. (1985). Surface Deformation Due to Shear and Tensile Faults in a Half-Space. Bull. Seismol. Soc. Am. 75 (4), 1135–1154. doi:10.1785/BSSA0750041135
Pan, J., Li, H., Marie- Luce, C., Liu, D., Li, C., Liu, F., et al. (2022). Coseismic Surface Rupture and Seismogenic Structure of the 2022 Ms 6.9 Menyuan Earthquake, Qinghai Province, China. Acta Geol. Sin. 96 (01), 215–231. doi:10.19762/j.cnki.dizhixuebao.2022125
Peng, Z., Liu-Zeng, J., Deng, Y., and Toda, S. (2022). Strong Earthquake Increases Seismic Hazard in Qinghai, China. Temblor. doi:10.32858/temblor.230
Rosen, P. A., Gurrola, E., Sacco, G. F., and Zebker, H. (2012). “The InSAR Scientific Computing Environment,” in 9th European Conference on Synthetic Aperture Radar (Nuremberg, Germany: EUSAR). Available at: https://ieeexplore.ieee.org/abstract/document/6217174, 730–733.
Shi, F., Shao, Z., Zhan, W., Ding, X., Zhu, L., and Li, Y. (2018). Numerical Modeling of the Shear Modulus and Stress State of Active Faults in the Northeastern Margin of the Tibetan Plateau. Chin. J. of Geophys. 61 (9), 3651–3663. doi:10.6038/cjg2018L0631
Shi, H., Zhang, Z., Chen, Y., He, P., and Yuan, S. (2019). Constraints on Coseismic Rupture Model of the 2017 MW6.3 Jinghe Earthquake from InSAR Data. J. Geodesy Geodyn. 39 (11), 1106–1111. doi:10.14075/j.jgg.2019.11.002
Toda, S., Stein, R. S., Sevilgen, V., and Lin, J. (2011). Coulomb 3.3 Graphic-Rich Deformation and Stress-Change Software for Earthquake, Tectonic, and Volcano Research and Teaching-User Guide. Reston, VA: U.S. Geological Survey. Open-File Report. doi:10.3133/ofr20111060
Wang, M., and Shen, Z. K. (2020). Present-Day Crustal Deformation of Continental China Derived from GPS and its Tectonic Implications. J. Geophys. Res. Solid Earth 125 (2). e2019JB018774. doi:10.1029/2019JB018774
Wang, Q., Xiao, Z., Wu, Y., Li, S., and Gao, G. (2022). The Deep Tectonic Background of the MS 6.9 Menyuan Earthquake on January 8, 2022 in Qinghai Province. Acta Seismol. Sin. 44 (2), 211–222. doi:10.11939/jass.20220010
Wang, R., Diao, F., and Hoechner, A. (2013). “SDM-A Geodetic Inversion Code Incorporating with Layered Crust Structure and Curved Fault Geometry,” in EGU General Assembly Conference Abstracts (Vienna, Austria: General Assembly European Geosciences Union) 15 2411. Available at: https://gfzpublic.gfz-potsdam.de/pubman/item/item_1975902.
Xu, C., Wang, J., and Xiong, W. (2018). Retrospection and Perspective for Earthquake Stress Triggering. Geomatics Inf. Sci. Wuhan Univ. 43 (12), 2085–2092. doi:10.13203/j.whugis20180149
Xu, X., Han, Z., Yang, X., Zhang, S., Yu, G., Zhou, B., et al. (2016). Seismic Tectonic Map of China and its Vicinity (In Chinese). Beijing, China: Earthquake Press. doi:10.12031/activefault.china.250.2016.db
Xu, X., Wu, X., Yu, G., Tan, X., and Li, K. (2017). Seismo-Geological Signatures for Identifying M≥7.0 Earthquake Risk Areas and Their Premilimary Application in Mainland China. Seismol. Geol. 39 (2), 219–275. doi:10.3969/j.issn.0253-4967.2017.02.001
Xu, Y., Guo, X., and Feng, L. (2022). Relocation and Focal Mechanism Solutions of the MS 6.9 Menyuan Earthquake Sequence on January 8, 2022 in Qinghai Province. Acta Seismol. Sin. 44 (2), 195–210. doi:10.11939/jass.20220008
Yang, H., Wang, D., Guo, R., Xie, M., Zang, Y., Wang, Y., et al. (2022). Rapid Report of the 8 January 2022 MS 6.9 Menyuan Earthquake, Qinghai, China. Earthq. Res. Adv. 2, 100113. doi:10.1016/j.eqrea.2022.100113
Yu, C., Li, Z., Penna, N. T., and Crippa, P. (2018). Generic Atmospheric Correction Model for Interferometric Synthetic Aperture Radar Observations. J. Geophys. Res. Solid Earth 123 (10), 9202–9222. doi:10.1029/2017JB015305
Yu, P., Qiao, X., Xiong, W., Chen, W., Nie, Z., Wang, D., et al. (2020). Source Model for the M W 6.0 Earthquake in Jiashi, China on 19 January 2020 from Sentinel-1A InSAR Data. Earth Planets Space 72 (1), 1–11. doi:10.1186/s40623-020-01300-4
Zhang, G., Qu, C., Shan, X., Zhang, G., Song, X., Wang, R., et al. (2011). The Coseismic InSAR Measurements of 2008 Yutian Earthquake and its Inversion for Source Parameters. Chin. J. of Geophys. 54 (11), 2753–2760. doi:10.3969/j.issn.0001-5733.2011.11.005
Zhang, P., Deng, Q., Zhang, G., Ma, J., Gan, W., Min, W., et al. (2003). Active Tectonic Blocks and Strong Earthquakes in the Continent of China. Sci. China Ser. D Earth Sci. 46, 13–24. doi:10.1360/03dz0002
Keywords: Menyuan earthquake, D-InSAR, deformation filed, slip distribution, coulomb stress
Citation: Liao J, Liang C, Wang C, Cao F, Ye C and Yang Y (2022) Source Model for the 2022 Qinghai Menyuan Ms 6.9 Earthquake Based on D-InSAR. Front. Earth Sci. 10:948661. doi: 10.3389/feart.2022.948661
Received: 20 May 2022; Accepted: 23 June 2022;
Published: 14 July 2022.
Edited by:
Chen Yu, Newcastle University, United KingdomReviewed by:
Chuanjin Liu, China Earthquake Administration, ChinaYongsheng Li, Ministry of Emergency Management, China
Alex Ng, Guangdong University of Technology, China
Ziyadin Cakir, Istanbul Technical University, Turkey
Copyright © 2022 Liao, Liang, Wang, Cao, Ye and Yang. This is an open-access article distributed under the terms of the Creative Commons Attribution License (CC BY). The use, distribution or reproduction in other forums is permitted, provided the original author(s) and the copyright owner(s) are credited and that the original publication in this journal is cited, in accordance with accepted academic practice. No use, distribution or reproduction is permitted which does not comply with these terms.
*Correspondence: Chuntao Liang, liangct@cdut.edu.cn