Systematic shift in plume bending direction at Grotto Vent, Main Endeavour Field, Juan de Fuca Ridge implies changes in venting output along the Endeavour Segment
 Karen G. Bemis
 Michael Zhao1
  Joshua Sacker
 Dax C. Soule
- 1Rutgers, The State University of New Jersey, New Brunswick, NJ, United States
- 2Queens College (CUNY), New York City, NY, United States
- 3The Graduate Center, The City University of New York, New York City, NY, United States
Analysis of the time-dependent behavior of the buoyant plume rising above Grotto Vent (Main Endeavour Field, Juan de Fuca Ridge) as imaged by the Cabled Observatory Vent Imaging Sonar (COVIS) between September 2010 and October of 2015 captures long term time-dependent changes in the direction of background bottom currents independent of broader oceanographic processes, indicating a systematic evolution in vent output along the Endeavour Segment of the Juan de Fuca Ridge. The behavior of buoyant plumes can be quantified by describing the volume, velocity, and orientation of the effluent relative to the seafloor, which are a convolved expression of hydrothermal flux from the seafloor and ocean bottom currents in the vicinity of the hydrothermal vent. We looked at the azimuth and inclination of the Grotto plume, which was captured in three-dimensional acoustic images by the COVIS system, at 3-h intervals during October 2010 and between October 2011 and December 2014. The distribution of plume azimuths shifts from bimodal NW and SW to SE in 2010, 2011, and 2012 to single mode NW in 2013 and 2014. Modeling of the distribution of azimuths for each year with a bimodal Gaussian indicates that the prominence of southward bottom currents decreased systematically between 2010 and 2014. Spectral analysis of the azimuthal data showed a strong semi-diurnal peak, a weak or missing diurnal peak, and some energy in the sub-inertial and weather bands. This suggests the dominant current generating processes are either not periodic (such as the entrainment fields generated by the hydrothermal plumes themselves) or are related to tidal processes. This prompted an investigation into the broader oceanographic current patterns. The surface wind patterns in buoy data at two sites in the Northeast Pacific and the incidence of sea-surface height changes related to mesoscale eddies show little systematic change over this time-period. The limited bottom current data for the Main Endeavour Field and other parts of the Endeavour Segment neither confirm nor refute our observation of a change in the bottom currents. We hypothesize that changes in venting either within the Main Endeavour Field or along the Endeavour Segment have resulted in the changes in background currents. Previous numerical simulations (Thomson et al., J. Geophys. Res., 2009, 114 (C9), C09020) showed that background bottom currents were more likely to be controlled by the local (segment-scale) venting than by outside ocean circulation or atmospheric patterns.
Introduction
The circulation of hydrothermal fluids near mid-ocean ridge spreading centers is an important process linking the geochemical nutrients of the lithosphere to the chemical, geophysical and biologic processes of the hydrosphere and biosphere (Spietz et al., 2018; Keller et al., 2017; German and Von Damm, 2003). Observations of hydrothermal vents and their plumes have resulted in a much deeper understanding of how life is linked to solid Earth processes both on Earth and potentially elsewhere in the cosmos (Lang et al., 2010). Cabled observatories (Delaney et al., 2003) have created a paradigm shift in how we study these hydrothermal systems by providing power and bandwidth for entire suites of instruments that can monitor a myriad of geophysical signals at previously unachievable levels of temporal resolution. This sea change has dramatically expanded what is known about these systems and created a feedback between the evolution of our understanding and the types of multi-disciplinary questions we can explore. The end goal is to create a capacity for predictive systems modeling. Here we present an analysis of the time-dependent behavior of buoyant plume(s) collected using the Cabled Observatory Vent Imaging Sonar (COVIS) between September 2010 and October of 2015 along the Endeavour Segment of the Juan de Fuca Ridge at the Main Endeavour vent field, Lat: 47°56.9389′ N, Lon: 129°05.9123’ W, Depth ∼2200 m (Figure 1). Over that period, we observe long term time-dependent changes in the direction of hydrothermal discharge from the Grotto hydrothermal vent that are independent of broader oceanographic processes and suggest a systematic evolution in vent output.
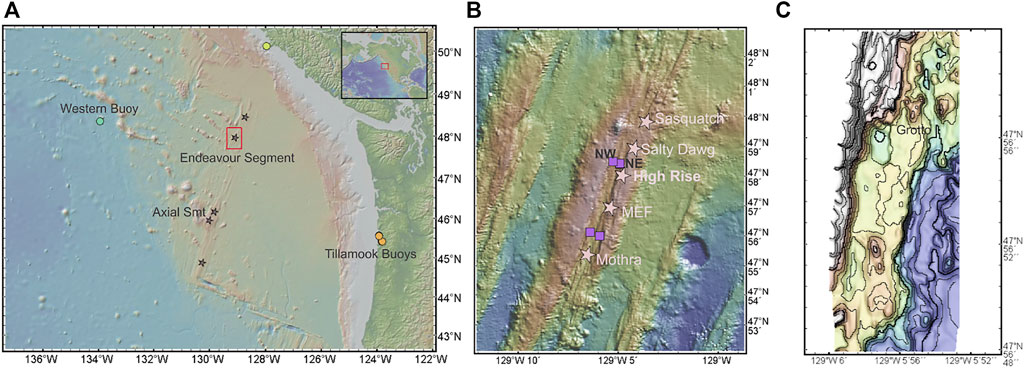
FIGURE 1. (A) Map shows location of the study site, the Endeavour Segment, in relation to overall geography of the Pacific Northeast. Also shown are the location of the buoy data and SSH data used in this study. (B) Closer map of the Endeavour Segment shows the location of the vent fields and the moorings, whose current data is used. (C) Close up map of the Main Endeavour Field shows the location of Grotto Vent. The acoustic imaging sonar, COVIS, was imaging the plumes that rise above Grotto. Specific longitude, latitude locations are reported in Table 1.
Background
The Endeavour Segment of the Juan de Fuca Ridge is an intermediate spreading ridge located 250 km offshore of Vancouver Island in the Northeast Pacific Ocean (Figure 1A). As an Integrated Study Site for the Ridge 2000 program, the Endeavor segment is among the best studied areas of seafloor on Earth (see references in Clague et al., 2020). The central portion of the rift is a topographic high and is cut by a 100- to 200-m-deep and 1 km wide axial valley that hosts five major hydrothermal vent fields whose spacing along strike (Delaney et al., 1992; Kelley et al., 2012) is a reflection of the subsurface convection systems (Kelley et al., 2001). Depths for the segment range from 2,100 to 2,800 m and the ridge flanks are characterized by 300-m-high ridge parallel abyssal hills and a 200 m high plateau that has been shown to overlie thickened crust (Glickson et al., 2007; Karsten et al., 1986; Soule et al., 2016). Within the rift, the seafloor morphology is rough and dominated by pillow lava deposits and sulfide towers.
Black smokers are where the lithosphere and biosphere are linked through the hydrosphere and are responsible for a large portion of the flux of heat (German and Von Damm, 2003) and material (Bickle and Elderfield, 2013) that is transferred from the crust to the ocean. As cold-water seeps down through cracks and fissures in the very porous crust, it is warmed by the high geothermal gradient and interaction with the magmatic processes that feed the spreading center (German and Von Damm, 2006 from Bemis et al., 2015). Fluid flow is then focused along faults within the axial valley hydrothermal fields (Kelley et al., 2012) and discharge can either be in the form of high temperature water through chimneys or as lower temperature fluid escaping through mounds, faults and other sea floor cracks. These hot springs are driven by the geothermal energy of the ridge magmatic system (Ondreas et al., 2018) and are a key source for the flux of nutrients and carbon dioxide into the global ocean (e.g., Tolstoy 2015; Huybers and Langmuir, 2017; Le Voyer et al., 2019). This superheated fluid becomes rich in dissolved minerals and gasses that convect back to the surface where the dissolved metals precipitate and the dissolved gasses are entrained into the water column as a hydrothermal plume.
As black smoker plumes rise, they interact with the ambient ocean. In particular, their rise speeds and patterns of dispersal are influenced by the oceanographic conditions near the seafloor. Near-surface currents in the NE Pacific are expected to flow to the east and northeast due to the Eastward North Pacific Current (Strub and James, 2002a; Strub and James, 2002b). However, due to the complex topography associated with the Juan de Fuca Ridge, the background tides and currents of the open ocean are likely modified (Burd and Thomson, 2019). In particular, the interaction of semidiurnal tides with the abrupt ridge topography is expected to generate passive vertical displacements of up to 100 m based on earlier current meter measurements in the area (Mihaly et al., 1998) and on numerical simulations in similar settings (Xu and Lavelle 2017). Low-frequency currents are likely also modified by ridge topography and may result in passive advection of hydrothermal plumes. Significant horizontal excursions (1–2 km in both along and cross ridge directions) may result from energetic counterclockwise frequency bands in the weather band arising from trapped waves over the ridge (Cannon and Thomson 1996). However, based on modeling by Thomson et al., 2009, major shifts in ocean currents outside the rift valley, such as dominantly northward flow to dominantly southward flow, have minimal impact on flow within the rift valley.
The physical behavior of hydrothermal plumes can be quantified by describing the volume, velocity and orientation of the effluent relative to the seafloor (Rona et al., 2006). The geometry and orientation of the plume is the convolved expression of hydrothermal flux from the seafloor and ocean bottom currents in the vicinity of the hydrothermal vent. In a stagnant ocean (no bottom currents), the plumes would rise purely vertically until reaching a level of neutral buoyancy and spreading laterally. But in the presence of ocean tides, the rising plumes are pushed sideways with the direction of offset shifting with the tides. Numerical simulations suggest a non-linear response, but confirm that plume bending directions reflect current/tide directions (Lavelle et al., 2013). The higher the exit velocity of the effluent, the more momentum the fluid has in the vertical direction and thus the less susceptible it is to bending. In addition, the level of lateral spreading, or effective neutral buoyancy, is usually reduced as the ratio of bottom current speed to plume rise rate increases (Lavelle et al., 2013; Burd and Thomson, 2019; Adams and Di Iorio 2021). Concurrently, the plume influences the surrounding ocean: as plumes rise from the major vents, their entrainment of seawater generates an inward current. The combination of such currents from each of the major vents in each of the major vent fields controls the net flow pattern. Therefore, if venting intensity decreases at one site, such as MEF, and increases at another, such as High Rise, the net flow at MEF could shift northwards. In this study, we characterize the hydrothermal plume associated with the Grotto hydrothermal vent by creating acoustic images of the hydrothermal plumes that are used to measure vertical velocity, volume flux, and heat flux and characterize changes in plume direction and bending.
Motivation
Previous observations of hydrothermal plumes in the Main Endeavour Field identified the influence of tides on plume behavior. Rona et al. (2006) observed changes in plume bending direction over a 24 h interval that were consistent with a semi-diurnal tidal cycle in bottom current direction and speed (Figure 2 shows a more recent example of a 24 h plume imaging record). Other studies (Burd and Thomson, 2019) have identified a neutrally buoyant plume between 1900–2,100 m depth that varies in depth during the late summer and fall, suggesting a change in the balance between plume rise rate and bottom current speeds.
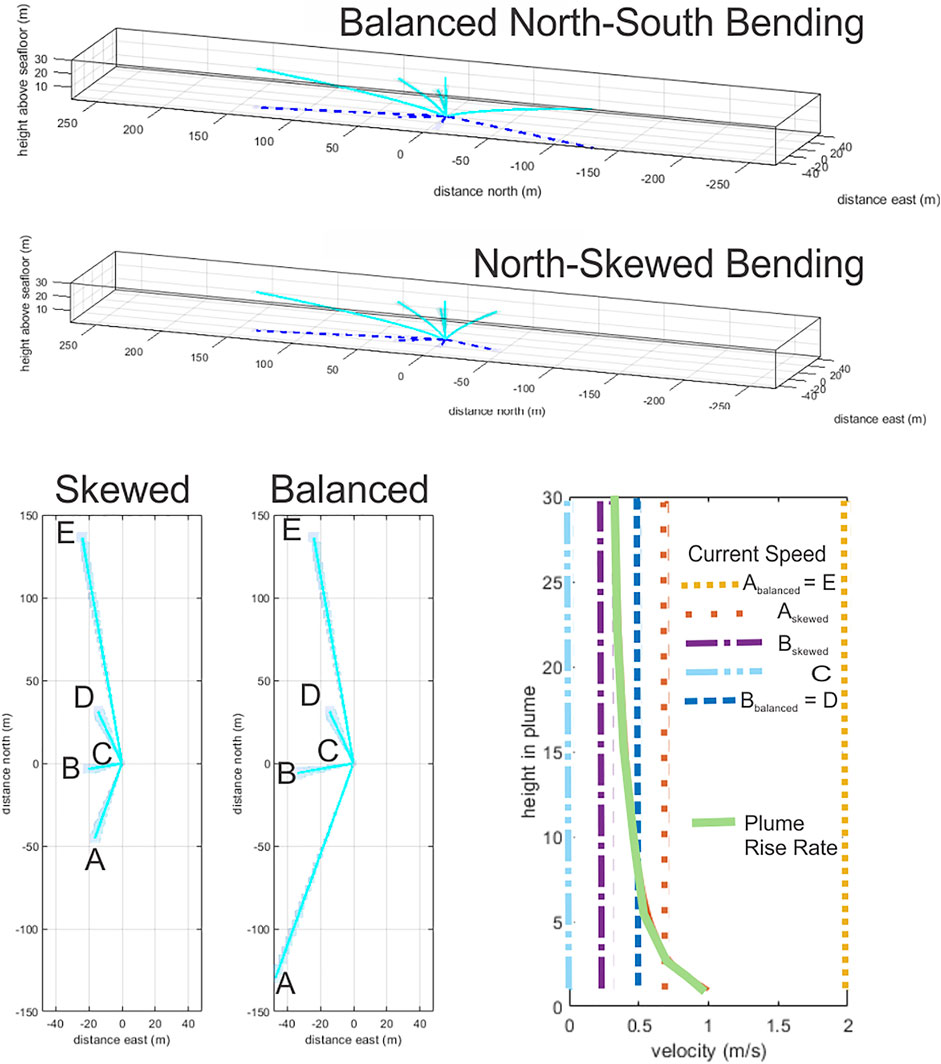
FIGURE 2. One day (20 March 2014) of COVIS plume images illustrates the range of plume geometries observed. Images were captured every 3 h and processed to show acoustic backscatter from the plume (green at –85 dB, blue at –75 dB, purple at -65 dB and red at –55 dB). Seafloor is based on bathymetry from Clague et al. (2008) and shown as an opaque brown-to-yellow surface (colors indicate elevation as given in colorbar). Units along all three axes are the component distance from the base of COVIS in meters.
This study seeks to use a long-term (5 years) record of plume bending to deconvolve the influence of changes in local and regional hydrothermal flux from changes in the background ocean currents. In particular, 5-years of observatory and remote sensing data (see Table 1 for a list of data used) will be combined to identify patterns and trends in ocean bottom currents within the Endeavour rift valley on the Juan de Fuca Ridge, identify the extent to which these patterns and trends may reflect trends in surface weather, and suggest alternative explanations of the observed changes.
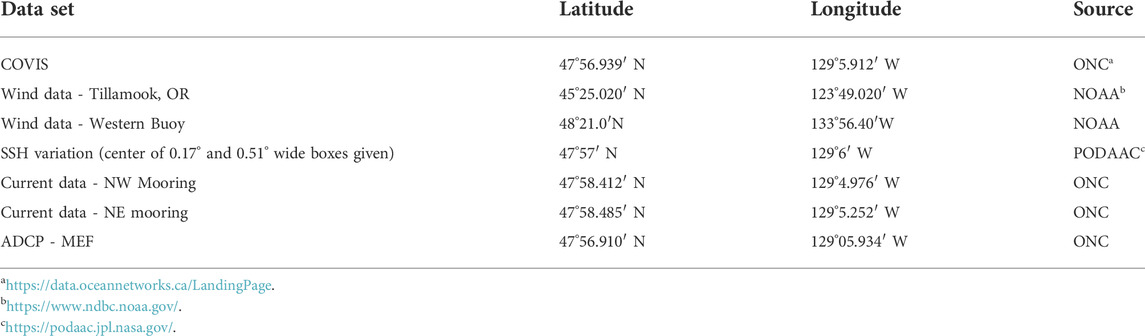
TABLE 1. Data set summary.
This study will show that plume bending at Grotto vent underwent a systematic shift in mean direction indicative of a shift in net background flow. Our observations suggest that monitoring one plume at Grotto vent within the Main Endeavour Field provides some insights into venting along the entire Endeavour Segment. Acoustic monitoring of even single vents has the potential to provide larger scale implications for segment or seamount scale venting changes.
Methods
The Cabled Observatory Vent Imaging Sonar (COVIS) images hydrothermal plumes using either plume imaging, diffuse or Doppler modes. COVIS was deployed in the Main Endeavour Field, Juan de Fuca Ridge, from 2010 to 2015 and oriented to image the plumes above Grotto Vent (Figure 1). In plume imaging mode, COVIS projects directed sound energy into the water column and, as the acoustic signal encounters contrasts in impedance related to either the properties of the water, the presence of suspended particulate matter (see references in Bemis et al., 2015), or the seafloor, a portion of the acoustic energy is reflected back to the instrument and a portion is refracted through the water column. The greater the impedance contrast or the more coherent the interface, the more energy is reflected back to the source. The more irregular the surface, the more energy is scattered, resulting in a diffuse return of lower amplitude. The backscattered signal from the plume primarily reflects turbulent variations in water temperature (see Xu et al., 2017 and references therein); thus, the variations in returned energy from the water column can be interpreted in terms of the plume intensity and its mixing with ambient seawater (Figure 2 provides an example series of plume images).
COVIS data can be accessed through Ocean Networks Canada (ONC), which supplies power and bandwidth to the instrument using fiber optic cables. Interactive access is available through the Oceans 2.0 Data Search1 portal or the Application Programing Interface (API) interface, which supports direct data access using Python, MATLAB or R. COVIS data can be downloaded as either raw data or already-gridded data. The raw data consists of files containing overall metadata, individual ping metadata, and individual ping binary data. This data is post-processed to apply calibrations and filters, perform beamforming, and transform the product into gridded values that represent the distribution of backscattering strength in units of 1/m (see Xu et al., 2013, 2014 for details). Following methods presented previously (see Bemis et al., 2002; Rona et al., 2002; Rona et al., 2006), our software (Matlab-based) then searches a directory for COVIS gridded data files, and for each file, the code steps through the horizontal grid, slice by slice from a preset minimum level to a preset maximum level. At each level, non-linear regression is used to fit a 2D Gaussian function to a region of interest using the local maximum as a seed point. The peak of the fit is then used to estimate the centerline location, centerline intensity values, and plume width. The centerline coordinates and some measures of venting intensity are stored and accessed by the angles code which reads each centerline data file and fits a line to the centerline coordinates. By estimating the exterior plume geometry and then calculating points along a centerline we are able to estimate a basepoint and vector along with fitting errors, inclination and azimuth.
The current project uses Python to import the angles code output, create visualizations, and analyze variations in bending over time. The Python module scipy. optimize.curve_fit was used to create a bimodal Gaussian model of plume direction for each year. The bimodal Gaussian model is simply the sum of two separate Gaussian models.
Results—primary observation
Visual analysis of the plume bending azimuth shows a strong shift in direction of bending between October 2010 and October 2014: plume bending directions shifted from highly variable in October 2010 to mostly northward in October 2011 and October 2012 to entirely northward in October 2013 and October 2014 (Figure 3). Due to limited data for 2010 and 2011 (COVIS was deployed in September of 2010 and the ONC network was down from the end of October 2010 to late September 2011), comparisons of annual distributions are less informative (Figure 4) but show a similar trend.
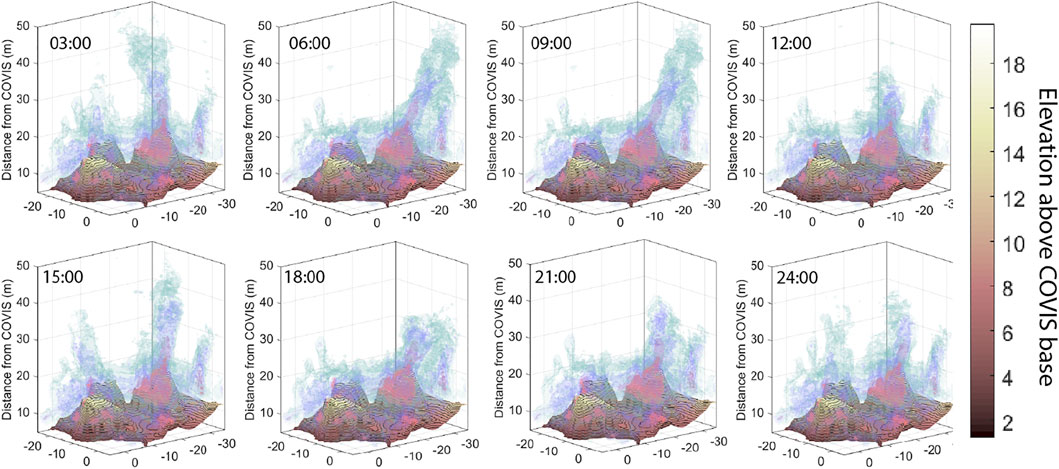
FIGURE 3. Comparison of plume bending azimuth for 1 month (October) from 2010 to 2014. Each subplot shows a histogram of all plume observations for that year using 2° bin widths and normalizing to the total number of observations in a year. The predominant direction shifts from variable (2010) to northward flow with significant southward flow (2011–2012) to almost entirely northward flow (2013–2014).
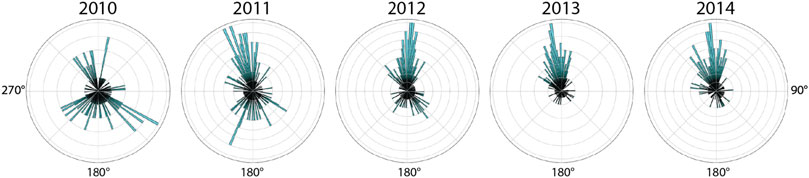
FIGURE 4. Comparison of plume bending azimuth for the full record (1 month in 2010, 3 months in 2011, 12 months for the rest) in each year. Azimuths are binned separately for inclination ranges of <5° (yellow), 5–10° (green), 10–15° (aqua), and >15° (blue). Separate plots for each range (middle row) confirm that the predominant direction in total histograms (top row) is controlled by the most bent plumes.
Looking at a breakdown of azimuths by inclination, the North-South balance of bending appears to be determined by the most bent (inclination>15°) plumes, which tend to be dominantly due north. Lightly and very slightly bent plumes (inclinations 10–15° and 5–10°) change from mixed directions (2010–2012) to largely northwest (2013–2014). Near vertical plumes do not (as expected since the direction of a near vertical plume is ill defined) show a dominant direction in any year. The distribution of inclinations does not vary significantly between years, in part due to the limited spatial extent of the observational data. Overall, removing low inclination data from the azimuth distributions has little effect on the primary directions observed, which reflect the directions of strongest bending.
To quantify the above visual analysis we used a non-linear least squares regression. Using curve-fit from the Python scipy package, we modeled the distribution of azimuth data first rotating all the distributions by 280° counterclockwise to center the peaks within the distribution range and then fitting a bimodal Gaussian model with error to the azimuthal values. With the exception of 2014, two distinct peaks are found by the fitting routine. Figure 5A presents the rotated histograms with the fitted curve for each year while Figure 5B combines the fitted curves to compare across the 5 years Table 2 reports the actual peak values. Figure 5C shows how the peaks change over time.
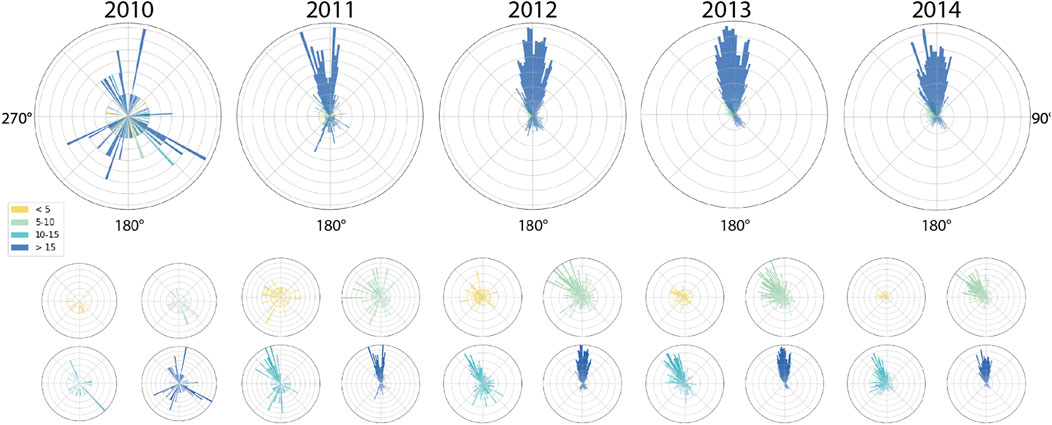
FIGURE 5. (A) Rotated histograms for plume bending azimuths with model curve showing fit to bimodal Gaussian. The model did not find a second peak in the 2014 data. (B) Combined model curves show the progressive decrease in size of the second peak, suggesting bottom current direction is increasingly influenced by a background mean current that flows northwards (280 degrees off the depicted peak1 direction). (C) Plotting the peak locations (to get true direction, add 280°, and subtract 360° if necessary), peak amplitude, and peak widths suggests that the peak bending directions are consistent but the distribution between peak one and peak two shifts from balanced (equal amplitude) to dominantly peak one between 2010 and 2011. Peak two amplitude continues to decay into 2014 (when there is no longer any evidence of the secondary peak).
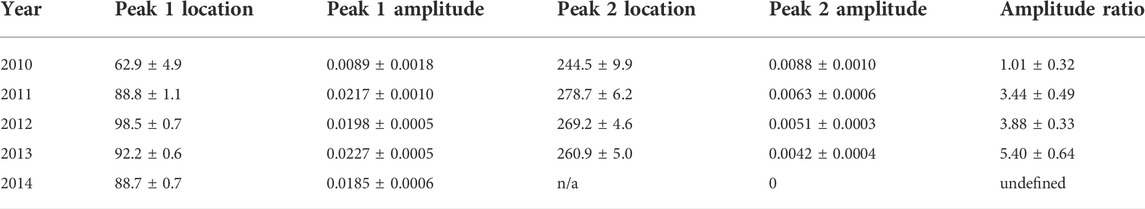
TABLE 2. Bimodal gaussian model parameter estimations.
Between 2010 and 2014, the distribution of bending directions shifted from a more balanced north to south oscillation to a predominantly northward bending (Figure 5). That is, although there is still a substantial tidal signal in 2014, based on a significant semi-diurnal peak found by spectral analysis, the bending direction rarely tends southwards. This suggests a systematic change in bottom current direction around Grotto vent from 2010 to 2014.
Limited direct measurements of bottom currents exist. In particular, four moorings with current meters were planned to bracket MEF, but only one (NE) had viable current data in October 2010 to September 2011, only two (NE, NW) had data from September 2011 to July 2012, and none had data during the remainder of COVIS’s deployment. The NE and NW moorings are located just north of High Rise vent field, the next most northern vent field from MEF along the Endeavour Segment. A local ADCP was installed in MEF in July 2013, which recorded near bottom currents in the center of MEF, just south of Grotto.
Though there is insufficient data to directly verify or definitively disprove that bottom currents changed, Figure 6, suggests that systematic variations are likely. Currents at NE005 shifted from being balanced somewhat northwards in 2010 to being balanced somewhat southwards in 2012. Currents at NW005 were dominantly southwards over 2011–2012. Currents above the central MEF (ADCP at 15 m above bottom) shifted to a stronger southward dominance over 2013 to 2014.
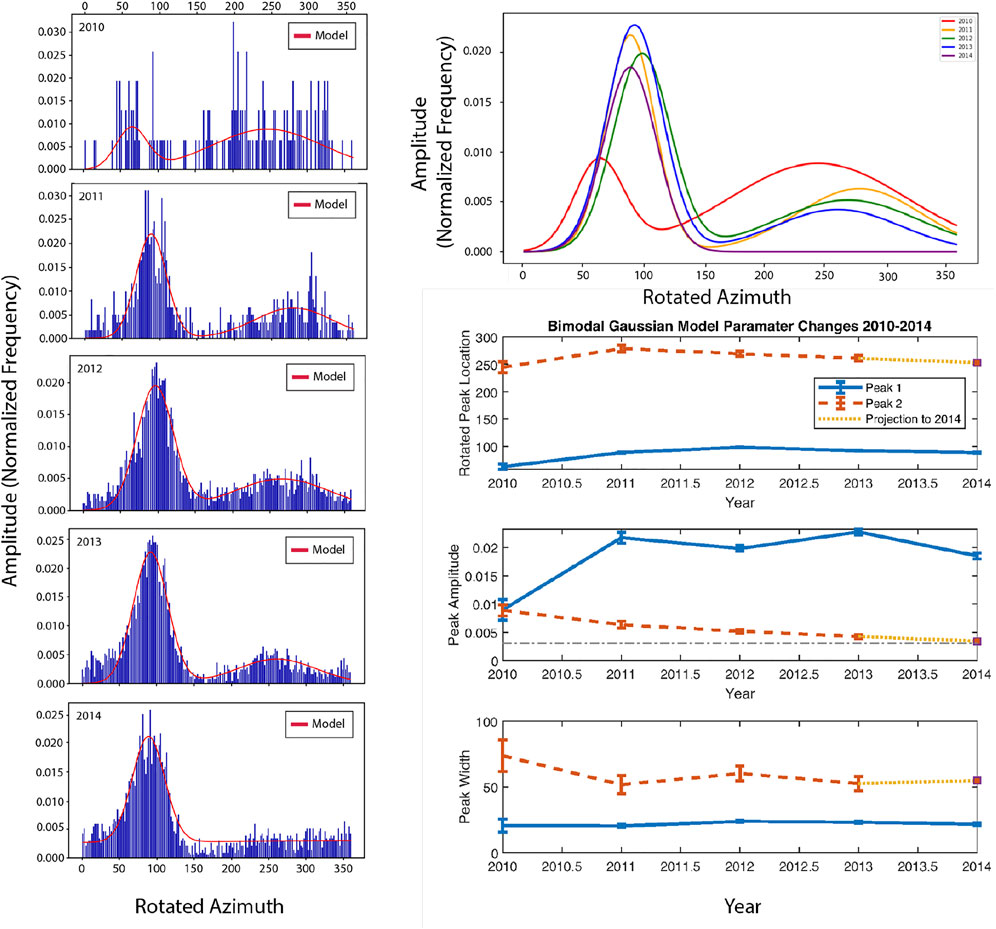
FIGURE 6. Annual polar histograms of the current or plume direction for NE005 (top), NW005 (bottom), COVIS (center panel), and the MEF ADCP at 21 m. From left to right, all valid data for the years 2010 through 2014 are plotted. For each polar histogram, North is at the top and the bin size is 2°. The NE current meter at 5 m above bottom (NE005) shows a north-south trend in currents consistent throughout 2010–2012. The NW current meter at 5 m above bottom (NW005) shows a consistently southward current from 2011 to 2012. The MEF ADCP at 21 m above bottom shows a mixed, but dominantly southward trend in 2014–2015. In contrast, the COVIS plume data is predominantly of a northward inclination from 2011 to 2014. Both moorings are about 2 km north of COVIS. The MEF ADCP is south of COVIS in the central plain of MEF, about 60 m southwest of COVIS. See text for discussion of data availability.
Discussion
We have asserted that the observation of a systematic and gradual change in plume bending from 2010 to 2015 suggests a systematic and gradual change in the bottom current direction around Grotto vent between 2010 and 2015. Here we explore both what alternative explanations there could be as well as what could cause such a change in the bottom current direction.
The factors controlling the amount of bending and the direction of bending of the rising (buoyant) plume are the vertical velocity within the plume (its rise rate), the bottom current speed, and the bottom current direction (Figure 7). The vertical velocity in the plume is a function of its initial velocity on discharge, the amount of momentum generated by the buoyancy of the plume, and the height above the vent. With no current, plumes rise vertically until reaching a level of neutral buoyancy. Horizontal bottom currents both displace the plume sideways and increase the plume’s entrainment of ambient seawater, which results in a faster convergence to neutral buoyancy.
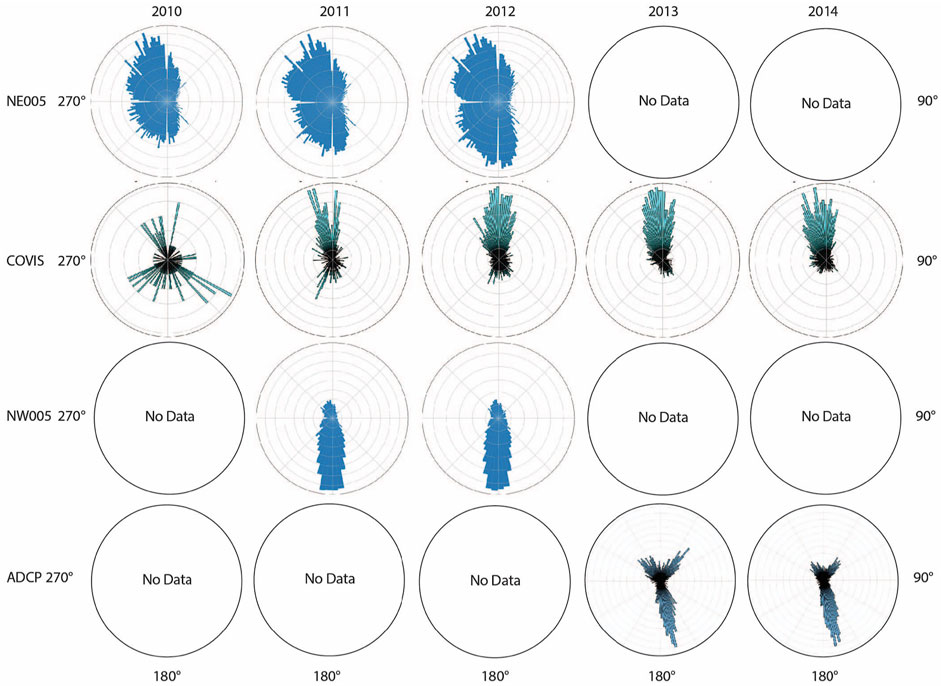
FIGURE 7. A simple model to illustrate plume response to steady currents. Plumes rise vertically in a stagnant ocean (C) but are deflected northwards by north-flowing currents (D,E) or southward by south-flowing currents (B,A). Eastward deflection reflects the eastward component expected in the local oscillating tidal currents. The degree of deflection depends on the ratio of current speed to plume rise rate.
As a buoyant plume rises, it entrains ambient seawater, creating an inward current. The net current generated by a vent field can be of a similar magnitude as the tidal currents, as the inward current is proportional to the vertical rise rates (Turner 1986). Further, the narrow rift valley of Endeavour constrains the flow of these venting-generated currents to run in the roughly north-south direction of the ridge.
As described in the introduction, the bottom currents on the Endeavour Segment are a complex mix of tidal currents, other open ocean waves, currents generated by the entrainment of fluids into the various vent sites, and interactions of all these with the ridge topography. The challenge here is to discern which of these factors-changes in the local plume, changes in other vents, or changes in the open ocean-could have generated the observed changes in plume bending at Grotto.
Processes that potentially impact the apparent bottom current direction near Grotto vent and/or more broadly in the Main Endeavor Field include.
• Changes in venting intensity at Grotto.
• Changes in venting intensity at other vents in the Main Endeavour Field.
• Changes in venting intensity at other sites (vent fields) along the Endeavour Ridge.
• Changes in the ambient ocean currents due to internal waves generated by any of mesoscale ocean eddy passages, atmospheric storms, or tide-topographic interactions.
The next part of the discussion will consider the possibilities and impacts of local changes in venting intensity, changes in bottom current driven by ridge scale changes in venting distribution, and changes in major ocean currents outside of Endeavour.
Considering potential for local changes in venting intensity
Changes in venting intensity impact apparent bottom currents in two ways: response of the plume to bottom currents and changes in the bottom currents. Here we will consider the first (the later will be considered in the next subsection), As the intensity of venting increases, the bending produced by local bottom currents is reduced. However, while bending is reduced (so the observed inclination will be reduced) as the venting intensity increases (because the net vertical velocity increases), we would not expect the observed azimuth of bending to change significantly with venting intensity changes. Because we are measuring the bending of the Grotto plume rather than the velocity of the bottom currents directly, we need to account for the effects of changes in venting intensity on the bending. To assess the likelihood of significant changes in the venting intensity at Grotto, we looked at both the backscatter intensity in the data set from which the plume bending was estimated (Figure 8) and an estimate of heat flux and vertical velocity (Xu et al., 2014; Xu, 2015) from a complimentary but independent Doppler-based dataset (both data sets are from COVIS but measured independently). No significant changes in backscatter intensity were observed for the Grotto plume, suggesting no change in venting intensity. Reviewing Xu (2015), there was a minor decrease in vertical rise rates over the 2011–2015 time period. No regression of the heat flux estimates was made over that time period. Also, Xu (2015) presents a detailed analysis of the ADCP data in comparison with the COVIS data which compliments this work but does not offer any resolution as to why the apparent current directions differ. Consistently, we also did not observe any significant changes in the range of inclinations of the Grotto plume over 2010–2014. Therefore, changing vent intensity of Grotto cannot be used to explain the changes in plume bending azimuth.
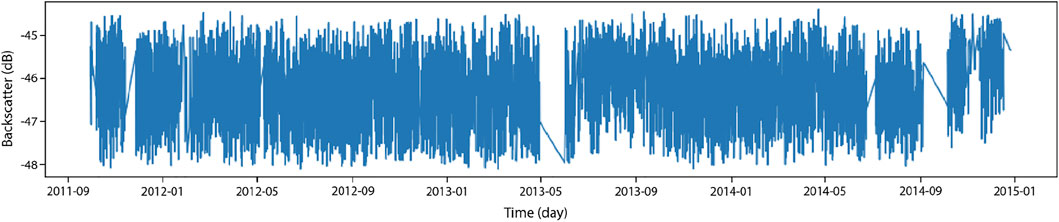
FIGURE 8. The cumulative backscatter observed along the plume centerline from 2 m above the vent to 18 m above the vent. No significant change in venting is observed over the 2011–2014 time period.
We note that, except for the COVIS estimates, heat flux estimates and the underlying temperature and vent exit flow data are sparse in both time and space. During 2010–2015, only one resistivity-based sensor, located at Grotto, monitored focused (high temperature) discharge and a handful of low temperature sensors intermittently monitored diffuse (low temperature) discharge, mainly at Grotto and all in MEF. Scattered in situ flow measurements were made at MEF and Mothra during 2010; while these yielded heat flux measurements, the lack of coverage past 2010 and the scattered coverage in time and space make definite conclusions difficult (Germanovich et al., 2015) while remaining consistent with the suggested waning of MEF and waxing of High Rise to the north of MEF. In summary, there are insufficient direct measurements of venting intensity reported in the literature for 2010–2015 to support or refute our observations.
Considering potential impacts of ridge scale changes in venting distribution
Changes in venting intensity directly impact bottom currents, because the rising buoyant plume entrains substantial ambient fluids, setting up inward currents that can reach 0.1 m/s comparable to or larger than tidal currents. The spatial pattern of high temperature venting (those generating substantial plumes) can warp and alter the background currents over the range of plume rise. Thomson et al. (2009) report that the bottom currents (from 5 m above bottom to 200 m above bottom) in the Endeavour rift valley have a northward tendency that cannot be explained by oceanographic background currents and attributed this northward flow to stronger venting at the more northern venting sites. Unfortunately, insufficient vent temperature, flow and heat flux data exists to verify systematic changes in venting between 2010 and 2015 for any sites on the Endeavour Segment.
However, the direct bottom current measurements reviewed earlier in this paper suggest patterns that may be consistent with venting control of mean bottom currents. The 2010–2013 southward shift of bottom currents at NE005 and the 2010–2013 northward shift of plume bending at MEF/Grotto would both be consistent with an increase in venting at the High Rise site that lies between them. It is not clear why the bottom currents at NW005 are completely different, but local effects on the flow field may have a stronger influence than the background flow. The 2013–2014 southward shift in central MEF (ADCP) seems inconsistent with the slight northward shift in plume bending at Grotto; the difference could be the influence of venting in southern MEF (Xu, 2015) and the more southern vent field Mothra or seasonal effects as the central MEF ADCP record only starts in October 2013. In sum, the Grotto plume data may suggest increased venting at High Rise or decreased venting in MEF and Mothra, but no direct data on bottom currents or venting intensity is available to verify that assertion.
Considering potential for and impacts of ocean scale changes in currents
Since we cannot verify directly whether venting intensity was changing along the Endeavour ridge between 2010 and 2015, we have looked to see if there were any major changes in the broader hydrographic environment that might suggest an outside influence on the bottom currents. Ocean currents outside the Endeavour rift valley respond to climatological changes in ocean circulation and to internal waves generated by any of mesoscale ocean eddy passages, atmospheric storms, or tide-topographic interactions.
Doing a spectral analysis of the azimuth directions (Figure 9) for the Grotto plume revealed no surprises: The semi-diurnal cycle is the dominant periodicity all years, which is expected as this is typical of the Endeavour region (Thomson et al., 1990). The diurnal peak is significant only in 2012–2014, which is likely an artifact of the relatively greater amount and longer duration of data those years. The only other peak that is significant is ∼3.8 cycles/day in 2012 (which is not present in other years). That most likely explanations are either it is too close to the Nyquist frequency for sampling 8 times a day or a quarter harmonic of the diurnal associated with bathymetric obstacles to flow, which would not be surprising given the rough topography of Grotto and MEF. No significant periodicity is detected in the weather band (∼0.25 cycles/day) suggesting that any impact by atmospheric storms is aperiodic and generally unimportant.
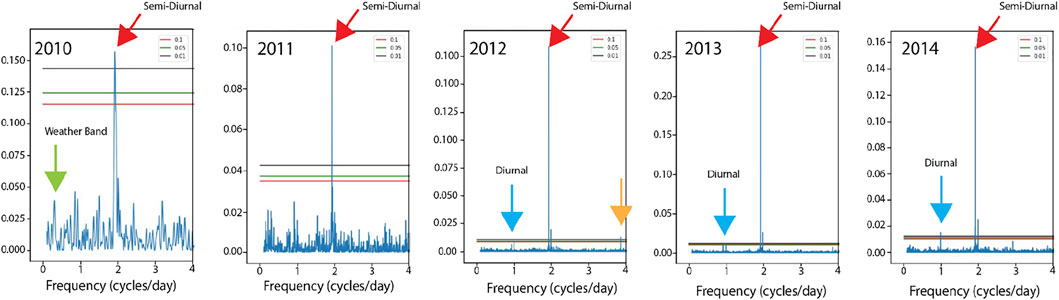
FIGURE 9. Lomb-Spargle spectra for all 5 years show dominant periodicity only in the semi-diurnal cycle (with occasional significant peaks in the diurnal or quarter diurnal ranges). Higher false alarm probability levels in years 2010 and 2011 reflect the shorter duration and more limited data from those years. Primary significant peaks are the semi-diurnal (red arrow) and diurnal (blue arrow); the only other significant peak (orange arrow) could be either aliasing as Nyquist frequency only approximate for irregular sampling or alternatively the upper harmonics of the diurnal frequency related to reflections about bathymetric obstacles.
Thomson et al. (2009) modeled the effects of ocean circulation changes that might change the net flow directions outside the rift valley by looking at how a net northward or net southward outside current would affect current in the rift valley. They found that in both cases, the net current in the rift valley was northward, although perhaps slightly enhanced when the outside current was southward. Few direct measurements exist of deep ocean currents near Endeavour over this period. The ONC NE and NW moorings were intended to provide measurements at 250 which may have recorded currents outside the rift valley, but data coverage is too sporadic for meaningful analysis. To assess whether the outside current changed, we looked at data related to potential forcing of deep ocean currents - in particular, we looked at wind data for the NE Pacific and at sea surface heights.
When looking for alternative explanations, we first looked at buoy data for two buoys in the Northeast Pacific. Both the buoy west of the Endeavour ridge and the buoy east near the Oregon coast, recorded surface winds that were highly variable but showed no discernable patterns, suggesting that internal wave generation varied systematically over the 2010–2015 period (Figure 10). We also looked to see if there were systematic changes in the numbers of mesoscale eddies passing over the Endeavour ridge (Figure 11) by examining sea surface heights (SSH) extracted from satellite data (see Table 1 and footnotes). For either one pixel or a 3-by-3 pixel block over the MEF vent field we observe lots of changes in SSH, but nothing to indicate 2014 was measurably different from 2010.
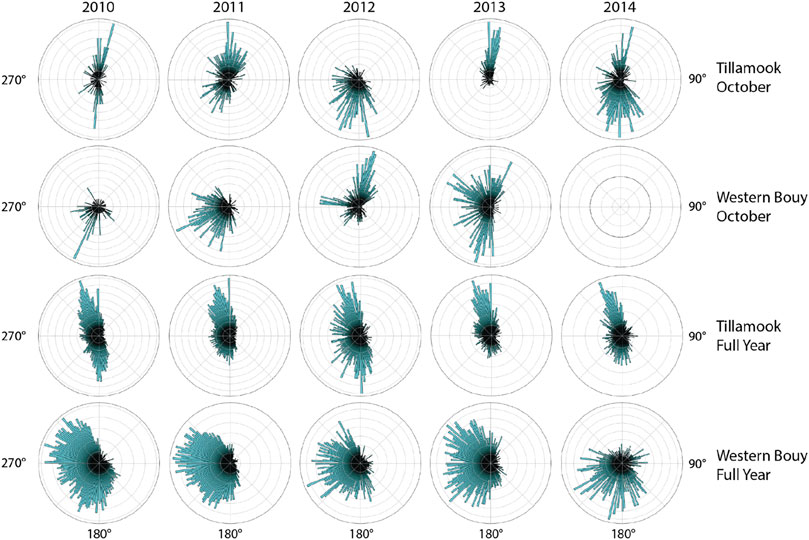
FIGURE 10. Wind data from eastern coastline buoy (Tillamook) and western open ocean buoy (C46) suggest that coastal winds varied more than open ocean winds. Neither case shows a simple progressive change in direction from 2010 to 2014.
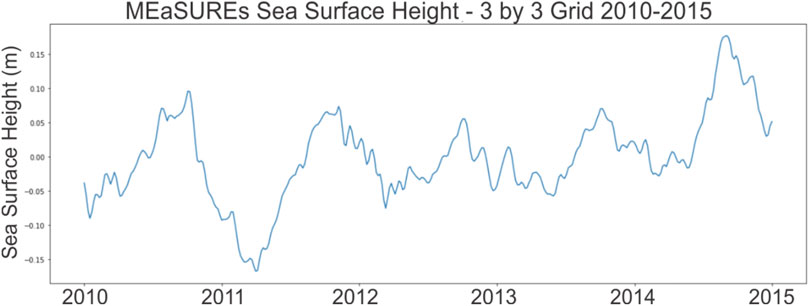
FIGURE 11. Sea surface height (SSH) over the Main Endeavour Field (MEF) is shown for 2010 to 2015. Data downloaded from NASA PODAAC (see Table 1 and footnotes). Implications for interpreting the observed changes in plume bending.
The previous subsection attempted to establish that there were no substantive hydrographic changes that could explain changes in the bottom currents within the Endeavor rift valley. Broadly we have found no obvious indication of major hydrographic changes outside Endeavour between 2010 and 2015. Furthermore, the modeling work of Thomson et al. (2009) would suggest that even major shifts outside the rift valley such as dominantly northward flow to dominantly southward flow have minimal impact on flow within the rift valley. Instead, they conclude that the background current within the Endeavour rift valley is controlled primarily by the venting intensities at the major vent fields. In brief, as plumes rise from the major vents, they entrain seawater and generate an inward current. The combination of such currents from each of the major vents in each of the major vent fields controls the net flow pattern. Therefore, if venting intensity decreases at one site, such as MEF, and increases at another, such as High Rise, the net flow at MEF could shift northwards (Figure 12). This seems the most likely explanation of our observation of a systematic change in the net flow directions at Grotto to be increasingly northwards.
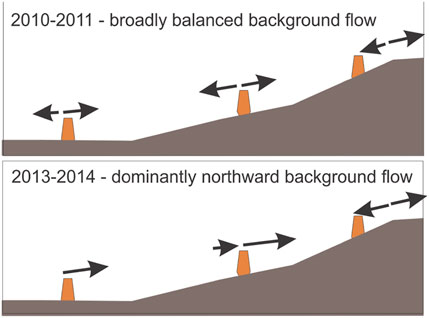
FIGURE 12. Diagram shows hypothesized change in Endeavour Segment flow patterns.
Conclusion
Analysis of the time-dependent behavior of the buoyant plume rising above Grotto Vent (Main Endeavour Field, Juan de Fuca Ridge) as imaged by the Cabled Observatory Vent Imaging Sonar (COVIS) between September 2010 and October of 2015 captures long term time-dependent changes in the direction of background bottom currents independent of broader oceanographic processes, indicating a systematic evolution in vent output along the Endeavour Segment of the Juan de Fuca Ridge. The behavior of buoyant plumes can be quantified by describing the volume, velocity, and orientation of the effluent relative to the seafloor, which are a convolved expression of hydrothermal flux from the seafloor and ocean bottom currents in the vicinity of the hydrothermal vent.
We have concluded that changes in venting along the Endeavour Segment have resulted in the changes in background currents, that venting increased at vent fields north of MEF (likely High Rise vent field). This hypothesis is supported by these key results:
1) The bending azimuth of the Grotto plume shifted between October 2011 and December 2014 from bimodal NW and SW to SE in 2010, 2011, and 2012 to single mode NW in 2013 and 2014 (Figures 4–6). This implies that background bottom currents at Main Endeavour Field (MEF) shifted between nearly balanced North-South tides in 2010–2011 to a generally northward flow in 2013–2014 based on the changed bending behavior of the Grotto Vent plume.
2) The range of inclinations and the overall intensities of the Grotto plume showed no systematic change over the same period, implying little change in the vent output (Figure 8).
3) Spectral analysis of the azimuthal data suggests the dominant current generating processes are either not periodic (such as the entrainment fields generated by the hydrothermal plumes themselves) or are related to tidal processes (Figure 9).
4) Thomson et al. (2009) showed in a numerical simulation that the background bottom currents were more likely to be controlled by the local (segment-scale) venting than by outside ocean circulation or atmospheric patterns.
The best explanation for the collected observations is that changes in venting along the Endeavour Segment, most likely increases in venting at High Rise, resulted in a change in the background bottom currents to more dominantly northward. (Figure 12). Local shifts in venting within MEF may explain some of the complexity in the observed data as not all observations of currents are consistent. Observing plume behavior over 5 years led to the surprising conclusion that subtle changes in segment-scale hydrography led to observable changes in a single plume.
Data availability statement
The datasets presented in this study can be found in online repositories. The names of the repository/repositories and accession number(s) can be found below: for COVIS data see https://doi.org/10.34943/d4c58c87-f65f-449c-ad0c-8f23effea487; for NE & NW moorings at Endeavour North and the Main Endeavour Field ADCP current data see https://data.oceannetworks.ca/DataSearch; for buoy data see stations 46036 & TLBO3 at https://www.ndbc.noaa.gov/; and for SSH data see Table 1 for coordinates to pull PODAAC data from https://podaac.jpl.nasa.gov/.
Author contributions
All authors listed have made a substantial, direct, and intellectual contribution to the work and approved it for publication.
Funding
Original COVIS awards for the MEF deployment of COVIS were NSF-OTIC (0824612, 0825088, PI Peter Rona, CoPIs Deborah Silver, Karen Bemis) in 2008 with follow-on awards NSF-OCE (1234141, 1234163; Bemis, current PI, Rona, former PI, Silver co-PI) in 2012 for data analysis and software development. Current COVIS award is NSF-OCE 1736702 (plus 1736393, 1726920, 1834813, 1736621; PI Bemis) in 2017 for COVIS installment at Axial Seamount.
Conflict of interest
The authors declare that the research was conducted in the absence of any commercial or financial relationships that could be construed as a potential conflict of interest.
Publisher’s note
All claims expressed in this article are solely those of the authors and do not necessarily represent those of their affiliated organizations, or those of the publisher, the editors and the reviewers. Any product that may be evaluated in this article, or claim that may be made by its manufacturer, is not guaranteed or endorsed by the publisher.
Footnotes
1https://data.oceannetworks.ca/DataSearch&sa=D&source=docs&ust=1651869986356363&usg=AOvVaw3BoNCs-lCw9oVcR5SrubKi.
References
Adams, I., and Di Iorio, D. (2021). Turbulence properties of a deep-sea hydrothermal plume in a time-variable cross-flow: Field and model comparisons for Dante in the Main Endeavour Field. J. Geophys. Res. Oceans 126, e2020JC016638. doi:10.1029/2020JC016638
Bemis, K. G., Rona, P. A., Jackson, D., Jones, C., Silver, D., Mitsuzawa, K., et al. (2002). A comparison of black smoker hydrothermal plume behavior at Monolith Vent and at Clam Acres Vent Field: Dependence on source configuration. Mar. Geophys. Res. 23 (2), 81–96. doi:10.1023/a:1022484931681
Bemis, K. G., Silver, D., Xu, G., Light, R., Jackson, D., Jones, C., et al. (2015). The path to COVIS: A review of acoustic imaging of hydrothermal flow regimes. Deep Sea Res. Part II Top. Stud. Oceanogr. 121, 159–176. doi:10.1016/j.dsr2.2015.06.002
Bickle, M., and Elderfield, H. (2013). “Hydrothermal fluxes in a global context,” in Hydrogeology of the ocean lithosphere. Editors E. Davis, and H. Elderfield (Cambridge: Cambridge University Press), 677–690.
Burd, B. J., and Thomson, R. E. (2019). Seasonal patterns in deep acoustic backscatter layers near vent plumes in the northeastern Pacific Ocean. Facets 4 (1), 183–209. doi:10.1139/facets-2018-0027
Cannon, G. A., and Thomson, R. E. (1996). Characteristics of 4‐day oscillations trapped by the Juan de Fuca Ridge. Geophys. Res. Lett. 23 (13), 1613–1616. doi:10.1029/96gl01370
Clague, D. A., Caress, D. W., Thomas, H., Thompson, D., Calarco, M., Holden, J., et al. (2008). Abundance and distribution of hydrothermal chimneys and mounds on the Endeavour Ridge determined by 1-m resolution AUV multibeam mapping surveys. Eos Trans. Am. Geophys. Union 89 (53). Fall Meeting Supplement AbstractV41B-2079.
Clague, D. A., Martin, J. F., Paduan, J. B., Butterfield, D. A., Jamieson, J. W., Le Saout, M., et al. (2020). Hydrothermal chimney distribution on the Endeavour Segment, Juan de Fuca Ridge. Geochem. Geophys. Geosyst. 21 (6), e2020GC008917. doi:10.1029/2020gc008917
Delaney, J. R., Robigou, V., McDuff, R. E., and Tivey, M. K. (1992). Geology of a vigorous hydrothermal system on the Endeavour Segment, Juan de Fuca Ridge. J. Geophys. Res. 97 (B13), 19663. doi:10.1029/92jb00174
Delaney, J., Beauchamp, P., McNutt, M., Barnes, C., Chave, A., and Madden, J. (2003). “Project NEPTUNE: An interactive, regional cabled ocean observatory in the Northeast pacific,” in Oceans 2003. Celebrating the Past. Teaming Toward the Future (IEEE Cat. No. 03CH37492), San Diego, CA, USA, September 2003 (IEEE), 1038–1042.
German, C. R., and Von Damm, K. L. (2003). “Hydrothermal processes,” in the Oceans and marine geochemistry. Treatise on geochemistry. Editors H. Elderfield, H. D. Holland, and K. K. Turekian, 6, 625.
Germanovich, L. N., Hurt, R. S., Smith, J. E., Genc, G., and Lowell, R. P. (2015). Measuring fluid flow and heat output in seafloor hydrothermal environments. J. Geophys. Res. Solid Earth 120 (12), 8031–8055. doi:10.1002/2015JB012245
Glickson, D. A., Kelley, D. S., and Delaney, J. R. (2007). Geology and hydrothermal evolution of the Mothra hydrothermal field, Endeavour Segment, Juan de Fuca Ridge. Geochem. Geophys. Geosyst. 8 (6). doi:10.1029/2007gc001588(6)
Huybers, P., and Langmuir, C. H. (2017). Delayed CO2 emissions from mid-ocean ridge volcanism as a possible cause of late-Pleistocene glacial cycles. Earth Planet. Sci. Lett. 457, 238–249. doi:10.1016/j.epsl.2016.09.021
Karsten, J. L., Hammond, S. R., Davis, E. E., and Currie, R. G. (1986). Detailed geomorphology and neotectonics of the Endeavour Segment, Juan de Fuca Ridge: New results from seabeam swath mapping. Geol. Soc. Am. Bull. 97 (2), 213. doi:10.1130/0016-7606(1986)97<213:dganot>2.0.co;2
Keller, T., Katz, R. F., and Hirschmann, M. M. (2017). Volatiles beneath mid-ocean ridges: Deep melting, channelised transport, focusing, and metasomatism. Earth Planet. Sci. Lett. 464, 55–68. doi:10.1016/j.epsl.2017.02.006
Kelley, D. S., Delaney, J. R., and Yoerger, D. R. (2001). Geology and venting characteristics of the Mothra hydrothermal field, Endeavour Segment, Juan de Fuca Ridge. Geology 29 (10), 959–962. doi:10.1130/0091-7613(2001)029<0959:GAVCOT>2.0.CO;2
Kelley, D. S., Carbotte, S. M., Caress, D. W., Clague, D. A., Delaney, J. R., Gill, J. B., et al. (2012). Endeavour Segment of the Juan de Fuca Ridge: One of the most remarkable places on earth. Oceanogr. Wash. D. C). 25 (1), 44–61. doi:10.5670/oceanog.2012.03
Lang, S. Q., Butterfield, D. A., Schulte, M., Kelley, D. S., and Lilley, M. D. (2010). Elevated concentrations of formate, acetate and dissolved organic carbon found at the Lost City hydrothermal field. Geochimica Cosmochimica Acta 74 (3), 941–952. doi:10.1016/j.gca.2009.10.045
Lavelle, J. W., Di Iorio, D., and Rona, P. (2013). A turbulent convection model with an observational context for a deep‐sea hydrothermal plume in a time‐variable cross flow. J. Geophys. Res. Oceans 118 (11), 6145–6160. doi:10.1002/2013jc009165
Le Voyer, M., Hauri, E. H., Cottrell, E., Kelley, K. A., Salters, V. J. M., Langmuir, C. H., et al. (2019). Carbon fluxes and primary magma CO2 contents along the global mid‐ocean ridge system. Geochem. Geophys. Geosyst. 20 (3), 1387–1424. doi:10.1029/2018gc007630
Mihaly, S. F., Thomson, R. E., and Rabinovich, A. B. (1998). Evidence for nonlinear interaction between internal waves of inertial and semidiurnal frequency. Geophys. Res. Lett. 25, 1205–1208. doi:10.1029/98GL00722
Ondréas, H., Scalabrin, C., Fouquet, Y., and Godfroy, A. (2018). Recent high-resolution mapping of Guaymas hydrothermal fields (Southern Trough). BSGF - Earth Sci. Bull. 189, 6. doi:10.1051/bsgf/2018005(1)
Rona, P. A., Bemis, K. G., Silver, D., and Jones, C. D. (2002). Acoustic imaging, visualization, and quantification of buoyant hydrothermal plumes in the ocean. Mar. Geophys. Res. 23 (2), 147–168. doi:10.1023/a:1022481315125
Rona, P. A., Bemis, K. G., Jones, C. D., Jackson, D. R., Mitsuzawa, K., Silver, D., et al. (2006). Entrainment and bending in a major hydrothermal plume, Main Endeavour Field, Juan de Fuca Ridge. Geophys. Res. Lett. 33, L19313. doi:10.1029/2006GL027211
Soule, D., Wilcock, W. S., Toomey, D. R., Hooft, E. E., and Weekly, R. T. (2016). Near‐axis crustal structure and thickness of the Endeavour Segment, Juan de Fuca Ridge. Geophys. Res. Lett. 43 (11), 5688–5695. doi:10.1002/2016gl068182
Spietz, R. L., Butterfield, D. A., Buck, N. J., Larson, B. I., Chadwick, W. W., Walker, S. L., et al. (2018). Deep-sea volcanic eruptions create unique chemical and biological linkages between the subsurface lithosphere and the oceanic hydrosphere. Oceanogr. Wash. D. C). 31 (1), 128–135. doi:10.5670/oceanog.2018.120
Strub, P. T., and James, C. (2002a). Altimeter-derived surface circulation in the large–scale NE pacific gyres.: Part 1. Seasonal variability. Prog. Oceanogr. 53 (2-4), 163–183. doi:10.1016/s0079-6611(02)00029-0
Strub, P. T., and James, C. (2002b). Altimeter-derived surface circulation in the large-scale NE pacific gyres.: Part 2: 1997–1998 el niño anomalies. Prog. Oceanogr. 53 (2-4), 185–214. doi:10.1016/s0079-6611(02)00030-7
Thomson, R. E., Roth, S. E., and Dymond, J. (1990). Near‐inertial motions over a mid‐ocean ridge: Effects of topography and hydrothermal plumes. J. Geophys. Res. 95 (C5), 7261. doi:10.1029/JC095iC05p07261
Thomson, R. E., Subbotina, M. M., and Anisimov, M. V. (2009). Numerical simulation of mean currents and water property anomalies at Endeavour Ridge: Hydrothermal versus topographic forcing. J. Geophys. Res. 114 (C9), C09020. doi:10.1029/2008JC005249
Tolstoy, M. (2015). Mid‐ocean ridge eruptions as a climate valve. Geophys. Res. Lett. 42 (5), 1346–1351. doi:10.1002/2014gl063015
Turner, J. S. (1986). Turbulent entrainment: The development of the entrainment assumption, and its application to geophysical flows. J. Fluid Mech. 173, 431–471. doi:10.1017/s0022112086001222
Xu, G., Jackson, D. R., Bemis, K. G., and Rona, P. A. (2013). Observations of the volume flux of a seafloor hydrothermal plume using an acoustic imaging sonar. Geochem. Geophys. Geosyst. 14 (7), 2369–2382. doi:10.1002/ggge.20177
Xu, G., Jackson, D. R., Bemis, K. G., and Rona, P. A. (2014). Time-series measurement of hydrothermal heat flux at the Grotto mound, Endeavour Segment, Juan de Fuca Ridge. Earth Planet. Sci. Lett. 404, 220–231. doi:10.1016/j.epsl.2014.07.040
Xu, G., Jackson, D. R., and Bemis, K. G. (2017). The relative effect of particles and turbulence on acoustic scattering from deep sea hydrothermal vent plumes revisited. J. Acoust. Soc. Am. 141 (3), 1446–1458. doi:10.1121/1.4974828
Xu, G., and Lavelle, J. W. (2017). Circulation, hydrography, and transport over the summit of Axial Seamount, a deep volcano in the Northeast Pacific. J. Geophys. Res. Oceans 122 (7), 5404–5422. doi:10.1002/2016JC012464
Keywords: Endeavour, hydrothermal plume, Juan de Fuca Ridge, COVIS, plume bending
Citation: Bemis KG, Zhao M, Sacker J and Soule DC (2022) Systematic shift in plume bending direction at Grotto Vent, Main Endeavour Field, Juan de Fuca Ridge implies changes in venting output along the Endeavour Segment. Front. Earth Sci. 10:938675. doi: 10.3389/feart.2022.938675
Received: 07 May 2022; Accepted: 12 July 2022;
Published: 30 August 2022.
Edited by:
Houshuo Jiang, Woods Hole Oceanographic Institution, United StatesReviewed by:
Xubo Zhang, South China Sea Institute of Oceanology (CAS), ChinaJohn A. Breier Jr, The University of Texas Rio Grande Valley, United States
Copyright © 2022 Bemis, Zhao, Sacker and Soule. This is an open-access article distributed under the terms of the Creative Commons Attribution License (CC BY). The use, distribution or reproduction in other forums is permitted, provided the original author(s) and the copyright owner(s) are credited and that the original publication in this journal is cited, in accordance with accepted academic practice. No use, distribution or reproduction is permitted which does not comply with these terms.
*Correspondence: Dax C. Soule, dax.soule@qc.cuny.edu