On the Bleaching Degree of Multi-Grain Coarse Quartz OSL Signal of Near-Surface Aeolian Sediments Around the Tengger Desert: Empirical Investigation and Numerical Validation
 Hongwei Mo
  Jun Peng
- School of Earth Sciences and Spatial Information Engineering, Hunan University of Science and Technology, Xiangtan, China
In this study, the degree of bleaching of multi-grain coarse quartz optically stimulated luminescence (OSL) signal of near-surface aeolian samples collected around the Tengger Desert is assessed. The single-aliquot regenerative dose (SAR) protocol and the standardized growth curve (SGC) method are applied to measure the equivalent dose (De) of these samples. The bleaching degree of the samples is assessed by investigating 1) the relationship between Ln/Tn and SAR De and 2) the SGC De distribution. Various degrees of heterogeneously-bleached multi-grain dose distributions synthetized with a numerical simulation method is further used to validate the bleaching performance of the samples. It demonstrates that the investigated samples are characterized by tight De distributions and the maximum De estimate is smaller than 1.1 Gy. The numerical simulation method which uses as input a large proportion of fully-bleached grains and a small baseline dose is able to reproduce multi-grain De distributions similar to the measured ones. We conclude that OSL signals of multi-grain coarse quartz extracted from most of the investigated aeolian samples are fully bleached before deposition.
Introduction
Optically simulated luminescence (OSL) dating techniques are widely used for the determination of the burial ages of Quaternary sediments (e.g., Li et al., 2002, 2014; Zhao et al., 2007; Yi et al., 2015; Peng et al., 2022). To obtain accurate OSL ages, optically sensitive charges that were previously accumulated in the mineral (quartz and feldspar) grain should be completed zeroed (or bleached) by sunlight prior to the last deposition of sediments (Godfrey-Smith et al., 1988; Peng et al., 2020). However, heterogeneous bleaching of quartz OSL signals has been frequently reported in the literature, especially for younger sediments with smaller equivalent dose (De) values (e.g., Lian and Huntley, 1999; Li, 2001; Zhang et al., 2003; Olley et al., 2004; Arnold et al., 2009; Pietsch, 2009; Hu et al., 2010; Costas et al., 2012; Ou et al., 2015; Mahadev et al., 2019).
Aeolian sediments are the most readily available materials for OSL dating in semi-arid/arid regions (Peng et al., 2022), and are thought to be the most unlikely influenced by heterogeneous bleaching (Wintle, 1993) due to their longer time of exposure to sunlight before deposition compared to water-lain sediments. Although many authors reported that their aeolian samples under analyzed were fully bleached before deposition (e.g., Bailey et al., 2001; Ballarini et al., 2003; Stokes et al., 2004; Singarayer et al., 2005; Zhao et al., 2012; Gong et al., 2013; Fu et al., 2015; Long et al., 2019; Yang et al., 2020), there is a growing lines of evidence indicating that it is not a sufficient guarantee that aeolian sediments under all deposition environments were fully bleached (e.g., Lian and Huntley, 1999; Spooner et al., 2001; Goble et al., 2004; Olley et al., 2004; Tissoux et al., 2010; Costas et al., 2012; Fan et al., 2013, 2022; Buckland et al., 2019). Accordingly, it is important to assess the bleaching degree of aeolian sediments in a region-specific scale to obtain accurate OSL ages for young samples to establish reliable geochronological framework on a century to decadal time scale.
Tengger Desert is a major proximal desert upwind to the Chinese Loess Plateau and aeolian dust released therein has significantly influenced region- and hemisphere-scale environments (Peng et al., 2022). Fan et al. (2013) assessed the bleaching degree of fine-grained quartz (11–63 μm) OSL signals near the Lanzhou city 200 km south to the Tengger Desert and indicated that most (but not all) the investigated samples were fully bleached. Fan et al. (2022) investigated the bleaching degree of coarse-grained quartz (90–125 μm) OSL signal of dune sands from the hinterland of the Tengger Desert and suggested that approximately a half of the studied samples were heterogeneously bleached. However, the bleaching characteristics of coarse-grained quartz OSL signals of aeolian sediments along the margin of the Tengger Desert have not been formally assessed yet, although a growing number of chronostratigraphic records from the desert margin were dated using coarse-grained quartz OSL (e.g., Qiang et al., 2010; Yin et al., 2013; Peng et al., 2016, 2022). In this study, near-surface coarse aeolian samples collected around the margin of the Tengger Desert were investigated to assess their multi-grain quartz OSL signal bleaching degrees using both empirical and numerical simulation methods.
Samples and Methods
Twelve aeolian samples collected from nine different sites around the margin of the Tengger Desert were investigated (Figure 1A). The maximum distance between these sites and the mobile sand sea of the desert are smaller than 60 km. Samples were collected at the near-surface of the outcrops (with an average depth of ∼0.86 m) and were expected to have De values approaching zero. Sample TDN6-4 is sandy loess and the remaining samples are aeolian sand. The results of grain-size analysis demonstrate that most samples are dominant by coarse fractions with particle diameters greater than 63 μm (Figure 1B). The reader is referred to Peng et al. (2022) for further information on the samples.
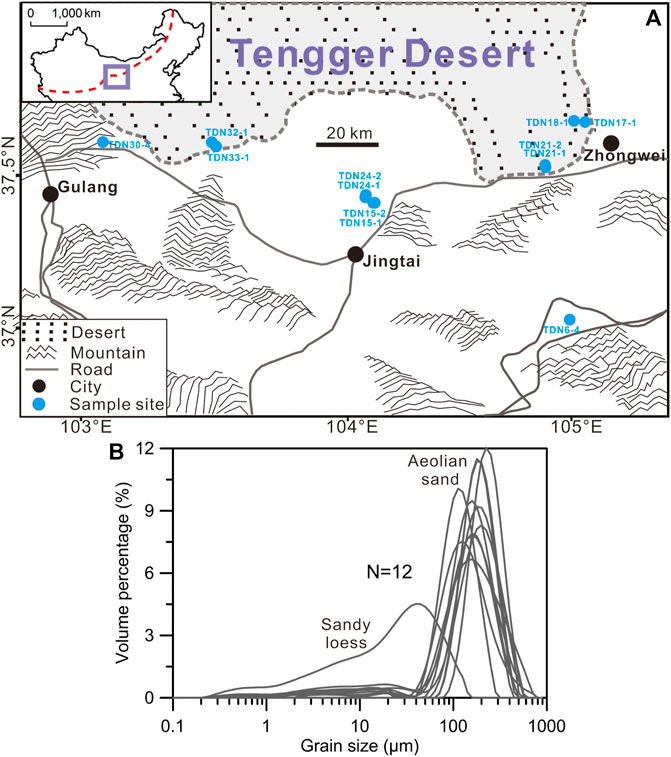
FIGURE 1. (A) Site locations of the investigated samples. The bold rectangle in the inset indicates the studied region and the dashed red line indicates the border of the East Asia summer Monsoon. (B) Grain-size distributions of the investigated samples.
Raw samples were processed with the standard procedure (see Peng et al., 2022 and reference therein) to extract the 90–125 μm (or 63–90 μm, i.e., sample TDN6-4) quartz fractions which were subsequently contained in the inner part (four to five mm in diameter) of the discs for OSL measurements. Post-IR OSL signals were measured with a Risø-TL/OSL-DA-20 reader equipped with IR LEDs (870 nm, 48 mW/cm2) and blue LEDs (470 nm, 48 mW/cm2) to suppress the contribution of feldspar luminescence (e.g., Banerjee et al., 2001). Post-IR OSL signals were collected at 130°C for 40 s (with 400 channels). The preheat temperatures before the natural and regenerative OSL measurements were 260 and 220°C, respectively. The test dose used for sensitivity correction was 7.9 Gy throughout the measurements. De measurements were conducted using the single-aliquot regenerative-dose (SAR) (Murray and Wintle, 2000) and the standardized growth curve (SGC) (Roberts and Duller, 2004) methods. SAR De was determined by a full protocol with one natural cycle and six regenerative cycles. SGC De was determined by projecting the sensitivity-corrected natural OSL signal (Ln/Tn) onto a pre-determined SGC. OSL data analysis was performed using the R package “numOSL” (Peng et al., 2013; Peng and Li, 2017).
Numerical simulations were performed to generate heterogeneously-bleached De distributions (e.g., Peng, 2021) so as to validate the bleaching performance of the measured multi-grain aliquots. Single-grain OSL sensitivities were simulated from the empirical distribution of a measured sand dune sample according to the method of Rhodes (2007). OSL signals were generated using a pre-determined dose-response curve (DRC) described by a single saturating exponential function (e.g., Li et al., 2017). The heterogeneous bleaching process of the single-grain quartz OSL was simulated by assuming that the fast-component OSL signal decays exponentially with sunlight exposure duration with a bleaching rate of 0.4 s−1 which allows the OSL signal to decay to less than 2% of its initial level after a bleaching duration of 10 s (Peng et al., 2020). This is consistent with the sunlight bleaching experiment work carried out by Godfrey-Smith et al. (1988) who predicted that 90% of the natural optical signal should be erased following a 10 s exposure to sunlight. The methodologies and terminologies used to simulate the baseline doses, baseline signals, residual signals, residual doses, burial doses, and natural doses were consistent with those of Peng et al. (2020). To synthetize multi-grain De distributions, a random sampling protocol (without replacement) was used to draw subsets from 1,000 simulated noise-free single-grain OSL datasets, and each subset containing OSL signals from Ng heterogeneously-bleached grains were superposed and noised to generate a “measured” multi-grain De value (and associated standard errors). The process was implemented repeatedly to generated “measured” multi-grain De distributions. The “measured” OSL signal was simulated by taking into account the counting statistics, instrument irreproducibility, and intrinsic over-dispersion (e.g., Li et al., 2017; Peng et al., 2020; Peng, 2021).
Results
Measured Results
Typical natural OSL decay curves are presented in Figure 2, for samples TDN6-4 and TDN15-1. A detectable natural OSL signal is presented in certain aliquots of TDN6-4 but absent in all aliquots of TDN15-1. Figure 3A shows typical SAR De calculation for a sample (TDN15-1). Due to the low signal-to-noise ratios of the measured decay curves, the SAR De calculations were characterized by very large uncertainties. Figure 4 shows the variation of the SAR De with the sensitivity-corrected natural OSL signal (e.g., Li, 2001) for eleven out of twelve samples (except TDN33-1). It shows that for certain samples (such as TDN6-4, TDN15-1, TDN17-1, and TDN30-4) positive correlations are observed between De and Ln/Tn values.
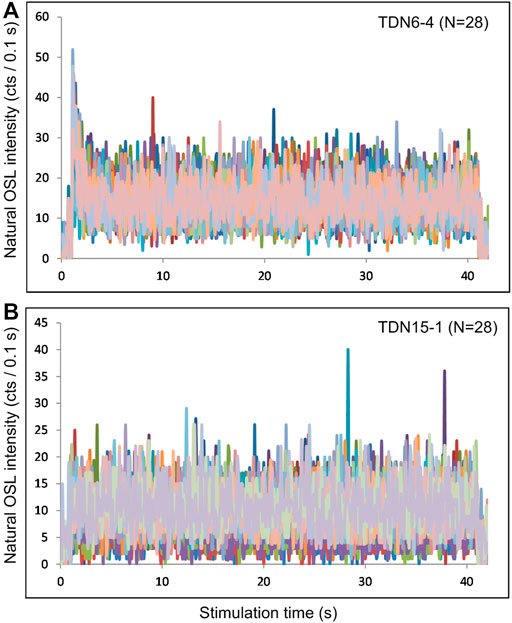
FIGURE 2. Natural post-IR OSL decay curves of samples TDN6-4 and TDN15-1.
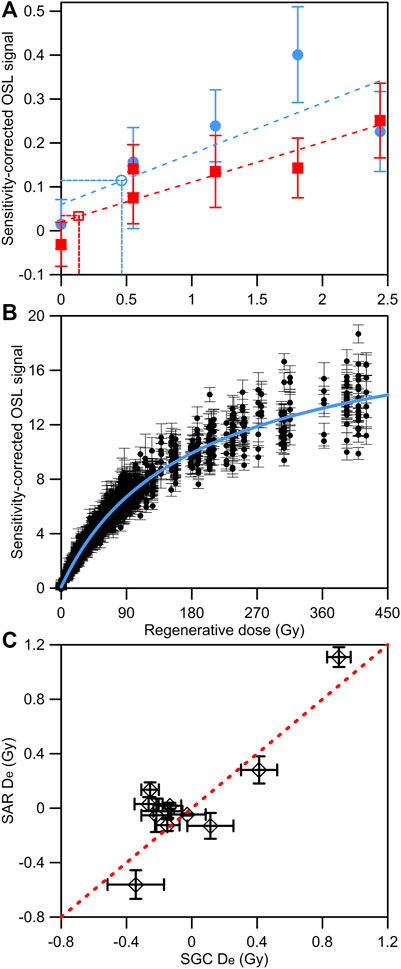
FIGURE 3. (A) shows SAR De determination for two different aliquots of sample TDN15-1. The dashed lines indicate the fitted DRCs. (B) shows the sensitivity-corrected regenerative post-IR OSL signals used for establishing the SGC. The blue line indicates the established SGC. (C) compares SAR and SGC De estimates for eleven samples. For each sample, the SAR De estimate were based on twelve aliquots and the SGC ones were based on at least twenty-three aliquots. The dashed red line indicates y = x.
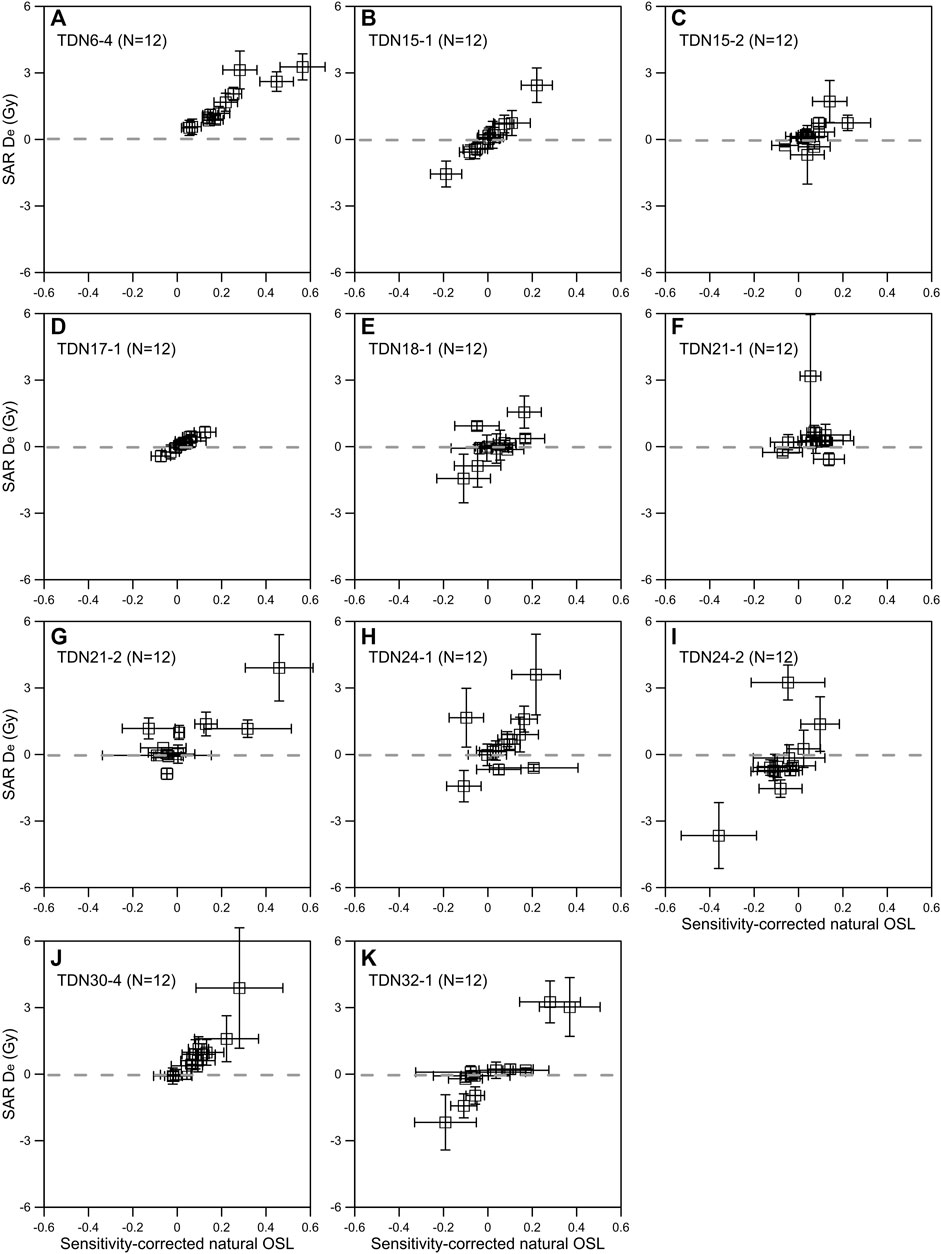
FIGURE 4. Variations of SAR De values as a function of the sensitivity-corrected natural OSL signals for different aeolian samples.
We applied the SGC method to these young aeolian sediments to improve the precision of De determination and to rapid explore their potential burial dose distributions (e.g., Hu and Li, 2019; Yang et al., 2020). The common DRC used for SGC De calculation (i.e., Peng et al., 2022) is shown in Figure 3B and a comparison of SAR and SGC De estimates for eleven samples is shown in Figure 3C. The two different methods yield De estimates that are broadly consistent with each other after accounting for associated errors. The calculated SGC De distributions are shown in Figure 5 as radial plots (Galbraith, 1988). Since negative De values present in most SGC De distributions due to poor counting statistics, a linear transformation (rather than a logarithmic transformation) as suggested by Vermeesch (2009) was used to draw the radial plots. It demonstrates that the SGC De distributions fall into narrow ranges and most De values are within the two-sigma range. The final De estimates were determined using an unlogged version of the central age model (Galbraith et al., 1999). The max final De estimate was calculated as 1.09 ± 0.15 Gy (i.e., sample TDN6-4) and ten samples (i.e., TDN15-1, TDN15-2, TDN17-1, TDN18-1, TDN21-1, TDN21-2, TDN24-1, TDN24-2, TDN32-1, TDN33-1) yield De estimates ranging between -0.26 ± 0.05 Gy and 0.2 ± 0.23 Gy.
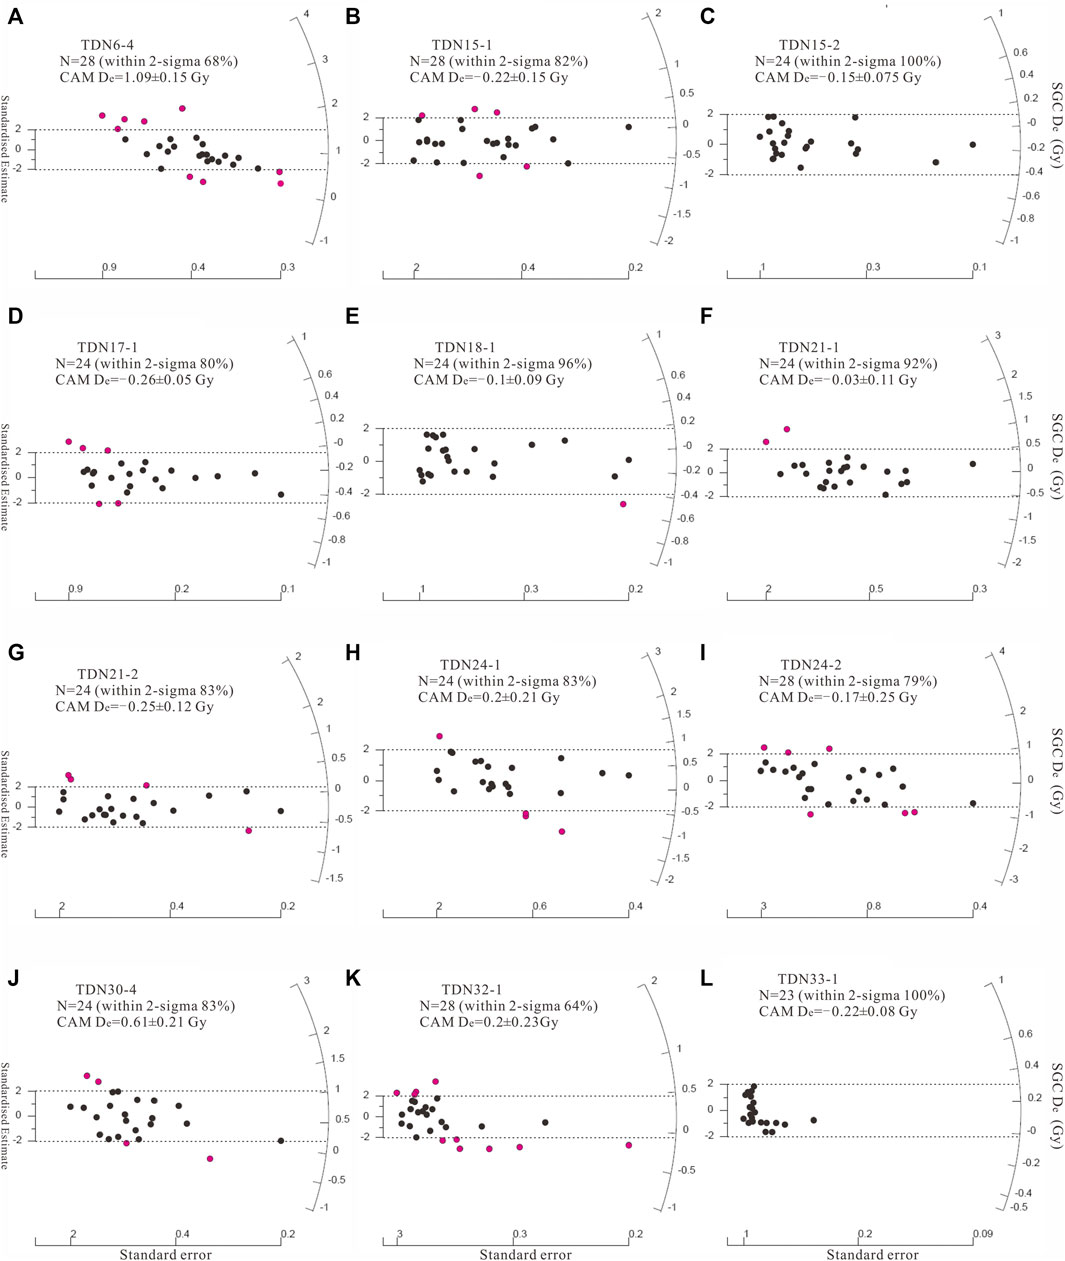
FIGURE 5. Radial plot showing calculated SGC De distributions of different aeolian samples. The dashed lines indicate the two sigma range of the distribution.
Simulated Results
Considering that each of the above measured multi-grain aliquots contains at least 200 quartz grains (i.e., according to Duller, 2008) and therefore the results may be influenced by the “averaging” effect which may obscure the results and the effect amplifies as the number of grains within an aliquots (Ng) increases (e.g., Wallinga, 2002; Rhodes, 2007; Buckland et al., 2019), we explored the possible influences of this effect on the resultant multi-grain De distributions measured from aeolian samples with weak OSL intensities by numerical simulation of heterogeneously-bleached dose distributions (e.g., Peng et al., 2020; Peng, 2021). The mean burial dose absorbed by the grains since their last exposure to sunlight (μa) was fixed as 0.1 Gy (i.e., close to the average CAM De determined in Figure 5), the mean baseline doses (μq) accumulated in the quartz grains prior to their last transport and depositional events was either 10 or 50 Gy, and the proportion of fully-bleached grains (p) was either 0.05, 0.5, or 0.95. The simulated De distributions with Ng values of 1, 10, and 200 are presented in Figures 6, 7, respectively, for two scenarios with μq values of 10 and 50 Gy.
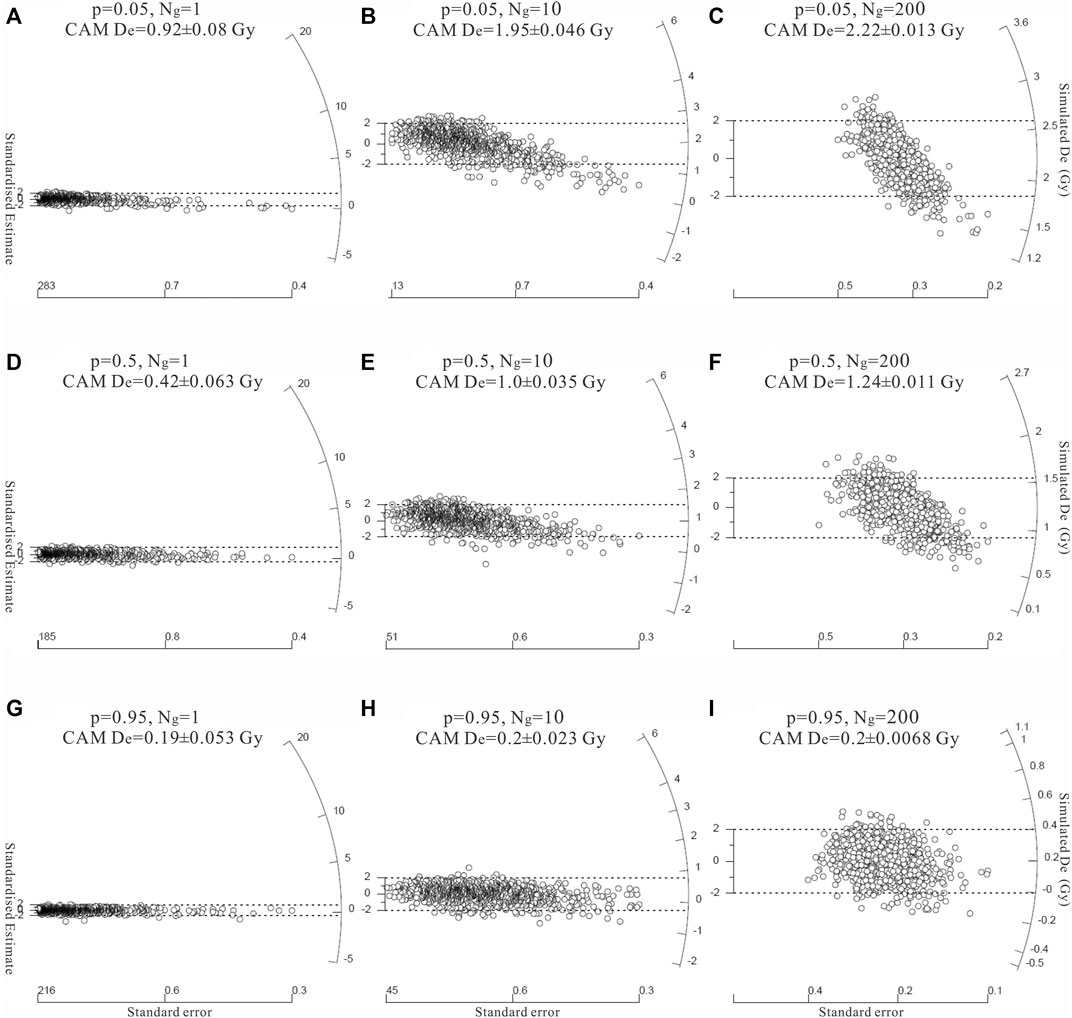
FIGURE 6. De distributions simulated using a burial dose of μa = 0.1 Gy and a baseline dose of μq = 10 Gy, for different proportions of fully-bleached grains (p) and different numbers of grains contained in an aliquot (Ng). Each subplot consists of 1,000 De values. The dashed lines indicate the two sigma range of the distribution.
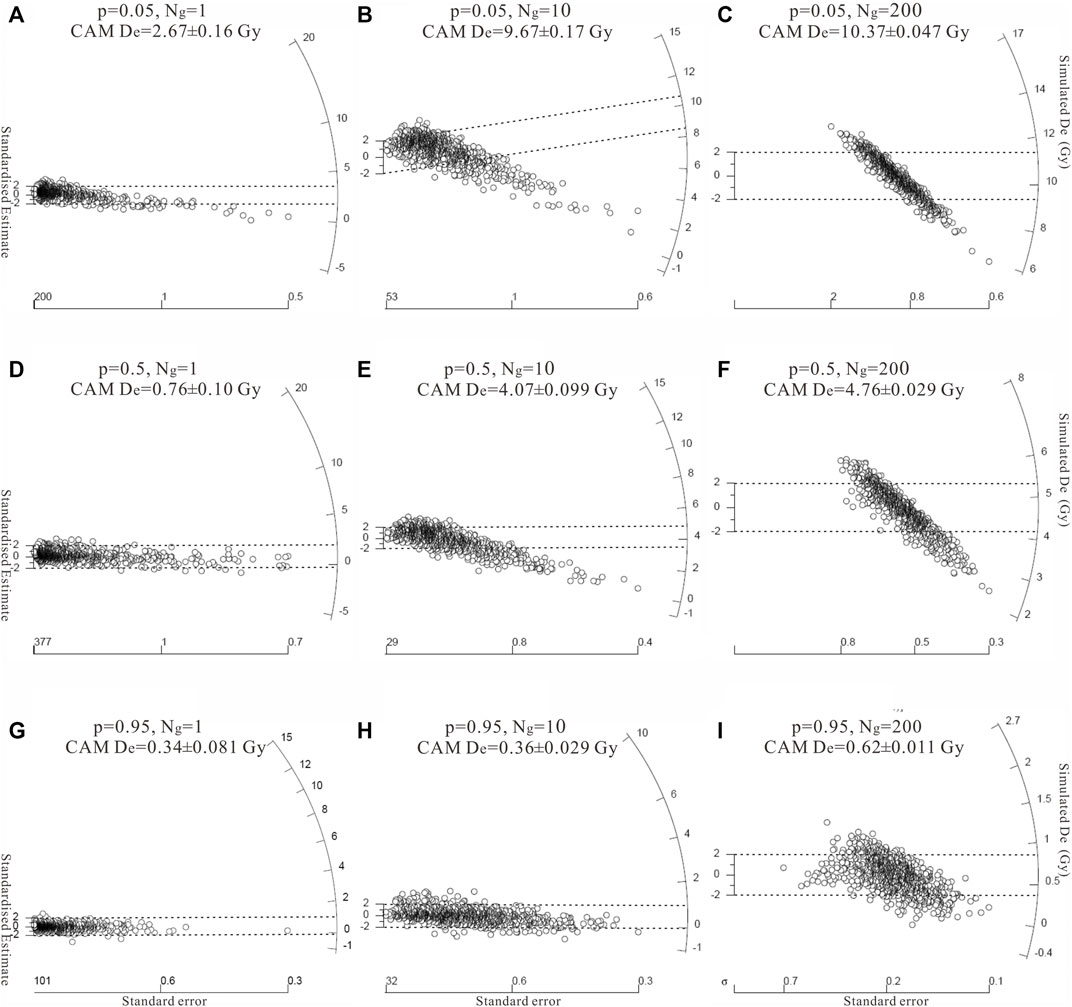
FIGURE 7. De distributions simulated using a burial dose of μa = 0.1 Gy and a baseline dose of μq = 50 Gy, for different proportions of fully-bleached grains (p) and different numbers of grains contained in an aliquot (Ng). Each subplot consists of 1,000 De values. The dashed lines indicate the two sigma range of the distribution.
We demonstrated in both scenarios that the standard errors of De values decrease dramatically while the CAM De estimates increase gradually as Ng increases (Figures 6, 7). In addition, in the cases of p = 0.05 and p = 0.5, the increase in CAM De estimates is more significant when Ng increases from 1 to 10 (compared to the situation of Ng increases from 10 to 200). By contrast, in the cases of p = 0.95, the increase in CAM De estimates is insignificant among Ng values of 1, 10, and 200. These demonstrate the non-linear variation of the “averaging” effect with p and Ng values. In both scenarios, the CAM De estimate decreases as p increases (Figures 6, 7). In the scenario of μq = 10 Gy, the single-grain CAM De estimate (Figure 6G) is consistent with multi-grain ones (Figures 6H,I) when p = 0.95. By contrast, in the scenario of μq = 50 Gy, the CAM De estimate increases slightly as Ng increases from 1 to 200 when p = 0.95 (Figures 7G–I). In addition, the CAM De estimates obtained from a smaller baseline dose are obviously lower than those obtained from a larger baseline dose; the maximum CAM De estimates are 2.22 ± 0.013 Gy and 10.37 ± 0.047 Gy, when μq = 10 Gy and μq = 50 Gy, respectively. These results demonstrate the strong influences of the baseline doses and the proportion of fully-bleached grains on the simulated dose distributions (Peng et al., 2020).
Discussion
A positive correlation was identified between Ln/Tn and corresponding SAR De in several samples (Figure 4), suggesting that these multi-grain aliquots might have been influenced by heterogeneous bleaching (e.g., Fan et al., 2013). However, we noted that it is improper to diagnose them as heterogeneously-bleached samples based solely on the Ln/Tn versus De plot. For example, although the natural OSL intensity of sample TDN15-1 is close to the background level (Figure 2B), an obvious positive relationship is observed between Ln/Tn and De (Figure 4B), suggesting the diagnosis method is inapplicable. This may because 1) the huge uncertainty of the calculated SAR De caused by poor counting statistics and 2) the “averaging” effect arising from the multi-grain results discount the usefulness of the Ln/Tn versus De plot; In the first situation, Ln/Tn and De values have large uncertainties and in the second situation, an increase of De as a function of Ln/Tn may merely result from the superposition of signals originated from different grains. Wallinga (2002) demonstrated that a correlation between natural OSL and associated De should only be expected for heterogeneously-bleached multi-grain samples when the OSL sensitivity of individual grains is similar. In addition, Fan et al. (2013) suggested that the Ln/Tn versus De plot is only applicable for the portion of the plot containing only positive De values. An alternative method for bleaching degree diagnosis is inspecting the De distribution, that is, tight De distributions are expected for undisturbed and fully-bleached samples (e.g., Olley et al., 2004; Arnold et al., 2009). The De distributions obtained using the SGC method demonstrate small between-aliquot variations and the resultant CAM De estimates are very small (Figure 5). However, it has been pointed out that the detection of heterogeneous bleaching based solely on this method may fail if a large number of grains are presented within an aliquot (e.g., Wallinga, 2002; Duller, 2008). Accordingly, it is best that the bleaching degree of OSL signals of multi-grain aliquots can be assessed using multiple methods.
Considering the abovementioned concerns on the detection of heterogeneous bleaching based on the multi-grain results presented here, we further applied a simulation approach to validate the bleaching degree of these samples. When a grain number of 200 (i.e., the expected minimum grain numbers for the measured aliquots of Figure 5) and a small baseline dose (10 Gy) were applied, the CAM De calculated using the simulated multi-grain aliquots were 2.22 ± 0.013 Gy (Figure 6C), 1.24 ± 0.011 Gy (Figure 6F), and 0.2 ± 0.0068 Gy (Figure 6I), respectively, if the proportion of fully-bleached grains are small (5%), moderate (50%), and large (95%). When a grain number of 200 and a relatively large baseline dose (50 Gy) were applied, the CAM De estimates were 10.37 ± 0.047 Gy (Figure 7C), 4.76 ± 0.029 Gy (Figure 7F), and 0.62 ± 0.011 Gy (Figure 7I), respectively. The measured De distributions containing both positive and negative De values and tight dose distributions (Figure 5B–l) are more similar to the one of Figure 6I simulated with a large proportion of fully-bleached grains and a small baseline dose. In addition, a small baselined dose and a proportion of fully-bleached grains of 50% (i.e., Figure 6F) yield a CAM De similar to the measured sample TDN6-4 (Figure 5A). These results validate that the measured multi-grain aliquots of Figure 5 (except TDN6-4) had small residual doses before the last exposure to sunlight and most of their grains (at least 95%) were fully bleached before deposition. Yang et al. (2020) reached a similar conclusion for their coarse-grained aeolian samples collected from the middle Hexi Corridor to the west of the Tengger Desert.
The bleaching of optically sensitive electrons within a quartz grain depends on both the transport medium and the deposition mechanism. The distance or time duration of transport (Spooner et al., 2001; Singhvi and Porat, 2008) and the deposition process (Rhodes, 2011; Fan et al., 2013) are two major factors influencing the bleaching degree of aeolian sediments, that is, a longer transport distance and a slower deposition rate enable higher degree of bleaching. Since most of the investigated aeolian samples were collected along the margin of the Tengger Desert (with relatively short transport distance), transport distance should not be a critical factor responsible for the good bleaching performance. A possible mechanism prompting a high degree of bleaching is that these near-surface samples have experienced strong wind-driven erosion/reworking processes before their final deposition. This is likely to occur in relatively high-energy environments characterized by intermittent strong winds such as the Tengger Desert (e.g., Fan et al., 2002; Lv et al., 2009; Zhang et al., 2014). The extremely high volume abundances in the uppermost part of the grain-size distributions (see Figure 1B) suggest that almost samples acquired their sorting characteristics in a high-energy environment. An already halted/deposited quartz grain will have a chance to be exposed to sunlight if it subsequently suffers from at least one cycle of erosion/reworking, which explains why the measured multi-grain De distributions can be successfully reproduced by the simulation model fed with a small baseline dose. Rhodes (2011) emphasized the importance of total transport time and the repeated burst of movement interspersed with temporary shallow burial or halts on the bleaching of grains and pointed out that the last transport event before the final deposition is not necessarily the most important if the grain has been exposed for sufficient duration during previous movement/rework. In addition, the negligible volume abundances of fine particles contained within almost aeolian samples (Figure 1B) suggest that the bleaching of these coarse grains might have not been severely influenced by the phenomena of aggregation (or the adhering of fine particles to coarser ones) (e.g., Derbyshire et al., 1998) which impedes the bleaching of aggregated grains by attenuating of sunlight during transportation.
Conclusion
The bleaching degree of multi-grain coarse quartz OSL signals from the margin of the Tengger Dessert was investigated by both empirical analysis and numerical validation. The tight De distributions and small De values indicate that these multi-grain aliquots may have been fully bleached before deposition. A numerical modelling method is able to reproduce multi-grain De distributions similar to the measured ones only if the vast majority of the grains within an aliquot are fully bleached and the baseline dose is relatively small during the simulation. These results reassure us to strengthen the conclusion that most investigated samples are fully bleached before deposition, which may be explained by the wind-driven erosion/reworking of the already stopped near-surface sediments and/or the absence of severe aggregation of grains.
Data Availability Statement
The raw data supporting the conclusions of this article will be made available by the authors, without undue reservation.
Author Contributions
HM conceptualized the study, conducted the investigation and visualization, and wrote the original draft. JP conducted the investigation and visualization, performed the numerical simulation, and edited the manuscript. ZL conducted the investigation and visualization, reviewed the manuscript. YS conducted the investigation and visualization, and performed the formal analysis. TF edited and reviewed the manuscript.
Funding
This study was supported by the National Natural Science Foundation of China (Grant No. 41701004) and the Natural Science Foundation of Hunan Province, China (Grant No. 2020JJ5162).
Conflict of Interest
The authors declare that the research was conducted in the absence of any commercial or financial relationships that could be construed as a potential conflict of interest.
Publisher’s Note
All claims expressed in this article are solely those of the authors and do not necessarily represent those of their affiliated organizations, or those of the publisher, the editors and the reviewers. Any product that may be evaluated in this article, or claim that may be made by its manufacturer, is not guaranteed or endorsed by the publisher.
Acknowledgments
We appreciate both reviewers for their valuable comments which allow us to improve the quality of the manuscript.
References
Arnold, L. J., Roberts, R. G., Galbraith, R. F., and DeLong, S. B. (2009). A Revised Burial Dose Estimation Procedure for Optical Dating of Youngand Modern-Age Sediments. Quat. Geochronol. 4 (4), 306–325. doi:10.1016/j.quageo.2009.02.017
Bailey, S. D., Wintle, A. G., Duller, G. A. T., and Bristow, C. S. (2001). Sand Deposition during the Last Millennium at Aberffraw, Anglesey, North Wales as Determined by OSL Dating of Quartz. Quat. Sci. Rev. 20 (5–9), 701–704. doi:10.1016/s0277-3791(00)00053-6
Ballarini, M., Wallinga, J., Murray, A. S., van Heteren, S., Oost, A. P., Bos, A. J. J., et al. (2003). Optical Dating of Young Coastal Dunes on a Decadal Time Scale. Quat. Sci. Rev. 22 (10–13), 1011–1017. doi:10.1016/s0277-3791(03)00043-x
Banerjee, D., Murray, A. S., Bøtter-Jensen, L., and Lang, A. (2001). Equivalent Dose Estimation Using a Single Aliquot of Polymineral Fine Grains. Radiat. Meas. 33 (1), 73–94. doi:10.1016/s1350-4487(00)00101-3
Buckland, C. E., Bailey, R. M., and Thomas, D. S. G. (2019). Using Post-IR IRSL and OSL to Date Young (< 200 Yrs) Dryland Aeolian Dune Deposits. Radiat. Meas. 126, 106131. doi:10.1016/j.radmeas.2019.106131
Costas, I., Reimann, T., Tsukamoto, S., Ludwig, J., Lindhorst, S., Frechen, M., et al. (2012). Comparison of OSL Ages from Young Dune Sediments with a High-Resolution Independent Age Model. Quat. Geochronol. 10, 16–23. doi:10.1016/j.quageo.2012.03.007
Derbyshire, E., Meng, X., and Kemp, R. A. (1998). Provenance, Transport and Characteristics of Modern Aeolian Dust in Western Gansu Province, China, and Interpretation of the Quaternary Loess Record. J. Arid Environ. 39 (3), 497–516. doi:10.1006/jare.1997.0369
Duller, G. A. T. (2008). Single-grain Optical Dating of Quaternary Sediments: Why Aliquot Size Matters in Luminescence Dating. Boreas 37 (4), 589–612. doi:10.1111/j.1502-3885.2008.00051.x
Fan, H. W., Xiao, H. L., Duan, Z. H., Li, X. R., Li, T., and Li, J. G. (2002). Dustfall Characteristics and Affect Factors in Chinese Desert Region. J. Desert Res. 22 (6), 559–565. (In Chinese).
Fan, T. L., Fan, Y. X., Zhao, H., Chen, F. H., and Lai, Z. P. (2013). Investigations on the Degree of Bleaching of Quartz OSL Signals Using Modern Aeolian Dust from Western Loess Plateau, China. Geochronometria 40 (3), 165–176. doi:10.2478/s13386-013-0112-y
Fan, Y. X., Zhang, Q. S., Cai, Q. S., Gao, M. M., Yan, X. Y., and Yang, G. L. (2022). OSL Chronology of Sediments in the Tengger Sandy Desert and its Indication to Aeolian Sand Source and Desertification Mechanism. Quat. Sci. 42 (2), 350–367. (In Chinese). doi:10.11928/j.issn.1001-7410.2022.02.03
Fu, X., Li, S. H., and Li, B. (2015). Optical Dating of Aeolian and Fluvial Sediments in North Tian Shan Range, China: Luminescence Characteristics and Methodological Aspects. Quat. Geochronol. 30, 161–167. doi:10.1016/j.quageo.2015.03.001
Galbraith, R. F. (1988). Graphical Display of Estimates Having Differing Standard Errors. Technometrics 30 (3), 271–281. doi:10.1080/00401706.1988.10488400
Galbraith, R. F., Roberts, R. G., Laslett, G. M., Yoshida, H., and Olley, J. M. (1999). Optical Dating of Single and Multiple Grains of Quartz from Jinmium Rock Shelter, Northern Australia: Part I, Experimental Design and Statistical Models. Archaeometry 41 (2), 339–364. doi:10.1111/j.1475-4754.1999.tb00987.x
Goble, R. J., Mason, J. A., Loope, D. B., and Swinehart, J. B. (2004). Optical and Radiocarbon Ages of Stacked Paleosols and Dune Sands in the Nebraska Sand Hills, USA. Quat. Sci. Rev. 23 (9–10), 1173–1182. doi:10.1016/j.quascirev.2003.09.009
Godfrey-Smith, D. I., Huntley, D. J., and Chen, W. H. (1988). Optical Dating Studies of Quartz and Feldspar Sediment Extracts. Quat. Sci. Rev. 7 (3–4), 373–380. doi:10.1016/0277-3791(88)90032-7
Gong, Z. J., Li, S. H., Sun, J. M., and Xue, L. (2013). Environmental Changes in Hunshandake (Otindag) Sandy Land Revealed by Optical Dating and Multi-Proxy Study of Dune Sands. J. Asian Earth Sci. 76, 30–36. doi:10.1016/j.jseaes.2013.07.035
Hu, G. M., and Li, S. H. (2019). Simplified Procedures for Optical Dating of Young Sediments Using Quartz. Quat. Geochronol. 49, 31–38. doi:10.1016/j.quageo.2018.03.009
Hu, G., Zhang, J. F., Qiu, W. L., and Zhou, L. P. (2010). Residual OSL Signals in Modern Fluvial Sediments from the Yellow River (HuangHe) and the Implications for Dating Young Sediments. Quat. Geochronol. 5 (2–3), 187–193. doi:10.1016/j.quageo.2009.05.003
Li, S. H., Sun, J. M., and Zhao, H. (2002). Optical Dating of Dune Sands in the Northeastern Deserts of China. Palaeogeogr. Palaeoclimatol. Palaeoecol. 181 (4), 419–429. doi:10.1016/s0031-0182(01)00443-6
Li, G. Q., Jin, M., Wen, L. J., Zhao, H., Madsen, D., Liu, X. K., et al. (2014). Quartz and K-Feldspar Optical Dating Chronology of Eolian Sand and Lacustrine Sequence from the Southern Ulan Buh Desert, NW China: Implications for Reconstructing Late Pleistocene Environmental Evolution. Palaeogeogr. Palaeoclimatol. Palaeoecol. 393, 111–121. doi:10.1016/j.palaeo.2013.11.003
Li, B., Jacobs, Z., Roberts, R. G., Galbraith, R., and Peng, J. (2017). Variability in Quartz OSL Signals Caused by Measurement Uncertainties: Problems and Solutions. Quat. Geochronol. 41, 11–25. doi:10.1016/j.quageo.2017.05.006
Li, S. H. (2001). Identification of Well-Bleached Grains in the Optical Dating of Quartz. Quat. Sci. Rev. 20 (12), 1365–1370. doi:10.1016/s0277-3791(00)00156-6
Lian, O. B., and Huntley, D. J. (1999). Optical Dating Studies of Postglacial Aeolian Deposits from the South-Central Interior of British Columbia, Canada. Quat. Sci. Rev. 18 (13), 1453–1466. doi:10.1016/s0277-3791(98)00085-7
Long, H., Tsukamoto, S., Buylaert, J.-P., Murray, A. S., Jain, M., and Frechen, M. (2019). Late Quaternary OSL Chronologies from the Qinghai Lake (NE Tibetan Plateau): Inter-comparison of Quartz and K-Feldspar Ages to Assess the Pre-depositional Bleaching. Quat. Geochronol. 49, 159–164. doi:10.1016/j.quageo.2018.05.003
Lv, P., Dong, Z. B., Zhang, Z. C., and Zhao, A. G. (2009). Characteristics of Wind Velocity, Temperature and Humidity Profiles of Near-Surface Layer in Tengger Desert. J. Desert Res. 29 (5), 977–981. (In Chinese).
Mahadev, R., Singh, A. K., and Jaiswal, M. K. (2019). Application of Luminescence Age Models to Heterogeneously Bleached Quartz Grains from Flood Deposits in Tamilnadu, Southern India: Reconstruction of Past Flooding. Quat. Int. 513, 95–106. doi:10.1016/j.quaint.2019.02.037
Murray, A. S., and Wintle, A. G. (2000). Luminescence Dating of Quartz Using an Improved Single-Aliquot Regenerative-Dose Protocol. Radiat. Meas. 32 (1), 57–73. doi:10.1016/s1350-4487(99)00253-x
Olley, J. M., Pietsch, T., and Roberts, R. G. (2004). Optical Dating of Holocene Sediments from a Variety of Geomorphic Settings Using Single Grains of Quartz. Geomorphology 60 (3–4), 337–358. doi:10.1016/j.geomorph.2003.09.020
Ou, X. J., Duller, G. A. T., Roberts, H. M., Zhou, S. Z., Lai, Z. P., Chen, R., et al. (2015). Single Grain Optically Stimulated Luminescence Dating of Glacial Sediments from the Baiyu Valley, Southeastern Tibet. Quat. Geochronol. 30, 314–319. doi:10.1016/j.quageo.2015.02.018
Peng, J. (2021). Analyzing Statistical Age Models to Determine the Equivalent Dose and Burial Age Using a Markov Chain Monte Carlo Method. Geochronometria 48, 147–160. doi:10.1515/geochr-2015-0114
Peng, J., Dong, Z. B., Han, F. Q., Long, H., and Liu, X. J. (2013). R Package numOSL: Numeric Routines for Optically Stimulated Luminescence Dating. Anc. TL 31 (2), 41–48. Available at: https://CRAN.R-project.org/package=numOSL.
Peng, J., Dong, Z. B., Han, F. Q., and Gao, L. (2016). Aeolian Activity in the South Margin of the Tengger Desert in Northern China since the Late Glacial Period Revealed by Luminescence Chronology. Palaeogeogr. Palaeoclimatol. Palaeoecol. 457, 330–341. doi:10.1016/j.palaeo.2016.06.028
Peng, J., Li, B., and Jacobs, Z. (2020). Modelling Heterogeneously Bleached Single-Grain Equivalent Dose Distributions: Implications for the Reliability of Burial Dose Determination. Quat. Geochronol. 60, 101108. doi:10.1016/j.quageo.2020.101108
Peng, J., and Li, B. (2017). Single-aliquot Regenerative-Dose (SAR) and Standardised Growth Curve (SGC) Equivalent Dose Determination in a Batch Model Using the R Package “numOSL”. Anc. TL 35 (2), 32–53.
Peng, J., Wang, X. L., Yin, G. M., Adamiec, G., Du, J. H., Zhao, H., et al. (2022). Accumulation of Aeolian Sediments Around the Tengger Desert during the Late Quaternary and its Implications on Interpreting Chronostratigraphic Records from Drylands in North China. Quat. Sci. Rev. 275, 107288. doi:10.1016/j.quascirev.2021.107288
Pietsch, T. J. (2009). Optically Stimulated Luminescence Dating of Young (<500 Years Old) Sediments: Testing Estimates of Burial Dose. Quat. Geochronol. 4 (5), 406–422. doi:10.1016/j.quageo.2009.05.013
Qiang, M. R., Chen, F. H., Wang, Z. T., Niu, G. M., and Song, L. (2010). Aeolian Deposits at the Southeastern Margin of the Tengger Desert (China): Implications for Surface Wind Strength in the Asian Dust Source Area over the Past 20,000 Years. Palaeogeogr. Palaeoclimatol. Palaeoecol. 286 (1–2), 66–80. doi:10.1016/j.palaeo.2009.12.005
Rhodes, E. (2007). Quartz Single Grain OSL Sensitivity Distributions: Implications for Multiple Grain Single Aliquot Dating. Geochronometria 26, 19–29. doi:10.2478/v10003-007-0002-5
Rhodes, E. J. (2011). Optically Stimulated Luminescence Dating of Sediments over the Past 200,000 Years. Annu. Rev. Earth Planet. Sci. 39, 461–488. doi:10.1146/annurev-earth-040610-133425
Roberts, H. M., and Duller, G. A. T. (2004). Standardised Growth Curves for Optical Dating of Sediment Using Multiple-Grain Aliquots. Radiat. Meas. 38 (2), 241–252. doi:10.1016/j.radmeas.2003.10.001
Singarayer, J. S., Bailey, R. M., Ward, S., and Stokes, S. (2005). Assessing the Completeness of Optical Resetting of Quartz OSL in the Natural Environment. Radiat. Meas. 40 (1), 13–25. doi:10.1016/j.radmeas.2005.02.005
Singhvi, A. K., and Porat, N. (2008). Impact of Luminescence Dating on Geomorphological and Palaeoclimate Research in Drylands. Boreas 37 (4), 536–558. doi:10.1111/j.1502-3885.2008.00058.x
Spooner, N. A., Olley, J. M., Questiaux, D. G., and Chen, X. Y. (2001). Optical Dating of an Aeolian Deposit on the Murrumbidgee Floodplain. Quat. Sci. Rev. 20 (5–9), 835–840. doi:10.1016/s0277-3791(00)00032-9
Stokes, S., Bailey, R. M., Fedoroff, N., and O’Marah, K. E. (2004). Optical Dating of Aeolian Dynamism on the West African Sahelian Margin. Geomorphology 59 (1–4), 281–291. doi:10.1016/j.geomorph.2003.07.021
Tissoux, H., Valladas, H., Voinchet, P., Reyss, J. L., Mercier, N., Falguères, C., et al. (2010). OSL and ESR Studies of Aeolian Quartz from the Upper Pleistocene Loess Sequence of Nussloch (Germany). Quat. Geochronol. 5 (2–3), 131–136. doi:10.1016/j.quageo.2009.03.009
Vermeesch, P. (2009). RadialPlotter: A Java Application for Fission Track, Luminescence and Other Radial Plots. Radiat. Meas. 44 (4), 409–410. doi:10.1016/j.radmeas.2009.05.003
Wallinga, J. (2002). On the Detection of OSL Age Overestimation Using Single-Aliquot Techniques. Geochronometria 21, 17–26.
Wintle, A. G. (1993). Luminescence Dating of Aeolian Sands: An Overview. Geol. Soc. Lond. Spec. Publ. 72 (1), 49–58. doi:10.1144/gsl.sp.1993.072.01.06
Yang, L. H., Long, H., Cheng, H. Y., Hu, G. Y., Duan, H. C., and Zhao, H. (2020). Historical Settlement Abandonment in the Middle Hexi Corridor Linked to Human-Induced Desertification. Palaeogeogr. Palaeoclimatol. Palaeoecol. 545, 10963. doi:10.1016/j.palaeo.2020.109634
Yi, S. W., Buylaert, J. P., Murray, A. S., Thiel, C., Zeng, L., and Lu, H. Y. (2015). High Resolution OSL and Post-IR IRSL Dating of the Last Interglacial-Glacial Cycle at the Sanbahuo Loess Site (Northeastern China). Quat. Geochronol. 30, 200–206. doi:10.1016/j.quageo.2015.02.013
Yin, G. M., Wang, X. L., and Han, F. (2013). The Age of the Shapotou Desert Expansion Based on OSL Ages of Aeolian Sediments in the Yellow River Terraces, Ningxia Hui Autonomous Region, Northern China. Quat. Sci. 33 (2), 269–275. (In Chinese).
Zhang, J. F., Zhou, L. P., and Yue, S. Y. (2003). Dating Fluvial Sediments by Optically Stimulated Luminescence: Selection of Equivalent Doses for Age Calculation. Quat. Sci. Rev. 22 (10–13), 1123–1129. doi:10.1016/s0277-3791(03)00054-4
Zhang, Z. C., Dong, Z. B., Wen, Q., and Jiang, C. W. (2014). Wind Regimes and Aeolian Geomorphology in the Western and Southwestern Tengger Desert, NW China. Geol. J. 50 (6), 707–719. doi:10.1002/gj.2586
Zhao, H., Chen, F. H., Li, S. H., Wintle, A. G., Fan, Y. X., and Xia, D. S. (2007). A Record of Holocene Climate Change in the Guanzhong Basin, China, Based on Optical Dating of a Loess-Palaeosol Sequence. Holocene 17 (7), 1015–1022. doi:10.1177/0959683607080530
Keywords: quartz OSL dating, multi-grain aliquots, aeolian sediments, bleaching degree, tengger desert
Citation: Mo H, Peng J, Li Z, Song Y and Feng T (2022) On the Bleaching Degree of Multi-Grain Coarse Quartz OSL Signal of Near-Surface Aeolian Sediments Around the Tengger Desert: Empirical Investigation and Numerical Validation. Front. Earth Sci. 10:922692. doi: 10.3389/feart.2022.922692
Received: 18 April 2022; Accepted: 24 May 2022;
Published: 16 June 2022.
Edited by:
Hao Long, Nanjing Institute of Geography and Limnology (CAS), ChinaCopyright © 2022 Mo, Peng, Li, Song and Feng. This is an open-access article distributed under the terms of the Creative Commons Attribution License (CC BY). The use, distribution or reproduction in other forums is permitted, provided the original author(s) and the copyright owner(s) are credited and that the original publication in this journal is cited, in accordance with accepted academic practice. No use, distribution or reproduction is permitted which does not comply with these terms.
*Correspondence: Jun Peng, pengjun10@mails.ucas.ac.cn