Syn-Eruptive Processes During the January–February 2019 Ash-Rich Emissions Cycle at Mt. Etna (Italy): Implications for Petrological Monitoring of Volcanic Ash
 Claudia D’Oriano1*
  Paola Del Carlo1
  Daniele Andronico2
  Raffaello Cioni3
  Pietro Gabellini3
  Antonio Cristaldi2
  Massimo Pompilio1
- 1Istituto Nazionale di Geofisica e Vulcanologia—Sezione di Pisa, Pisa, Italy
- 2Istituto Nazionale di Geofisica e Vulcanologia—Sezione di Catania-Osservatorio Etneo, Catania, Italy
- 3Dipartimento di Scienze della Terra, Università di Firenze, Florence, Italy
Low-intensity emission of volcanic ash represents the most frequent eruptive activity worldwide, spanning the whole range of magma compositions, from basalts to rhyolites. The associated ash component is typically characterized by heterogeneous texture and chemical composition, leading to misinterpretation of the role of syn-eruptive processes, such as cooling and degassing during magma ascent or even magma fragmentation. Despite their low intensity, the ash emission eruptions can be continuous for enough time to create problems to health and life networks of the communities all around the volcano. The lack of geophysical and/or geochemical precursor signals makes the petrological monitoring of the emitted ash the only instrument we have to understand the leading mechanisms and their evolution. Formation of low-level plumes related to ash-rich emissions has increasingly become a common eruptive scenario at Mt. Etna (Italy). In January–February 2019, an eruptive cycle of ash-rich emissions started. The onset of this activity was preceded on 24 December 2018 by a powerful Strombolian-like eruption from a fissure opened at the base of the New Southeast Crater. A lava flow from the same fissure and an ash-rich plume, 8–9 km high a.s.l., from the crater Bocca Nuova occurred concurrently. After about 4 weeks of intra-crater strombolian-like activity and strong vent degassing at summit craters, starting from 23 January 2019, at least four episodes of ash-rich emissions were recorded, mainly issued from the Northeast Crater. The episodes were spaced in time every 4–13 days, each lasting about 3–4 days, with the most intense phases of few hours. They formed weak plumes, up to 1 km high above the crater, that were rapidly dispersed toward different directions by dominant winds and recorded up to a distance of 30 km from the vent. By combining observations on the deposits with data on textural and chemical features of the ash components, we were able to discriminate between clasts originated from different crater sources and suggest an interpretive model for syn-eruptive processes and their evolution. Data indicate the occurrence of scarce (<10 vol.%) fresh juvenile material, including at least four groups of clasts with marked differences in microlite content and number density, and matrix glasses and minerals composition. Moreover, a large amount of non-juvenile clasts has been recognized, particularly abundant at the beginning of each episode. We propose that the low amount of juvenile ash results from episodic fast ascent of small magma batches from shallow reservoirs, traveling within a slow rising magma column subjected to cooling, degassing, and crystallization. The large number of non-juvenile clasts deriving from the thick crater infill of variably sealed or thermally altered material at the top of the magma column is suggested to contribute to the ash generation. The presence of a massive, granular crater infilling accumulating in the vent area may contribute to buffer the different geophysical signals associated with the active magma fragmentation process during the low-energy ash eruptions, as already evidenced at other volcanoes.
1 Introduction
Continuous ash emission is a common type of low-intensity explosive activity at many volcanoes worldwide, regardless of their magma composition. It can be associated with dome-forming Vulcanian eruptions at rhyolitic and andesitic volcanoes (e.g., Volcano de Colima, Mexico: Cassidy et al., 2015; Sakuraijima, Japan: Miwa et al., 2013), with phreatomagmatic phases at andesitic volcanoes (e.g., Tongagiro, New Zealand: Pardo et al., 2014), with intense ash emissions at andesitic volcanoes (e.g., Tungurahua, Ecuador: Parra et al., 2016; Copahue volcano, Chile: Hantusch et al., 2021), and with basaltic explosive eruptions (e.g., at Fuego, Guatemala: Waite et al., 2013; Nadeau et al., 2011; at Etna, Italy: Taddeucci et al., 2002, 2004; Andronico et al., 2008; Corsaro et al., 2017; Polacci et al., 2019; at Stromboli, Italy: Ripepe et al., 2005; Polacci et al., 2009; Lautze et al., 2012; at Kilauea, Hawaii: Dvorak, 1992; Mastin 1997; Neal et al., 2019; at Piton de la Fournaise, La Reunion: Michon et al., 2007; Michon et al., 2013; Staudacher et al., 2009, 2016; Ort et al., 2016). In all the different contexts, products related to this eruption style share similar textural and compositional features of the ash component, which is always characterized by a large heterogeneity in terms of morphology, crystallinity, and glass composition (Cassidy et al., 2015; Leibrant and Le Pennec, 2015; Thivet et al., 2020; Edwards et al., 2021). This makes it challenging to correlate the observed properties of the different ash fragments with the complex processes of ascent, degassing-induced crystallization, and fragmentation of a juvenile magma batch rising to the surface. At Mt. Etna, continuous ash emissions represent the less violent, long-lasting, and poorly understood explosive activity. Unlike the lava fountains, which can be predicted by the infrasonic network up to an hour earlier (Ripepe et al., 2018), the low-to-mild ash emissions are characterized by the absence of clear geophysical and geochemical precursors (Andronico et al., 2013; Polacci et al., 2019). However, despite their low intensity, this type of eruptions can induce problems to the ordinary human life and the environment, such as the airport closures (e.g., Andronico et al., 2014) and health effects related to inhalation of fine ash transported by the wind or resuspended in an urbanized environment (e.g., Andronico and Del Carlo, 2016; Horwell et al., 2017). It is clear that the impact of this type of activity is strongly linked to their duration. For this reason, it is important to understand what are the processes that drive these eruptions and how they evolve over time.
In this study, we present a detailed analysis of a time series of samples erupted at Etna during a prolonged ash emission activity issued from the summit craters between January and February 2019. We refer to this period of activity as to an eruptive cycle, in which a sequence of episodic ash emissions occurred, almost equally arranged in intensity and duration. We also analyze the products of the powerful Strombolian-like eruption that occurred on 24 December 2018 from a lateral fissure at the base of the New Southeast Crater and the contemporaneous activity at summit craters, which preceded the starting of the January–February 2019 ash emission cycle by 1 month. Based on grain size distribution data, morphologic and componentry analyses, mineral and groundmass glass composition, and plagioclase microlites size distribution of the ash particles, we discuss the temporal evolution of the processes driving this complex eruptive cycle. Results also outline some interesting aspects related to the petrological monitoring of this low-to-mid intensity ash emission, showing in detail how changes in the magma decompression rate correlate with eruption intensification, distinguishing between gas- and magma recharge-driven eruptive phases.
2 Volcanological Setting
Mt. Etna is one of most active basaltic volcanoes, showing a large spectrum of mid-intensity eruptions and ranging in style from Strombolian-like explosive eruption to variably intense lava fountains issued from the summit craters, to flank eruptions usually producing extensive lava flow fields (Andronico et al., 2021). Four craters, namely Northeast Crater (NEC), Voragine (VOR), Bocca Nuova (BN), and Southeast Crater (SEC) are present in the summit area (Figure 1A), characterized by quasi continuous degassing and a sporadic intra-crater eruptive activity. The so-called New Southeast Crater (NSEC) is the cone grown at the base of the SEC from 2011 and was active until 2020, when NSEC and SEC merged into a single large cone after the thick accumulation of the erupted material in the preceding years. The impossibility to discriminate the activity of these two cones led to their rename as SEC the whole SEC-NSEC apparatus since November 2020. In this study, however, we will use the name NSEC to avoid confusion with the related literature (Acocella et al., 2016; Cappello et al., 2019).
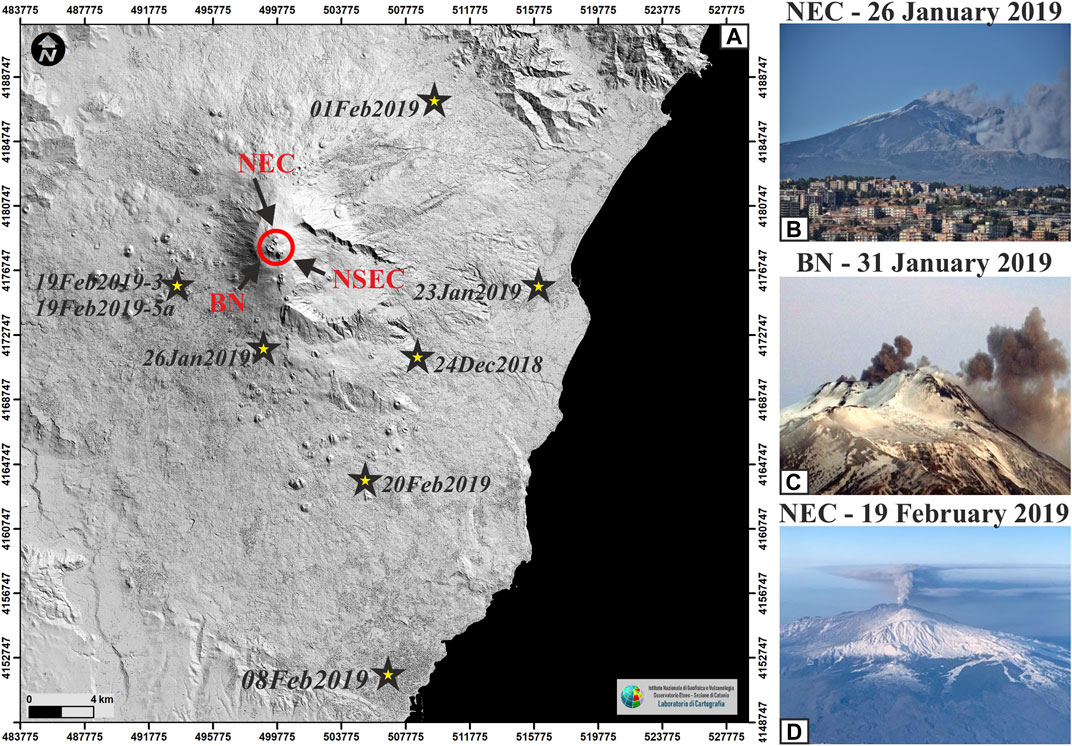
FIGURE 1. (A) DEM (digital elevation model; modified after Gwinner et al., 2006) of Mt. Etna volcano with active vents (red circle). STARS correspond to sampling sites; (B–D) representative pictures of the studied activity at NEC (B,D) and BN (C). NEC = Northeast Crater; BN = Bocca Nuova; NSEC = New Southeast Crater.
NEC is the highest summit crater of Mt. Etna; it is funnel-shaped with a depth of at least 100 m and a diameter of 80–100 m, which narrows to a few tens of meters toward the lower base. The inner walls of NEC are often affected by surface landslides. This crater has been active since 1911 and generated its latest paroxysms in 1995–1996 and in 1998 (Behncke et al., 2005; Allard et al., 2006; Slatcher et al., 2015; Corsaro et al., 2017). The products emitted by the summit craters, after the renewal of the magmatic activity in 1995 until the end of 1998, have minor, although significant, differences (Corsaro and Pompilio, 2004). Bombs and lava flows from SEC and NEC are more evolved than those from the other craters (BN and VOR), with the latter showing relatively higher content of MgO, CaO, and FeOtot and lower Al2O3 and alkali. The relatively higher degree of evolution of the products of the SEC and NEC is possibly related to the development of very shallow magma reservoirs (Corsaro et al., 2013). After 1998, the activity at NEC has been characterized by frequent intra-crater Strombolian-like eruptions, ash-rich emissions, and open vent degassing. At least since 2004, this crater produced mainly a steady continuous to pulsating degassing, making this crater the biggest gas producer of Mt. Etna (La Spina et al., 2010; Andronico et al., 2013). Typical ash-rich eruptions from NEC are characterized by the emission of reddish ash and steam, forming diluted, thin, weak plumes reaching only 100–300 m of altitude and then becoming bent by the winds (Andronico et al., 2013; Edwards et al., 2018).
3 Chronology of the Activity and Studied Samples
On 29 November 2018, an increase in activity occurred at the summit craters of Mt. Etna, with the beginning of sporadic lava effusions from a vent opened along the eastern base of NSEC (Laiolo et al., 2019). Satellite observations tracked the persistence of the lava overflow from the NSEC, producing short flows toward the ESE direction (maximum length of ca. 0.7 km, on 21 December 2018). The effusive episodes at NSEC were accompanied by a simultaneous explosive activity at BN and NEC (Laiolo et al., 2019).
3.1 The 24 December 2018 Eruption
An eruptive fissure opened at an elevation of about 3,000 m on the lower SE flank of the NSEC around noon on 24 December 2018, heralded by a seismic swarm (Laiolo et al., 2019; Borzì et al., 2020; Calvari et al., 2020). This event resulted in a powerful Strombolian-like explosive activity and, almost simultaneously, an intense ash emission at BN, forming an eruption column rising up to 8–9 km above sea level. Significant ash emission occurred as well from the flank fissure, peaking in the first 2.5 h and then decreasing significantly only after 8 h. The analysis of surveillance videos from Istituto Nazionale di Geofisica e Vulcanologia, Osservatorio Etneo (INGV-OE) and social networks indicates that two plumes were formed above the eruptive fissure and BN, respectively, and both were dispersed approximately in the same direction (ESE to SE), possibly producing two overlapping deposits. Meanwhile, the fissure propagated downward issuing lava flows from different portions. The paroxysmal phase of the flank eruption lasted just 3 h, followed by a minor Strombolian activity from the summit of NSEC. A decreasing effusive activity continued up to the definitive end of the eruption, in the morning of 27 December. The end of the flank eruption was accompanied by the cessation of the activity at the effusive fissure and the reactivation of the explosive activity from the summit vents (Laiolo et al., 2019). A cumulative tephra sample, representative of both the ash emission from BN and the Strombolian-like activity from the fissure at the base of NSEC (24Dec2018 sample; Figure 1A), was collected at Zafferana Etnea, 10 km far from the craters, and analyzed in this study.
3.2 Ash Emission Activity of January–February 2019
In the period 11–22 January 2019, the volcanic activity was characterized by persistent degassing associated with intra-crater Strombolian-like explosions, mainly localized at BN and NEC, and by small and discontinuous ash emissions from the same craters. Starting from 23 January, at least three episodes of ash emission took place at NEC and one at BN, each lasting about a few days, peaking in one or more most energetic phases of only a few hours. On the whole, this activity was not preceded or accompanied by an increase of volcanic tremor amplitude or any anomalies in the gas emissions, both remaining around mid–low values, with oscillation toward highest ranges just coinciding with the ash emission (INGV-OE, 2018, 25/12/2018–26/02/20191).
The activity formed pulsating, not-sustained, weak plumes, usually not exceeding 1 km above the vent and rapidly advected laterally by the wind (Figures 1B–D). Because of the prolonged injection of fine volcanic particles in the atmosphere, some episodes of ash emission directed to the S caused the occasional closure of the international airport of Catania, ∼32 km far from the NEC. The estimated ground loadings per unit area were markedly variable, ranging from 40 to 150 g/m2 and from <1 to 10 g/m2 at 7 km and 15–30 km far from the vent, respectively. In the most proximal sites, the longest episodes formed a continuous cover of ash on the ground.
In detail, on 23 January, the monitoring network of INGV-OE recorded an ash emission at 10:04 (all times given as UTC) from NEC, with an ENE dispersal causing ash fallout in Giarre (23Jan2019 sample; Figure 1A). This activity showed a pulsating behavior until 26 January, when an intensification of the ash emission occurred (26Jan2019 sample; Figures 1A,B) and continued with a strong intermittent character until 27 January. On 28 January, an ash emission started from BN. This activity gradually reduced in intensity in the following 2 days, becoming highly discontinuous and stopping in the night of 31 January (01Feb2019 sample; Figures 1A,C). During this period, the activity at NEC was weak and produced occasional, highly diluted ash emissions. The second prolonged episode of ash emission from NEC started on 8 February at 07:36, with intensification in first few hours of the day. The ash was dispersed toward the southeast sector of the volcano, reaching the city of Catania (08Feb2019 sample), 27 km far from the vent (Figure 1A). This episode lasted for 2 days, until 10 February, with two phases of intense ash emissions on 9 February at 06:01 and on 10 February at 06:36, respectively, and afterward the activity declined. The ash emission from NEC resumed again on 14 February and dispersed toward SSW. This activity also continued for few days, with intensifications on 17, 19 (Figure 1D), and 20 February (20Feb2019 sample) followed by a decrease until the ending of the activity on 21 February. A field survey on 19 February at Piano Fiera, 7 km W from the summit craters, resulted in the collection of two additional samples: a sample from the 19 February activity (19Feb2019-3 sample) was collected on a previously cleaned horizontal surface, while a second sample was collected directly from the snow (19Feb2019-5a sample), possibly representing the cumulative deposit of the first few days of the last episode.
In summary, during the January–February 2019 cycle of activity, four eruptive episodes of unsteady ash emission, each lasting up to 3–4 days, occurred: three from NEC (23–27 January; 8–10 February; and 14–21 February) and one from BN (28–31 January). Sampled deposits are considered to be representatives of the most intense phases of the ash emission activity, roughly corresponding to the beginning (23 January and 8 February) and the middle to end (26 January and 19–20 February) of each episode (Table 1). Samples from 01Feb2019 and 19Feb2019-5a can be considered cumulative of the entire episodes at BN and of the first phases of the third episode at NEC, respectively.
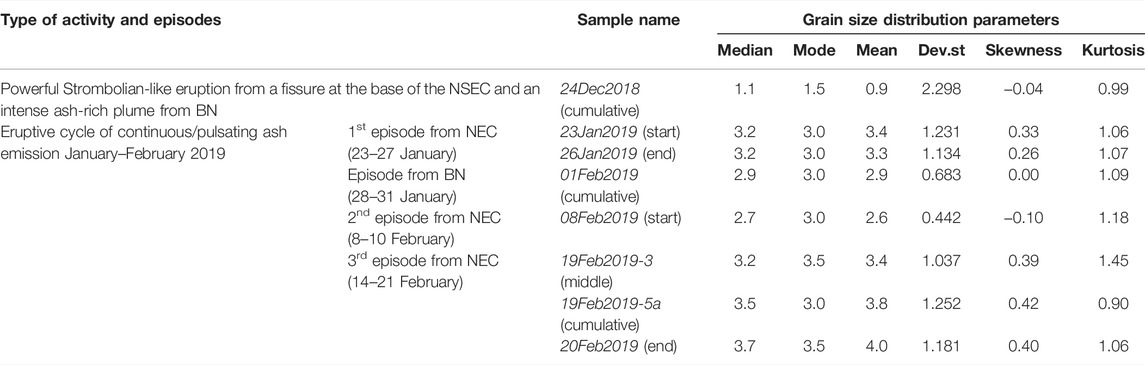
TABLE 1. Overview of the studied samples in the context of type of activity, related episode within the cycle of ash emission, indication of the phase (in brackets) to which the samples correspond, and grain size parameters (Inman, 1952).
4 Methods
Collected samples were weighed after drying in a static oven between 45 and 100°C at the laboratory of INGV-OE. The grain size analysis of the coarse fraction of deposits (size ranges <1Φ, where Φ= −log2d, with d = particle diameter in mm) was determined by mechanical sieving at half-phi at the laboratory of INGV Sezione di Pisa (INGV-PI). The finer fractions (1<Φ < 10; 500 to 1 µm) were analyzed by image analysis using a static particle analyzer (Malvern Morphologi 3 GS) at Dipartimento di Scienze della Terra, Università di Firenze (VLab-Unifi). The results were finally merged with those obtained by mechanical sieving to obtain the grain size distributions (GSDs) of the studied samples.
The static particle analyzer was also used to get quantitative information on the external shape of a representative number of ash particles (>200,000) for each sample. The plane projection of the particle outline was considered for the calculation of four shape parameters useful to effectively account for the different aspects of the clasts morphology: Elongation (ELNG: the 1- ratio between minor and major axis of the particle projection), Solidity (SLD: the ratio between the area of the particle projection to the area of its convex envelope), Convexity (CVX: the ratio between the perimeter of the convex envelope to the perimeter of the particle projection), and Circularity (CIRC: the ratio of the circumference of a circle equal to the particle’s projected area to the perimeter of the particle).
To identify the juvenile fragments in the fine volcanic ash, the component analysis was performed for each sample on the size fraction 125–250 µm (2 < Φ < 3), very close, or corresponding, to the modal size for most of the samples (Figure 2), using two different methods (#1 and #2). Given its coarser nature, the analysis of the 24Dec2018 sample was also performed on the 0.5–1 Φ size interval. For method #1, a representative amount of ash was dispersed over a double-sided adhesive tape on a graph paper (10 × 10 cm2). Analyses consisted of point-counting 500 clasts per sample with the aid of a stereomicroscope. The size interval 0.5–1 Φ of the 24Dec2018 sample was analyzed by two different operators (#1a and #1b) in order to check the subjectivity of the method. A BSE-SEM analysis (method#2) was performed at INGV-PI by using a Zeiss EVO MA 10 scanning electron microscope (SEM) using the AZtec Large Area Mapping (AZtec Auto) tool, allowing the fast acquisition of a large number of BSE images, although at low-magnification (250×), containing a total of 300–1,000 clasts per sample.
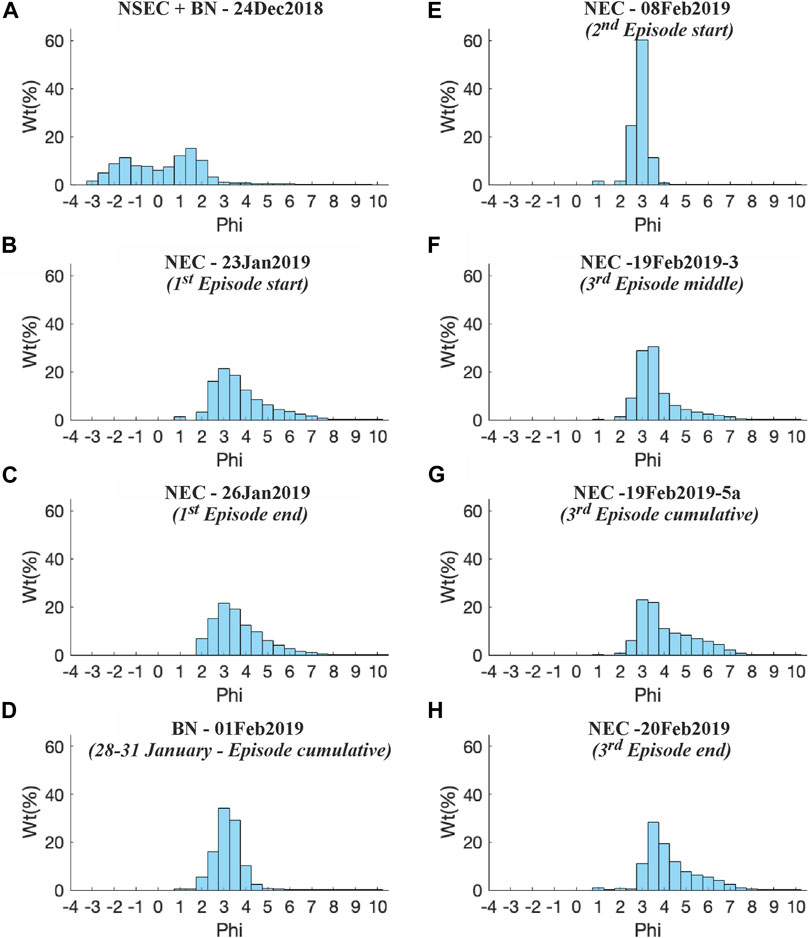
FIGURE 2. Grain size distribution of samples related to the December 2018 activity (A) and to the January–February 2019 eruptive cycle from Northeast Crater (B,C,E–H) and BN (D). phi = −log2d, with d = particle diameter in mm. Horizontal axis is 0.5 phi intervals.
The same mounts were also used for detailed groundmass inspection, analysis of plagioclase microlite size distributions, and composition of minerals and matrix glasses. For crystal size distribution of plagioclase microlites, BSE images of about 50 clasts from each sample were collected at a high resolution (3072 × 2304 pixel) and magnifications between ×800–1,200 (the total analyzed areas range between 0.1 and 0.5 mm2 for sample). Plagioclase microlites were manually segmented and converted to binary images using image processing freeware ImageJ (Schneider et al., 2012), providing total crystal number, area, and size (estimated as the length of the major and minor axes of the equivalent ellipse) in each binary image. In addition, 2D data were then converted into 3D distributions using the freeware software CSDCorrections version 1.6 (Higgins 2000; Higgins 2006). Shape factors were determined using the Excel database CSDSlice v. 5 (Morgan and Jerram, 2006), which compares the distribution of area-based crystal aspect ratios with those generated by random sectioning of known crystal shapes to determine the best-fit three-dimensional habit.
The composition of matrix glasses and minerals was obtained in the raster mode (squares 5–10 microns in size) using an EDS AZTEC-Oxford microanalytical system at INGV-PI. Data were collected at an acceleration voltage of 20 keV using a 2.5 nA current probe with an acquisition time of 50 s. Concentrations were obtained after AZTEC-XPP matrix correction using natural minerals or pure oxides for calibration. VG2 reference basaltic glass was routinely analyzed during each session to estimate the error. Accuracy (RD%) is less than 0.5% for SiO2, Al2O3, and MgO; 2% for CaO and FeOtot; and >5% for other oxides.
5 Results
5.1 Grain Size Analysis
Grain size distributions (GSDs) (Figure 2; Table 1) clearly distinguish samples collected during the coeval activity of NSEC and BN craters (24Dec2018 sample) from those related to the January–February 2019 ash emission cycle mainly from NEC, and occasionally from BN.
The sample 24Dec2018 is characterized by a bimodal distribution (Figure 2A) with the coarsest mode, representing around 15% of the total, peaked at −1.5 Φ and a similarly abundant finest mode located at 1.5 Φ. The sample is characterized by the occurrence of only a few percentage of fragments in the interval 4<Φ<8. The marked bimodality of this sample can be interpreted as the result of the concurrent deposition from the Strombolian activity from the fissure at the base of NSEC (coarse mode) and the coeval intense ash emission from BN (fine mode).
Despite being collected at different distances from the vent (6–27 km), all samples related to the January–February 2019 ash emission cycle are unexpectedly very similar in terms of grain size distributions (Figures 2B–H). All samples display a GSD mostly in the range 2–8 Φ, with a mode located at 3–3.5 Φ and a generally pronounced positive skewness (Table 1). Two of the studied samples (01Feb2019 and 08Feb2019) display better sorted GSDs (2–5 Φ), corresponding to a lower standard deviation (Table 1) and a more marked symmetry of the distribution (Figures 2D,E). The lack of fine materials in the 08Feb2019 sample, issued from NEC, is possibly related to a bias in the sample collection, as it was taken from a woven canvas laid out on a roof in Catania downtown, which possibly retained the finest material. Conversely, no critical issues were noticed during the sampling of the 01Feb2019 sample; thus, we consider the features of the grain size distribution of this sample as fully representative of the ash emitted from BN.
5.2 Shape Analysis of Ash Particles
The particle shape is well described by four shape parameters (Elongation, ELNG; Circularity, CIRC; Solidity, SLD; and Convexity, CVX; Liu et al., 2015). Values of these parameters are presented in terms of their simple moving average (SMA) against the particle size (Figure 3). Results indicate that ELNG is largely variable and apparently unrelated to the nature of the analyzed samples, suggesting no significant variation in the form of particles (Figure 3A). The analyzed particles have relatively high values of SLD (>0.93) and CVX (>0.91), indicating moderately rough outer perimeters and a generally small size of the peripheral irregularities (Figures 3B,C). CIRC (Figure 3D) shows trends closely similar to those of SLD, suggesting the presence of only minor peripheral irregularities, which do not strongly influence SLD. Almost all data trends from the January–February activity display a progressive decrease, although not very steep, of the different shape parameters as the particle size increases, with the only exception being the 08Feb2019 sample (Figure 3) which shows a rapid increase (up to the maximum values of all the analyzed samples) of SLD, CVX, and CIRC, from 30 to 60–70 μm, followed by a very slow decrease for the larger sizes (>125 micron). This behavior is possibly related to the preferred retention of the more irregularly shaped ash fragments in the woven canvas. The sample 24Dec2018 (from the mixed NSEC/BN activity) shows a decrease in CIRC, SLD, and CVX values up to around 100 μm, followed by nearly constant values for larger sizes. This sample, also characterized by the lowest values in CIRC and CVX (Figures 3B,D), is possibly associated with a relatively higher abundance of small-scale irregularities (i.e., fine roughness) affecting the outer perimeters of the particles.
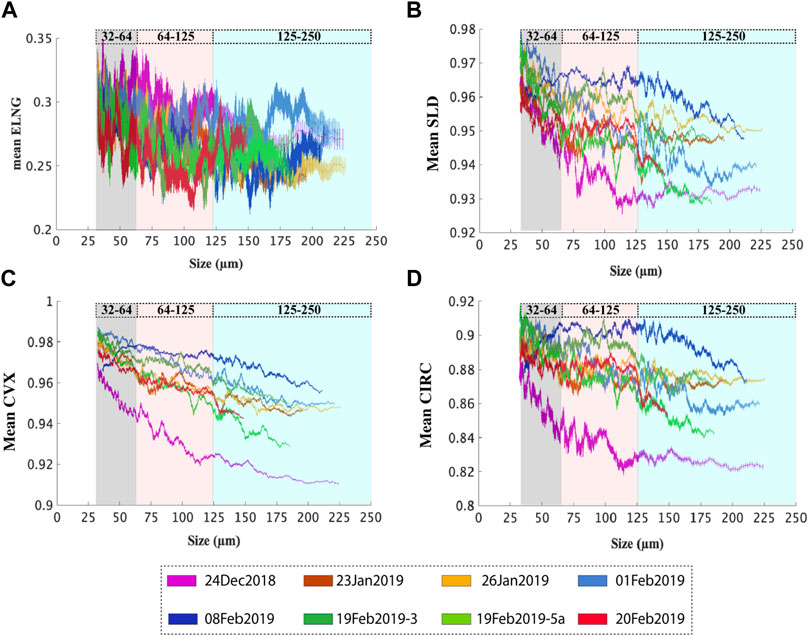
FIGURE 3. Trend variation of the simple moving average (window size = 150 elements, horizontal shift = 1 element each moving step) of four shape parameters plotted against the particle size: (A) Elongation (ELNG); (B) Solidity (SLD); (C) Convexity (CVX); (D) Circularity (CIRC). The standard deviation of the values is also shown for each moving average step. The color-shaded area reported in the plots indicates the spatial boundaries between the class size intervals considered in Figure 4.
The variability found in the frequency distribution of CVX values within three grain size classes <250 microns (Figure 4) shows pieces of evidence of the presence of distinctive features clearly differentiating samples from NSEC/BN and the January–February 2019 activity (NEC and BN) and indicates that a moderate internal variability exists among the samples from the studied cycle. In particular, the distribution of the 24Dec2018 sample appears poorly sorted and comprised in a wide interval (CVX between 0.85 and 1), while all the NEC samples are characterized by narrower distributions (CVX mostly between 0.9 and 1), with a single mode typically located at about 0.97–0.98. Within the whole eruption cycle, it is possible to follow worsening of the sorting and a minor decrease in the mode of distributions from the beginning (23Jan2019 and 08Feb2019 samples) to the end (26Jan2019 and 20Feb2019 samples) of each episode. The 01Feb2019 sample from BN presents the same characteristics of the ash samples from NEC.
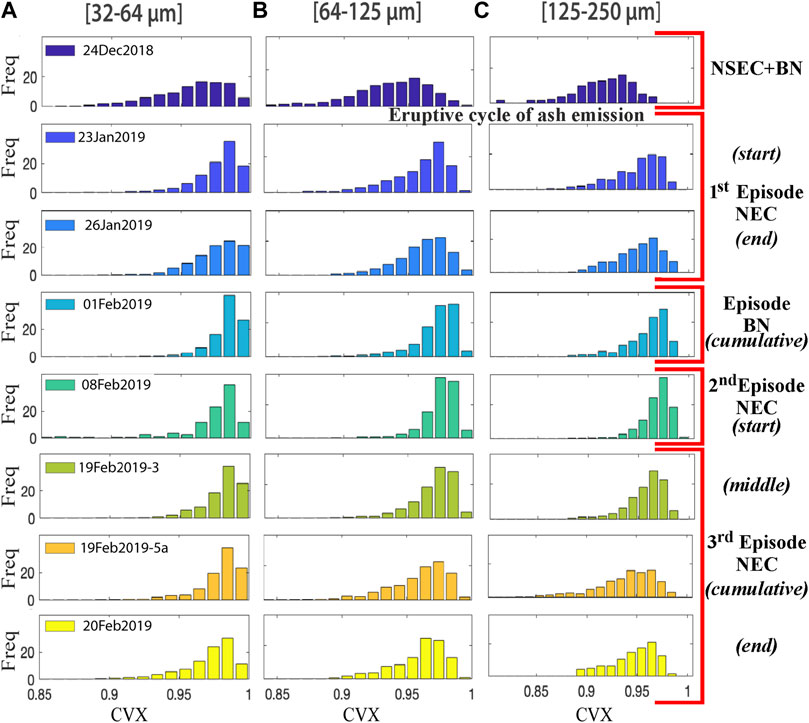
FIGURE 4. Frequency distributions of Convexity (CVX) values for particles comprised three different class size intervals: (A) 32–64 μm; (B) 64–125 μm; (C) 125–250 µm.
5.3 Component Analysis
Ash components were subdivided in three groups: juvenile fragments, loose crystals, and lithic clasts, showing different abundances as a function of the eruption style (Figure 5). Overall, the juvenile component is made up of fragments with sharp-to-smooth, shiny surfaces and blocky to fluidal morphology, independent of their vesicularity and color. At the stereomicroscope (#1 in Figure 5), we distinguished between transparent fluidal (J-TF) and dark blocky (J-DB) particles (Figure 5A), roughly corresponding to two end-members with glassy and microlite-rich groundmass, respectively, as identified with BSE-SEM (#2 in Figures 5B–D). According to Taddeucci et al. (2004), on BSE-SEM images, we set a threshold at 50 vol.% microlites between the two different types of clasts. Plagioclase (PL), clinopyroxene (CPX), and minor olivine (OL) are present in the ash fraction as loose, broken crystals (Figure 5A). Particles made up of more than 50 vol.% by a single crystal were incorporated in this group. Lithic fragments are present as dull grey (L-G) to red (L-R), round-edged, vesicle-free holocrystalline clasts (Figure 5A).
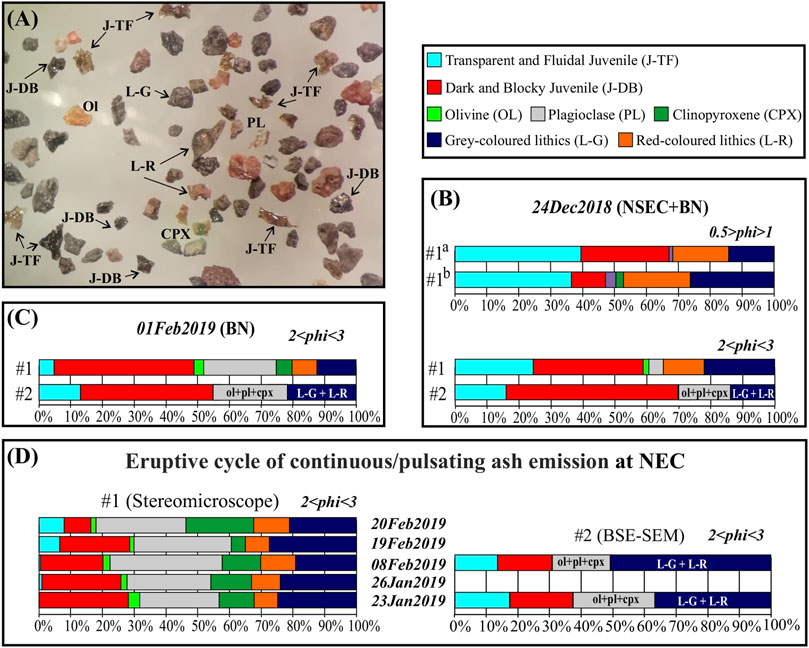
FIGURE 5. Results of the componentry analysis. (A) View under the stereomicroscope of the sample from 24 December 2018 in the 2 < phi < 3 size interval; (B–D) histograms of frequency of the different components in the studied samples [(B)-NSEC + BN; (C)-BN; (D)-NEC] and comparison between the results obtained by using the stereomicroscope (#1) and BSE-SEM images (#2). #1a and #1b correspond to results obtained with the method #1 by two different operators.
Due to the bimodal size distribution of the 24Dec2018 sample, the componentry of three different size intervals was investigated here. In the coarser ash fraction (−2<Φ <−2.5), the 98 vol.% is made up of J-TF clasts, with the remaining 2 vol.% of the sample being represented by both L-G and L-R clasts. In agreement with Borzì et al. (2020), the ash fraction between 0.5 and −1Φ is composed of 36–39 vol.% by J-TF material and 11–28 vol.% of J-DB (Figure 5B). Differences between the results of clast classification made by the two operators (20 vol.% extra lithics estimation by operator #1b; Figure 5B) suggest the difficulty of an unequivocal identification of J-DB and L-G fragments with respect to their microscopic features. In the finer fraction (2<Φ<3), the juvenile component ranges from 59 to 70 vol.%, with 16–25 vol.% of J-TF and 34–54 vol.% of J-DB (Figures 5B, 6A). At BN (01Feb2019 sample), the juvenile material in the 2<Φ<3 ash fraction represents the 49–55 vol.%, and it mostly consists of J-DB particles (Figures 5C, 6B). Results obtained with the two different methods are quite consistent, even if the J-TF/J-DB ratio results higher by using method #2. This is possibly related to a better identification of variably crystallized glassy groundmass on BSE-SEM images with respect to the stereomicroscope.
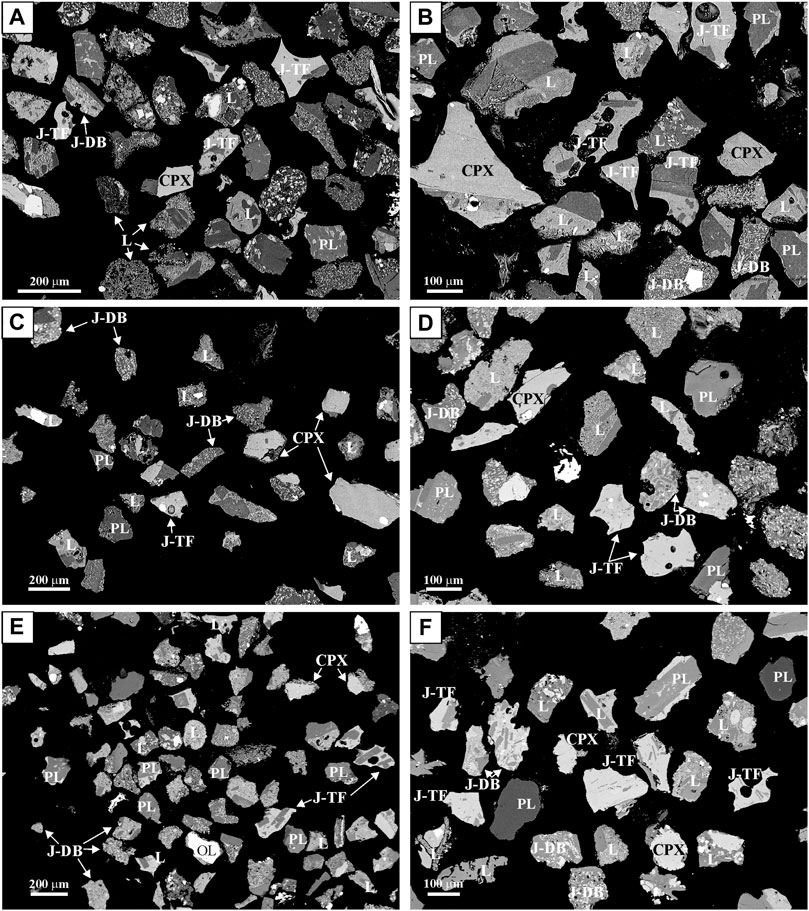
FIGURE 6. Representative back-scattered SEM images acquired at a low resolution and used for componentry analyses of ash fragments (2 < phi < 3): (A) 24Dec2018 sample NSEC + BN; (B) 01Feb2019 sample BN; (C) 26Feb2019 sample NEC; (D) 08Feb2019 sample NEC; (E) 19Feb2019-3 sample NEC; (F) 20Feb2019 sample NEC.
Samples related to the ash emission cycle at NEC are largely enriched in loose crystals (40–50 vol.%) (Figures 5D, 6C–F). Under the stereomicroscope, in all samples, the J-TF fragments do not exceed the 10 vol.% (lower than 20 vol.% by method #2), reaching its maximum at the end of the whole eruptive cycle (19Feb2019 and 20Feb2019 samples) (Figures 5D, 6E,F). The different components show poorly variable relative abundance over the course of eruption, with the exception of the 20Feb2019 sample, in which the juvenile material (both types) is less abundant (20 vol.%) than that in the previous episodes, although the J-TF/J-DB ratio is largely increased. The L-R clasts are subordinated to other lithics (L-G), and the total of lithics, about 30 vol.%, remains quite constant over the course of the eruptive cycle.
5.4 Groundmass Textures
Textural characterization of lapilli and ash was performed by focusing on juvenile particles previously identified as J-TF and J-DB. Further quantification of textural parameters was only performed on glassy juvenile fragments (J-TF; Figures 7A–H), excluding particles with plagioclase microlite content >60 vol.% (J-DB; Figures 7I,J), in the assumption that J-TF clasts represent the “active” moving portion of the magma feeding the studied ash-rich emissions. Indeed, the high content of small microlites and the low vesicularity of J-DB particles, at Mt. Etna and at other volcanoes, have been interpreted as related to cooling-induced crystallization due to prolonged residence time of the magma in the conduit (Taddeucci et al., 2004; Pompilio et al., 2017; Polacci et al., 2019; Matsumoto and Geshi, 2021).
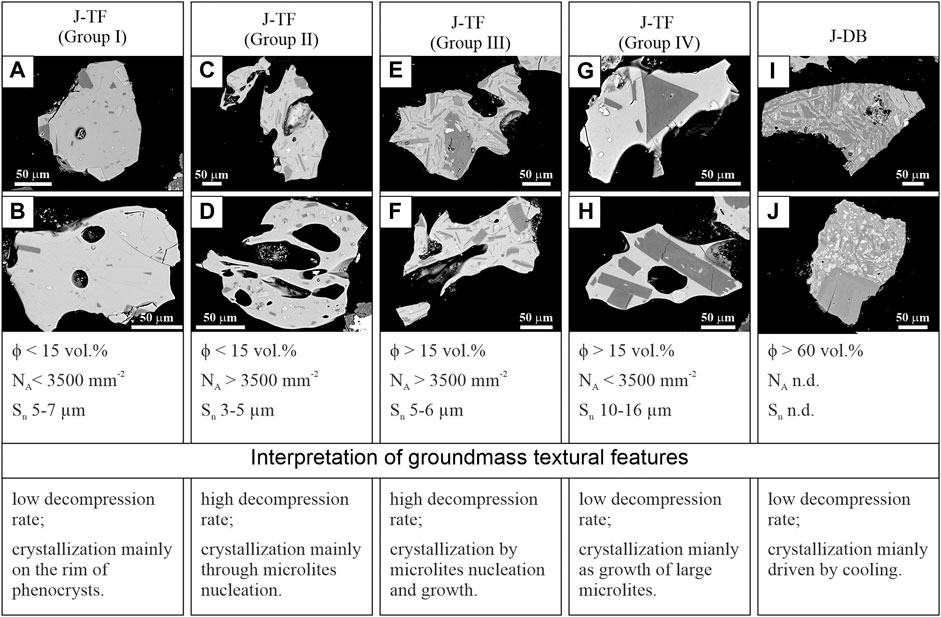
FIGURE 7. Representative high-resolution BSE-SEM images for in-depth inspection of the groundmass texture. (A–H) Juvenile transparent and fluidal (J-TF) particles belonging to (A,B) Group I, (C,D) Group II, and (E,F) Group III. (G,H) Group IV; (I,J) Juvenile dark and blocky particle (J-DB).
Results on lapilli (L) from the 24Dec2018 sample (24Dec2018-L) confirm that they are texturally homogeneous, with a groundmass characterized by both high vesicularity (49 vol.% on average) and total crystals content (35 vol.% on average). Vesicles are larger than 100–200 microns, and their shape varies from round to elongated, with clear structures of coalescence. Plagioclase microlites (<150 micron) are the most abundant phase (27 vol.%), showing euhedral tabular morphology, while mafic mineral phases consist of very rare hopper pyroxene, oxides, and olivine (Figure 1 ESM; Table 2).
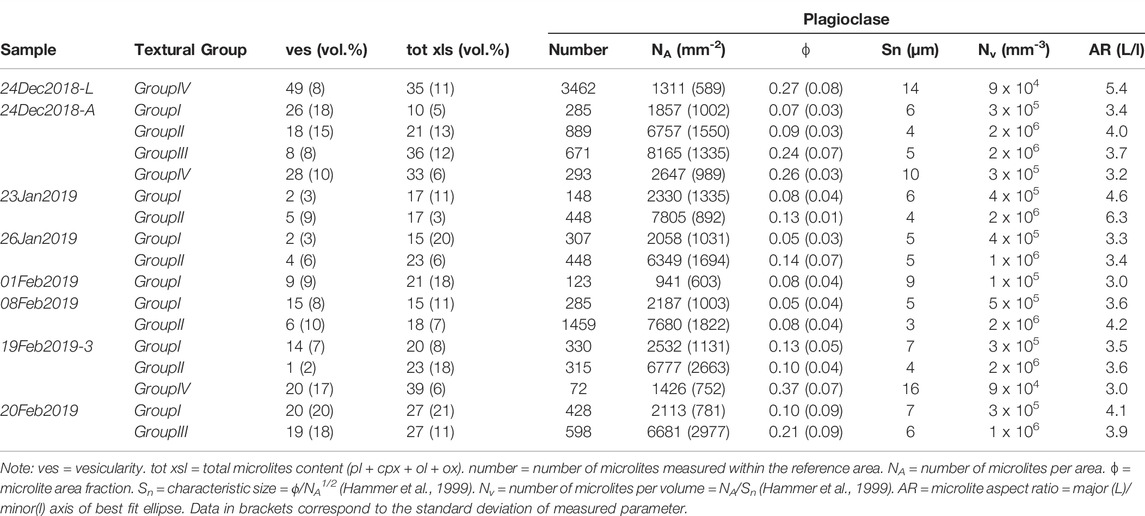
TABLE 2. 2D textural parameters obtained on BSE-SEM images.
Ash (A) from the 24Dec2018 sample (24Dec2018-A), and from all the other studied samples, has contrasting features with respect to the lapilli fraction, showing a large spectrum of groundmass textures (Figure 7). In particular, groundmass crystal content (vesicles free) has a large variability, ranging from 2 to 50 vol.%, and the same is observed for vesicularity (0–60 vol.%), where these two parameters are not cross-correlated (Table 2). Plagioclase microlites remain the most abundant phase (2–30 vol.%), to which clinopyroxene, olivine, and oxides are associated in variable proportions (0–16 vol.%). In general, plagioclase occurs as euhedral microlites, while mafic minerals often display both skeletal and hopper morphologies. In ash fragments with higher microlites content (J-DB; Figures 7I,J), plagioclase often appears as broken microlites, and in some cases they are bent or displaced as consequence of vesicle expansion (Figure 2 ESM). Moreover, the growth of plagioclase by coalescence of few smaller microlites is a common feature in these clasts.
Detailed groundmass textural inspection revealed that, in almost all samples, clasts showing typical features of recycling are present (D’Oriano et al., 2014; Deardorff and Cashman, 2017), although at a macroscopic observation some of these clasts were classified as J-TF fragments, due to their shiny surfaces and the occurrence of large glassy areas in their groundmass (Figures 8A–D). Some recycled clasts are characterized by partially resorbed microlites of plagioclase and pyroxene (Figures 8B,D), where pyroxene is sometimes preferentially arranged in aggregates (Figure 8B). Other peculiar features of recycling commonly observed at high resolution BSE-SEM images consist of groundmass patches with contrasting crystallinity (Figures 8E–J), the occurrence of small oxides with “trellis” texture (Haggerty, 1991), and micron-sized olivine showing subsolidus transformation (Haggerty and Baker, 1967; Figure 8G). Moreover, some recycled clasts can have micron-sized altered/corroded rims (Figures 8A,F,I). The occurrence of large microcrystalline spherulites penetrating the glass, and not affecting previously formed microlites and thus the transparency of the glasses (Figures 8H,I), is a quite common feature observed in these fragments. When the entity of the modification due to intra-crater recycling is visible only at the μm scale, recycled clasts are not always well identifiable by means of expeditious methods. This difficulty can result in an overestimation of J-TF particles by method #1.
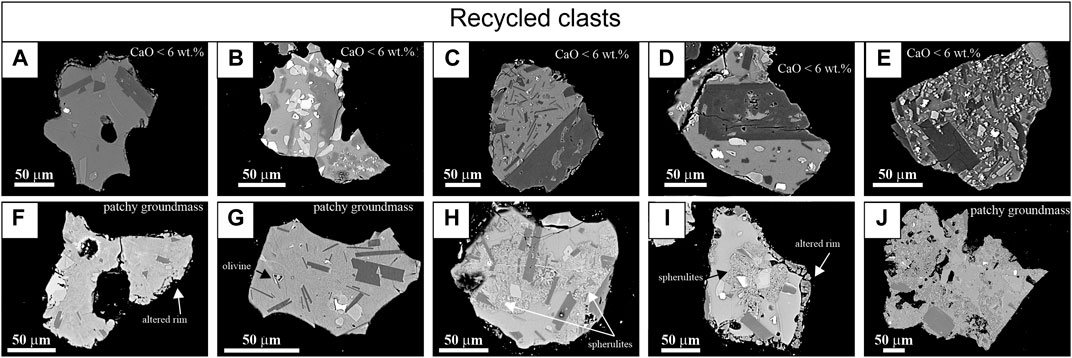
FIGURE 8. Representative high-resolution BSE-SEM images of recycled clasts. (A–E) Particles characterized by CaO <6 wt.% content and variable groundmass crystallinity, from microlite-free (A) to microlite-rich (E). Some of these clasts show resorbed plagioclase and pyroxene microlites (B, D). Other clasts are characterized by groundmass patches with contrasting crystallinity (F,G,J); olivine subsolidus transformation (G); altered/corroded external rims (F–I); occurrence of spherulites penetrating the glass and not affecting the whole groundmass (H,I).
Among J-TF particles, it is possible to identify different textural groups basing on the correlation between NA (number of microlites per area) vs. ϕ (plagioclase microlites content) (Figures 7A–H and 9; Table 2). The relationship between these two parameters is the characteristic size (Sn) defined as Sn = (ϕ/NA)1/2 (Hammer et al., 1999). The diagram shown in Figure 9 has been divided in four fields, corresponding to ϕ< and > 15 vol.% and NA< and > 3,500 mm−2, respectively. Particles from the sample from 24Dec2018-A are distributed in similar proportion among different groups (Groups I to IV), while sample 24Dec2018-L falls in the field at ϕ > 15 vol.% and NA < 3,500 mm−2 (Group IV; Figures 7G,H and 9). In all the studied ash samples from the ash emission cycle at NEC, most of the particles fall in Group I (Figures 7A,B and 9) and II (Figures 7C,D and 9), characterized by similar ϕ (<15 vol.%) but different NA (on average 2,000 and 7,000 mm−2, respectively) (Figure 9; Table 2). In Groups I and II, microlites have a similar faceted and prismatic morphology, but they show a slight Sn decrease (from 7 to 3 µm) and aspect ratio (AR) increase passing from Group I to Group II. In samples related to the end of each studied episode (26Jan2019 and 19–20Feb2019), clasts with ϕ > 20 vol.% and NA > 3,500 mm−2 are frequent, increasing their abundance at the end of the whole eruptive cycle (20 February 2019) (Group III) (Figures 7E,F and 9). Microlites from Group III have Sn of 7 µm. Juvenile material associated with the 28–31 January 2019 weak ash emission episode from BN (01Feb2019 sample) is mainly characterized by glassy groundmass (ϕ < 15 vol.%) with few microlites (NA = 941 mm−2) of relatively large size (Sn = 9 µm) and prismatic habit (Group I).
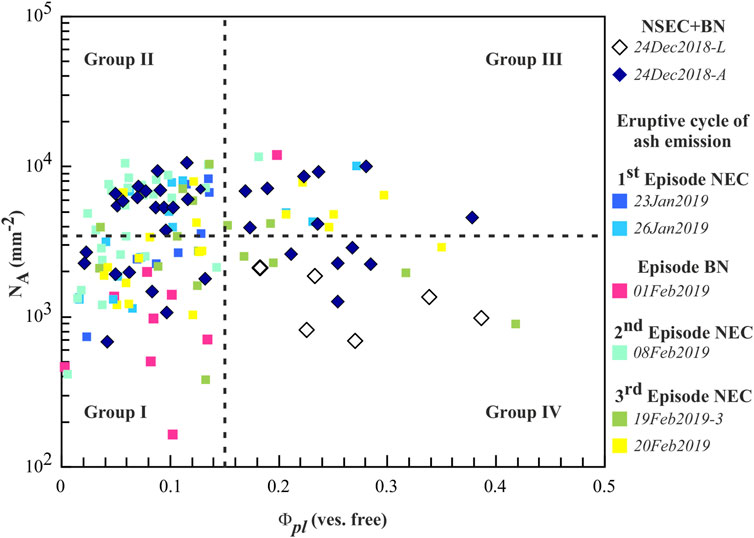
FIGURE 9. NA (mm−2) vs. plagioclase microlites area fraction (vesicles free) plot. The vertical dashed line is set at ɸ = 15 vol.%, while the horizontal dashed line is set a NA = 3,500 mm−2, dividing the diagram in four fields corresponding to textural Group I (ɸ < 15 vol.%; NA < 3,500 mm−2), Group II (ɸ < 15 vol.%; NA > 3,500 mm−2), Group III (ɸ >15 vol.%; NA > 3,500 mm−2), and Group IV (ɸ > 15 vol.%; NA < 3,500 mm−2). Each data point represents a single clast.
5.4.1 CSD of Plagioclase Microlites
On classical CSD plots of Ln n (mm−4) vs. L (mm), where n is the population number density and L is the crystals length, the general trends of the studied samples are easily decomposed through linear segments with different slopes and intercepts that were estimated by least square fitting (Figure 10A; Table 1 ESM). The smallest 3D size recalculated through the CSD correction software is 7 μm, even if few microlites in the size range 1–7 microns have been measured, which give a concave-down shape of the CSD for the smallest size (not reported in Figure 9). The low number density of these small microlites can be considered as an artifact arising from the detection limit of the acquisition technique (Armienti et al., 2007). However, crystals less than 30 µm display acicular shapes and have been considered to form at undercoolings higher than 30°C (Lofgren 1974). Thus, we are confident that the considered size range (7–150 µm) reflects the different conditions and related changes in crystallization parameters during the pre- and syn-eruptive stages, being the smallest size likely related to the rapid post-fragmentation quenching (Armienti et al., 1994; Pompilio et al., 2017).
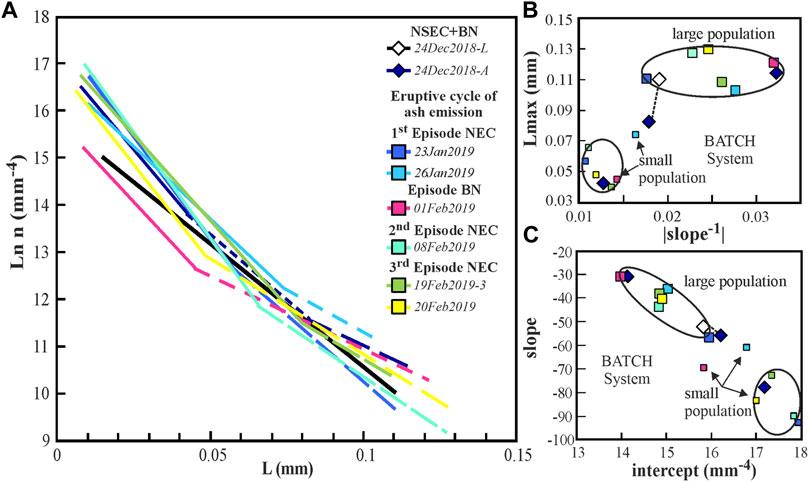
FIGURE 10. Results from quantitative textural analyses. (A) Crystal size distribution (CSD) plot for plagioclase microlites in the studied samples. (B,C) Diagnostic relationships between the maximum crystal size (Lmax) and an inverse slope (absolute value) (B) and between the intercept and the slope for each identified population from CSD (C).
The sample 24Dec2018-L has a linear CSD characterized by a single segment, while in the sample 24Dec2018-A, the CSD can be described by three segments, which show a progressive increase of both slopes and intercepts (Figures 10A–C). Conversely, CSD of all the samples from NEC can be approximated by two linear segments. In all samples, there is a negative correlation between slopes and intercepts for the two size populations, and a positive correlation between slopes and Lmax (maximum crystal size, mm) (Figures 10B,C). Moreover, over the time, the slopes of the smallest microlite population of the CSD (Lmax <70 µm) remain almost constant, while the intercepts are smaller and Lmax are larger in samples representative of the end of each ash emission episode (Figures 10A-C). These trends have been interpreted as the result of batch system crystallization rather than an open system (Marsh, 1998). For the first episode at NEC (23–26 January 2019), from the starting (23Jan2019 sample) to the ending (26Jan2019 sample) phase, a reduction of both slope and intercept, being equal the Lmax, can be observed for the largest population, followed by a reduction of the slope and intercept associated with an increase of Lmax, for the smallest population. These features can be acquired during crystallization in an open unsteady system (Marsh, 1998). CSD in ash from BN (01Feb2019 sample) clearly differs from the other ash samples, being both size populations characterized by lower intercept and a higher slope.
5.5 Minerals and Groundmass Glass Composition
The analysis of mineral and groundmass glasses reveals strong intra-samples variability, as expected for a heterogeneous material like that examined in the present study.
In the sample 24Dec2019-A and in all the samples from the January–February 2019 ash emission cycle at NEC, olivine microlites range in composition around Fo69-75; olivine microlites in the 01Feb2019 sample from BN are Fo66. In all samples from NEC, plagioclase core-to-rim composition falls in the field of labradorite (Ab25-42-An52-64-Or0-5). A larger interval of An content, slightly shifted toward more calcium compositions (An56-75), was only measured on phenocrysts rims in the 20Feb2019 sample. Plagioclase microlites from the 01Feb2019 sample of BN show a lower An value, from An52 to An60. Pyroxene microlites have a narrow range of Mg# [molar Mg/(Mg + Fe2++ Mn)] from 0.69 to 0.76 and Wo45-48En36-41Fs13-16, without significant differences among the studied samples. End-member percentages of ulvospinel in Fe–Ti oxides is always 38–44%, with the highest values again measured in the 20Feb2019 sample and the lowest in 01Feb2019 sample. Olivine compositions correspond to those measured on the phenocryst rims and in the microlites from the previously studied tephra samples from 24 December 2018 (Borzì et al., 2020), while both plagioclase and clinopyroxene have more evolved composition.
Groundmass glasses in the sample 24Dec2018-L have a narrow range of variation characterized by CaO = 6.9 ± 0.1 wt.%, MgO = 2.8 ± 0.1 wt.%, SiO2 = 49.3 ± 0.4 wt.%, CaO/Al2O3 = 0.4, and FeO/Mg = 3.4 ± 0.1 (Figure 11). The 24Dec2018-A sample is more variable and can be split in two groups on the basis of CaO (6.9 ± 0.3 wt.% and 7.8 ± 0.2 wt.%, respectively) and MgO (3.5 ± 0.2 wt.% and 2.9 ± 0.3 wt.%, respectively) (Figure 11A), although Na2O, Al2O3, TiO2, FeOtot, and SiO2 (Figure 11B) show the same range of variability for both groups. K2O variability is larger in the low-CaO group than that in the high-CaO group (Figure 11C). Only few analyzed glasses share the same composition with the lapilli, characterized by both low SiO2 and CaO contents. These characteristics allow to clearly identify, within the sample 24Dec2018-A, the ash particles related to the fissural Strombolian-like activity (low SiO2 and CaO contents) from those of the intense emission from the BN. Ash emitted at BN during the 29–31 January 2019 episode (01Feb2019 sample) is slightly more evolved with respect to the high-CaO ash detected in the 24Dec2018-A sample, in agreement with their mineral compositions. At NEC, clasts from the 23Jan2019 sample show the wider variability: only few clasts fall in the high-CaO field, extending at intermediate compositions and showing a constantly low FeO/MgO ratio at the different compositions. Over the time, we observed the predominance of high-CaO compositions in the samples corresponding to the end of each episode (26Jan2019 and 20Feb019) and in the 08Feb2019 sample. Ash fragments emitted from summit craters during the January–February 2019 activity are compositionally similar, and their variability can be reconciled with small differences in the mineral abundance (pl + cpx + ol + ox) (Figures 11A–D).
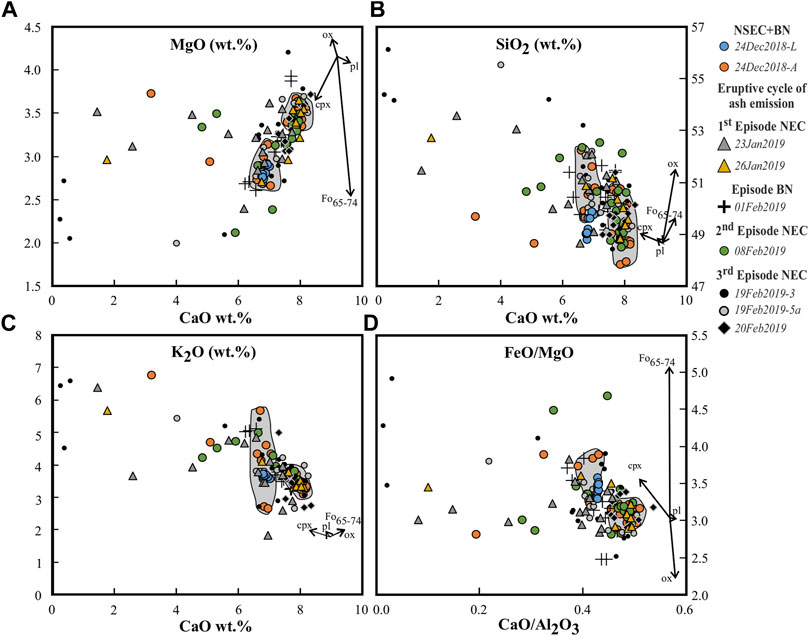
FIGURE 11. Groundmass glasses composition of studied samples. Within each diagram, the arrows represent a subtraction of 5% of the correspondent mineral phase starting from the glass composition of an ash fragment from the 24Dec2018-A sample characterized by CaO = 8.13 wt.%, MgO = 3.59 wt.%, SiO2 = 49.25 wt.%, K2O = 3.26 wt.%, CaO/Al2O3 = 0.49, and FeO/MgO = 2.96. The grey fields identify low-CaO (CaO = 6.9 ± 0.3 wt.% and MgO = 3.5 ± 0.2 wt.%) and high-CaO (CaO = 7.8 ± 0.2 wt.% and MgO = 2.9 ± 0.3 wt.%) compositional groups recovered in the 24Dec2018-A sample . cpx = clinopyroxene; ox = oxide; pl = plagioclase; Fo65-74 corresponds to olivine with two different Forsteritic content.
Particles with glassy groundmass and both resorbed pyroxene and plagioclase (Figures 7E,F), identified as recycled material after a detailed textural inspection, are characterized by matrix glass with CaO <6 wt.%, scattered alkali and silica contents, and CaO/Al2O3 < 0.38 (Figures 11A–D). These clasts are particularly abundant in the sample from 23 January 2019, which corresponds to the beginning of the ash-emission cycle at NEC. Their composition cannot be reproduced by mass balance vectors.
Finally, there is no clear correlation between glass composition and groundmass texture. In particular, within each identified compositional group, there is the contemporary occurrence of clasts belonging to textural Group I to IV. The CaO/Al2O3 ratio, in the range 0.46–0.5, is negatively correlated with pl vol.% and total crystal content only in clasts with groundmass crystallinity <15 vol.% (Group I and II).
Adopting the geothermometer from Pompilio et al. (1998), based on MgO wt.% content of groundmass glasses, we found a difference of 20°C between the two compositional groups with CaO = 6.9 ± 0.3 wt.% (T = 1,074°C ± 5) and CaO = 7.8 ± 0.2 wt.% (1,093°C ± 3). The 24Dec2018-L sample is characterized by a narrow range of T (1,072 ± 2°C), while intermediate glass compositions (CaO = 6.5–7.5 wt.%) are characterized by Tmelt = 1,080°C ± 8. The measured mineral paragenesis and glass composition of J-TF particles, together with temperature information, suggest that the crystallization occurred at pressure lower than 60 MPa, within the shallow plumbing system, identified at Mt. Etna by Kahl et al. (2015) as the magmatic environment M2 (Fo70–72), M3 (Fo65–69), and mm1 (Fo73–75).
6 Discussion
In this study, we collected a large dataset of morphological, textural, and compositional features on products related to various styles and modalities of ash emission at Mt. Etna. Analyses on this case study allowed us to monitor the temporal changes occurring in the shallow conduits, pointing out how the different features of the erupted ash record the processes occurring in different portions of the ascending magma. In the following sections, we will discuss the results of this study in terms of the characterization of juvenile components, the eruptive mechanisms associated with the ash-rich emission activity at NEC, and their evolution over time. All data are summarized in Table 3 together with a brief interpretation of the meaning of each measured parameter.
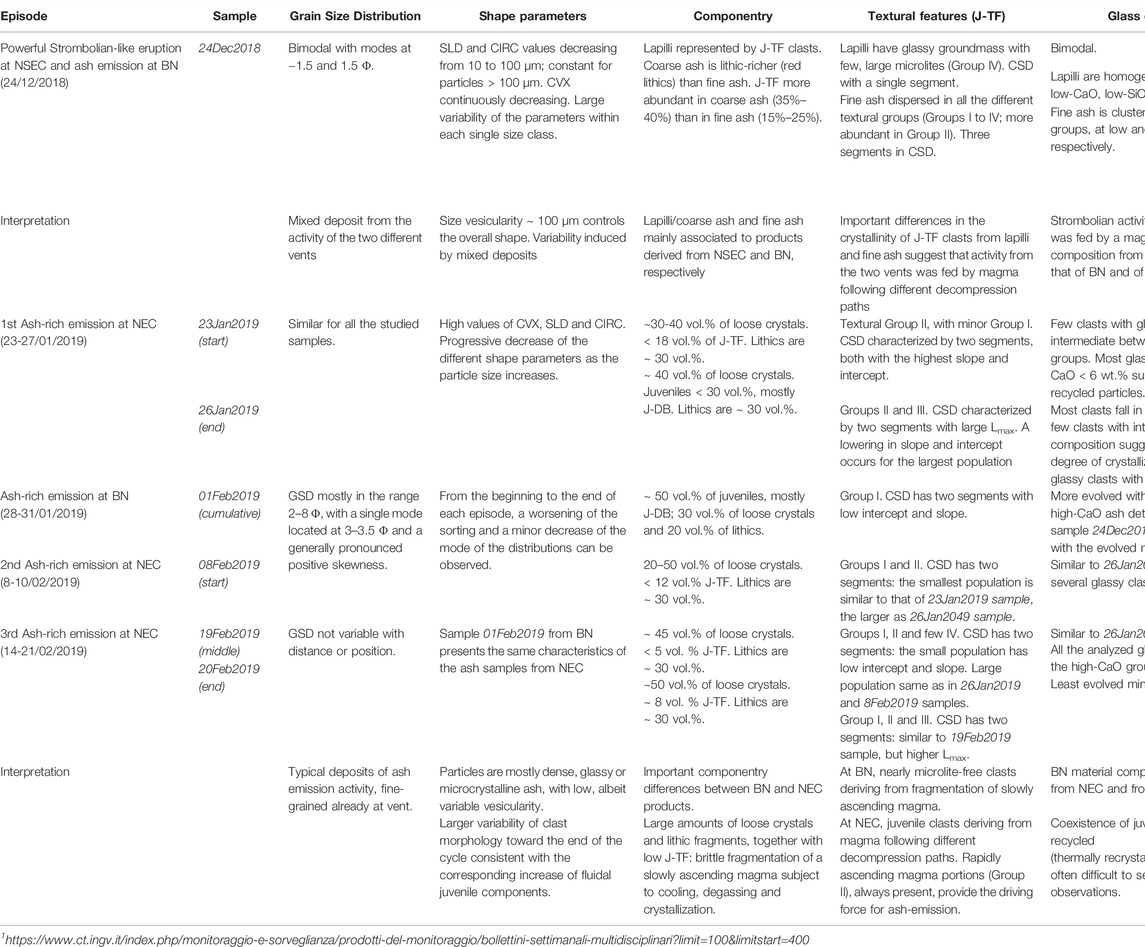
TABLE 3. Summary table of all the results and their meaning, obtained from each studied sample.
6.1 Juvenile Component Characterization
Important clues upon the identification of the juvenile material within the low-intensity ash-dominated basaltic activity emerged from this study. We outlined that the products of this kind of eruptions are mostly made of loose crystals and microlite-rich juvenile clasts (J-DB), associated with variable amounts of lithic clasts. However, the classification of textural and compositional properties for the low amount of J-TF clasts was found to be crucial for the interpretation of eruption processes because the whole variability of physical conditions, mostly developed at very shallow level, is well recorded in the fine-grained material. An interesting suggestion for petrological monitoring purposes, both for an open conduit volcano, such as Mt. Etna, or in case of reactivation of quiescent volcanoes, derives from the componentry analysis. Applied methodologies and techniques used to examine the different properties of the ash were found to be complementary. The inspection of the external aspect of ash clasts, based on stereomicroscope observations, is poorly appropriated to recognize recycled clasts (generally included in L-G), while at BSE-SEM images, J-DB clasts with microlite-rich groundmasses are often erroneously classified as lithic clasts. Conversely, a classification of the juvenile material based upon textural features can provide a more realistic quantification of J-TF fragments; these are in fact often underestimated over the J-DB clasts under stereomicroscope inspection for the presence of microlites to nanolites that give a brown-to-dark color to the glasses (Matsumoto and Geshi, 2021).
An important result of this study also concerns the possibility to differentiate between the contribution to the juvenile material of different vents simultaneously active, as in the case of the 2018 fissural eruption at NSEC and the intense ash emission at BN recorded in the 24Dec2018 sample (Table 3). In this sample, we found that most of the juvenile material is glassy, as expected for a powerful Strombolian-like explosion. Lapilli have a groundmass with moderately high vesicularity and microlite content (50 vol.% and 27 vol.% on average, respectively), with preferentially oriented tablet-shaped plagioclase microlites, resulting in an overall fluidal, highly irregular, and external shape. Residual glasses are compositionally homogeneous with a slightly more evolved composition with respect to the most of the fine ash. A portion of the J-TF coarse ash of the 24Dec2018-A sample derived from this activity. Conversely, the contribution of the simultaneous intense ash emission at BN was detected most in the fine ash, where the juvenile J-TF particles show similar morphological, textural, and compositional features of the ash erupted during the studied ash emission cycle at NEC. This could suggest a similar eruptive dynamic for the ash emission activity, and also a common parental magma which possibly evolves in different ways above a pressure of about 50–60 MPa, where the conduits feeding the summit craters BN and NEC are supposed to be branched (La Spina et al., 2010). Indeed, ash generated at BN at the end of January (01Feb2019 sample) has relatively high proportion (about 50 vol.%) of juvenile materials (J-TF + J-BD) (Figure 5) and a slightly differentiated glass composition associated with an evolved mineral chemistry (Table 3). CSDs also suggest that, in the 01Feb2019 sample, plagioclase microlites are larger than those measured in the 24Dec2018-A, pointing to a more mature and relatively crystal-richer shallow reservoir (M3 of Kahl et al., 2015) for the 28–31 January ash-emission episode from BN (Figure 12A). Based on these observations, we conclude that the single episode occurred at BN in January 2019 was fed by a more differentiated magma, possibly inherited from the 24 December 2018 eruption.
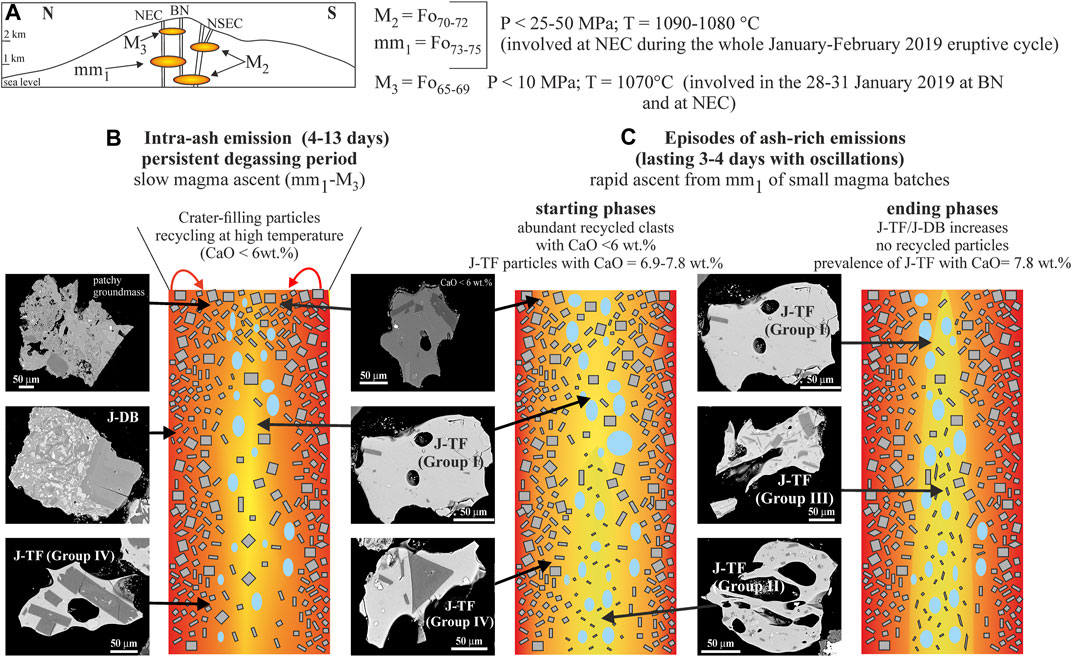
FIGURE 12. Schematic view of the syn-eruptive processes acting during the January–February 2019 ash-emission cycle at Mt. Etna. In the upper part of the sketch, (A) the shallow plumbing system at Mt. Etna is presented with the indications of P-T conditions (modified after Kahl et al., 2015). N and S correspond to North and South, respectively. (B) Period of intra-ash emission characterized by persistent degassing and slow magma ascent (mm1-M3) recorded in the groundmass texture and composition of juvenile TF clasts from textural Group I (central portion of the conduit) and IV (lateral portion of the conduit) and J-DB particles (conduit walls margin). Particles recycled under high temperature and oxidizing conditions from previous explosions fill the crater area, reducing the permeability, enhancing stiffness of the top of magma column, and contributing to the fine ash generation. (C) Ash-emission activity was driven by the ascent of small batches of relative deeper magmas, associated with Group II in the starting phases of each episode and with Group III toward the ending phases, respectively. The conduit color, from yellow to red, corresponds to a decreasing in magma temperature.
In agreement with previous studies (Andronico et al., 2013; Edwards et al., 2018), episodes of ash emissions at NEC are dominated by fine-grained material, mostly made of loose crystals (40–50 vol.% of an assemblage of pl + cpx + ol) and nearly invariant in terms of grain size and ash morphology (Figures 2–4; Table 3). Juvenile material shows a strong gradation of micro-textural features (Figure 7), where the microcrystalline fragments (J-DB) are predominant (Figure 3) and the glassy groundmasses can be subdivided in different groups (Figure 11), representative of the supply of magmatic inputs, reaching different equilibrium conditions within the shallow magmatic environments.
6.2 Eruptive Mechanisms During the Low-To-Mid Intensity Ash Emission at NEC
6.2.1 Dynamics of Magma Ascent Within the Shallow Conduit
Analogies with experiments of cooling- and decompression-induced crystallization in silicic and mafic (hydrous) melts (Hammer and Rutherford, 2002; Pupier et al., 2008; Shea and Hammer, 2013) can help for discriminating among the processes of magma decompression, degassing, cooling, and crystallization occurring during syn-eruption magma ascent. The most important factor controlling size and shape of microlites in groundmass is the extent of undercooling (ΔT), and the characteristic rates of the different processes. At small to moderate values of ΔT, growth typically prevails over nucleation, leading to coarse crystallinity; conversely, at high values of ΔT, nucleation exerts the stronger control on texture and favors the presence of numerous small crystals (e.g., Lofgren, 1974; Swanson, 1977; Nabelek et al., 1978; Lofgren et al., 1979; Cashman, 1991). For the observed mineral paragenesis, the expected range of effective undercooling (ΔTeff = Tliquidus−Tmagma) within the shallow plumbing system (pressure lower than 50–60 MPa) possibly ranges between 35 and 80°C (Pompilio et al., 2017). Comparison of groundmass textures of J-TF ash particles with crystallization experiments suggests that in the January–February 2019 ash-emission cycle at NEC, the main process acting during magma ascent was a decompression-induced crystallization at different rates (Shea and Hammer, 2013). At reasonable ΔTeff (52–82°C), and a final pressure between 25 and 10 MPa, the single step decompression (SSD) experiments of Shea and Hammer (2013) result in microlite crystal content between <10 and 25 vol.%, with the highest values obtained at higher undercooling. In our ash samples, the clasts belonging to Group I, II, and III (Figures 9A–C) can be related to this range of undercooling conditions; in particular, clasts falling in Group II and III correspond to values of undercooling close to the higher end-member, resulting in a higher nucleation rate.
In a schematic view of the shallow plumbing system (Figure 12), during the periods separating episodes of ash-emission, rising magma undergoes a slow decompression rate, between 25 and 10 MPa (Figure 12A), and crystallization mainly results in the growth of plagioclase phenocrysts rims (Hammer and Rutherford, 2002), leaving a glassy groundmass with few microlites represented by Group I particles (Figure 12B). Group IV particles, characterized by low values of NA and high microlite content, with few crystals of large size (Sn 0.116–0.168 mm) formed over a longer period of time (Figure 12B). Cooling-induced crystallization becomes important toward the conduit walls, favoring crystal growth over nucleation and giving the clasts texture of J-DB (Figure 12B). During the episodes of ash-rich emission (Figure 12C), particles in Group II can represent the fast-ascending magma propelled toward the surface by the rapid ascent of bubble-bearing magma portions. At the end of the whole eruptive cycle of ash emission, the rising of gas + melt passes through a partially emptied conduit, producing the ash clasts of Group III, under conditions of maximum decompression rates and hence maximum nucleation and growth rates (Figure 12C).
Crystal size distribution provides inference on the time spent by the magma within the different portions of the conduit (or magmatic environments). To achieve this information, we need to define a growth rate for plagioclase microlites and assume that this value remained constant along the ascent. There are many studies dealing with this issue, both experiment-based or constrained by eruption timing. The proposed growth rates vary in the range of 10–6 to 10–7 mm s−1, corresponding to effusive and highly explosive activity, respectively (Orlando et al., 2008; Shea and Hammer, 2013; Fornaciai et al., 2015; Pompilio et al., 2017). From the relationship: Ld = −1/slope = −1/Gt, where Ld is the dominant size, G is the growth rate, and t is the time, it is possible to derive approximately the time spent at the crystallization conditions (Cashman, 2020). The resulting average minimum plagioclase residence time results 3–7 h for the smallest population of microlites, and 29–70 h for the population of largest microlites (Figure 12C), assuming the highest values of growth rate for smallest microlites related to the higher undercooling. This implies that the magma associated with the population of larger microlites rises slowly toward the surface, producing variably differentiated, glassy particles (transfer from mm1 to M3 environments of Figure 12A). This process is followed by the rapid ascent of small batches of magma from pressure not exceeding 60 MPa (mm1 magmatic environment) toward the surface in a short time (3–7 h). Results obtained by CSD are fully in agreement with timing derived from diffusive relaxation of olivine (Kahl et al., 2015), which results in timescales of 4–16 days during the transfer from mm1 reservoir and residence in the shallow M3 (Fo73-75 and Fo65-69, respectively) environments in the period intra-ash emission (Figure 12B).
6.2.2 Mechanism of Fragmentation and Ash Generation
Results from morphological analyses indicate that all the ash emitted during the January to February 2019 eruptive cycle falls in the field with SLD > 0.93 and CVX > 0.91, typically associated with dense, glassy or microcrystalline ash (Liu et al., 2015). The low amount of “fresh” magma possibly corresponds to those particles >100 microns characterized by the lowest values of the shape parameters, consistent with the irregular contour typical of fluidal-shaped particles, as highlighted also by BSE-SEM observations (Table 3). The abundant bent plagioclase and/or fractured microlites in groundmass from J-DB Group IV particles (Figure 2 ESM) are an indication of the reaching of the viscous–brittle transition of the magma before quenching, as a consequence of deformation mechanisms within the slow ascending, high viscosity and crystal-rich magma in the conduit (Kendrick et al., 2017; Taddeucci et al., 2021). The presence of a large amount of material filling the vent recycled from previous explosions (Figure 8) probably reduces the local permeability at the top of the magma column, inducing pressurization, and enhancing the magma stiffness, so resulting in the brittle fracturing of the uppermost magma column and contributing to the generation of fine grained ash. Altered, corroded rims often affecting these clasts are possibly related to the effect of high temperature gas fluxing in the conduit. Similar features were found in clasts recycled in experiments at high temperature and high oxidizing conditions (D’Oriano et al., 2013). The similar particles shape and grain size observed for all the studied sample can also suggest that part of the fine ash is the result of re-fragmentation of material within the upper conduit. The importance of the intra-crater process of ash recycling in terms of geophysical monitoring of the activity was pointed out by a recent study considering an ash-dominated, low-to-mid intensity activity phase at Copahue volcano (Hantusch et al., 2021). They revealed how the presence of a massive, granular crater infill accumulated within the vent area can result in a significant buffering of the infrasonic signal associated to the active magma fragmentation process, so masking the geophysical signals of the explosive activity driving the low-energy ash eruption.
6.3 Temporal Evolution of Ash Emission Activity
The summit activity started on November 2018 was characterized by the resumption of the intra-crater Strombolian activity and followed by the opening of the eruptive fissure in the SE flank of the NSEC at 3,000 m on 24 December 2018. This event has been interpreted as the consequence of a dike intrusion on the basis of ground deformation and seismic activity data (Bonforte et al., 2019). The products of the 24 December 2018 activity, in fact, contain abundant juvenile clasts (J-TF and J-DB) related to the new magma intrusion. After the 27 December and until the 5 January, geophysical signals (acoustic) and gas geochemistry indicated fracturing and strong SO2 degassing, respectively, located under summit craters and associated with intra-crater Strombolian-like activity. The onset of the ash-emission cycle at NEC, however, was not preceded by any increase in volcanic tremor or other monitored signals, that changed only in concomitance with the onset of the emissions. Data acquired in this study show that the magma column which intrudes in the shallow plumbing system rises at slow rate, crystallizing phenocrysts and increasing its viscosity. Evidence of crystal deformation and fracturing support these results. Particle size distributions of the samples related to intense eruptive phases are extremely similar each other, with fine-grained proximal deposits, suggesting that the size of inter-crystal melt pods and of the phenocryst control the ash size. The ash components do not change significantly between the different episodes, suggesting the recurrence of the same processes during each ash emission. Only at the end of the whole cycle, on 20 February 2019, the emission of a larger amount of glassy juvenile fragments, with homogeneous, high-CaO, glass composition and groundmass textures characterized by high values of nucleation and growth rates, indicates a major relative contribution of deeper, gas-rich magma with respect to juvenile microlite-rich and recycled material, progressively consumed during the preceding activity.
7 Conclusion
The studied activity represents a common scenario at Mt. Etna and at other volcanoes worldwide with similar magma composition. Despite highlighting the occurrence of peculiarity in the ash erupted from different crater sources and acquired during ascent along shallow conduits of different geometry, the methodological approach proposed here and the general processes observed can easily be extended to volcanoes with similar activity. Results indicate the occurrence of scarce (<10 vol.%) fresh juvenile material, with microlite content between 2 and 30 vol.%, as a fundamental for understanding the syn-eruption dynamic of this kind of activity. Textural and geochemical data indicate that the pulsating ash emissions correspond to the episodic fast ascent of small batches of gas-rich magma from a complex architecture of shallow reservoirs (<60 MPa) traveling as a slow rising magma column subject to crystallization mainly as phenocrysts. These episodes are temporally spaced by 3–4 days. The large number of recycled clasts with evidence of high-temperature alteration in a fluid-rich environment suggests the presence of a thick layer of variably sealed or thermally altered material which can contribute to the generation of fine-grained ash. This activity can represent the final long-lasting stage of high-intensity eruptions, and despite its low energetic character, it can pose several problems for airport closure and ash dispersal for prolonged periods; thus, it is important to understand the processes in depth, which can be monitored to make forecast on the duration and impact.
Data Availability Statement
The data generated for this study are available on request to the corresponding author.
Author Contributions
CD’O, PD, and MP conceptualized the study. CD’O and PD performed all laboratory analyses, wrote the text, and made figures. DA is the project leader; he performed visual observation of the eruptions and ash sampling. PG and RC supported in the morphological analyses and contributed in the related text and figures. MP performed compositional analyses of groundmass glasses and gave contribution to the writing of the text. AC provided data from INGV-OE videosurvelliance cameras and sampling. All the Authors contributed to reviewing the text and discussing the results.
Funding
This work has been funded by the Ash-RESILIENCE Project, that has received a premial funding from the Ministero dell’Istruzione dell’Università e della Ricerca (MIUR) by the “Fondo ordinario per gli enti e le istituzioni di ricerca” (FOE) for 2015.
Conflict of Interest
The authors declare that the research was conducted in the absence of any commercial or financial relationships that could be construed as a potential conflict of interest.
Publisher’s Note
All claims expressed in this article are solely those of the authors and do not necessarily represent those of their affiliated organizations, or those of the publisher, the editors, and the reviewers. Any product that may be evaluated in this article, or claim that may be made by its manufacturer, is not guaranteed or endorsed by the publisher.
Acknowledgments
The authors acknowledge the Ash-Resilience project to DA. Comments from the editor CP, reviewers KN and KM greatly improved the quality of the paper. We particularly thank the Chief Editor, Valerio Acocella, for the precious suggestions that have allowed us to enhance some of the fundamental results of this study. Finally, the authors would like to thank Emanuele Poki for collecting the sample 08 February 2019 on a roof in the city of Catania.
Supplementary Material
The Supplementary Material for this article can be found online at: https://www.frontiersin.org/articles/10.3389/feart.2022.824872/full#supplementary-material
Footnotes
1https://www.ct.ingv.it/index.php/monitoraggio-e-sorveglianza/prodotti-del-monitoraggio/bollettini-settimanali-multidisciplinari?limit=100&limitstart=400
References
Acocella, V., Neri, M., Behncke, B., Bonforte, A., Del Negro, C., and Ganci, G. (2016). Why Does a Mature Volcano Need New Vents? the Case of the New Southeast Crater at Etna. Front. Earth Sci. 4, 67. doi:10.3389/feart.2016.00067
Allard, P., Behncke, B., D'Amico, S., Neri, M., and Gambino, S. (2006). Mount Etna 1993-2005: Anatomy of an Evolving Eruptive Cycle. Earth-Sci. Rev. 78, 85–114. doi:10.1016/j.earscirev.2006.04.002
Andronico, D., Cannata, A., Di Grazia, G., and Ferrari, F. (2021). The 1986-2021 Paroxysmal Episodes at the summit Craters of Mt. Etna: Insights into Volcano Dynamics and hazard. Earth-Sci. Rev. 220, 103686. doi:10.1016/j.earscirev.2021.103686
Andronico, D., Corsaro, R. A., Cristaldi, A., and Polacci, M. (2008). Characterizing High Energy Explosive Eruptions at Stromboli Volcano Using Multidisciplinary Data: an Example from the 9 January 2005 Explosion. J. Volcanol. Geotherm. Res. 176, 541–550. doi:10.1016/j.jvolgeores.2008.05.011
Andronico, D., and Del Carlo, P. (2016). PM10 Measurements in Urban Settlements after Lava fountain Episodes at Mt. Etna, Italy: Pilot Test to Assess Volcanic Ash hazard to Human Health. Nat. Hazards Earth Syst. Sci. 16, 29–40. doi:10.5194/nhess-16-29-2016
Andronico, D., Lo Castro, M. D., Sciotto, M., and Spina, L. (2013). The 2010 Ash Emissions at the summit Craters of Mt Etna: Relationship with Seismo-Acoustic Signals. J. Geophys. Res. Solid Earth 118, 51–70. doi:10.1029/2012jb009895
Andronico, D., Scollo, S., Lo Castro, M. D., Cristaldi, A., Lodato, L., and Taddeucci, J. (2014). Eruption Dynamics and Tephra Dispersal from the 24 November 2006 Paroxysm at South-East Crater, Mt Etna, Italy. J. Volcanol. Geotherm. Res. 274, 78–91. doi:10.1016/j.jvolgeores.2014.01.009
Armienti, P., Francalanci, L., and Landi, P. (2007). Textural Effects of Steady State Behaviour of the Stromboli Feeding System. J. Volcanol. Geotherm. Res. 160, 86–98. doi:10.1016/j.jvolgeores.2006.05.004
Armienti, P., Pareschi, M. T., Innocenti, F., and Pompilio, M. (1994). Effects of Magma Storage and Ascent on the Kinetics of crystal Growth. Contr. Mineral. Petrol. 115, 402–414. doi:10.1007/bf00320974
Behncke, B., Neri, M., Pecora, E., and Zanon, V. (2006). The Exceptional Activity and Growth of the Southeast Crater, Mount Etna (Italy), between 1996 and 2001. Bull. Volcanol. 69, 149–173. doi:10.1007/s00445-006-0061-x
Bonforte, A., Guglielmino, F., and Puglisi, G. (2019). Large Dyke Intrusion and Small Eruption: The December 24, 2018 Mt. Etna Eruption Imaged by Sentinel‐1 Data. Terra Nova 31, 405–412. doi:10.1111/ter.12403
Borzi, A. M., Giuffrida, M., Zuccarello, F., Palano, M., and Viccaro, M. (2020). The Christmas 2018 Eruption at Mount Etna: Enlightening How the Volcano Factory Works through a Multiparametric Inspection. Geochem. Geophys. Geosyst. 21, e2020GC009226. doi:10.1029/2020GC009226
Calvari, S., Bilotta, G., Bonaccorso, A., Caltabiano, T., Cappello, A., Corradino, C., et al. (2020). The VEI 2 Christmas 2018 Etna Eruption: A Small but Intense Eruptive Event or the Starting Phase of a Larger One? Remote Sens. 12, 905. doi:10.3390/rs12060905
Cappello, A., Ganci, G., Bilotta, G., Corradino, C., Hérault, A., and Del Negro, C. (2019). Changing Eruptive Styles at the South-East Crater of Mount Etna: Implications for Assessing Lava Flow Hazards. Front. Earth Sci. 7, 213. doi:10.3389/feart.2019.00213
Cashman, K. V. (1991). Textural Constraints on the Kinetics of Crystallization of Igneous Rocks. Rev. Mineralogy 24 (259), 314.
Cashman, K. V. (2020). Crystal Size Distribution (CSD) Analysis of Volcanic Samples: Advances and Challenges. Front. Earth Sci. 8, 291. doi:10.3389/feart.2020.00291
Cassidy, M., Cole, P. D., Hicks, K. E., Varley, N. R., Peters, N., and Lerner, A. H. (2015). Rapid and Slow: Varying Magma Ascent Rates as a Mechanism for Vulcanian Explosions. Earth Planet. Sci. Lett. 420, 73–84. doi:10.1016/j.epsl.2015.03.025
Corsaro, R. A., Andronico, D., Behncke, B., Branca, S., De Beni, E., Caltabiano, T., et al. (2017). Monitoring the December 2015 summit Eruptions of Mt. Etna (Italy): Implications on Eruptive Dynamics. J. Volcanol. Geotherm. Res. 341 (53), 69. doi:10.1016/j.jvolgeores.2017.04.018
Corsaro, R. A., Di Renzo, V., Distefano, S., Miraglia, L., and Civetta, L. (2013). Relationship between Petrologic Processes in the Plumbing System of Mt. Etna and the Dynamics of the Eastern Flank from 1995 to 2005. J. Volcanol. Geotherm. Res. 251, 75–89. doi:10.1016/j.jvolgeores.2012.02.010
Corsaro, R. A., and Pompilio, M. (2004). Magma Dynamics in the Shallow Plumbing System of Mt. Etna as Recorded by Compositional Variations in Volcanics of Recent summit Activity (1995-1999). J. Volcanol. Geotherm. Res. 137, 55–71. doi:10.1016/j.jvolgeores.2004.05.008
D'Oriano, C., Bertagnini, A., Cioni, R., and Pompilio, M. (2014). Identifying Recycled Ash in Basaltic Eruptions. Sci. Rep. 4, 5851. doi:10.1038/srep05851
Deardorff, N., and Cashman, K. (2017). Rapid Crystallization during Recycling of Basaltic Andesite Tephra: Timescales Determined by Reheating Experiments. Sci. Rep. 7, 46364. doi:10.1038/srep46364
D’Oriano, C., Pompilio, M., Bertagnini, A., Cioni, R., and Pichavant, M. (2013). Effects of Experimental Reheating of Natural Basaltic Ash at Different Temperatures and Redox Conditions. Contrib. Mineral. Petrol. 165, 863–883. doi:10.1007/s00410-012-0839-0
Dvorak, J. J. (1992). Mechanism of Explosive Eruptions of Kilauea Volcano, Hawaii. Bull. Volcanol. 54, 638–645.
Edwards, M. J., Eychenne, J., and Pioli, L. (2021). Formation and Dispersal of Ash at Open Conduit Basaltic Volcanoes: Lessons from Etna. Bull. Volcanol. 54, 709657. doi:10.1007/bf00430777
Edwards, M. J., Pioli, L., Andronico, D., Scollo, S., Ferrari, F., and Cristaldi, A. (2018). Shallow Factors Controlling the Explosivity of Basaltic Magmas: The 17-25 May 2016 Eruption of Etna Volcano (Italy). J. Volcanol. Geotherm. Res. 357, 425–436. doi:10.1016/j.jvolgeores.2018.05.015
Fornaciai, A., Perinelli, C., Armienti, P., and Favalli, M. (2015). Crystal Size Distributions of Plagioclase in Lavas from the July–August 2001 Mount Etna Eruption. Bull. Volcanol. 77–70. doi:10.1007/s00445-015-0953-8
Gwinner, K., Coltelli, M., Flohrer, J., Jaumann, R., Matz, K. D., Marsella, M. A., et al. (2006). “The HRSC-AX MT. ETNA Project: High-Resolution Orthoimages and 1 M Dem at Regional Scale,” in Proceedings of the ISPRS, Paris, France, 4–6 July 2006.
Haggerty, S. E., and Baker, I. (1967). The Alteration of Olivine in Basaltic and Associated Lavas. Contr. Mineral. Petrol. 16, 233–257. doi:10.1007/bf00371094
Haggerty, S. E. (1991). Chapter 5.OXIDE TEXTURES - A MINI-ATLAS. Rev. Mineral. 2, 129–220. doi:10.1515/9781501508684-008
Hammer, J. E., Cashman, K. V., Hoblitt, R. P., and Newman, S. (1999). Degassing and Microlite Crystallization during Pre-climactic Events of the 1991 Eruption of Mt. Pinatubo, Philippines. Bull. Volcanol. 60, 355–380. doi:10.1007/s004450050238
Hammer, J. E., and Rutherford, M. J. (2002). An Experimental Study of the Kinetics of Decompression-Induced Crystallization in Silicic Melt. J. Geophys. Res. 107, 8–1. doi:10.1029/2001JB000281
Hantusch, M., Lacanna, G., Ripepe, M., Montenegro, V., Valderrama, O., Farias, C., et al. (2021). Low-Energy Fragmentation Dynamics at Copahue Volcano (Argentina) as Revealed by an Infrasonic Array and Ash Characteristics. Front. Earth Sci. 9, 578437. doi:10.3389/feart.2021.578437
Higgins, M. D. (2006). Quantitative Textural Measureents in Igneous and Metamorphic Petrology. Cambridge: Cambridge University Press.
Higgins, M. D. (2000). Measurement of Crystal Size Distributions. Am. Mineral. 85, 1105–1116. doi:10.2138/am-2000-8-901
Horwell, C. J., Sargent, P., Andronico, D., Lo Castro, M. D., Tomatis, M., Hillman, S. E., et al. (2017). The Iron-Catalysed Surface Reactivity and Health-Pertinent Physical Characteristics of Explosive Volcanic Ash from Mt. Etna, Italy. J. Appl. Volcanol. 6. doi:10.1186/s13617-017-0063-8
INGV-OE (2018). All the Bulletins Prior to 2018 Can Be Found on the Old Section portal. Available at: https://www.ct.ingv.it/index.php/monitoraggio-e-sorveglianza/prodotti-del-monitoraggio/bollettini-settimanali-multidisciplinari.
Kahl, M., Chakraborty, S., Pompilio, M., and Costa, F. (2015). Constraints on the Nature and Evolution of the Magma Plumbing System of Mt. Etna Volcano (1991-2008) from a Combined Thermodynamic and Kinetic Modelling of the Compositional Record of Minerals. J. Petrol. 56, 2025–2068. doi:10.1093/petrology/egv063
Inman, D. L. (1952). Measures for Describing the Size Distribution of Sediments. J. Sediment. Petrol. 22, 125–145.
Kendrick, J. E., Lavallée, Y., Mariani, E., Dingwell, D. B., Wheeler, J., and Varley, N. R. (2017). Crystal Plasticity as an Indicator of the Viscous-Brittle Transition in Magmas. Nat. Commun. 8, 1926. doi:10.1038/s41467-017-01931-4
La Spina, A., Burton, M., and Salerno, G. G. (2010). Unravelling the Processes Controlling Gas Emissions from the central and Northeast Craters of Mt. Etna. J. Volcanol. Geotherm. Res. 198, 368–376. doi:10.1016/j.jvolgeores.2010.09.018
Laiolo, M., Ripepe, M., Cigolini, C., Coppola, D., Della Schiava, M., Genco, R., et al. (2019). Space- and Ground-Based Geophysical Data Tracking of Magma Migration in Shallow Feeding System of Mount Etna Volcano. Remote Sens. 11, 1182. doi:10.3390/rs11101182
Lautze, N. C., Taddeucci, J., Andronico, D., Cannata, C., Tornetta, L., Scarlato, P., et al. (2012). SEM-based Methods for the Analysis of Basaltic Ash from Weak Explosive Activity at Etna in 2006 and the 2007 Eruptive Crisis at Stromboli. Phys. Chem. Earth, Parts A/B/C 45, 113–127. doi:10.1016/j.pce.2011.02.001
Leibrant, S., and Le Pennec, J-L. (2015). Towards Fast and Routine Analyses of Volcanic Ash Morphometry for Eruption Surveillance Applications. J. Volcanol. Geotherm. Res. 297, 11–27. doi:10.1016/j.jvolgeores.2015.03.014
Liu, E. J., Cashman, K. V., and Rust, A. C. (2015). Optimising Shape Analysis to Quantify Volcanic Ash Morphology. Geo. Res. J. 8, 14–30. doi:10.1016/j.grj.2015.09.001
Lofgren, G. (1974). An Experimental Study of Plagioclase crystal Morphology; Isothermal Crystallization. Am. J. Sci. 274, 243–273. doi:10.2475/ajs.274.3.243
Lofgren, G. E., Grove, T. L., Brown, R. W., and Smith, D. P. (1979). Comparison of Dynamic Crystallization Techniques on Apollo 15 Quartz Normative Basalts. Proc. Lunar Planet. Sci. Conf. 1, 423–438.
Marsh, B. D. (1998). On the Interpretation of Crystal Size Distributions in Magmatic Systems. J. Petrol. 39, 553–599. doi:10.1093/petroj/39.4.553
Matsumoto, K., and Geshi, N. (2021). Shallow Crystallization of Eruptive Magma Inferred from Volcanic Ash Microtextures: a Case Study of the 2018 Eruption of Shinmoedake Volcano, Japan. Bull. Volcanol. 83, 31. doi:10.1007/s00445-021-01451-6
Matsumoto, K., and Geshi, N. (2021). Shallow Crystallization of Eruptive Magma Inferred from Volcanic Ash Microtextures: a Case Study of the 2018 Eruption of Shinmoedake Volcano, Japan. J. Geophys. Res. Solid Earth 102 (B9), 20093.
Michon, L., Di Muro, A., Villeneuve, N., Saint-Marc, C., Fadda, P., and Manta, F. (2013). Explosive activity of the summit cone of Piton de la Fournaise volcano (La Réunion island): A historical and geological review. J. Volcanol. Geotherm. Res. 264, 117–133. doi:10.1016/j.jvolgeores.2013.06.012
Michon, L., Staudacher, T., Ferrazzini, V., Bachèlery, P., and Marti, J. (2007). April 2007 collapse of Piton de la Fournaise: a new example of caldera formation. Geophys. Res. Lett. 34, 1–6. doi:10.1029/2007gl031248
Miwa, T., Geshi, N., and Shinohara, H. (2013). Temporal Variation in Volcanic Ash Texture during a Vulcanian Eruption at the Sakurajima Volcano, Japan. J. Volcanol. Geotherm. Res. 260, 80–89. doi:10.1016/j.jvolgeores.2013.05.010
Morgan, D. J., and Jerram, D. A. (2006). On Estimating crystal Shape for crystal Size Distribution Analysis. J. Volcanol. Geotherm. Res. 154, 1–7. doi:10.1016/j.jvolgeores.2005.09.016
Nabelek, P. I., Taylor, L. A., and Lofgren, G. E. (1978). Nucleation and Growth of Plagioclase and the Development of Textures in a High-Alumina Basaltic Melt. Proc. Lunar Planet. Sci. Conf. 1, 725–741.
Nadeau, P. A., Palma, J. L., and Waite, G. P. (2011). Linking Volcanic Tremor, Degassing, and Eruption Dynamics via SO2imaging. Geophys. Res. Lett. 38. doi:10.1029/2010GL045820
Neal, C. A., Brantley, S. R., Antolik, L., Babb, J. L., Burgess, M., Calles, K., et al. (2019). The 2018 Rift Eruption and summit Collapse of Kīlauea Volcano. Science 363, 367–374. doi:10.1126/science.aav7046
Orlando, A. D. O., Armienti, P., Borrini, D., and Borrini, D. (2008). Experimental Determination of Plagioclase and Clinopyroxene crystal Growth Rates in an Anhydrous Trachybasalt from Mt Etna (Italy). Eur. J. Mineral. 20, 653–664. doi:10.1127/0935-1221/2008/0020-1841
Ort, M. H., Di Muro, A., Michon, L., and Bachèlery, P. (2016). Explosive eruptions from the interaction of magmatic and hydrothermal systems during flank extension: the Bellecombe Tephra of Piton de La Fournaise (La Réunion Island). Bull. Volcanol. 78, 5. doi:10.1007/s00445-015-0998-8
Pardo, N., Cronin, S. J., Németh, K., Brenna, M., Schipper, C. I., Breard, E., et al. (2014). Perils in Distinguishing Phreatic from Phreatomagmatic Ash; Insights into the Eruption Mechanisms of the 6 August 2012 Mt. Tongariro Eruption, New Zealand. J. Volcanol. Geotherm. Res. 286, 397–414. doi:10.1016/j.jvolgeores.2014.05.001
Parra, R., Bernard, B., Narváez, D., Le Pennec, J.-L., Hasselle, N., and Folch, A. (2016). Eruption Source Parameters for Forecasting Ash Dispersion and Deposition from Vulcanian Eruptions at Tungurahua Volcano: Insights from Field Data from the July 2013 Eruption. J. Volcanol. Geotherm. Res. 309, 1–13. doi:10.1016/j.jvolgeores.2015.11.001
Polacci, M., Andronico, D., de’ Michieli Vitturi, M., Taddeucci, J., and Cristaldi, A. (2019). Mechanisms of Ash Generation at Basaltic Volcanoes: The Case of Mount Etna, Italy. Front. Earth Sci. 7, 193. doi:10.3389/feart.2019.00193
Polacci, M., Burton, M. R., La Spina, A., Murè, F., Favretto, S., and Zanini, F. (2009). The Role of Syn-Eruptive Vesiculation on Explosive Basaltic Activity at Mt. Etna, Italy. J. Volcanol. Geotherm. Res. 179, 265–269. doi:10.1016/j.jvolgeores.2008.11.026
Pompilio, M., Bertagnini, A., Del Carlo, P., and Di Roberto, A. (2017). Magma Dynamics within a Basaltic Conduit Revealed by Textural and Compositional Features of Erupted Ash: the December 2015 Mt. Etna Paroxysms. Sci. Rep. 7. doi:10.1038/s41598-017-05065-x
Pompilio, M., Trigila, R., and Zanon, V. (1998). Melting Experiments on Etnean Lavas: the Calibration of an Empirical Geothermometer to Estimate the Eruptive Temperature. Acta Vulcanol. 10 (1), 1–9.
Pupier, E., Duchene, S., and Toplis, M. J. (2008). Experimental Quantification of Plagioclase crystal Size Distribution during Cooling of a Basaltic Liquid. Contrib. Mineral. Petrol. 155, 555–570. doi:10.1007/s00410-007-0258-9
Ripepe, M., Marchetti, E., Delle Donne, D., Genco, R., Innocenti, L., Lacanna, G., et al. (2018). Infrasonic Early Warning System for Explosive Eruptions. J. Geophys. Res. Solid Earth 123, 9570–9585.
Ripepe, M., Marchetti, E., Ulivieri, G., Harris, A., Dehn, J., Burton, M., et al. (2005). Effusive to Explosive Transition during the 2003 Eruption of Stromboli Volcano. Geol. 33, 341–344. doi:10.1130/g21173.1
Schneider, C. A., Rasband, W. S., and Eliceiri, K. W. (2012). NIH Image to ImageJ: 25 Years of Image Analysis. Nat. Methods 9, 671–675. doi:10.1038/nmeth.2089
Shea, T., and Hammer, J. E. (2013). Kinetics of Cooling- and Decompression-Induced Crystallization in Hydrous Mafic-Intermediate Magmas. J. Volcanol. Geotherm. Res. 260 (127), 145. doi:10.1016/j.jvolgeores.2013.04.018
Slatcher, N., James, M., Calvari, S., Ganci, G., and Browning, J. (2015). Quantifying Effusion Rates at Active Volcanoes through Integrated Time-Lapse Laser Scanning and Photography. Remote Sens. 7, 14967–14987. doi:10.3390/rs71114967
Staudacher, T., Ferrazzini, V., Peltier, A., Kowalski, P., Boissier, P., Catherine, P., et al. (2009). The April 2007 eruption and the Dolomieu crater collapse, two major events at Piton de la Fournaise (La Réunion Island, Indian Ocean). J. Volcanol. Geotherm. Res. 184, 126–137. doi:10.1016/j.jvolgeores.2008.11.005
Staudacher, T., Peltier, A., Ferrazzini, V., Di Muro, A., Boissier, P., Catherine, P., et al. (2016). “Fifteen Years of Intense Eruptive Activity (1998–2013) at Piton de la Fournaise Volcano (La Réunion): A Review,” in Active Volcanoes of the Southwest Indian Ocean: Piton de la Fournaise and Karthala. Editors P. Bachèlery, J. F. Lénat, A. Di Muro, and L. Michon (Berlin: Springer), 139–170. doi:10.1007/978-3-642-31395-0_9
Swanson, S. E. (1977). Relation of Nucleation and crystal-growth Rate to the Development of Granitic Textures. Am. Mineral. 62, 966–978.
Taddeucci, J., Cimarelli, C., Alatorre-Ibargüengoitia, M. A., Delgado-Granados, H., Andronico, D., Del Bello, E., et al. (2021). Fracturing and Healing of Basaltic Magmas during Explosive Volcanic Eruptions. Nat. Geosci. 14, 248–254. doi:10.1038/s41561-021-00708-1
Taddeucci, J., Pompilio, M., and Scarlato, P. (2004). Conduit Processes during the July-August 2001 Explosive Activity of Mt. Etna (Italy): Inferences from Glass Chemistry and crystal Size Distribution of Ash Particles. J. Volcanol. Geotherm. Res. 137, 33–54. doi:10.1016/j.jvolgeores.2004.05.011
Taddeucci, J., Pompilio, M., and Scarlato, P. (2002). Monitoring the Explosive Activity of the July-August 2001 Eruption of Mt. Etna (Italy) by Ash Characterization. Geophys. Res. Lett. 29, 71–1. doi:10.1029/2001GL014372Taddeucci
Thivet, S., Gurioli, L., Di Muro, A., Eychenne, J., Besson, P., and Nedelec, J.-M. (2020). Variability of ash deposits at Piton de la Fournaise (La Reunion Island): insights into fragmentation processes at basaltic shield volcanoes. Bull. Volcanol. 82, 63. doi:10.1007/s00445-020-01398-0
Keywords: Mt. Etna, ash-rich eruptions, groundmass texture, glass compositions, plagioclase microlite size distribution, syn-eruption processes
Citation: D’Oriano C, Del Carlo P, Andronico D, Cioni R, Gabellini P, Cristaldi A and Pompilio M (2022) Syn-Eruptive Processes During the January–February 2019 Ash-Rich Emissions Cycle at Mt. Etna (Italy): Implications for Petrological Monitoring of Volcanic Ash. Front. Earth Sci. 10:824872. doi: 10.3389/feart.2022.824872
Received: 29 November 2021; Accepted: 25 January 2022;
Published: 14 April 2022.
Edited by:
Chiara Maria Petrone, Natural History Museum, United KingdomReviewed by:
Karoly Nemeth, Massey University, New ZealandKeiko Matsumoto, Geological Survey of Japan (AIST), Japan
Copyright © 2022 D’Oriano, Del Carlo, Andronico, Cioni, Gabellini, Cristaldi and Pompilio. This is an open-access article distributed under the terms of the Creative Commons Attribution License (CC BY). The use, distribution or reproduction in other forums is permitted, provided the original author(s) and the copyright owner(s) are credited and that the original publication in this journal is cited, in accordance with accepted academic practice. No use, distribution or reproduction is permitted which does not comply with these terms.
*Correspondence: Claudia D’Oriano, claudia.doriano@ingv.it