Green urbanization efficiency of 18 urban agglomerations in China: Evidence from spatial–temporal evolution
 Xiaofei Lv
  Lu Wang*
- College of Economics and Management, Shandong University of Science and Technology, Qingdao, China
As a highly developed spatial form of integrated cities, urban agglomeration has become an important fulcrum for promoting economic development and regional growth. Green urban efficiency is the key to achieving green growth in a country. This study propose a slack-based model with undesirable output to evaluate the green urbanization of 18 urban agglomerations in China. Analysis was performed using the integrated barycenter coordinate method, standard deviation ellipses, and the geographic detector model to determine the spatial–temporal characteristics of green urbanization efficiency and the factors that influence urban agglomerations. We found that the green urbanization efficiency of urban agglomerations in China, when plotted, revealed a curve with the shape of “∧,” which increased at first and then decreased. The spatial differentiation characteristics were not obvious as the gap was narrowing. The center of green urbanization efficiency in China’s urban agglomerations has always been located in the Central Plains, with a small overall span and a relatively fixed position. The barycenter coordinates showed a trend of shifting from east to north, but the transfer speed and rhythm were relatively slow. The explanatory power of the various factors influencing the spatial differentiation of green urbanization efficiency of urban agglomerations differed markedly. The magnitude of importance was in the order of: urban population scale > investment growth > technology level > economic development > industrial structure.
1 Introduction
Urbanization has promoted the development of social and economic goals and is important as a support for modernization (Yang et al., 2023). China’s urbanization process has advanced rapidly, increasing from 17.92% in 1978 to 59.58% in 2020, with an average annual increase of 1.09%. According to the three-stage theory of urbanization, China’s urbanization will still be in the accelerating stage in the next 10 to 15 years (Zeng et al., 2022). The rapid development of urbanization has accelerated the solution to the problems of “agriculture, rural areas, and farmers,” promoted a balance between urban and rural areas, and promoted overall social progress. However, the driving force in this rapid development has been cheap land and labor, and the extensive development based on high input, high consumption, and high pollution has caused a series of negative impacts on the sustainability of regional development (Zhao et al., 2022). Traditional urbanization has created a significant urban–rural divide, resulting in strong urban growth on the one hand and widespread deflation in rural areas on the other. As a result, urbanization has been a major contributor to China’s uneven and inadequate socioeconomic development.
Green development has become a significant trend in the world’s urban development with the goal of higher efficiency, higher output level, and greater sustainability. Green urbanization involves a deep integration of urbanization and greening, requiring that the region achieve a low-carbon footprint, and a circular, inclusive development with the goal of seeking a balance between economic growth and environmental protection. China’s urbanization rate has reached 50% for the first time in 2011, indicating that the country is no longer a rural society, but instead is transitioning to an urban one. In order to guarantee the stable and healthy development of society as well as the economy, it has become an inescapable choice for future urbanization development to reform the present policies, give attention to green leadership, and support the green urbanization process (Luo et al., 2022).
With the acceleration of green urbanization, urban agglomeration has become an important fulcrum to promote economic development and regional growth (Qian et al., 2022). It can accumulate resources for production, promote the development of industrial clusters, and effectively exploit the agglomeration and radiation effects of central cities (Zhu et al., 2023). Compared with a single city, urban agglomeration produces a highly effective platform for rapid economic growth and national participation in global competition. It is currently the main form of urbanization, and developers must pay more attention to green methods. By 2020, the 18 urban agglomerations recognized in China’s planned growth only accounted for 29.1% of the national area, but they produced more than 80% of GDP and actually utilized 92% of total foreign investment, which constitutes absolute support for China’s development (Tan et al., 2022). However, the overall development of cities in urban agglomerations in China is quite different from that of other countries, showing an uncoordinated development status. In 2020, the level of urbanization in Wuhan, the central city of the Yangtze River urban agglomeration, was 84.31%, while that of its neighbor city Huanggang was only 47.55%. The urbanization of Xiamen, the urban agglomeration on the west side of the Straits, was 86.99%, while that of Meizhou was only 45% with great regional difference. The regional differences between neighboring cities require us to pay attention to the spatial structure of urban agglomerations. According to the “green development” concept, urban agglomerations are responsible for both economic growth and green development, and carbon peaking and carbon neutrality are the objectives that must be met in the future. Optimizing the spatial structure of urban agglomerations and constructing green barriers become, especially important in planning for green urbanization efficiency. In view of the typical regional spatial differences of urban agglomerations, exploring their green urbanization efficiency from a spatio-temporal perspective is not only conducive to clarifying the current development trend but also to promoting the linkage effect among cities in the region and achieving balanced growth of large, medium, and small towns. It has important theoretical and practical value for optimizing the spatial layout, improving cluster efficiency, and realizing regional coordination.
In consideration of the problems of unbalanced regional development of the 18 typical urban agglomerations in China, this paper utilizes the section data of 2009, 2014, and 2019 to suggest integrating resources and environmental elements into the construction of an urban efficiency index system and applying the SBM (slack-based measure) model, which takes undesirable output into account in measuring efficiency. The spatio-temporal evolution characteristics and green urbanization efficiency of the urban agglomerations were determined using the barycenter coordinate and standard deviation ellipse methods. The geographic detector model was used to determine the impact of specific factors that influenced green urbanization efficiency, providing a reference for the formulation of regional strategies of local governments at all levels.
2 Literature review
Academic research on green urbanization has been accompanied by the rise in green urbanism, highlighting green urban change and transformation, involving research on “green walls” and sustainability. At present, the green urbanization practices in many countries have adopted distinctive models, among which the most representative ones include ecological low-carbon green city construction in the UK, ecological sustainability and urban “smart growth concept” in the US, and the compact model of land use. The formation and development of green concepts provides a logical starting point for the study of green urbanization (Fang and Yu, 2017). At this stage, “green urbanization” is primarily concerned with “ecological civilization” and “new urbanism,” and it is seen as a path toward “ecological balance and harmony between man and nature” by combining urban expansion with green concepts (Wang et al., 2023). This new urbanization model incorporates intensive urban development with green practices and harmonizes urban population growth and economics with wise resource use and environmental stewardship. The current development path of green urbanization is constrained by population, resources, economy, ecological environment, etc. The imbalanced growth of metropolitan areas and their excessive structural scale generate a number of problems. With the intense urban expansion, excessive consumption of soil resources, and serious ecological effects of environmental pollution, the efficiency of green urbanization has aroused widespread concern in the academic community (Yu et al., 2020). Excessive energy consumption, land degradation, and environmental damage have always been important factors limiting urban expansion. Green urbanization efficiency has likewise been inseparable from population, land, energy efficiency (Miao et al., 2021), environmental pollution (Yasmeen et al., 2020), economy (Chen et al., 2023), society (Reichenbach et al., 2021), and carbon emissions (Bai et al., 2019; Ma et al., 2019). Wang established an index system to generate an urbanization quality score, including population, economy, society, and space (Wang et al., 2019), while Zhang selected land, capital, and labor as the core elements to evaluate urbanization efficiency (Zhan et al., 2018). Kuang focused on the land, labor, agriculture, machinery, chemical fertilizers, the economy, and society (Kuang et al., 2020). Koroso et al. evaluated the consequences of urban land use and found that rapid urbanization and expansion were key factors in ULUE (Koroso et al., 2021). Green competitiveness and green industrial development were dominant in the green economic development of urban agglomerations (Wang Y. et al., 2021), and resources and environmental factors have become important constraints on high-quality urban development (Zhang and Chen, 2021).
Research on urban agglomeration originated in the early 20th century with Howard’s “The Garden City of Tomorrow.” He considered the city and surrounding countryside as a whole from the perspective of spatial organization and content dynamics and believed that the manifestation of a city included not only the area occupied by the city but also the garden areas surrounding it (Vasenev et al., 2021). Geddes studied urban agglomerations from the perspective of the aggregation of cities and believed that the rapid suburbanization of cities would produce aggregation patterns in space, emphasizing spatial overlap (Cao et al., 2022). Since then, Cottmann has put forward the concept of a megalopolis, studied the phenomenon of urban spatial agglomeration with New York City as the center, and began to pay attention to the spatial performance of urban agglomerations (Ramos-H et al., 2020). Kipnis linked urban agglomeration with industrialization, arguing that urban agglomeration provided a good regional environment for innovation and entrepreneurship, emphasizing spatial zonal distribution (Kipnis, 1984). Zhu et al. described the zonal distribution of cities around big cities with regional characteristics, gradually forming a consensus on urban agglomeration. Yang explored the multiple effects of urbanization on riverine and terrestrial organisms (Yang et al., 2022). Urban agglomerations are composed of multiple cities, which are increasingly connected with each other and jointly influence regional development. The relevant research on urban agglomeration has gone through four stages: urban, megalopolis, ecumenopolis, and urban agglomeration, focusing on urbanization level, economic growth of urban agglomerations, industrial structure, spatial structure, and land, environment, and ecological problems (Peng et al., 2022; Wang et al., 2022; Xiao et al., 2022).
Environmental concerns in urban development are receiving increasing attention from the government and local officials, and environmental protection has become a major component of urban development. Spatial pattern research has provided important new data, useful in analyzing urban problems. Jiang et al. proposed a novel approach for determining the potential spatio-temporal exposure risk of residents by capturing human behavior patterns from spatio-temporal data on parking lot availability (Jiang et al., 2021). Sun established a spatial econometric model of environmental health to investigate the direction, intensity, and spatio-temporal heterogeneity of the impact of haze pollution and its spillover effects on public health in urban agglomerations (Sun et al., 2022). Jana et al. (2020) analyzed the spatio-temporal pattern of urban expansion and its effects on changes in green space and thermal behavior in the Doon Valley between 2000 and 2019. Urbanization is associated with significant changes in the soil, vegetation, and climate, and it is important to explore its impact on soil function given its spatial–temporal variability (Vasenev et al., 2021). Zhou incorporated spatial analysis with geographical detection, to assess the urban air pollution occurrence in 337 Chinese cities (Zhou et al., 2021). Wang developed an improved method for quantitatively representing urban communities based on multiple periodic spatial–temporal graphs of human mobility (Wang et al., 2018). Wiatkowska analyzed spatial–temporal land use and land cover changes in urban areas using geographic data (Wiatkowska et al., 2021). The spatial analysis method allows scholars to study the internal relationships of cities.
The methods for assessing the evolution of spatial linkages of urban agglomerations have become more diversified and progressively better. From a single process to a combination of approaches, the barycenter coordinate method, standard deviation ellipse, and geographic detector model are the most generally used. Researchers in GCC countries and abroad have carried out comparatively thorough studies on the spatial organization of well-developed urban agglomerations, but they often focus on a single agglomeration. According to the report of the 19th National Congress of China, urban clusters should serve as the main component of a coordinated urban development pattern, and it is crucial to examine the geographical distributions of large, medium, and small urban clusters.
3 Methodology
3.1 Research context
In comparison to other nations, China has experienced industrialization and urbanization at a faster rate and on a larger scale, resulting in the emergence and expansion of several new cities. Urban agglomeration has developed into a crucial fulcrum to support economic development and regional growth as green urbanization has accelerated. Urban agglomerations suffer from a number of inherent difficulties, particularly with regard to the effects of climate change and environmental degradation. How the process of urbanization can strike a balance between increasing the population and preserving the environment is a complex topic that has yet to be thoroughly explored. Based on the National New Urbanization Plan (2014–2020), the thirteenth five-year plan (2016–2020), and related research results on the definition of urban agglomeration (Lu et al., 2022; Wu and Li, 2022; Yu et al., 2023), 18 urban agglomerations including Harbin–Changchun, Central and South Liaoning, Beijing–Tianjin–Hebei, Shandong Peninsula, and the Yangtze River Delta were selected for the study area (Figure 1) because of the availability of data and potential for statistical analysis. The code related to the 18 urban agglomerations (Table 1) is as follows.
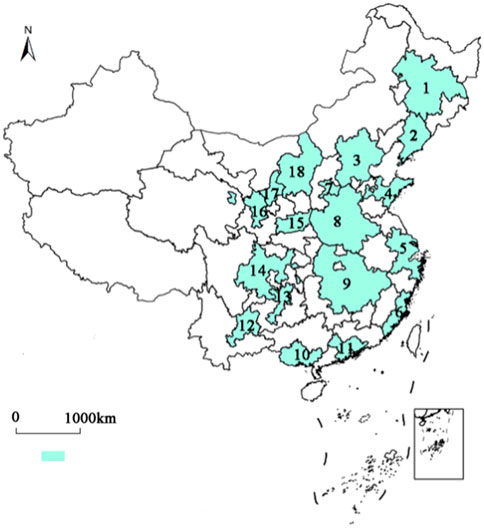
FIGURE 1. Overview of the study area.
TABLE 1. Code of 18 urban agglomerations.
3.2 Green urban efficiency
In view of the importance of the impact of resources and environmental factors on green urbanization, this paper constructed a framework (Figure 2), which considered resource consumption as a new input factor along with land, capital, labor and resources, and assumed green urbanization as the output. The output index of green urbanization is the urbanization level of each city. However, urbanization is a comprehensive evolutionary process of population, economy, and society, so this study deconstructs the green urbanization output into the separate elements of population, economic, social, spatial, and environmental urbanization. This division allows the study to characterize the impact of green urbanization in terms of population change, economic development, social inclusion, spatial equity, and environmental consumption status, respectively. In the model, environmental consumption is taken into account as an undesirable outcome, in an effort to reflect the concept of people-oriented green development in green urbanization. The details of index selection are shown in Table 2. The data were derived from the China Statistical Yearbook, the China City Statistical Yearbook, and the China Energy Statistical Yearbook in 2010, 2015, and 2020.
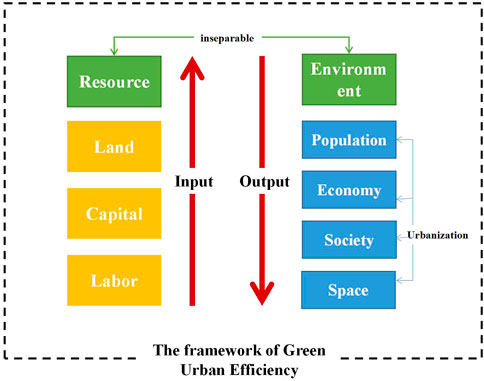
FIGURE 2. The framework of green urban efficiency.
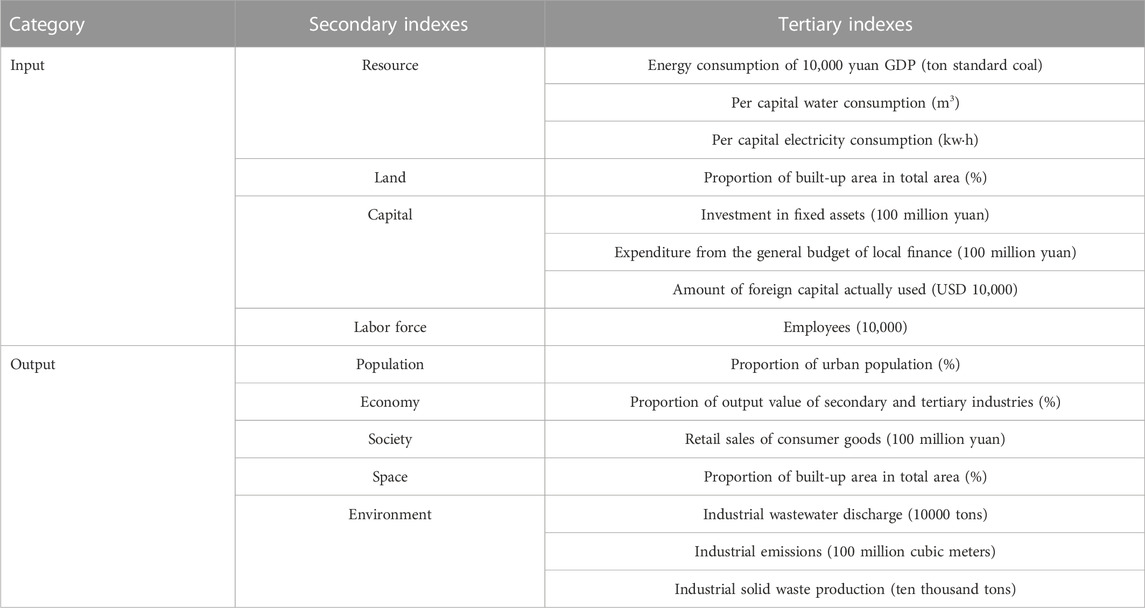
TABLE 2. Index system of green urbanization efficiency.
3.3 Methodology
3.3.1 SBM model
The SBM model proposed by Tone is introduced to measure the urbanization efficiency of urban agglomerations because it not only resolves the slack problem with input–output variables but also makes use of the non-radial and non-angled processing of undesired outputs resulting in more accurate calculation results (Li et al., 2022; G; Liu S. et al., 2022; S; Liu G. et al., 2022):
where ρ* is the urbanization efficiency of the urban agglomeration, which takes a value between [0, 1]; s-, sg, and sb are the slack variables of factor input, expected output, and undesired output, respectively; and λ is the weight vector.
3.3.2 Barycenter coordinate method
The physical meaning of the term ‘barycenter’ is the location where the combined forces of gravity operate on an object. It is derived from geometrical mechanics. The barycenter method was first used in a study of population in 1874 by F. Volker and then gradually spread to social economics and other fields. It reflects the mobility of regional factors in the spatial layout, facilitating the exploration of regional development trends over time and laying the foundation for the rational allocation of production factors. The barycenter coordinate method from the field of mathematics was introduced to analyze the spatial changes in urbanization efficiency in urban agglomerations and to describe the agglomeration characteristics and deviation trajectory of spatial attributes (Wang et al., 2021a).
In the formula: X and Y are the longitude and latitude of the geographic center coordinates, respectively; p is the score of the urbanization efficiency of urban agglomerations.
3.3.3 Standard deviation ellipse
The standard deviation ellipse proposed by Professor Lefever was introduced to reveal the spatial distribution, spatial movement direction, and discrete characteristics of the urbanization efficiency in urban agglomerations (Liu et al., 2023). The fundamental measurement parameters are rotation angle, major axis standard deviation, and minor axis standard deviation. The direction of the spatial distribution of the factors is represented by the rotation angle, which is a clockwise rotation from true north to the long axis. The direction of the major trend in the spatial distribution of urbanization efficiency in urban agglomerations is represented by the standard deviation of the major axis, whereas the range in the spatial distribution of urbanization efficiency in urban agglomerations is reflected by the standard deviation of the minor axis. The larger the ratio of the major axis to the minor axis, the more concentrated is the centripetal force of the data. A smaller ratio corresponds to a greater degree of dispersion of the data.
where tanθ is the rotation angle; σx and σy are the standard deviation of the x-axis and the standard deviation of the y-axis, respectively; (xi, yi) are the coordinates of the research object i; wi is the weight; x'i and y'i are coordinate deviations from different research objects to the average center.
3.3.4 Geographic detector model
The geographic detector model proposed by Wang Jinfeng was introduced to determine the intensity of each factor’s effect on the spatial differentiation of urbanization efficiency in urban agglomerations (Song et al., 2020). This method can not only detect numerical data and qualitative data but also explain the interaction of multiple factors.
where q is the explanatory power of a certain influencing factor on the spatial differentiation of urbanization efficiency in urban agglomerations, with values between [0, 1]. The smaller the value, the smaller the influence of a certain factor on the urbanization efficiency in urban agglomerations; the larger the value, the greater the influence. When q = 0, it means that the influencing factors have nothing to do with the spatial differentiation of urbanization efficiency in urban agglomerations; q = 0 indicates that the influencing factors can completely explain the spatial differentiation of urbanization efficiency in urban agglomerations; h is the dependent variable Y or the stratification of influencing factor X; Nh and N are the number of samples in the h layer and the study region, respectively; and σ2h and σ2 are the variance of the Y-value of the h layer and the Y-value of the study region, respectively.
4 Results and discussion
Figure 3 and Figure 4 show the spatial distribution pattern of green urbanization efficiency of urban agglomerations in 2009, 2014, and 2019. The regional color blocks indicate the green urbanization rates of the city clusters, while the yellow points represent the green urbanization rates of each individual city. The green urbanization rates of the 18 city clusters and the cities inside them were utilized to assess the regional green development.
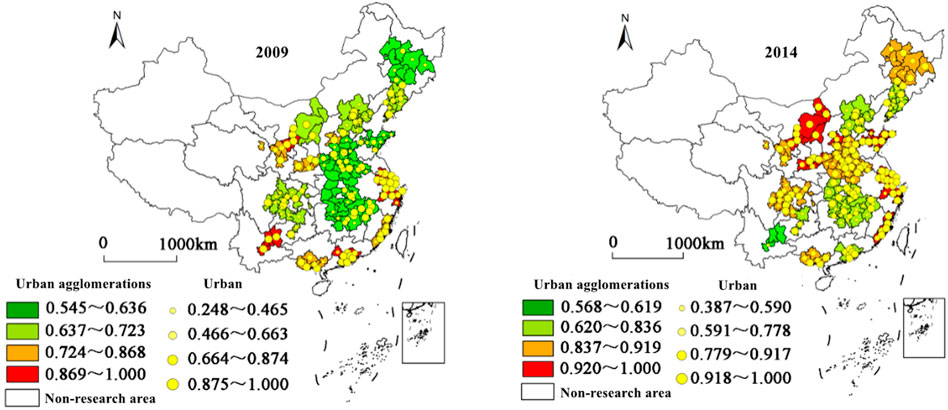
FIGURE 3. Spatial distribution pattern of the urban agglomerations in 2009, 2014.
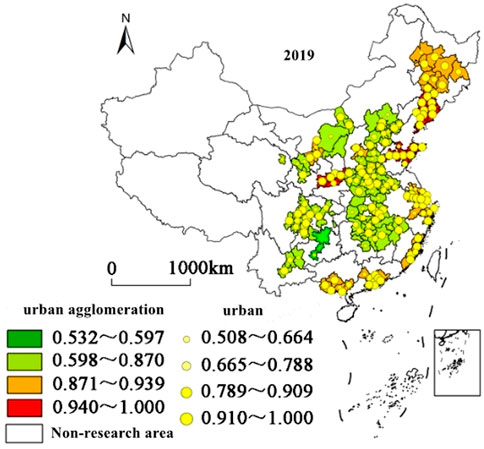
FIGURE 4. Spatial distribution pattern of the urban agglomerations in 2019.
4.1 Spatial distribution patterns of green urbanization efficiency in urban agglomerations
The graph of the overall green urbanization efficiency of China’s urban agglomerations has the shape of a “∧,” which indicates a sharp rise followed by a steep fall. The average green urbanization efficiency in the 3 years was 0.777, 0.889, and 0.886 respectively. This represents remarkable progress in urbanization development, continuous improvement in the urban system, and a tendency toward coordination in the development of urban and rural areas after implementation of the eleventh five-year plan, especially since the 2010 National Main Function Zone Plan accepted urban agglomeration as an important carrier for urbanization. However, the high-density urban agglomerations caused high-risk threats to resources and the environment; highly sensitive ecosystems were negatively affected, which diminished the continuous improvement of green urbanization efficiency. A graph of the green urbanization efficiency of the Pearl River Delta and Central Yunnan has the shape of a “∨,” with an initial decrease followed by a sharp increase. In contrast, the green urbanization efficiency of the five urban agglomerations of Beijing–Tianjin–Hebei, central and southern Liaoning, Shandong Peninsula, the central Shaanxi plain, and Harbin–Changchun showed an upward trend year by year. The green urbanization efficiency increased from 0.656, 0.720, 0.655, 0.563, and 0.563 in 2009 to 0.855, 1.000, 0.965, 0.938, and 0.938 in 2019, respectively. The largest increase was in the Harbin–Changchun urban agglomeration, which has been actively exploring new urbanization paths in major grain producing areas by accelerating the transformation of the development mode, promoting foreign cooperation, overcoming obstacles in the system and mechanism, and fully implementing green ecology in the context of the comprehensive revitalization of the old industrial base.
The spatial differentiation characteristics of green urbanization efficiency in China’s urban agglomerations have decreased. The standard deviations of green urbanization efficiency in the 3 years were 0.130, 0.085, and 0.084, respectively. The green urbanization efficiency of the urban agglomeration along the Yellow River in Ningxia (mean 0.981) was the highest. This region covers 43% of Ningxia’s land area and accounts for 80% of its cities, 90% of its urban population, and more than 90% of its GDP and fiscal revenue. The region exhibited high land use efficiency and has become a strategic area for regional economic development, along with the six functions of the economic lifeline line, ecological landscape line, characteristic city line and cultural display line, and others still to be built. The green urbanization efficiency of the Yangtze River Delta urban agglomeration (mean 0.931) was the second highest. Its urbanization program developed early, and it has always been in the forefront of China’s urbanization development by improving key urban functions, optimizing urban population distribution, and promoting integrated construction. The green urbanization efficiency (mean 0.726) of the urban agglomeration in central Guizhou was the lowest. The backward level of economic development, extensive economic growth mode, fragile ecological environment, and limited development space were the main factors restricting its development. From the perspective of 173 prefecture-level cities, the green urbanization efficiency (mean 1.000) of 26 cities including Beijing, Shanghai, and Nanjing has reached an ideal state, which indicates that under certain input conditions of capital and resources in the process of urbanization, these cities can achieve maximum output. Jiujiang’s green urbanization efficiency (mean 0.442) was the lowest among the prefecture-level cities. Its environmental pollution, aging population, and imbalance between consumption in urban and rural areas led to serious inefficiency and waste in its urbanization development (Figures 3, 4).
4.2 The spatial–temporal evolution characteristics of green urbanization efficiency in urban agglomerations
The barycenter coordinate and standard deviation ellipse model were used to obtain the barycenter coordinate and standard deviation ellipse of green urbanization efficiency of China’s urban agglomerations in 2009, 2014, and 2019 by using ArcGIS10.2 software for data processing.
From the perspective of the distribution of barycenter Table 3, the centers of green urbanization efficiency of China’s urban agglomerations in the 3 years are all located in the Central Plains urban agglomerations, which is between 113°55′E ∼ 114°21′E and 32°25′N ∼ 33°52′N, showing that the overall span is small and the location is relatively fixed. This is closely related to the location advantage of the Central Plains urban agglomeration linking east to west and north to south, the better urban spatial aggregation form, the strong industrial cluster advantage, and the policy of “1+4” Zhengzhou metropolitan area. In addition, the National New Urbanization Plan (2014–2020) clearly points out that the Central Plains urban agglomeration should be built into an important growth pole that promotes balanced development of land and space and leads regional economic development in the future, so as to provide demonstration samples for promoting urbanization development of urban agglomeration as the main form. All these make the urbanization of Central Plains urban agglomeration present a trend of factors aggregation, win–win cooperation, and rapid rise. In general, the barycenter coordinate of green urbanization efficiency in China’s urban agglomerations shows a trend of shifting to the east-north. It can be seen that the green urbanization efficiency of urban agglomerations in northeastern China has been improved to a certain extent, but the speed and pace of improvement are relatively slow, which is more restricted by medium-high economic growth, declining demographic dividend and prominent environmental problems.
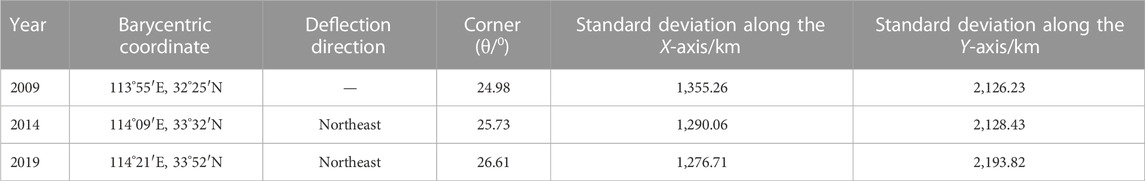
TABLE 3. Gravity center evolution of the spatial layout.
From the standard deviation ellipse (Figure 5), the green urbanization efficiency of China’s urban agglomeration shows a northeast-southwest trend, indicating that urban agglomerations with high green urbanization efficiency are mostly distributed along the northeast-southwest direction. The green urbanization efficiency of urban agglomerations in the southeast of the ellipse axis improved faster than that in the northwest. The rotation angle θ in the 3 years has increased from 24.980 to 26.610, and it rotates counterclockwise to the west. It can be seen that the implementation of the “Belt and Road” Initiative, new urbanization construction, and regional coordinated development strategy have provided strong impetus and new guidance for the urbanization development of the urban agglomeration along the Yellow River in Ningxia, the central Shaanxi plain, and other western regions. The agglomeration capacity of factors has been continuously improved, the urban system has been improved, and the urban connection has been increasingly closed. From 2009 to 2019, the distribution range of the standard deviation ellipse of green urbanization efficiency in urban agglomeration decreased first and then increased, and the standard deviation ellipse areas of the 3 years were 226.32 × 10⁴ km2, 215.65 × 10⁴ km2, and 219.98 × 10⁴ km2, respectively. The standard deviation of the long axis and the short axis changed to varying degrees, among which the long axis has increased from 2,126.23 km in 2009–2,193.82 km in 2019, and the short axis has decreased from 1,355.26 in 2009 to 1,276.71 km in 2019, indicating that although the spatial distribution of green urbanization efficiency in China’s urban agglomerations has begun to disperse, its spatial distribution pattern remains stable. The spatial spillover effect is still not obvious, and it is still dominated by the northeast-southwest direction, while the influence of the northwest-southeast direction is weak.
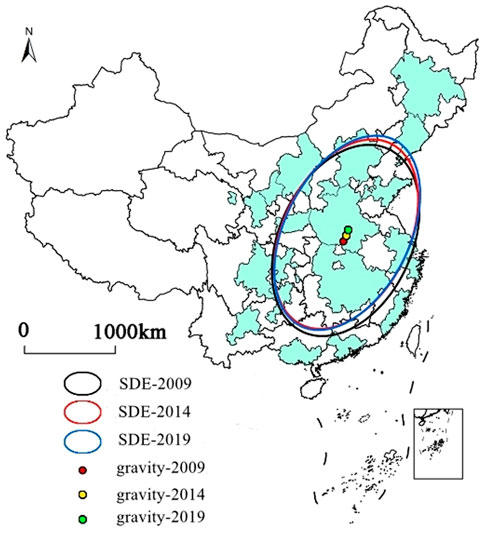
FIGURE 5. Dispersion trends of spatial distribution pattern.
4.3 Analysis of influencing factors of green urbanization efficiency in urban agglomerations
Combined with the urbanization development characteristics of urban agglomerations (Fang and Yu, 2017), this paper believes that urban population size, economic development, industrial structure, technological level, and investment are the main influencing factors of green urbanization efficiency in urban agglomeration (Ningyi Liu, 2022; Tan et al., 2022; Wang Y. et al., 2021). Specific indexes are selected as shown in Table 4. The natural break point method in ArcGIS is used to divide these factors into five levels for data discretization. The effects of these indicators on the regional differentiation of urban agglomeration green urbanization efficiency are analyzed using the geographic detector model. The result shows that the explanatory power of different influencing factors on the spatial differentiation of green urbanization efficiency in urban agglomerations is different, and the order of explanatory power is urban population size > investment > technological level > economic development > industrial structure, and the corresponding detection factor q values are .4603, .3334, .2941, .1903, and .0906, respectively. We can find that:
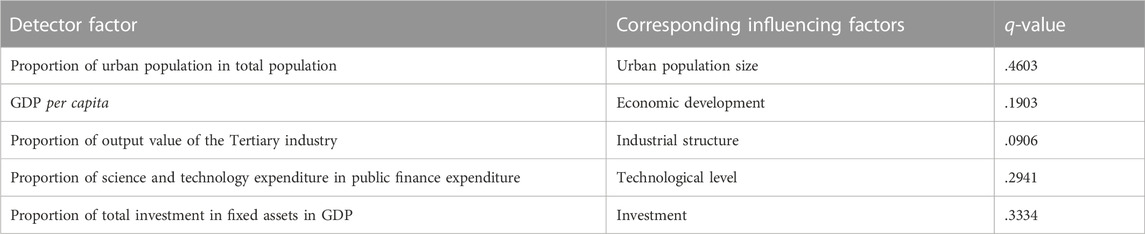
TABLE 4. Result of the factor detector.
The size of the urban population is the most important factor affecting the spatial differentiation of green urbanization efficiency in urban agglomerations. Among them, the urban population in the eastern urban agglomerations such as the Pearl River Delta, Beijing–Tianjin–Hebei, Yangtze River Delta, and Shandong Peninsula accounts for more than 65% of the total population. The geographical environment, better economic foundation, supporting public services, and related preferential policies make people from small and medium-sized cities and rural areas continue to gather in these regions on a large scale, thus realizing regional industrial transformation and upgrading and continuously enhancing development vitality. The urban agglomerations of Chengdu–Chongqing, Beibu Gulf, central Guizhou, and central Yunnan account for only about 40% of the urban population, and they are facing the dilemma of population shrinkage. The labor supply has encountered bottlenecks, and the endogenous driving force for economic growth is insufficient. On the basis of improving the soft and hard environment, the attraction of external population should be the focus of their future work.
Investment is a secondary factor affecting the spatial differentiation of green urbanization efficiency in urban agglomerations, which is particularly important when the proportion of fiscal expenditure decreases in high-quality stage of the economy. Among them, the central Guanzhong, Lanxi, and other urban agglomerations are important inter-provincial urban agglomerations in western China. Under the influence of the “Belt and Road” construction and the development of the Yangtze River Economic Belt, fixed asset investment accounts for more than 120% of the regional GDP. It aims to effectively build a new pattern of opening up both internally and externally and to create an important growth pole leading northwest China’s development by connecting multi-level transportation network and improving communications and water conservancy facilities guarantee ability. In comparison, the proportion of total investment in fixed assets in GDP in the central and southern Liaoning urban agglomeration is only 31.52%. The fundamental crux is the deep-seated contradiction between system and structure. In the future, we should continue to further promote the reform of “delegate power, improve regulation, and upgrade services,” strengthen the construction of convenient service platform, improve the service efficiency, and focus on improving the soft environment for investment.
Technological level, economic development, and industrial structure are important factors influencing the spatial differentiation of green urbanization efficiency in urban agglomerations, mainly manifested in the relatively poorer ability of independent innovation, the lower level of local transformation of achievements, and the failure to effectively integration various scientific research force. Urban function positioning and labor division are unclear, driving and radiation capabilities of the core city are weak, small, and medium-sized cities and towns on the periphery are insufficient, and the polarization phenomena are still readily apparent. Accordingly, the enhancement of innovation driving force based on the construction of collaborative innovation system, the high-quality economic development based on the "five-sphere integrated plan” overall promotion, and the industrial structural transformation based on the construction of modern industrial system should become the focus of improving the green urbanization efficiency of urban agglomeration in the future.
5 Conclusion
In this study, we integrated resources and environment elements, barycenter coordinate method, standard deviation ellipse, and geographic detector model to understand the spatial–temporal characteristics of green urbanization efficiency in 18 urban agglomerations and to study the population size, economic development, industrial structure, technological level, and investment effects on the green urbanization efficiency. Our empirical study in the 18 urban agglomerations demonstrates that the spatial differentiation of urban agglomerations is shrinking, and the specific performance is as follows:
1) The overall green urbanization efficiency of China’s urban agglomerations shows a “∧” characteristic. The average green urbanization efficiency of the 3 years is .777, .889, and .886. Only the green urbanization efficiency in the five urban agglomerations of Beijing–Tianjin–Hebei, central and southern Liaoning, Shandong Peninsula, Guanzhong, and Harbin–Changchun is increasing year by year. The spatial differentiation characteristics are not obvious, and the gap is narrowing. The standard deviation of green urbanization efficiency in the 3 years was .130, .085, and .084. The Ningxia Yanhuang was the highest, while that in central Guizhou urban agglomeration was the lowest, with a difference of 1.35 times.
2) The center of green urbanization efficiency in China’s urban agglomerations has always been located in the Central Plains urban agglomeration, with a small overall span and a relatively fixed position. The barycenter coordinates of green urbanization efficiency in urban agglomeration show a trend of shifting from east to north, but the transfer speed and rhythm are relatively slow. With the passage of time, the spatial distribution of green urbanization efficiency in urban agglomerations starts to disperse, and the green urbanization efficiency in western urban agglomerations continues to improve, but the spatial distribution pattern is still stable, with the northeast-southwest direction dominating, and the northeast-southeast direction having a weak influence.
3) Different influencing factors have different explanatory powers on the spatial differentiation of green urbanization efficiency in urban agglomerations. The order of explanatory power is urban population size > investment > technological level > economic development > industrial structure. The values of corresponding detection factor q are, respectively, .4603, .3334, .2941, .1903, and .0906. Among them, the urban population size is the most important factor and talent attraction is the most important with the improving environment. The investment is the secondary factor, which is particularly important in the high-quality stage of economic development.
In conclusion, the research on green urbanization efficiency of urban agglomeration under the restrictions of resources and environment involves the scientific construction of the input–output index system, a comprehensive grasp of the connotation of urbanization quality, which is a long-term systematic project and requires gradual progress. The research results of this paper on the spatial–temporal evolution of green urbanization efficiency of urban agglomerations in China and its influencing factors are relatively preliminary, and further research is needed in the future: First, a long time panel data will be used to analyze green urbanization efficiency in urban agglomerations so as to accurately grasp the spatial–temporal evolution rules and systematically summarize problems. Second, we can measure and compare the green urbanization efficiency of different types and grades in urban agglomerations, including national urban agglomerations, regional urban agglomerations, and local urban agglomerations, discussing and proposing different strategies to improve the green urbanization efficiency in urban agglomerations. Third, we can try to build the research framework system of green urbanization efficiency in urban agglomeration from other perspectives such as integration, innovation, and openness and promote all-round improvement of urbanization quality in urban agglomerations.
Data availability statement
Publicly available datasets were analyzed in this study. These data can be found at: https://data.stats.gov.cn/easyquery.htm?cn=C01 https://data.stats.gov.cn/.
Author contributions
XL and LW conceived and designed the experiments; LW analyzed the data; and XL and LW wrote the manuscript.
Funding
This research was funded by the Social Science Planning Programs of Shandong Province, under grant number 21DJJJ16.
Conflict of interest
The authors declare that the research was conducted in the absence of any commercial or financial relationships that could be construed as a potential conflict of interest.
Publisher’s note
All claims expressed in this article are solely those of the authors and do not necessarily represent those of their affiliated organizations, or those of the publisher, the editors, and the reviewers. Any product that may be evaluated in this article, or claim that may be made by its manufacturer, is not guaranteed or endorsed by the publisher.
References
Bai, Y., Deng, X., Gibson, J., Zhao, Z., and Xu, H. (2019). How does urbanization affect residential CO2 emissions? An analysis on urban agglomerations of China. J. Clean. Prod. 209, 876–885. doi:10.1016/j.jclepro.2018.10.248
Cao, Z., Yan, Y., and Tang, K. (2022). Path optimization of open collaborative innovation of energy industry in urban agglomeration based on particle swarm optimization algorithm. Energy Rep. 8, 5533–5540. doi:10.1016/j.egyr.2022.04.020
Chen, W., Wang, G., and Zeng, J. (2023). Impact of urbanization on ecosystem health in Chinese urban agglomerations. Environ. Impact Assess. Rev. 98, 106964. doi:10.1016/j.eiar.2022.106964
Fang, C., and Yu, D. (2017). Urban agglomeration: An evolving concept of an emerging phenomenon. Landsc. Urban Plan. 162, 126–136. doi:10.1016/j.landurbplan.2017.02.014
Jana, C., Mandal, D., Shrimali, S. S., Alam, N. M., Kumar, R., Sena, D. R., et al. (2020). Assessment of urban growth effects on green space and surface temperature in Doon Valley, Uttarakhand, India. Environ. Monit. Assess. 192 (4), 257. doi:10.1007/s10661-020-8184-7
Jiang, P., Fu, X., Fan, Y. V., Klemeš, J. J., Chen, P., Ma, S., et al. (2021). Spatial-temporal potential exposure risk analytics and urban sustainability impacts related to COVID-19 mitigation: A perspective from car mobility behaviour. J. Clean. Prod. 279, 123673. doi:10.1016/j.jclepro.2020.123673
Kipnis, B. A. (1984). Role and timing of complementary objectives of a regional policy, the case of Northern Israel. Geoforum 15 (2), 191–200. doi:10.1016/0016-7185(84)90031-9
Koroso, N. H., Lengoiboni, M., and Zevenbergen, J. A. (2021). Urbanization and urban land use efficiency: Evidence from regional and Addis Ababa satellite cities, Ethiopia. Habitat Int. 117, 102437. doi:10.1016/j.habitatint.2021.102437
Kuang, B., Lu, X., Zhou, M., and Chen, D. (2020). Provincial cultivated land use efficiency in China: Empirical analysis based on the SBM-DEA model with carbon emissions considered. Technol. Forecast. Soc. Change 151, 119874. doi:10.1016/j.techfore.2019.119874
Li, G., Wang, P., and Pal, R. (2022). Measuring sustainable technology R&D innovation in China: A unified approach using DEA-SBM and projection analysis. Expert Syst. Appl. 209, 118393. doi:10.1016/j.eswa.2022.118393
Liu, G., Fu, X., Zhuang, T., Huang, R., and Wu, H. (2022a). Provincial performance assessment of neighborhood regeneration based on a super-SBM model and the malmquist indices: A China study. Sustain. Prod. Consum. 32, 593–606. doi:10.1016/j.spc.2022.05.016
Liu, K., Xue, Y., Chen, Z., and Miao, Y. (2023). The spatiotemporal evolution and influencing factors of urban green innovation in China. Sci. Total Environ. 857, 159426. doi:10.1016/j.scitotenv.2022.159426
Liu, S., Park, S., Choi, Y., and Yeo, G. (2022b). Efficiency evaluation of major container terminals in the top three cities of the Pearl River Delta using SBM-DEA and undesirable DEA. Asian J. Shipp. Logist. 38 (2), 99–106. doi:10.1016/j.ajsl.2022.03.001
Lu, H., Zhang, C., Jiao, L., Wei, Y., and Zhang, Y. (2022). Analysis on the spatial-temporal evolution of urban agglomeration resilience: A case study in chengdu-chongqing urban agglomeration, China. Int. J. Disaster Risk Reduct. 79, 103167. doi:10.1016/j.ijdrr.2022.103167
Luo, Q., Zhou, J., Zhang, Y., Yu, B., and Zhu, Z. (2022). What is the spatiotemporal relationship between urbanization and ecosystem services? A case from 110 cities in the Yangtze River Economic Belt, China. J. Environ. Manage. 321, 115709. doi:10.1016/j.jenvman.2022.115709
Ma, M., Cai, W., Cai, W., and Dong, L. (2019). Whether carbon intensity in the commercial building sector decouples from economic development in the service industry? Empirical evidence from the top five urban agglomerations in China. J. Clean. Prod. 222, 193–205. doi:10.1016/j.jclepro.2019.01.314
Miao, Z., Chen, X., and Baležentis, T. (2021). Improving energy use and mitigating pollutant emissions across “three regions and ten urban agglomerations”: A city-level productivity growth decomposition. Appl. Energy 283, 116296. doi:10.1016/j.apenergy.2020.116296
Ningyi Liu, Y. W., and Wang, Y. (2022). Urban agglomeration ecological welfare performance and spatial convergence research in the yellow river basin. land 11, 2073. doi:10.3390/land11112073
Peng, D., Li, R., Shen, C., and Wong, Z. (2022). Industrial agglomeration, urban characteristics, and economic growth quality: The case of knowledge-intensive business services. Int. Rev. Econ. Finance 81, 18–28. doi:10.1016/j.iref.2022.05.001
Qian, Y., Wang, H., and Wu, J. (2022). Spatiotemporal association of carbon dioxide emissions in China's urban agglomerations. J. Environ. Manage. 323, 116109. doi:10.1016/j.jenvman.2022.116109
Ramos-H, D., Medellín, R. A., and Morton-Bermea, O. (2020). Insectivorous bats as biomonitor of metal exposure in the megalopolis of Mexico and rural environments in Central Mexico. Environ. Res. 185, 109293. doi:10.1016/j.envres.2020.109293
Reichenbach, M., Pinto, A., Malik, P. K., Bhatta, R., König, S., and Schlecht, E. (2021). Dairy feed efficiency and urbanization – A system approach in the rural-urban interface of Bengaluru, India. Livest. Sci. 253, 104718. doi:10.1016/j.livsci.2021.104718
Song, Y., Wang, J., Ge, Y., and Xu, C. (2020). An optimal parameters-based geographical detector model enhances geographic characteristics of explanatory variables for spatial heterogeneity analysis: Cases with different types of spatial data. GIScience remote Sens. 57 (5), 593–610. doi:10.1080/15481603.2020.1760434
Sun, H., Yang, X., and Leng, Z. (2022). Research on the spatial effects of haze pollution on public health: Spatial–temporal evidence from the Yangtze River Delta urban agglomerations, China. Environ. Sci. Pollut. R. 29 (29), 44422–44441. doi:10.1007/s11356-022-19017-0
Tan, F., Gong, C., and Niu, Z. (2022). How does regional integration development affect green innovation? Evidence from China's major urban agglomerations. J. Clean. Prod. 379, 134613. doi:10.1016/j.jclepro.2022.134613
Vasenev, V., Varentsov, M., Konstantinov, P., Romzaykina, O., Kanareykina, I., Dvornikov, Y., et al. (2021). Projecting urban heat island effect on the spatial-temporal variation of microbial respiration in urban soils of Moscow megalopolis. Sci. Total Environ. 786, 147457. doi:10.1016/j.scitotenv.2021.147457
Wang, C., Zang, X., Zhang, X., Liu, Y., and Zhao, J. (2021a). Parameter estimation and object gripping based on fingertip force/torque sensors. Measurement 179, 109479. doi:10.1016/j.measurement.2021.109479
Wang, J., Wang, S., Li, S., and Feng, K. (2019). Coupling analysis of urbanization and energy-environment efficiency: Evidence from Guangdong province. Appl. Energy 254, 113650. doi:10.1016/j.apenergy.2019.113650
Wang, P., Fu, Y., Zhang, J., Li, X., and Lin, D. (2018). Learning urban community structures. ACM Trans. Intel. Syst. Tec. 9 (6), 1–28. doi:10.1145/3209686
Wang, Q., Liu, S., Liu, Y., Wang, F., Liu, H., and Yu, L. (2022). Effects of urban agglomeration and expansion on landscape connectivity in the river valley region, Qinghai-Tibet Plateau. Glob. Ecol. Conservation 34, e02004. doi:10.1016/j.gecco.2022.e02004
Wang, X., Chu, B., Ding, H., and Chiu, A. S. F. (2023). Impacts of heterogeneous environmental regulation on green transformation of China's iron and steel industry: Evidence from dynamic panel threshold regression. J. Clean. Prod. 382, 135214. doi:10.1016/j.jclepro.2022.135214
Wang, Y., Hu, H., Dai, W., and Burns, K. (2021b). Evaluation of industrial green development and industrial green competitiveness: Evidence from Chinese urban agglomerations. Ecol. Indic. 124, 107371. doi:10.1016/j.ecolind.2021.107371
Wiatkowska, B., Słodczyk, J., and Stokowska, A. (2021). Spatial-Temporal land use and land cover changes in urban areas using remote sensing images and GIS analysis: The case study of opole, Poland. Geosciences 11 (8), 312. doi:10.3390/geosciences11080312
Wu, S., and Li, H. (2022). Prediction of PM2.5 concentration in urban agglomeration of China by hybrid network model. J. Clean. Prod. 374, 133968. doi:10.1016/j.jclepro.2022.133968
Xiao, R., Guo, Y., Zhang, Z., and Li, Y. (2022). A hidden markov model based unscented kalman filtering framework for ecosystem health prediction: A case study in shanghai-hangzhou bay urban agglomeration. Ecol. Indic. 138, 108854. doi:10.1016/j.ecolind.2022.108854
Yang, M., Gao, X., Siddique, K. H. M., Wu, P., and Zhao, X. (2023). Spatiotemporal exploration of ecosystem service, urbanization, and their interactive coercing relationship in the Yellow River Basin over the past 40 years. Sci. Total Environ. 858, 159757. doi:10.1016/j.scitotenv.2022.159757
Yang, Y., Chen, H., Abdullah Al, M., Ndayishimiye, J. C., Yang, J. R., Isabwe, A., et al. (2022). Urbanization reduces resource use efficiency of phytoplankton community by altering the environment and decreasing biodiversity. J. Environ. Sci.-China. 112, 140–151. doi:10.1016/j.jes.2021.05.001
Yasmeen, H., Tan, Q., Zameer, H., Tan, J., and Nawaz, K. (2020). Exploring the impact of technological innovation, environmental regulations and urbanization on ecological efficiency of China in the context of COP21. J. Environ. Manage. 274, 111210. doi:10.1016/j.jenvman.2020.111210
Yu, X., Wu, Z., Zheng, H., Li, M., and Tan, T. (2020). How urban agglomeration improve the emission efficiency? A spatial econometric analysis of the Yangtze River Delta urban agglomeration in Chinaa spatial econometric analysis of the Yangtze River Delta urban agglomeration in China. J. Environ. Manage. 260, 110061. doi:10.1016/j.jenvman.2019.110061
Yu, Y., Dai, Y., Xu, L., Zheng, H., Wu, W., and Chen, L. (2023). A multi-level characteristic analysis of urban agglomeration energy-related carbon emission: A case study of the Pearl River Delta. Energy 263, 125651. doi:10.1016/j.energy.2022.125651
Zeng, L., Zhao, Y., and Wang, X. (2022). How to develop the new urbanization in mineral resources abundant regions in China? A VIKOR-based path matching model. Resour. Policy 79, 103095. doi:10.1016/j.resourpol.2022.103095
Zhan, J., Zhang, F., Jia, S., Chu, X., and Li, Y. (2018). Spatial pattern of regional urbanization efficiency: An empirical study of shanghai. Comput. Econ. 52 (4), 1277–1291. doi:10.1007/s10614-017-9744-y
Zhang, C., and Chen, P. (2021). Industrialization, urbanization, and carbon emission efficiency of Yangtze River Economic Belt—Empirical analysis based on stochastic frontier model. Environ. Sci. Pollut. R. 28 (47), 66914–66929. doi:10.1007/s11356-021-15309-z
Zhao, Y., Shi, Y., Feng, C., and Guo, L. (2022). Exploring coordinated development between urbanization and ecosystem services value of sustainable demonstration area in China-take Guizhou Province as an example. Ecol. Indic. 144, 109444. doi:10.1016/j.ecolind.2022.109444
Zhou, D., Lin, Z., Liu, L., and Qi, J. (2021). Spatial-temporal characteristics of urban air pollution in 337 Chinese cities and their influencing factors. Environ. Sci. Pollut. R. 28 (27), 36234–36258. doi:10.1007/s11356-021-12825-w
Keywords: green urbanization efficiency, green development, spatial–temporal evolution, influencing factor, urban agglomeration
Citation: Lv X and Wang L (2023) Green urbanization efficiency of 18 urban agglomerations in China: Evidence from spatial–temporal evolution. Front. Earth Sci. 10:1121333. doi: 10.3389/feart.2022.1121333
Received: 11 December 2022; Accepted: 28 December 2022;
Published: 19 January 2023.
Edited by:
Xander Wang, University of Prince Edward Island, CanadaReviewed by:
Fan Wu, Shandong Academy of Social Sciences, ChinaXiaoli Lu, Dalian University of Technology, China
Copyright © 2023 Lv and Wang. This is an open-access article distributed under the terms of the Creative Commons Attribution License (CC BY). The use, distribution or reproduction in other forums is permitted, provided the original author(s) and the copyright owner(s) are credited and that the original publication in this journal is cited, in accordance with accepted academic practice. No use, distribution or reproduction is permitted which does not comply with these terms.
*Correspondence: Lu Wang, wanglu0809@126.com