Research on the efficiency of green development of industry in Chinese prefecture-level oil and gas cities based on super-efficient SBM-DEA model and Malmquist index
 Sun Fei
 Sun Chongliang2*
 - 1School of Economics and Management, Northeast Petroleum University, Daqing, Heilongjiang, China
- 2Daqing Oilfield Design Institute Ltd., Daqing, Heilongjiang, China
- 3Institute of Petroleum Economics and Management, Northeast Petroleum University, Daqing, Heilongjiang, China
With the proposal of Industrial Green Development Plan (2016–2020), it is particularly urgent to focus on the industrial green development of oil and gas cities, actively promote industrial energy efficiency, reduce pollution emissions, and measure the efficiency of their industrial green development. Based on the actual situation of oil and gas cities, we apply the Super-SBM model to measure the industrial green development efficiency of oil and gas cities in 15 years from 2004 to 2018, analyze the spatial and temporal evolution trends and characteristics of industrial green development efficiency, and also calculate the Malmquist index to dynamically analyze the industrial green development efficiency of oil and gas cities. The results show that the industrial green development efficiency of oil and gas cities as a whole is not high from 2004 to 2018, showing a gentle “W” type fluctuation change. From the spatial dimension, there are significant differences in industrial green development efficiency among oil and gas cities in the east, central and west, with the efficiency value is relatively higher in the west. The total factor productivity of industrial green development is most influenced by the changes of technical efficiency and technological progress. In view of the above problems, it is recommended to broaden green technology innovation channels, increase green technology innovation investment, build a new mechanism for regional synergistic development, and formulate regional graded development strategies.
1 Introduction
Oil and gas cities are resource-based cities with oil and gas extraction and processing as their pillar industries, which have a large share of resource extraction and related industries in their industrial structure. However, long-term oil and gas exploitation has brought comparatively large impact on the ecology. For example, the oilfield development can cause air pollution in oil and gas cities. The pollutants mainly include SO2, smoke, dust, NOX, CO and total hydrocarbons. Oil development under the direction of the latest geology research (Ma et al., 2021; Zou et al., 2021; Feng et al., 2022; Meng, 2022; Wang et al., 2022; Wang et al., 2022) will also pollute the soil, with the large amounts of pollutants, such as NaCL, NaOH, and Na2Co3. Now the resulting environmental problems have gradually attracted attention. Under the new normal, with the tightening of China’s resources and environment, the industrial green development of oil and gas cities has become inevitable under the constraint of resources and environmental carrying capacity. The “14th Five-Year Plan” for Industrial Green Development clearly puts forward that by 2025, the green and low-carbon transformation of industrial structure and production methods will achieve significant results, green and low-carbon technologies and equipment will be widely used, energy and resource utilization efficiency will be greatly improved, and the level of green manufacturing will be comprehensively enhanced. The report of the 20th National Congress of the Communist Party of China also proposed to accelerate the green transformation of the development mode, and put forward a series of clear requirements in this regard, emphasizing to “develop green and low-carbon industries,” “accelerate the research and development, promotion and application of advanced technologies for energy conservation and carbon reduction,” etc. It can be seen that promoting the industrial green development of oil and gas cities means taking the concept of green development as an important development goal throughout the whole process and field of industry, with “efficient, sustainable, recycling, low-carbon” as the core, effectively using resources and energy, and reducing pollutant emissions. Therefore, the key is to improve “industrial green development efficiency.” In view of this, it is especially urgent to pay attention to the industrial green development efficiency of oil and gas cities, actively promote industrial energy efficiency, reduce pollution emissions, and measure the industrial green development efficiency of oil and gas cities.
2 Literature review
Research on the efficiency of industrial green development originated from green technical efficiency, which was first measured by Pittman (1983) using an index that included non-desired outputs. After that, German scholar Schaltegger (1990) proposed the concept of industrial eco-efficiency, and Hoh et al. (2001) used productivity indicators in the EEA model to evaluate industrial eco-efficiency in Germany. Considering the slack problem of non-desired output and input-output variables arising from production, Tone (2001) proposed a non-radial and non-angular SBM model that can effectively solve the slackness problem of non-desired output and input-output variables, and the model was widely used for measuring environmental and resource efficiency. Ramarkrishnan (2006), Ugur Soytasa et al. (2009) used data envelopment analysis to examine the dependence between variables such as energy use, income and carbon emissions and found a significant correlation between energy consumption and income. Quariguasi et al. (2019) used the ecological topology approach to further expand the evaluation index of industrial green development efficiency to include multiple aspects such as energy consumption and consumption of specific substances to measure industrial green development efficiency. The current studies on industrial green development efficiency at home and abroad are generally conducted from the input-output perspective, selecting appropriate models to measure the study, focusing on analyzing the current situation and making predictions for the future. Some studies have also used DEA models under variable returns to scale and super-efficient SBM models in conducting efficiency assessments. Scholars represented by Wang et al. (2019), Zhang et al. (2020), Wang (2020), Wu et al. (2018), Ding et al. (2019), and Zhao et al. (2022) used a global super-efficiency SBM model, selecting capital, labor, technology, and resources as input indicators, regional GDP as desired output indicators, and industrial wastewater, industrial waste gas, and industrial solid waste emissions as non-desired outputs. With this method, the industrial green development efficiency of 30 provinces (autonomous regions and municipalities directly under the central government), Yangtze River Economic Belt and Yellow River Basin were measured. The results of the study showed that the industrial green development efficiency of Chinese provinces showed a general trend of fluctuating increase in the time dimension, and the regional differences of industrial green development efficiency were obvious, and the industrial green development efficiency measured by provinces was in a state of fluctuating growth (Wu et al., 2018; Ding et al., 2019; Wang et al., 2019; Wang et al., 2020; Zhang et al., 2020).
In summary, foreign studies have been able to balance normative and econometric analysis. Although domestic studies started late, we have made great progress in terms of research objects and methods, such as focusing on national, provincial and municipal areas to measure the efficiency of industrial green development, focusing on the use of traditional CCR and BCC models, as well as super-efficient SBM models and other quantitative analysis tools to measure the efficiency of industrial green development and analyze its influencing factors. Although the measurement of industrial green development efficiency is becoming more and more accurate, the measurement of industrial green development efficiency in oil and gas cities has not been covered yet. Therefore, this paper adopts the Super-SBM model to measure the industrial green development efficiency of prefecture-level oil and gas cities in China during the 15-year period from 2004 to 2018, analyzes the spatial and temporal evolution trends and characteristics of industrial green development efficiency, calculates the Malmquist index to dynamically analyze the industrial green development efficiency of oil and gas cities, and proposes measures to improve the industrial green development efficiency of oil and gas cities.
3 Research methodology and data sources
3.1 Super-SBM model
The current efficiency evaluation methods commonly used in academia mainly include non-parametric analysis and parametric analysis, among which, non-parametric analysis is based on data envelopment analysis (DEA) and parametric analysis is based on stochastic frontier analysis (SFA). Since SFA assumes that random errors obey a specific probability distribution and relies on the production function under multiple constraints, it is difficult to meet the requirements of realistic data and conditions (Dong and Wu, 2017), so the SFA method is seldom chosen by academics for efficiency evaluation. The DEA method, on the other hand, based on the idea of linear programming with the help of input-output data, compares the deviation of each decision unit from the production frontier to measure and evaluate its relative efficiency, which is accepted and improved by a wide range of scholars (Li and Xia, 2017). Tone has improved the SBM model based on the proposed non-radial, non-angle SBM model (slacks-based measure) and proposed the Super-SBM model that allows the efficiency value of the decision unit to be greater than one (Tone, 2001). In this paper, the Super-SBM model is used to measure the efficiency of green development in oil and gas urban industries considering non-desired outputs, and the model is as follows.
Tone defines a finite set of production possibilities that exclude the decision unit
where p\(x0, y0) is the set of production inputs excluding (x0,y0), and on top of this set of inputs a subset
since X>0, Y>0, therefore,
where the
Translating the above equation into a linear program that can be solved:
The optimal solution of the original plan can be obtained from the optimal solution
3.2 Indicator system construction
As the green development of urban industry is not only to achieve urban economic development, but also needs to carry out urban environmental pollution control and improve and restore urban ecology. Therefore, the efficiency of oil and gas city on industrial green development will reflect the coordinated development relationship among economic growth, social development, environmental protection and resource conservation. The measurement of efficiency generally chooses DEA method, and the evaluation index delineation is usually divided into two categories: input and output. Considering the relationship between the number of input and output indicators and the number of decision units (the decision units in this paper are 14 prefecture-level oil and gas cities), the final choice is to use resources, capital and labor as input indicators, and use urban industrial added value and environmental pollution composite index (calculated based on the emissions of industrial wastewater, industrial sulfur dioxide and industrial soot) as output indicators (Zhao, 2019; Sun and Yang, 2021). Based on the principles of data availability, operability, scientificity, representativeness and independence, and by reference to the index construction methods in relevant literature, the input-output index system of industrial green development efficiency of oil and gas cities in China is established, and the specific input and output indicators are shown in Table 1.
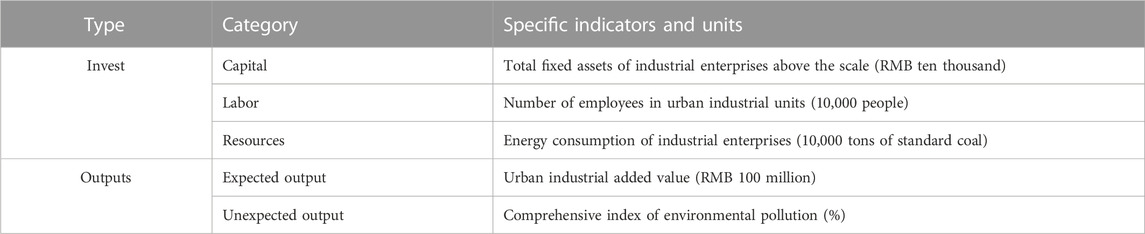
TABLE 1. Evaluation index system of green development efficiency of oil and gas city industry.
3.3 Data sources
Based on the National Plan for Sustainable Development of Resource-based Cities (2013–2020) and the List of 262 Resource-based Cities in China, referring to the oil and gas cities defined in the existing literature, this paper defines a total of 29 oil and gas cities in China (see Table 2), including eight in the east, five in the center, and 16 in the west. Among them, 18 cities are prefecture-level cities. And Xinjiang has the largest distribution of oil and gas cities, with seven oil and gas cities, accounting for about 1/4 of the country.
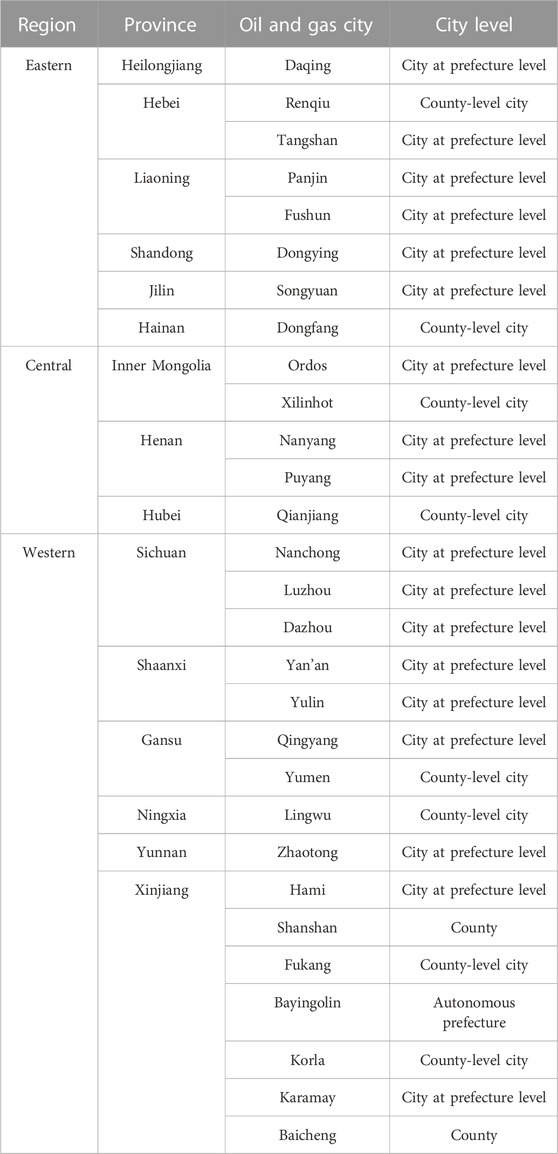
TABLE 2. Distribution areas and types of oil and gas cities in China.
In order to measure the efficiency of industrial green development in oil and gas cities better, the time selected for this study are 15 years from 2004 to 2018. Considering the comparability of data of each city, this paper takes prefecture-level oil and gas cities as the object of empirical evaluation, and there are 18 prefecture-level cities among 29 oil and gas cities, as shown in Table 2. Due to the serious lack of data on research indicators in Hami, Qingyang, Zhaotong and Fushun, considering the availability of data, this paper collects the indicator data of 14 representative oil and gas cities in the eastern, central and western regions for the study. The data are obtained from EPS database, China City Statistical Yearbook, provincial and municipal statistical yearbooks and official websites, and this paper uses OLS trend analysis to fill in the missing data.
4 Measurement results and analysis
4.1 Analysis of the spatial and temporal evolution of the industrial green development efficiency of oil and gas city
4.1.1 Time dimension analysis of industrial green development efficiency of oil and gas city
In this paper, we measure the industrial green development efficiency of 14 prefecture-level oil and gas cities from the year of 2004–2018 based on the Super-SBM model using DEA-Solver Pro 5.0 (Table 3), and the trend of industrial green development efficiency of each oil and gas city is shown in Figure 1.
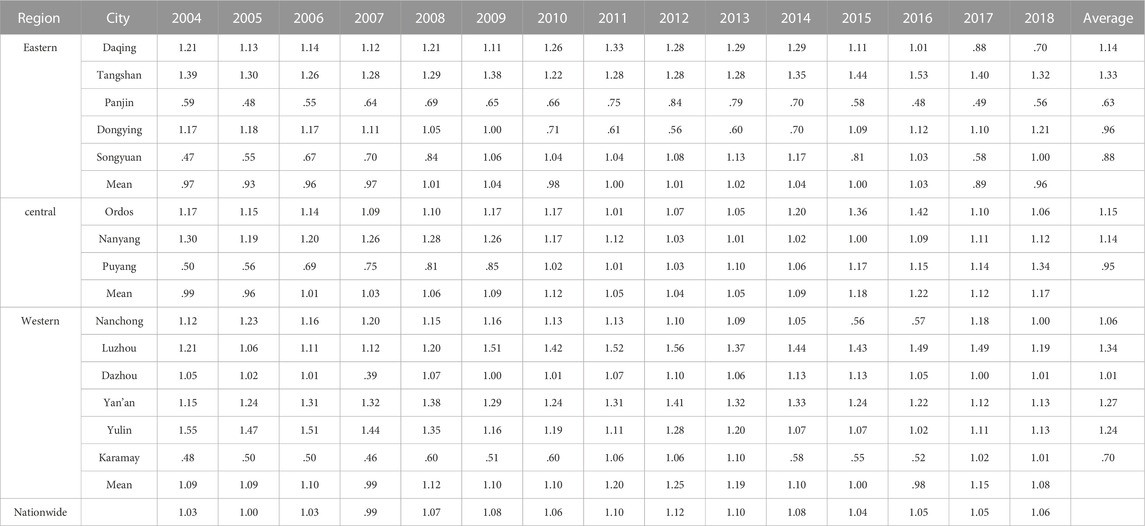
TABLE 3. Measured values of industrial green development efficiency in prefecture-level oil and gas cities 2004–2018.

FIGURE 1. Temporal evolution of industrial green development efficiency in prefecture-level oil and gas cities 2004–2018.
The results show that from the time dimension (Figure 1), the overall industrial green development efficiency of oil and gas cities from 2004 to 2018 is not high, and the efficiency value fluctuates and rises from 2004 to 2012, reaching a high point in 2012, after which the efficiency value decreases to the lowest in 2015, and then slowly rebounds. Among them, the industrial green development efficiency of oil and gas cities in the western region is higher than that in the eastern and central regions before 2014 and 2017, and the efficiency value in the western region is above the average. And the industrial green development efficiency of oil and gas cities in the eastern region show a fluctuating increasing trend before 2014, then fluctuating decreases, with the lowest efficiency value of .89 in 2017, and rebounds to .96 in 2018. In contrast, the central region shows a fluctuating increasing trend until 2016, reaching the maximum efficiency value of 1.22 in 2016, after which the efficiency value falls back to 1.17 in 2018. During 2004–2014, the efficiency value of industrial green development in western oil and gas cities is higher than that in the eastern and central regions, and the efficiency value in the western region is lower than that in the eastern and central regions in 2015–2016, with the rebound in 2017 is still higher than that in other two regions, and between the two regions in 2018. The efficiency value of the eastern region has been lower than the other two regions except for 2016, when it is between the western and central regions. The efficiency value of the central region is between the eastern and western regions until 2015, and is higher than other two regions from 2015 to 2018, except for 2017. The reason for this is that the eastern region has a developed industrial economy, with a higher average urban industrial added value than the central and western regions (Figure 2), and has long been both the main force of industrial production and energy consumption in China (Figure 3), with economic growth, a large number of pollutants are discharged, resulting in more serious environmental pollution than the central and western regions (Figure 4), and its industrial green development efficiency is naturally low (Figure 1). The high efficiency value in the western region is due to the fact that the oil and gas cities that have reached effective development in the western region account for a larger proportion than those in the eastern and central regions, with only Karamay city among the six oil and gas cities having an average efficiency value less than 1. This is mainly because the average energy consumption of oil and gas cities in the western region is lower than that in the central and eastern regions, with the eastern oil and gas cities having the highest average energy consumption (Figure 3), and the integrated environmental pollution index of oil and gas cities in the western region is also significantly lower than that of the other two regions. Index is also significantly lower than the other two regions (Figure 4), so the efficiency of industrial green development in the western region is significantly higher than that in the central and eastern regions. The efficiency value of the central region is basically higher than the other two regions after 2014, because the environmental pollution in the central region was more serious during 2004–2007, and its environmental pollution level improved during 2007–2014, and the environmental pollution management has been effective after 2015.
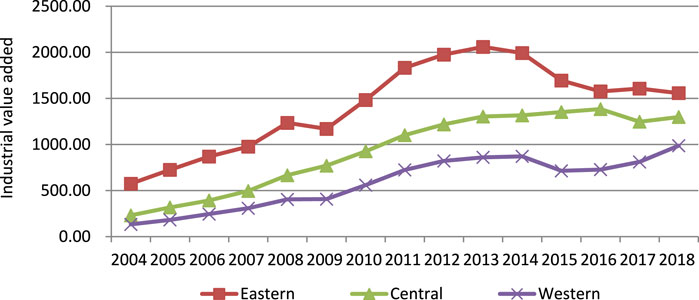
FIGURE 2. Trends in industrial value added in oil and gas cities, 2004–2018 (unit: RMB one hundred million).
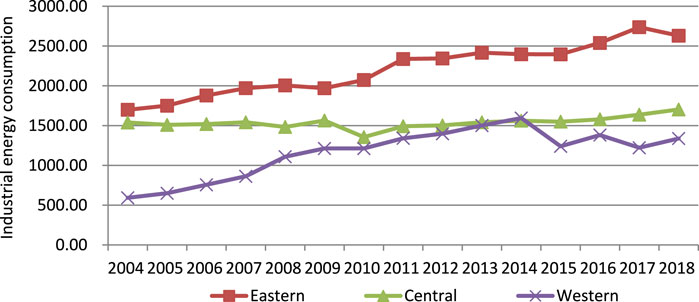
FIGURE 3. Trends in industrial energy consumption in oil and gas cities, 2004–2018 (unit: ten thousand tons of coal equivalent).
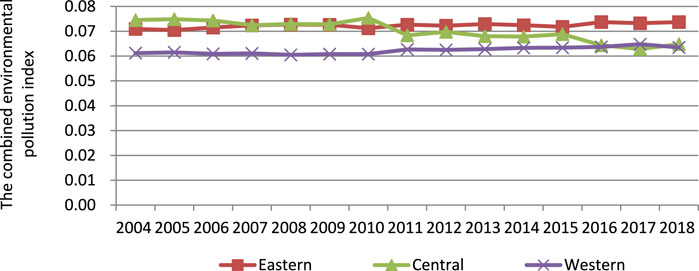
FIGURE 4. Trends in the combined environmental pollution index in oil and gas cities, 2004–2018 (unit: %).
4.1.2 Spatial dimensional analysis of green development efficiency in oil and gas city industry
From the spatial dimension (Figure 5), Luzhou (1.342), Tangshan (1.334), Yan’an (1.267), Yulin (1.244), Ordos (1.151), Nanyang (1.144), Daqing (1.138), Nanchong (1.055), and Dazhou (1.007) are at the forefront of industrial green development in oil and gas cities, with efficiency values greater than 1 belonging to the efficiency effective zone, and Dongying (.959), Puyang (.946), Songyuan (.878), Karamay (.704) and Panjin (.631) are the cities with lower level of industrial green development in oil and gas cities, with efficiency values less than 1 and no effective development. Panjin, the city with the lowest efficiency value, has an efficiency value of .631, compared with Luzhou, the city with the highest efficiency value of industrial green development. It is only half of Luzhou’s efficiency, and there is still much room for improvement. It can be seen that the western region has a high concentration of oil and gas cities with high efficiency in industrial green development, while the eastern and central regions have more oil and gas cities with low efficiency.
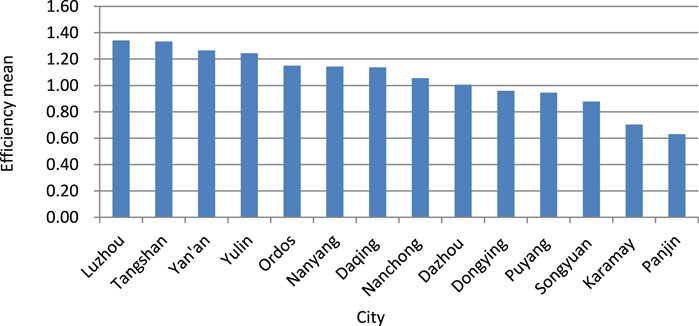
FIGURE 5. Average value of green development efficiency of oil and gas urban industries during 2004–2018.
4.2 Dynamic analysis of green development efficiency of oil and gas urban industry
For the evaluation of industrial green development efficiency, from the micro level, the ratio relationship between inputs and outputs is considered, for which it has been analyzed in the temporal and spatial dimensions. From the macro level, it mainly involves technical efficiency, scale efficiency and total factor productivity, etc. (Zhang, 2018). In this paper, DEAP 2.1 software is used to measure and decompose the input-output index data of 14 prefecture-level oil and gas cities from 2004 to 2018 using Malmquist index to dynamically analyze the relationship between total factor productivity and each efficiency of industrial green development in prefecture-level oil and gas cities.
4.2.1 Analysis of dynamic changes in the efficiency of industrial green development in oil and gas cities at various levels
Based on the results of the Malmquist index run, the annual average Malmquist index of industrial green development efficiency and its decomposition for each oil and gas city at each level from 2004 to 2018 are obtained, as shown in Table 4.
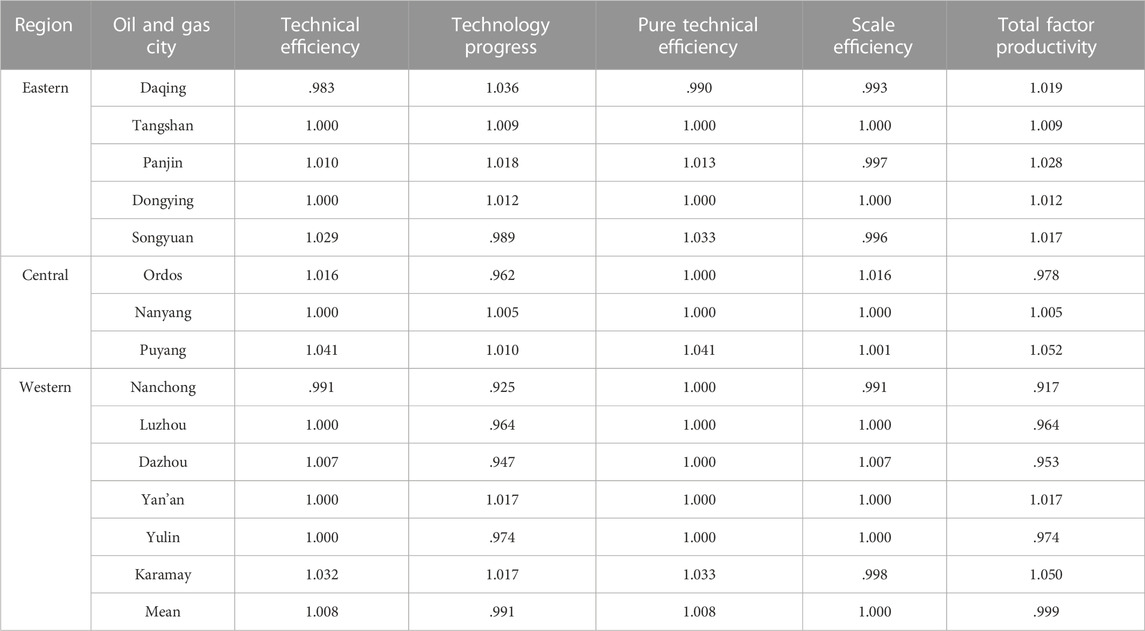
TABLE 4. Malmquist index of annual average industrial green development efficiency and its decomposition in 14 prefecture-level oil and gas cities in 2004–2018.
According to the measurement results in Table 4, it can be seen that the Malmquist efficiency index of 14 prefecture-level oil and gas cities in Northeast China from 2004 to 2018 has an index less than 1 except for Tangshan, Panjin, Dongying, Nanyang, Puyang, and Yan’an, and the geometric mean of total factor productivity of each oil and gas city is .999, which indicates that the level of industrial green development in each oil and gas city is in a declining trend and the overall average annual decline is 1%. Overall, the relationship between industrial green development and resources and environment in oil and gas cities in this period needs to be improved. From the decomposition of total factor productivity of industrial green development, the average value of the technical efficiency index is 1.008, indicating that technical efficiency keeps increasing year by year at an average annual rate of .8%, with the average value of the technical progress index is .991, indicating that the contribution of technical progress to total factor productivity decreases by .9% annually compared with the previous year. This indicates that the decline in total factor productivity of green development in oil and gas urban industries from 2004 to 2018 is dominated by the decline in technical progress.
By analyzing the changes of total factor productivity of industrial green development in each oil and gas city, it is found that Puyang has the fastest increase with an average annual increase of 5.2%, followed by Karamay and Panjin, and the average annual increase is 5% and 2.8% respectively. Total factor productivity of industrial green development in Ordos, Nanchong, Luzhou, Dazhou and Yulin is in decline, and the fastest decline is in Nanchong, with an average annual decline of 8.3%. From the decomposition indicators, the total factor productivity of industrial green development in oil and gas cities is greatly influenced by two factors: technical efficiency and technical progress. According to the data in Table 4, it can be seen that oil and gas cities with increased total factor productivity, such as Panjin, Puyang, and Karamay, have higher technical efficiency or technical progress index, while oil and gas cities with decreased total factor productivity generally also have lower technical efficiency or technical progress index, among which Nanchong has the fastest rate of decrease in total factor productivity, and its technical progress index and technical efficiency index are also the lowest, therefore, for Nanchong, its technical efficiency and technical progress need to be improved. During the study period, the technical efficiency of all oil and gas cities at all levels rose and fell, among which Puyang has the fastest increase in technical efficiency with an average annual increase of 4.1%, Daqing has the fastest decrease in technical efficiency with an average annual decrease of 1.7%, and in a comprehensive view, 14 oil and gas cities rose at an average annual rate of .8%. In terms of pure technical efficiency, only Daqing is in a declining state, with an average annual decline of 1%, and other cities are in a static or rising state. The scale efficiency of each oil and gas city, except for Daqing, Panjin, Songyuan, Nanchong and Karamay, which are in a declining state, and other oil and gas cities are in a stationary or rising state all oil and gas cities are in a stationary state in general. It indicates that the scale system of these oil and gas cities has tended to be perfect.
4.2.2 Analysis of dynamic changes in the efficiency of industrial green development of the overall oil and gas city
Using the Malmquist index to measure and decompose the input-output data of oil and gas cities, we can also obtain the average Malmquist index and its decomposition for each year of oil and gas cities, which are shown in Table 5.
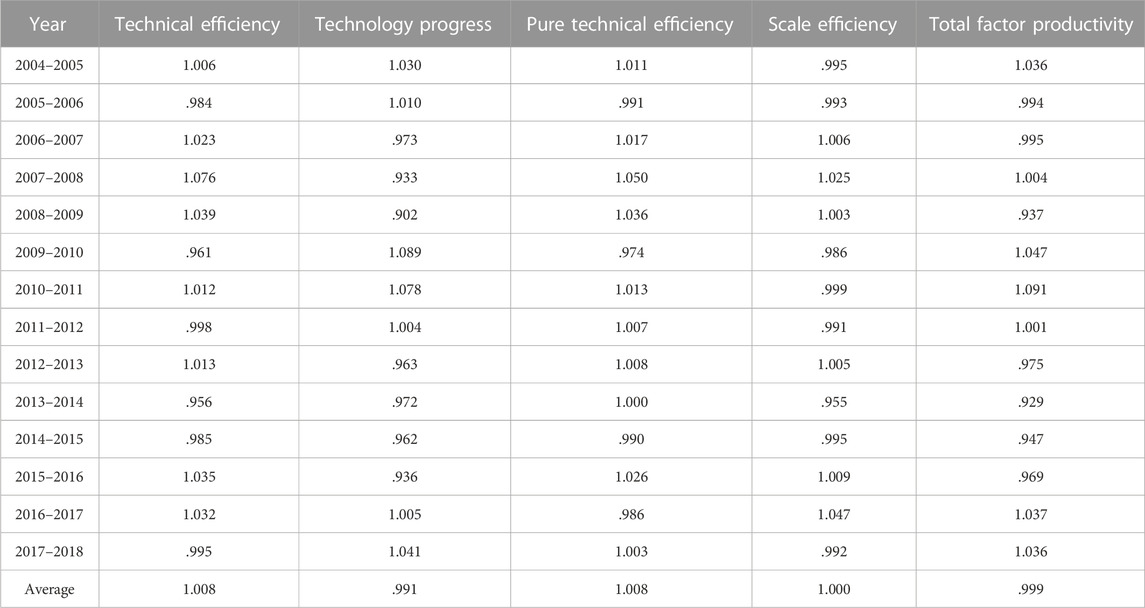
TABLE 5. Average Malmquist index and its decomposition by year in oil and gas cities in 2004–2018.
From the interannual variation of industrial green development total factor productivity in oil and gas cities, there is a general trend of fluctuating variation in industrial green development total factor productivity from 2004 to 2018. Except for 2004–2005, 2007–2008, 2009–2012, and 2016–2018 when the total factor productivity of industrial green development is greater than 1, all other years show negative growth.
The increase of total factor productivity of industrial green development in 2004–2005 should be influenced by the western development strategy, because about half of the oil and gas cities studied are located in the west, and the negative growth of total factor productivity of industrial green development in 2005–2007 is mainly due to the economic downturn in the northeast, and the industrial economic development of oil and gas cities located in the northeast is affected, with the implementation of the northeast revitalization strategy increases the efficiency of industrial green development in 2007–2008. However, in mid-2008, due to the international financial crisis, the total factor productivity of industrial green development in 2008–2009 is negative. Affected by the financial crisis, the Chinese government implements the “four trillion” investment to boost economic development, and the total factor productivity of industrial green development in 2009–2012 has increased. This should be a brief stimulation brought by the “four trillion” investment. After that, under the dual influence of the global financial crisis and domestic economic restructuring, the negative effects of the previous blind expansion of production capacity, the pursuit of rapid economic recovery begin to appear, and the national demand for oil, coal and other resource-based products falls, resulting in a decline in the prices of resource-based products, while the “four trillion” investment leads to overcapacity in the industry. In particular, the industries of iron and steel, electricity, coal and cement caused serious waste of resources, and the oil and gas industry are also affected, resulting in negative total factor productivity growth in the green development of oil and gas city industry from 2012 to 2016. As China’s economic development enters a new normal, in the context of continuous downward economic growth and CPI continues to run low, China proposed in November 2015“supply-side structural reform,” that is, starting from the production side and supply-side to adjust the supply structure, in order to achieve high-quality economic development to find a new way. As a result, oil and gas cities have actively eliminated backward production capacity and taken relevant measures to seek green and low-carbon transformation of the oil and gas industry on the basis of the existing foundation, and the total factor productivity of industrial green development has increased from 2016 to 2018. The industrial green development of oil and gas cities has begun to bear fruit.
Analyzed from the perspective of composition, the technical progress index was the largest during 2009–2010, and the technical efficiency index and technical progress index are greater than 1 in 2004–2005, 2010–2011, and 2016–2017, and they are in an increasing state, which is the main reason for their high Malmquist productivity index. As can be seen from Table 5, the annual average industrial green development total factor productivity of oil and gas cities during the study period is .999, and the technical efficiency index, technical progress index, pure technical efficiency index and scale efficiency index are 1.008, .991, 1.008, and 1, respectively, all of which are greater than or equal to 1 except for the technical progress index. It is concluded that both pure technical efficiency and technical efficiency promote the total factor productivity of industrial green development in cities, of which technical efficiency and pure technical efficiency have the greatest role in promoting it. The technical progress index is less than 1, which hinders the improvement of total factor productivity of industrial green development, indicating that oil and gas cities should focus on the introduction and application of senior talents and advanced technologies, and also further improve the scale of industrial green development.
5 Conclusion and recommendations
5.1 Conclusion
Industrial green development is the only way for oil and gas cities to carry out industrial green transformation, which can promote the harmonious integration of industrial and ecological civilizations. Green industrial development in oil and gas cities can reduce excessive consumption of oil and gas resources and damage to the environment, actively promote Efficiency of industrial energy, reduce pollution emissions, and achieve a “win-win” situation between industrial growth and resource environmental protection in cities. In this paper, we use the Super-SBM model to measure the efficiency of green development in oil and gas cities, and use the Malmquist index to dynamically analyze its total factor productivity, and draw the following conclusions.
(1) From the time dimension, the overall industrial green development efficiency of oil and gas cities is not high during the 15 years, showing a gentle “W” type fluctuation change. Among them, the industrial green development efficiency of oil and gas cities in the western region is higher than that in the eastern and central regions before 2014 and 2017, and the efficiency value in the western region is above the average.
(2) From the spatial dimension, there are significant differences in industrial green development efficiency among oil and gas cities in the east, central and west, with the western region having relatively high efficiency values and being the target for other regions to catch up, while the industrial green development efficiency in the eastern and central oil and gas cities continues to be at a relatively low level and many oil and gas cities are in a state of low efficiency of industrial green development.
(3) Dynamic analysis of the total factor productivity of industrial green development in oil and gas cities, it can be seen by decomposing the indicators that changes in technical efficiency and technical progress have the greatest impact on the total factor productivity of industrial green development. Among them, technical efficiency and pure technical efficiency promote the improvement of total factor productivity of industrial green development in oil and gas cities, and hindered technical progress hinders the improvement of total factor productivity of industrial green development. It indicates that oil and gas cities should focus on the introduction and application of senior talents and advanced technologies, while further improvements in the scale of industrial green development should also be made.
(4) Regional differences in the industrial green development efficiency of oil and gas cities are significant. The better the environmental protection being done, the lower pollutant emission and the lower the comprehensive energy consumption will be achieved, and the higher industrial green development efficiency of oil and gas cities will be achieved.
5.2 Recommendations
Based on the above findings, this paper proposes recommendations for improving the efficiency of green development in oil and gas urban industries.
5.2.1 Broadening green technology innovation channels
For oil and gas cities with low efficiency of industrial green development such as Songyuan and Panjin, the channels of green technology innovation should be broadened in the future development. Firstly, cooperation with outstanding foreign oil and gas companies can be launched to introduce their advanced technologies. Secondly, advanced and efficient green technology transfer mechanisms can be established through contact or cooperation with developed countries or regions to promote the transfer and diffusion of green technologies. Besides, the construction of a collaborative platform among industry, academia and research institutes should be accelerate to break through a number of green technologies with independent intellectual property rights. Finally, we should increase investment in green technology innovation, establish a sound incentive mechanism for employees, vigorously develop low-carbon technologies and promote the application of green technologies, so as to improve energy utilization efficiency and transform and eliminate backward production capacity.
5.2.2 Building a new mechanism for regional synergistic development
The efficiency of industrial green development in the western region has increased significantly in recent years, but compared to the eastern region by the degree of economic development, the western region is lagging clearly behind the eastern region, leading to the flow of high-quality factors cultivated in the region to the developed eastern region due to the siphon effect. To this end, a new mechanism of regional synergistic development should be constructed, the advantages of location should be utilized, open cooperation experimental zones should be built, oil and gas cities in the east, central and west should cooperate in introducing industrial projects such as new materials, modern logistics, culture and entertainment, developing service and tourism industries, breaking down regional barriers, improving the ability of the region itself to absorb talent, technology, products and other factors, and improving the institutional system to realize the flow of regional high-quality elements from the east to the central and west. Eventually, the balanced distribution of industrial green development factors in the east, central and west regions will be realized.
5.2.3 Developing regional graded development strategies
The government should not formulate policies to guide the industrial green development of cities in a generalized manner, but pay more attention to the differences in the development of each city, formulate graded development policies, and implement linkage development of oil and gas cities at the same level. For oil and gas cities such as Yulin, Yan’an, Ordos and Tangshan with high efficiency of industrial green development, the government should encourage enterprises to carry out independent innovation and provide a relatively relaxed technological innovation environment, so as to improve the economic structure, form new economic growth points and seek new impetus for promoting the industrial green development of the cities; for cities such as Daqing and Dongying with medium level of industrial green development efficiency, the government should actively adopt high and new technologies to improve and upgrade traditional enterprises with high pollution and high energy consumption, and optimize the industrial structure, so as to enhance the degree of industrial green development of the cities. While for cities such as Songyuan and Panjin, which have low industrial green development efficiency, they should guide oil and gas cities with high degree of industrial green development to flow advanced production technologies to low-efficiency cities to form a new situation of radiation-driven and mutual support, so as to jointly promote the industrial Green development.
Data availability statement
The original contributions presented in the study are included in the article/supplementary material, further inquiries can be directed to the corresponding author.
Author contributions
SF takes the paper’s idea, data collection, fund support, and paper writing; SC contributes to data handling and the paper writing; LJ contributes to the work of figure drawing and data handling; AY contributes to data verification; SH contributes to the paper writing.
Funding
Chinese Social Sciences Fund: Research on mechanism analysis, efficiency measurement and path exploration of digital enabling low-carbon transformation on traditional energy industry (22BTJ046).
Conflict of interest
Author SC was employed by Daqing Oilfield Design Institute Ltd.
The remaining authors declare that the research was conducted in the absence of any commercial or financial relationships that could be construed as a potential conflict of interest.
Publisher’s note
All claims expressed in this article are solely those of the authors and do not necessarily represent those of their affiliated organizations, or those of the publisher, the editors and the reviewers. Any product that may be evaluated in this article, or claim that may be made by its manufacturer, is not guaranteed or endorsed by the publisher.
References
Ding, X. Y., Xiao, W., and Tian, Z. (2019). Research on the efficiency of industrial green innovation development and its synergistic effect in the Yangtze River Delta city cluster. J. Industrial Technol. Econ. 38 (7), 67–75.
Dong, X., and Wu, C. Q. (2017). A study on the spatial and temporal evolution and influencing factors of total factor productivity in Chinese cities-empirical evidence from 35 major cities from 2000-2014. Study Pract. 5, 5–16.
Feng, D. H., Liu, C. L., Tian, J. X., et al. (2022). Erosion thickness recovery and its significance to hydrocarbon accumulation in northwestern Qaidam Basin. Petroleum Geology & Experiment 44 (1), 188–198. doi:10.11781/sysydz202201188
Hoh, H., Scoer, K., and Seibel, S. (2001). Eco-efficiency indicators in German environmental economic accounting. Stat. J. U. N. Econ. Comm. Eur. Ger. 19 (1/2), 41–52. doi:10.3233/sju-2002-191-205
Li, J. B., and Xian, X. F. (2017). Empirical analysis of energy DEA efficiency in Chongqing under green low-carbon constraints. J. Chongqing Univ. 40 (02), 26–36.
Meng, Q. Q. (2022). Identification method for the origin of natural hydrogen gas in geological bodies. Petroleum Geology & Experiment 44 (3), 552–558. doi:10.11781/sysydz202203552
Ma, Y. S., Li, M. W., Cai, X. Y., et al. (2021). Advances in basic research on the mechanism of deep marine hydrocarbon enrichment and key exploitation technologies. Petroleum Geology & Experiment 43 (5), 737–748. doi:10.11781/sysydz202105737
Pittman, R. W. (1983). Multilateral productivity comparisons with undesirable outputs. Econ. J. 93, 883–891. doi:10.2307/2232753
Quariguasi, J. F. N., Walther, G. J., and Bloemhof, J. (2019). A methodology for assessing eco-efficiency in logistics networks. Eur. J. Operational Res. 193, 670–683.
Ramakrishnan, Ramanathan. (2006). A multifact or efficiency perspective to the relationships among world GDP, energy consumption and carbon dioxide emissions. Technol. Forecasting&Social Change 73, 483–494. doi:10.1016/j.techfore.2005.06.012
Schaltegger, S., and Sturm, A. (1990). Kologische rationalitt:ansatzpunktezur ausgestaltung you okologieorienttierten management instrumenten. Die Unternehm. 4, 273–290.
Sun, F., and Yang, X. L. (2021). Measurement of green development efficiency in resource-based cities in Northeast China-an empirical study based on 2008-2017 data. J. China Univ. Petroleum 37 (3), 18–25. doi:10.13216/j.cnki.upcjess.2021.03.0003
Tone, K. (2001). A slacks-based measure of efficiency in data envelopment analysis. Eur. J. Operational Res. 130, 498–509. doi:10.1016/s0377-2217(99)00407-5
Ugur, S., and Ramazan, S. (2009). Energy consumption economic growth and carbon emissions:Challenges faced by an EU candidate member. Ecol. Econ. 68, 1667–1675. doi:10.1016/j.ecolecon.2007.06.014
Wang, J. M., Qiu, D. S., Jiang, Q. Y., Zhang, M., et al. (2019). Research on the measurement and improvement path of industrial green development efficiency in Yangtze River Economic Belt. Sci. Technol. Manag. Res. 39 (12), 46–52.
Wang, X. P., and Li, Y. M. (2020). Industrial green development measurement and its differential evolution in the perspective of sustainable development. J. Industrial Technol. Econ. 39 (7), 83–91.
Wang, Y. G., Sheng, X. J., Yang, S., et al. (2022). Method of post-drilling assessment for the prospect evaluation of petroleum exploration. Petroleum Geology & Experiment 44 (6), 1088–1091. doi:10.11781/sysydz2022061088
Wang, Z. Q., Ge, H. K., Guo, H. Y., et al. (2022). Experimental study on the mobility of Junggar Basin’s Jimsar shale oil by CO2 huff and puff under different temperatures and pressures. Petroleum Geology & Experiment 44 (6), 1092–1099. doi:10.11781/sysydz2022061092
Wu, C. Q., and Huang, L. (2018). Research on the performance assessment of industrial green development in Yangtze River Economic Belt and its synergistic effect. J. China Univ. Geosciences Soc. Sci. Ed. 18 (03), 46–55.
Zhang, H. C. (2018). A review of research on green transformation of resource-based cities at home and abroad. Resour. Industries 20 (05), 9–15.
Zhang, R. J., and Dong, H. Z. (2020). Spatial and temporal evolution and influencing factors of industrial eco-efficiency in China based on provincial scale. Econ. Geogr. 40 (7), 124–132. doi:10.15957/j.cnki.jjdl.2020.07.014
Zhao, J. J., Zhan, R., and Wang, Y. (2022). Spatial temporal pattern and influencing factors of industrial green development efficiency in the Yellow River Basin. Yellow River 44 (09), 56–63.
Zhao, Y., Liu, D., Li, J., Zhang, X., and Wang, X. (2019). L-NBP, a multiple growth factor activator, attenuates ischemic neuronal impairments possibly through promoting neuritogenesis. Inq. into Econ. Issues 7, 94–105. doi:10.1016/j.neuint.2019.01.002
Keywords: oil and gas cities, industrial green development efficiency, super-SBM model, industrial energy consumption, comprehensive environmental pollution index
Citation: Fei S, Chongliang S, Jie L, Yana A and Haiyan S (2023) Research on the efficiency of green development of industry in Chinese prefecture-level oil and gas cities based on super-efficient SBM-DEA model and Malmquist index. Front. Earth Sci. 10:1121071. doi: 10.3389/feart.2022.1121071
Received: 11 December 2022; Accepted: 30 December 2022;
Published: 11 January 2023.
Edited by:
Qingqiang Meng, SINOPEC Petroleum Exploration and Production Research Institute, ChinaReviewed by:
Jia Qiang, Shandong University of Science and Technology, ChinaHognqi Liu, Southwest Petroleum University, China
Copyright © 2023 Fei, Chongliang, Jie, Yana and Haiyan. This is an open-access article distributed under the terms of the Creative Commons Attribution License (CC BY). The use, distribution or reproduction in other forums is permitted, provided the original author(s) and the copyright owner(s) are credited and that the original publication in this journal is cited, in accordance with accepted academic practice. No use, distribution or reproduction is permitted which does not comply with these terms.
*Correspondence: Sun Chongliang, sunchongliang@petrochina.com.cn