S-wave velocity characteristics and mineralization of the southern tibet detachment system-yalaxiangbo dome
 Guangwen Wang1,2
  Zhanwu Lu1,2*
  Wenhui Li1,2* Haiyan Wang1,2 Shuai Xue1,2
  Yongzhi Cheng1,2 Si Chen1,2 Hao Wang3
  Guowei Wu1,2 Wei Cai1,2
- 1Institute of Geology, Chinese Academy of Geological Sciences, Beijing, China
- 2SinoProbe Laboratory of Ministry of Natural Resources, Beijing, China
- 3Key Laboratory of Marine Mineral Resoures, Ministry of Natural Resources, Guangzhou Marine Geological Survey, China Geological Survey, Guangzhou, China
A series of extensional structures, including the southern Tibet detachment system (STDS), the north-south trending rifts (NSTR), and the northern Himalayan gneiss dome (NHGD), developed from the collision and compression between the Indian and Eurasian plates. These tectonic movements were accompanied by magmatism and polymetallic mineralization. Cuona Rift (CR) is located on the STDS next to the Yalaxiangbo Dome (YD) and passes through the Zhegucuo-longzi fault (ZLF), the Lhozhag fault (LZF), the Rongbu-Gudui fault (RGF), the Cuonadong dome (CD), and the YD. The study area contains numerous metal deposits, such as rare metal ore, lead zinc ore, gold deposits, and two geothermal fields, i.e., the Cuona geothermal field (CGF) and the Gudui geothermal field (GGF). Current research on the geological structures from the STDS to the YD is mainly based on magnetotelluric and natural seismic imaging. These surveys have a low resolution, making it impossible to image the shallow crust in detail. This study obtained about a 112 km S-wave velocity profile from the STDS to the YD using the multichannel surface wave imaging method. The profile results indicated that the average thickness of the sedimentary layer from the STDS to the YD is 400–500 m, while it is more than 800 m at certain fault zones. The CD is connected to the high-velocity body below the Zhaxikang ore concentration area (ZOCA) and may have the same provenance. The thermal conductivity reveals that the CGF, the GGF, and the ZOCA have high values and a more intense thermal radiation capacity. This drives the migration and circulation of the thermal fluids in the CGF and the GGF, causing them to continuously transmit heat to the shallow surface along the fault system. The migration of the thermal fluids extracts useful elements from the geological bodies through which it flows. When these elements mix with the atmospheric infiltration water, it precipitates to form the Zhaxikang hydrothermal superimposed transformation type lead-zinc polymetallic deposit.
Introduction
The Indian and Eurasian plates collided and extruded to form the Gangdise tectonic belt and the Tethyan Himalayan tectonic belt (Figure 1A). This belt is bounded by the Yarlung Zangbo suture zone (Tapponnier et al., 2001; Yin., 2006; Zhang et al., 2012). It has successively experienced the primary collision (65–41 Ma), the late collision (40–26 Ma), and the post-collision (25–0 Ma) (Hou et al., 2006, 2009; Qi et al., 2008). During the post-collisional evolutionary stage, it formed a series of extensional structures, including the southern Tibet detachment system (STDS), the north-south trending rifts (NSTR), and the northern Himalayan gneiss dome (NHGD). This extensional phase was accompanied by a series of magmatic activities and polymetallic mineralization (Armijo et al., 1986, 1989; Zhang and Ding., 2003; Ding et al., 2006; Zhang et al., 2007; Xu et al., 2006; Zhang., 2007b; Zhang and Guo., 2007; Gao et al., 2016; Wang et al., 2017). The NSTR is located in the Tethys Himalayan structural zone to the north of the STDS (Figure 1B), one of the most prominent geomorphic features of the Tibetan Plateau, and the Lhasa block to the south of the Karakulun-Jiali fault zone (KJFZ). It is essential to investigate the intra-continental orogenic processes, deformation mechanisms, and magmatic activities of the Tibetan Plateau (Armijo et al., 1986, 1989; Taylor et al., 2003; Zhang and Ding., 2003; 2007a; 2007b; Yin., 2006; Zeng et al., 2011).
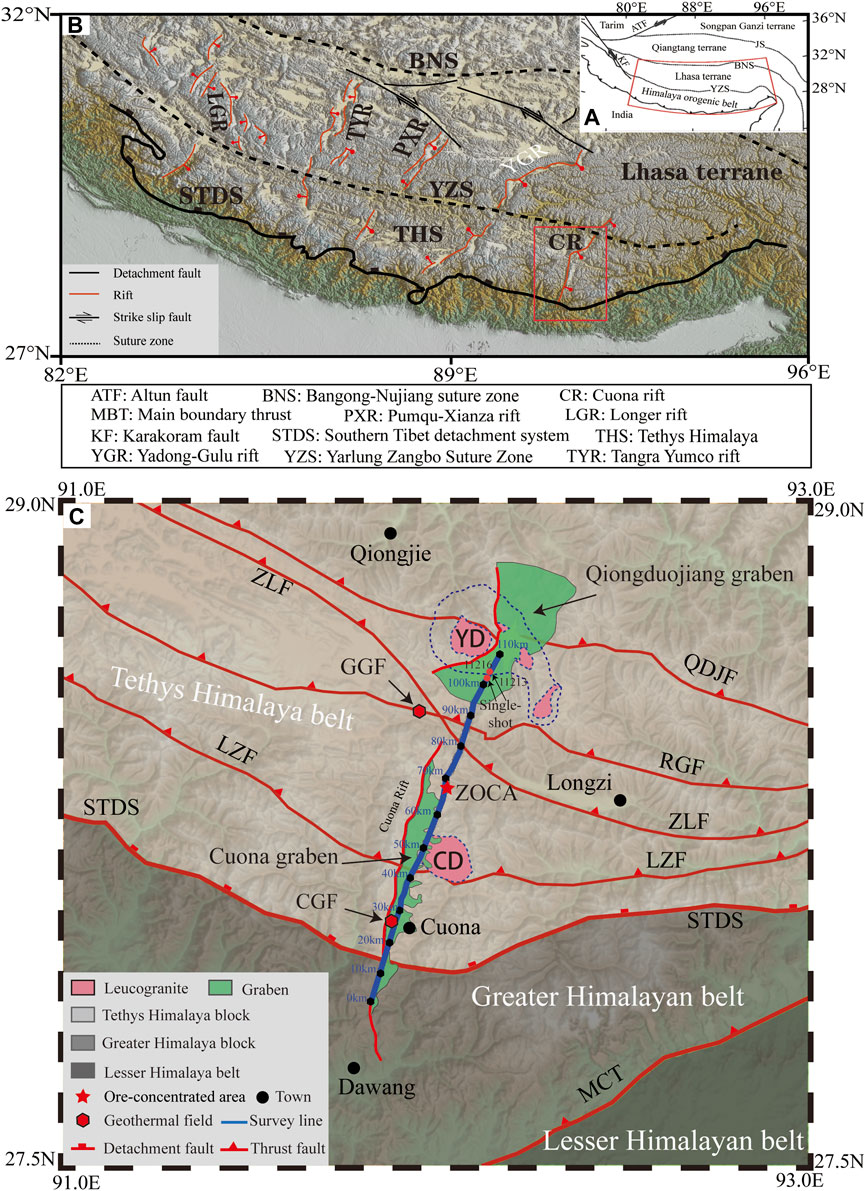
FIGURE 1. (A) Location map of South Tibet. (B) Schematic diagram of the north-south rift valley distribution in the Tibetan Plateau, as modified from Zhang et al. (2020) and Bian et al. (2021). (C) Geological structure and survey line location map of the study area, as modified from Tapbonnier et al. (1982), Dong et al. (2020), and Wu et al. (2007b, 2008b).
The research area is located near the Cuona Rift (CR), between the STDS and the YD. The geologically complex CR forms the easternmost part of the NSTR and passes through many geological structures, including the STDS, the Cuonadong dome (CD), the Zhaxikang ore concentration area (ZOCA) and the YD. the research area is home to many metal mining areas such as Zhaxikang, Suoyue and Mingsai, and also the geothermal fields including the Cuona and Gudui. Some of the main questions in the research area focus on the relationship between the geothermal fields, mineralization, and faults and whether this mineralization is related to magmatism. Current studies have considered the geochemistry, geothermal aspects, and tectonic geology of the area, while related geophysical research has primarily focused on broadband seismic data, electromagnetic data, and deep reflection data (Unsworth et al., 2005; Shi et al., 2015, 2016; Tian et al., 2015; Xu et al., 2015; Liang et al., 2016; Wang et al., 2017; Dong et al., 2020; Wu et al., 2022; Xue et al., 2022). This geophysical research has mainly focused on the deep geological structure and its evolutionary dynamics, but little research focused on the shallow geological structures of the study area. It is crucial to determine the characteristics of the shallow geological structure to understand how the deep hot material affects the shallow geological structures and associated mineralization.
This study utilizes deep reflection data and multichannel surface wave data processing to determine the S-wave velocity structure of the shallow 1 km deep geological layer between the STDS and the YD. This method is widely used in urban seismic exploration but is limited by its shallow detection depth. Explosive source energies are applied to derive deep seismic reflection data, which can reveal a deeper stratum structure. This research uses the S-wave velocity profile to discuss changes in the sedimentary layer, the S-wave high-velocity anomaly area, the geothermal resources, and the metallogenic background between the southern Tibet detachment system and the Yalaxiangbo dome.
Geological setting
There are several geological structural units between the STDS and the YD. The typical structure is the CR, which is oriented north to south. The CR is situated at 92°E and stretches from Sangri County in the north to Cuona County in the south along a total length of about 220 km and an average width of 5–15 km (Wu et al., 2008b; Zeng et al., 2009; Xie et al., 2017). From the south to the north, it crosses the Cuona Graben and the Qiongduojiang Graben (Figure 1C). The Qiongduojiang graben cuts through the eastern part of the YD (Wu et al., 2007a; 2008a; Zeng et al., 2011). A canyon, with a deep basin base of 200–300 m, and a wide valley bottom in the south, occurs north of the Qiongduojiang Graben at an altitude of about 4,400–4,500 m. Snowy mountain ridges border its eastern and western sides. These mountains extend in the northern and southern directions. The Cuona graben is a wide valley graben with gently undulating hills and valleys at an elevation of about 4,600–4,800 m. Its width varies greatly, ranging from about 10 km at its widest point to approximately 1 km at its narrowest. It is located in the Tethys Himalayan block, but passes through the STDS in the south and extends into the high Himalayan block. The Cuona Graben and the Qiongduojiang Graben cut through the east-west oriented structural belt and thrust fault zone, where sediments of varying thicknesses are deposited (Wu et al., 2007a; 2007b; 2008a; Ha et al., 2018).
Several thrust faults, including the Qiongduojiang fault (QDJF), the Rongbu-Gudui fault (RGF), the Zhegucuo-longzi fault (ZLF), and the Lhozhag fault (LZF) are developed in the study area (Figure 1C). Two essential and geologically complex dome structures, the CD and YD, also occur in the study area. The CD is a newly discovered dome structure located close to the CR and the STDS. Granites of different ages are developed in their core, while metamorphic rocks occur in the eastern part of the dome (Luo et al., 2020). Several rare metal mines occur in this area (Li GM et al., 2021; Li HL et al., 2021; Liang et al., 2021; Fan et al., 2021; Zhang et al., 2022; Xia et al., 2022). The YD is situated in the central extension area of the CR (Zhang et al., 2007) and forms the easternmost part of the northern Himalayan dome belt. Similar to the CD, the YD is also composed of gneiss and leucogranite, with the CR cutting through the YD (Zeng et al., 2009). The STDS is located in the southernmost part of the study area, in southern Tibet in the northern Himalayas. The STDS is composed of weakly metamorphic or non-metamorphic sedimentary rocks, with strong deformation in some areas (Burchfiel et al., 1992; Yin et al., 2006).
Data and method
Data
The Institute of Geology of the Chinese Academy of Geological Sciences laid a nearly south-north oriented deep reflection seismic profile between the STDS and the YD from 2018 to 2019. This profile passed through the STDS, CR, CD, ZOCA, and YD and had a total length of about 112 km. A total of 478 single seismic shots with a shot interval of 250 m and a trace interval of 50 m were collected. Every single shot has 720 traces, and the sampling rate is 2 ms. Table 1 shows the specific seismic acquisition parameters. From the original single shot record (Figure 2), it can be seen that the surface wave signal is evident in both the far-offset (green circle) and the near-offset (red circle). Therefore, the surface wave signal can be fully extracted and used to obtain the shallow shear wave velocity structure through inversion. After removing the poor signal-to-noise ratio data, it retained 453 dispersion curves.
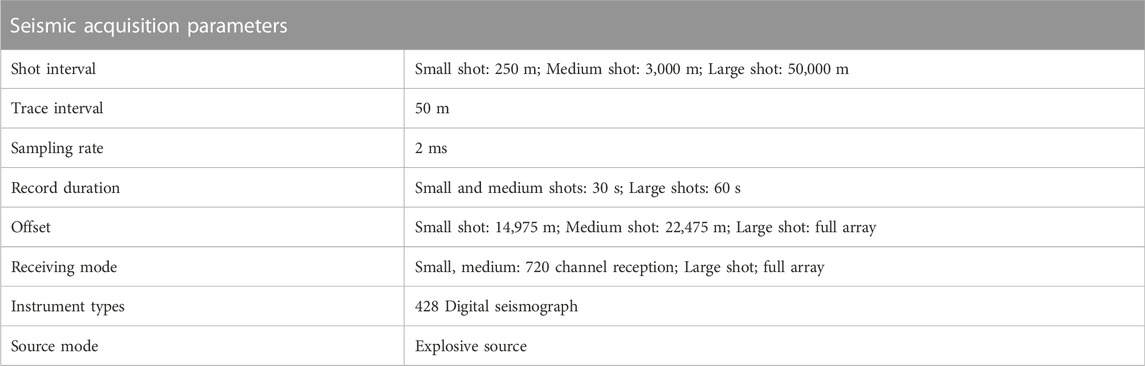
TABLE 1. Deep reflection seismic data acquisition parameters.
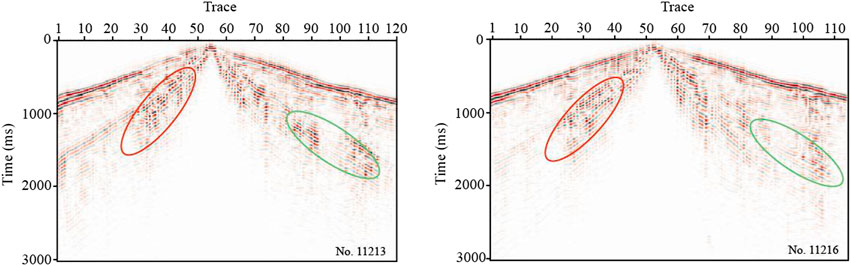
FIGURE 2. Original single-shot data (Location is shown in Figure 1C).
Method
This study uses the multichannel surface wave data processing method, extracts the surface wave signal from the deep reflection data, and obtains the S-wave velocity structure by inversion (Figure 3). Currently, multi-surface wave imaging technology is primarily used for urban geological exploration, with a particular emphasis on shallow layer imaging (Park et al., 1999; Xia et al., 1999, 2015; Yin et al., 2018; Andajani et al., 2019). There are relatively few studies on the application of surface wave extraction from deep reflection data. Compared to the reflection data during petroleum seismic exploration, the deep reflection data collected by explosive sources has a more intense surface wave signal and deeper detection depth. This is beneficial for inversion imaging. Before data processing, it is necessary to intercept the original data. Single-shot data can only obtain the shear wave velocity information of a specific underground position in multichannel wave imaging. Therefore, the direct use of 720 channels of a deep reflection single shot data does not accurately reflect the information of a specific underground location. When there are a limited number of receiving channels, the mapping resolution of dispersion energy will be poorer, complicating the extraction of the dispersion curve. This study selected the most appropriate 60 channels bilateral for single-shot dispersion extraction. The phase shift method was applied to transform the single shot record into a dispersion energy diagram. Finally, based on the dispersion curve, the one-dimensional S-wave velocity structure was obtained by inversion, and the two-dimensional profile was derived by interpolation.
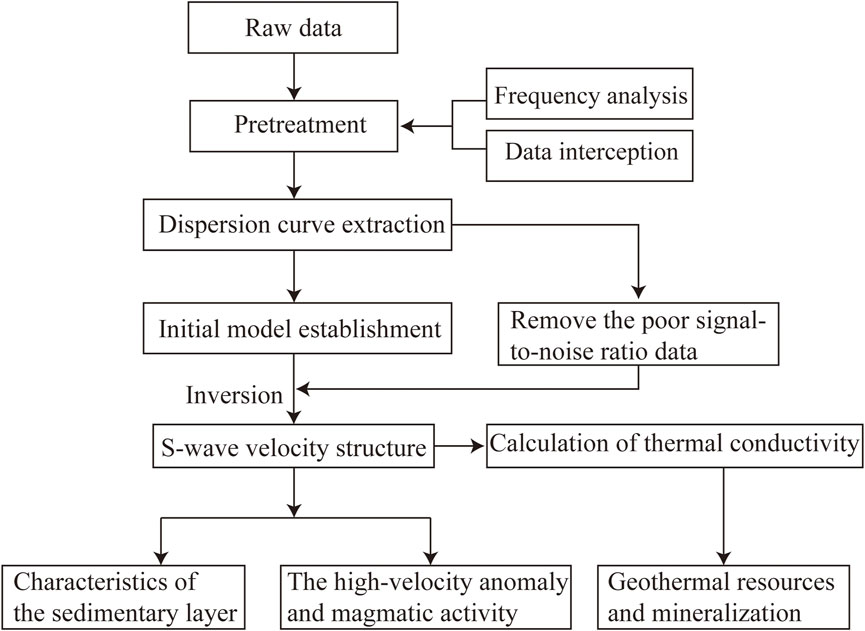
FIGURE 3. Flowchart of surface wave data processing.
Data processing and results
Spectrum analysis
Spectrum analyses were performed on the single-shot records of five geological units: STDS, CR, CD, ZOCA, and YD (Figure 4). Based on the frequency spectrum, single-shot energy is primarily concentrated between 0 and 50 Hz, with a main frequency of 10 Hz. The amplitude values of the single-shot records near the STDS (No. 9275), the CR (No. 9863), and the CD (No. 10194) are small. This is due to the proximity of these points to faults and rifts, which contain many Quaternary sediments. These sediments cause the rapid attenuation of seismic wave energy. The amplitude values of the single-shot near the ZOCA (No.10599) and the YD (No.11260) are large because the rock mass integrity is better. The lithology of the ZOCA and the YD consists of leucogranite and metamorphic rocks with a high density; therefore, the seismic energy waves weaken slowly. The amplitude spectrum of the ZOCA varies significantly with frequency and contains many peaks. This can be due to the complex geological structure and diverse lithological types in the mining area (Guo et al., 2019; Jiao et al., 2019).
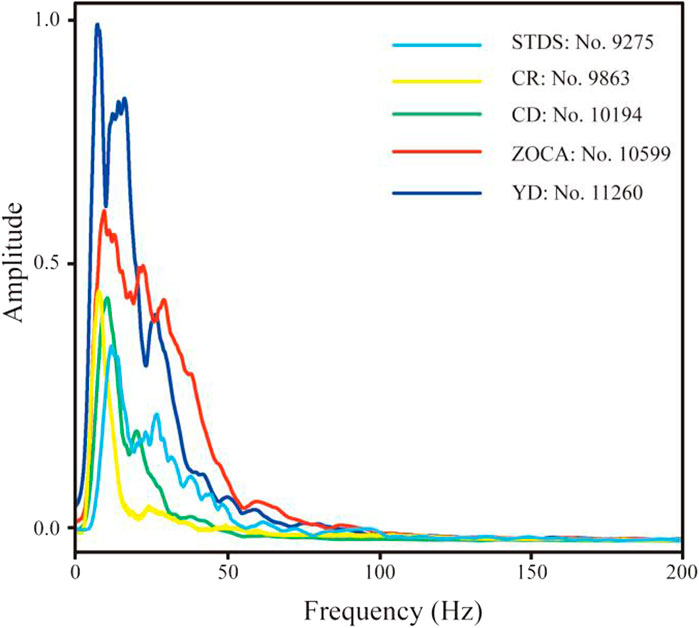
FIGURE 4. Amplitude–frequency graph for the single-shot of the STDS (No.9275), the CR (No.9863), the CD (No.10194), the ZOCA (No.10599), and the YD (No.11260).
Surface wave dispersion extraction
This paper selects the fundamental dispersion curve according to the maximum value in the dispersion energy diagram. The single-shot dispersion curves indicate that the frequency is maintained between 1 and 10 Hz, and the phase velocity is between 500 and 2,500 m/s. The ratio of the energy of the measuring point to the maximum energy at this frequency is 1. It considers the signal-to-noise ratio of the picked dispersion curve is the best. This ensures that the chosen fundamental dispersion value is the maximum. As shown in Figure 5, the single shot dispersion in different research areas demonstrates that the corresponding signal-to-noise ratios of various signal frequencies are close to 1, resulting in more reliable inversion findings.
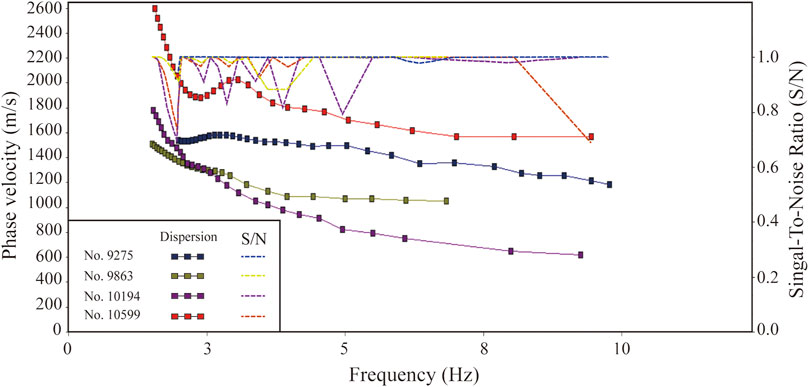
FIGURE 5. Signal-to-noise ratio of dispersion curves at different positions (The ratio of the energy of the measuring point to the maximum energy at this frequency).
The dispersion curves of specific geological units, including the STDS, CR, ZOCA, and CD, were analyzed (Figure 6). The overall phase velocity near STDS and CR is less than 1,500 m/s, which can be attributed to the presence of Quaternary sediments and weathered and broken rocks between the fault and rift. These rocks cause low S-wave velocities. The dispersion near the CD and the ZOCA has a high phase velocity of 2000 m/s and 2,500 m/s, respectively, which can be due to granite and metamorphic rocks in these two areas (Jiao et al., 2019). The dispersion curve of ZOCA shows a significant curved bulge near 3 Hz, demonstrating certain high-low velocity anomalies underground. These anomalies can be attributable to the change of ore veins or the mining goaf (Jiao et al., 2019; Fan et al., 2021; Wu et al., 2021; Zhang et al., 2022). Analysis of the dispersion curves at different positions can reveal the formation-related details.
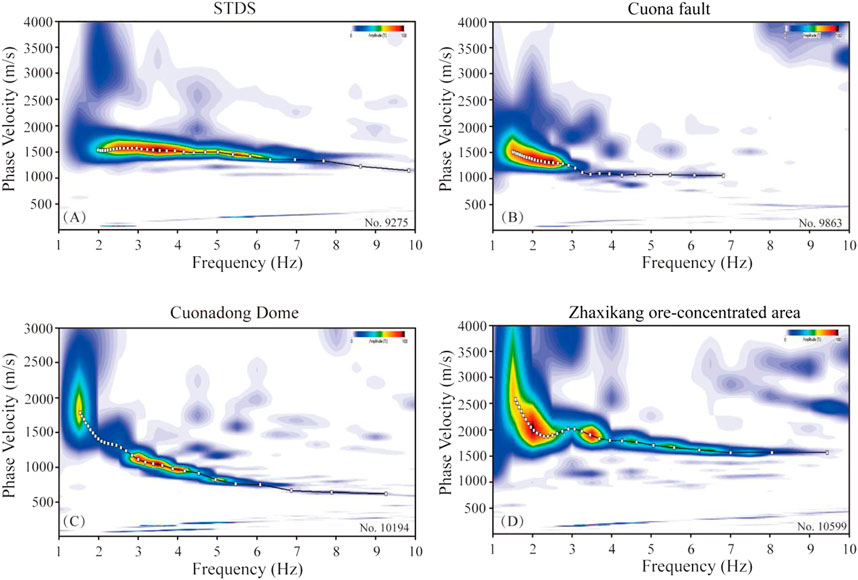
FIGURE 6. Dispersion curves of the STDS (A), CR (B), CD (C), and ZOCA (D).
Initial model establishment and inversion
A reasonable initial model is necessary to provide proper constraints for inversion. The regional velocity changes greatly as the deep reflection profile passes through several geological units. Therefore, it is necessary to establish different initial models for the positions. The phase velocity of the fundamental Rayleigh surface wave is the most sensitive to the S-wave velocity at a depth of 1/3 of its wavelength. The relationship between the phase velocity and S-wave velocity satisfies formula C=0.92 Vs. in a uniform half-space Poisson medium. If the measured Rayleigh wave phase velocity is divided by 0.92 to obtain the S-wave velocity, the depth is 1/3 of its wavelength, which is a suitable initial model (Xia et al., 1999; Luo et al., 2008). Therefore, this paper used the dispersion curve measured by different single-shot records and calculated the S-wave velocity corresponding to different frequencies using the above formula. Then, based on various frequencies, the wavelength corresponding to different frequencies was calculated using the relationship between wave velocity and wavelength, and 1/3 of its wavelength was taken as the inversion depth. S-wave velocities at various depths can be obtained through the calculation presented above. Finally, the above S-wave velocity variation with depth was utilized as the initial model for inversion (Figure 7, red dotted line). The initial model was divided into ten layers, from shallow to deep, based on the principle of “shallow subdivision and deep coarsening”.
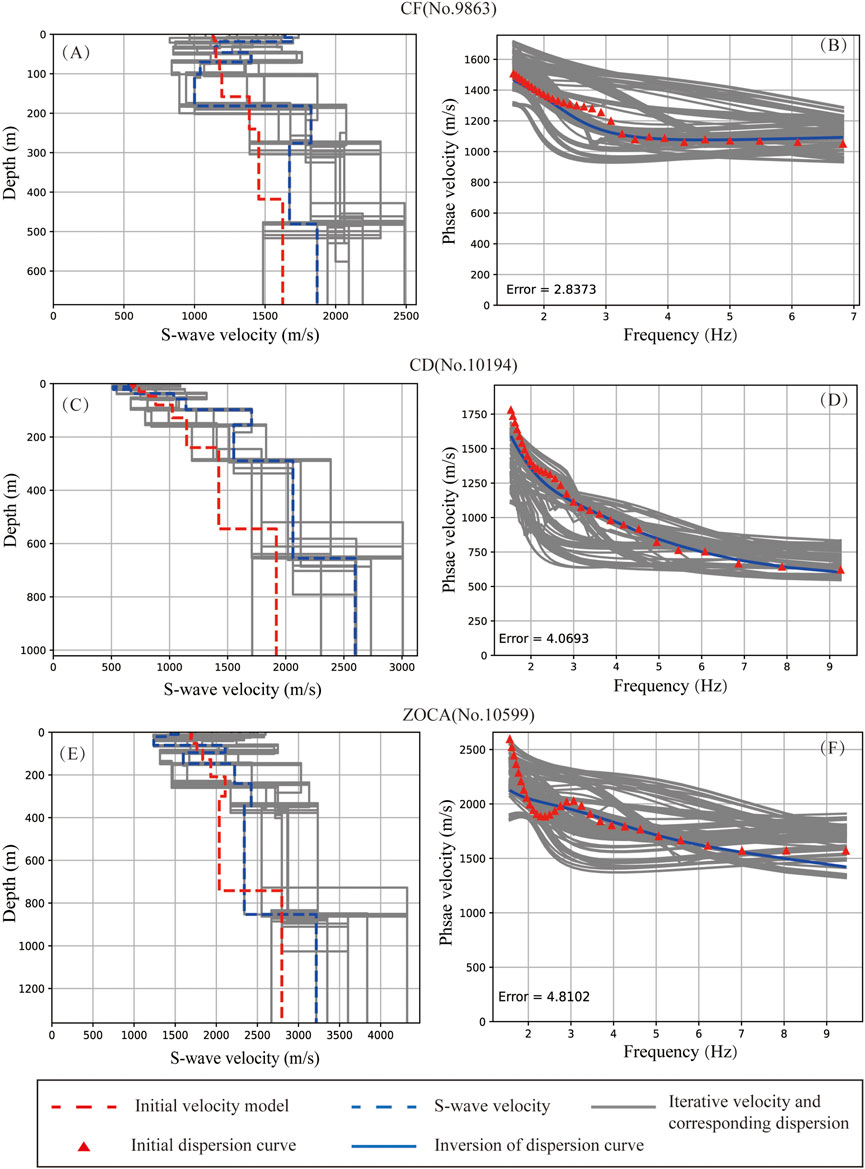
FIGURE 7. S-wave velocity inversion results at the CR, CD, and ZOCA. (A,C,E) are the inversion results of one-dimensional S-wave velocity. (B,D,F) are the dispersion curves of the iterative process.
This study used open-source software to inverse the dispersion curve with the initial model (Herrmann, 2013). In order to ensure the reliability of the results, the inversion result error is greater than 5%, which will be discarded. Moreover, it carried out 30 iterative inversions (Figures 7B, D, F). Based on the inversion results, the S-wave velocity of the CR (No. 9863) changes greatly in the depth range of 0–200 m and slightly in the depth range of 200–600 m (Figure 7A), which is less than 1,500–1700 m/s, indicating the low-velocity characteristics between the rift and the fault. The S-wave velocity increases in a “trapezoidal” trend within 300 m of the CD (No.10194), reflecting the sediment’s characteristics around the CD (Figure 7C). At 300 m, the velocity suddenly increases and stays at about 2000 m/s, indicating the intrusive leucogranite body (Jiao et al., 2019). The velocity near the ZOCA (No.10599) is generally high and alternates greatly between ‘high’ and ‘low’ velocities, which can be related to mineralization (Figure 7E). The extension of the vein and the mined-out area will affect the S-wave velocity, resulting in alternating high and low velocities. Therefore, the velocity changes significantly from shallow to deep in the one-dimensional S-wave profile. The actual change in strata characteristics can be obtained from the inversion results based on the various initial models established at different points.
Discussion
Characteristics of the sedimentary layer
Numerous peaks with a continuous elevation of over 5,500 m between STDS and YD are accompanied by many rivers. The fluvio-lacustrine and glacial sediments provide provenance filling for the CR and its surroundings, forming a certain thickness of sediments. Previous studies indicate that the sedimentary thickness of the Qiongduojiang graben ranges from 400 to 600 m, while the Cuona graben is at least 300 m thick (Wu et al., 2007b; 2008b). The S-wave velocity profile demonstrates that the average thickness of the sediment layer between the STDS and the YD is 400–500 m (Figure 8B, black dotted line). The STDS, LZF, ZLF, and RGF, can reach sedimentary thicknesses of up to 800 km or deeper (Wu et al., 2007b; 2008b). The sediment thickness is the thinnest near the ZOCA. The average sediment thickness of the survey line is about 600 m since it passes through the western edge of the CD close to the CR. The sediment thickness of YD in the north is less than that near CD, at about 400 m thick.
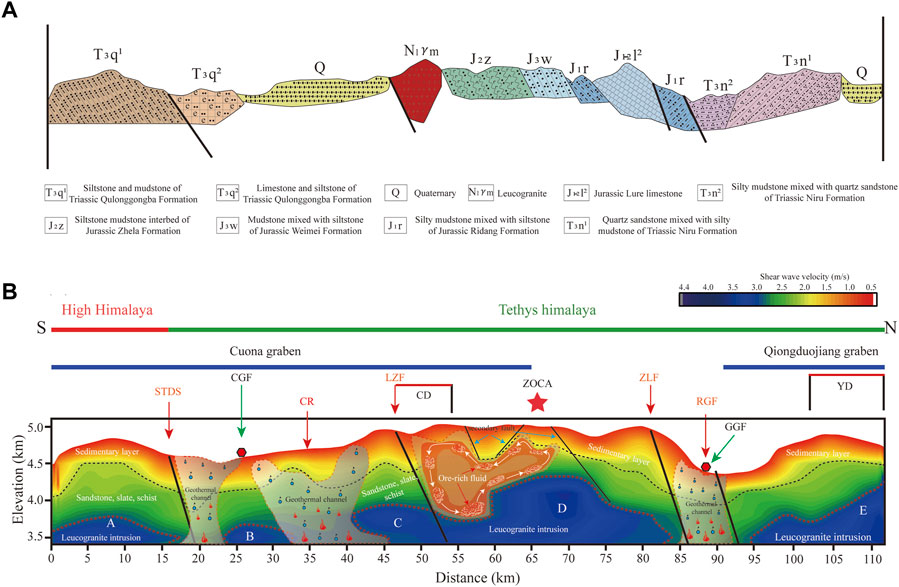
FIGURE 8. (A) Geologic section. (B) S-wave velocity interpretation diagram.
The high-velocity anomaly and magmatic activity
The east-west extensions of the Tibetan Plateau have formed a series of north-south rifts in southern Tibet since the Cenozoic (Armijo et al., 1986; Tapponnier et al., 2001; Hou et al., 2006; Zhang et al., 2007; Xu et al., 2006; Yin, 2006; Zhang., 2007a, 2007b; Zhang et al., 2012; Xue et al., 2021). A high-conductivity and low-velocity layer, which is interpreted as a partial melting layer in the middle and lower crust, is widely distributed under these north-south trending rifts (Unsworth et al., 2004, 2005; Nabelek et al., 2009; Jin et al., 2010; Xie et al., 2017; Liang et al., 2018; Pang et al., 2018; Xue et al., 2021). Over time, some of these melts migrated upwards in the CR through the rock boundaries and weak zones (Hill et al., 2015). These melts condensed and crystallized to form leucogranite when they reached a position close to the surface.
The Himalayan leucogranites mainly occur along two belts. The one leucogranite occurs near the STDS is called the high Himalayan leucogranite. The second leucogranite occurs in the Tethys Himalayan belt and is called the Tethys Himalayan leucogranite (Wu et al., 2015; Zeng and Gao., 2017; Zhang et al., 2018; Gao et al., 2019; Cao et al., 2022). Jiao (2019) used gravity, electrical, and magnetic methods to image the three-dimensional structure of the ZOCA and its adjacent area. Based on this imaging, he postulated an intrusive body of leucogranite under the CD and the ZOCA. It also found discontinuous high-velocity anomalies below the study area based on the S-wave velocity profile (Figure 8B). These anomalies can represent the intrusive body of leucogranite for different geological periods (Guo et al., 2019; Jiao et al., 2019). The high-velocity anomaly is divided into five areas: A, B, C, D, and E. The high-velocity anomalies in areas A and B are close to the STDS and belong to the high Himalayan terrane and the Tethys Himalayan terrane, respectively. These anomalies were caused by the upwelling of deep thermal materials along the STDS (Jin et al., 2010; Hill et al., 2015; Xie et al., 2017), which formed the leucogranite located in the high Himalayan metamorphic rock series and the Tethys Himalayan sedimentary rock series. Area C is about 1 km underground and located along the western boundary of the CD, consistent with the gravity inversion results obtained by Jiao (2019). The high-velocity anomaly in Area C is connected with Area D, indicating that the ZOCA and the CD can have the same source of deep material (Jiao et al., 2019). Due to the existence of several secondary faults around ZOCA. The ZOCA has higher contact between the high-velocity body and the shallow surface than the CD, which can cause reactions between the magma and its surroundings as it rises to the surface. These interactions can develop different metal deposit types (Liang et al., 2014; Guo et al., 2019; Jiao et al., 2019; Zhang et al., 2022). The high-velocity anomaly in Area E is located under the south-dipping YD. The deep main body of the anomaly extends more widely to the south and in the same direction as the Qiongduojiang graben.
Geothermal resources and mineralization
The deep melting magma source area of the lower crust and the local low-velocity melting of the middle crust were formed during the collision and compression of Eurasian plates. Magma pockets and local melting that formed at different depths of the upper crust during the tectonic evolution of the area display a unique crust-mantle thermal structure in the Tibetan Plateau and its surrounding areas (Zhang et al., 2014; Liu et al., 2014; Wang et al., 2017; Wang et al., 2022; 2022b). Several faults developed between the STDS and the YD, with high- and medium-temperature geothermal systems existing in the intersections of these faults. The deeper CR and STDS have a larger fracture zone, which can conduct heat and water and serve as a high-quality water storage structure. In the shallow surface, Jurassic and Triassic metamorphic sandstone and quaternary sandstone (Figure 8A) serve as natural heat storage layers (Wang et al., 2022). These conditions between STDS and YD have good geothermal characteristics and promote mineralization.
The thermal conductivity was determined at different depths below the survey line using the relation of S-wave velocity and the thermal conductivity in experimental petrology (Tian et al., 2020). The average thermal conductivity along the survey line direction was then calculated using the thermal conductivities of different depths. The thermal conductivity reveals that the CGF, the GGF, and the ZOCA have high values and a more intense thermal radiation capacity (Figure 9). The S-wave velocity profile (Figure 8B) reveals a continuous high-velocity body under the CD and ZOCA and a low-velocity channel above the high-velocity body (Figure 8B, red dotted line). While the high geothermal gradient enhances the circulation of fluid, the low-speed channel between ZOCA and CD provides favorable conditions for the migration and reservoir of ore-forming fluid.
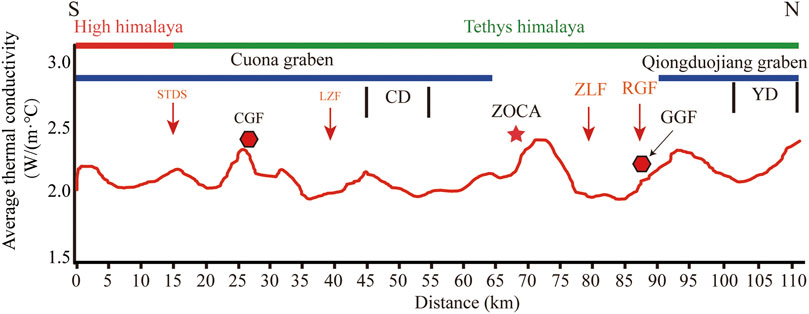
FIGURE 9. Average thermal conductivity along the survey line.
The partially molten body in the deep part of the Tethys Himalaya (Brown et al., 1996; Nelson et al., 1996; Wei et al., 2001; Guo et al., 2019) increases the geothermal gradient of the region when it invades upward. More heat is radiated to the shallow geological layers under high thermal conductivity conditions, which drives geothermal circulation and causes the circulation of the underground ore-forming fluid in the CD, ZOCA, and the surrounding fracture system (Zhou et al., 2017). Useful ore-forming elements (Au, Sb, Pb, and Zn) are gradually extracted from granitic rock, surrounding rock strata, and basic dikes to form ore-rich fluid. The circulating fluid mixes with the infiltrated atmospheric water and then precipitates, causing elements such as lead, antimony, and silver in the fluid to form sulfide mineral deposits, such as the Zhaxikang antimony, lead, zinc, and silver polymetallic deposits (Cox, 2007).
In geothermal fields, the deep molten magma migrates upward to heat the upper and middle crust. Atmospheric precipitation and meltwater that permeate downward along the fault zone move upward along the fissure after being heated by the local underground molten material and hot fluids (Wang et al., 2017; Wang et al., 2020a; Wang et al., 2020b; Wang et al., 2022). The S-wave velocity profile contains three low-velocity channels. These low-velocity channels are located in the STDS, CR, and RGF (Figure 8B) and are connected with deep heat sources. The heat radiation is enhanced by the high thermal conductivity (Figure 9), increasing the temperature of the superficial fluid. The CGF and the GGF formed when the high-temperature fluid was exposed.
Conclusion
This study uses the S-wave velocity profile to discuss the thickness of the sedimentary layer, the characteristics of the high-velocity anomaly, and the geothermal resources and related mineralization:
1) The average sediment thickness in the STDS-YD was 400–500 m, while the sediment of the STDS, ZLF, and RGF reached depths of 800 m or deeper. The average thickness of sediment on the western edge of the CD was 600 m, while on the southern edge of the YD, it was about 400 m.
2) A discontinuous high-velocity anomaly area between STDS and YD represents the Leucogranite intrusion during various geological periods. A high-velocity anomaly connects the CD and ZOCA, indicating that they has the same deep material source. Under the YD, the deep main body of the anomaly extends more widely to the south and in the same direction as the Qiongduojiang graben.
3) High thermal conductivities were discovered near the CGF and GGF, demonstrating a higher thermal radiation capacity. The geothermal gradient increases when the deep magma intrudes upwards, causing the circulation of the ore-rich fluid in the fault system due to the high thermal conductivity. These ore-rich fluids precipitate under the influence of other factors, forming the Zhaxikang hydrothermal lead-zinc polymetallic deposit.
Data availability statement
The original contributions presented in the study are included in the article/supplementary material, further inquiries can be directed to the corresponding authors.
Author contributions
All authors contributed to the study. GW helped collect the data, processed, analyzed, and interpreted the data, and prepared the manuscript. ZL and WL helped collect the data and assisted with interpretation. HW and SX reviewed and completed the manuscript. YC and GW participated in the preparation of the first draft. SC, WC, and HW helped collect the data. All authors read and approved the final manuscript.
Funding
This research was supported by the National Natural Science Foundation of China (91962109, 42174124, 42074115, 42174094) and the China Geological Survey Project (DD20221647).
Acknowledgments
We thank all those who helped collect the data and provided project support, and specifically the Sinopec Geophysical Company. We thank associate researcher Li Hongqiang of the Chinese Academy of Geological Sciences (CAGS) for providing the processing software. Finally, we would like to thank all reviewers for their valuable comments on the article.
Conflict of interest
The authors declare that the research was conducted in the absence of any commercial or financial relationships that could be construed as a potential conflict of interest.
Publisher’s note
All claims expressed in this article are solely those of the authors and do not necessarily represent those of their affiliated organizations, or those of the publisher, the editors and the reviewers. Any product that may be evaluated in this article, or claim that may be made by its manufacturer, is not guaranteed or endorsed by the publisher.
References
Andajani, R. D., Ikeda, T., and Tsuji, T. (2019). Surface wave analysis for heterogeneous geological formations in geothermal fields: Effect of wave propagation direction. Explor. Geophys. 50 (3), 255–268. doi:10.1080/08123985.2019.1597497
Armijo, R., Tapponnier, P., and Han, T. (1989). Late Cenozoic right-lateral strike-slip faulting in southern Tibet. J. Geophys. Res. 94 (B3), 2787–2838. doi:10.1029/JB094iB03p02787
Armijo, R., Tapponnier, P., Mercier, J. L., and Han, T. L. (1986). Quaternary extension in southern Tibet: Field observations and tectonic implications. J. Geophys. Res. 91 (B14), 13803–13872. doi:10.1029/JB091iB14p13803
Bian, S., Yu, Z. Q., Gong, J. F., Yang, R., Cheng, X. G., Lin, X. B., et al. (2021). Spatiotemporal distribution and geodynamic mechanism of the nearly NS-trending rifts in the Tibetan Plateau. J. Geomechanics 27 (2), 178–194. doi:10.12090/j.issn.1006-6616.2021.27.02.018
Brown, L. D., Zhao, W., Nelson, K. D., Hauck, M., Alsdorf, D., Ross, A., et al. (1996). Bright spots, structure, and magmatism in Southern Tibet from INDEPTH seismic reflection profiling. Science 274 (5293), 1688–1690. doi:10.1126/science.274.5293.1688
Burchfiel, B. C., Zhiliang, C., Hodges, K. V., Liu, Y. P., Leigh, H. R., Deng, C. R., et al. (1992). The South Tibetan detachment system, Himalayan orogen: Extension contemporaneous with and parallel to shortening in a collisional mountain belt. Geol. Soc. Am. Special Pap. 269, 1–41. doi:10.1130/SPE269-p1
Cao, H. W., Li, G. M., Zhang, L. K., Zhang, X. F., Yu, X., Chen, Y., et al. (2022). Genesis of Himalayan leucogranite and its potentiality of rare-metal mineralization. Sediment. Geol. Tethyan Geol. 42 (2), 189–211. doi:10.19826/j.cnki.1009-3850.2022.04004
Cox, S. F. (2007). Structural and isotopic constraints on fluid flow regimes and fluid pathways during upper crustal deformation: An example from the taemas area of the lachlan orogen, SE Australia. J. Geophys. Res. 112 (B8), B08208. doi:10.1029/2006JB004734
Ding, L., Yue, Y. H., Cai, F. L., Xu, X. X., Zhang, H. Q., and Lai, Q. Z. (2006). (40)Ar/(39)Ar Geochronology, Geochemical and Sr-Nd-O isotopic characteristics of the High-Mg ultrapotassic rocks in Lhasa block of Tibet: Implications in the onset time and depth of NS-striking rift system. Acta Geol. Sin. 80 (9), 1252–1261.
Dong, X. Y., Li, W. H., Lu, Z. W., Huang, X. F., and Gao, R. (2020). Seismic reflection imaging of crustal deformation within the eastern Yarlung-Zangbo suture zone. Tectonophysics 780, 228395. doi:10.1016/j.tecto.2020.228395
Fan, W. X., Li, G. M., and Liang, S. X. (2021). Electrical characteristics of ore-controlling structures and prospecting prediction of Zhaxikang mining area, tibet. J. Jilin Univ. (Earth Sci. Ed. 51 (6), 1709–1719. doi:10.13278/j.cnki.jjuese.20180295
Gao, L. E., Zeng, L. S., Hu, G. Y., Gao, J. H., Zhao, L. H., and Wang, Y. Y. (2019). Rare metal enrichment in leucogranite within nariyongcuo gneiss dome, South Tibet. Earth Sci. 44 (6), 1860–1875. doi:10.3799/dqkx.2018.390
Gao, R., Lu, Z. W., Klemperer, S. L., Wnag, H. Y., Dong, S. W., Li, W. H., et al. (2016). Crustal-scale duplexing beneath the Yarlung Zangbo suture in the Western Himalaya. Nat. Geosci. 9 (7), 555–560. doi:10.1038/ngeo2730
Guo, J., Li, W. C., Li, G. M., Jiao, Y. J., and Liang, S. X. (2019). Application of multi-scale integrated geophysical method in prospecting prediction of Zhaxikang Pb-Zn-Sb-Au polymetallic deposit. Earth Sci. 44 (6), 2129–2142. doi:10.3799/dqkx.2018.362
Ha, G. H., Wu, Z. H., and He, L. (2018). Late cenozoic sedimentary strata of Qiongduojiang graben, South Tibet:preliminary constraint on the initial rifting age of the SN- trending rift. Acta Geol. Sin. 92 (10), 2051–2067. doi:10.3969/j.issn.0001-5717.2018.10.007
Herrmann, R. B. (2013). Computer programs in seismology; an evolving tool for instruction and research. Seismol. Res. Lett. 84 (6), 1081–1088. doi:10.1785/0220110096
Hill, G. J., Bibby, H. M., Ogawa, Y., Wallin, E. L., Bennie, S. L., GrantCaldwell, T., et al. (2015). Structure of the tongariro volcanic system: Insights from magnetotelluric imaging. Earth Planet. Sci. Lett. 432, 115–125. doi:10.1016/j.epsl.2015.10.003
Hou, Z. Q., and Cook, N. J. (2009). Metallogenesis of the Tibetan collisional orogen: A review and introduction to the special issue. Ore Geol. Rev. 36 (1-3), 2–24. doi:10.1016/j.oregeorev.2009.05.001
Hou, Z. Q., Qu, X. M., Yang, Z. S., Meng, X. J., Li, Z. Q., Yang, Z. M., et al. (2006). Metallogenesis in Tibetan collisional orogenic belt:III Mineralization inpost_collisional extension setting. Min. Deposits (06), 629–651. doi:10.3969/j.issn.0258-7106.2006.06.001
Jiao, Y. J., Huang, X. R., Li, G. M., Liang, S. X., and Guo, J. (2019). Deep structure and mineralization of Zhaxikang ore-concentration area, South Tibet: Evidence from Geophysics. Earth Sci. 44 (6), 2117–2128. doi:10.3799/dqkx.2018.352
Jin, S., Wei, W. B., Wang, S., Ye, G. F., Deng, M., and Tan, H. D. (2010). Discussion of the formation and dynamic signification of the high conductive layer in Tibetan crust. Chin. J. Geophys. 53 (10), 2376–2385. doi:10.3969/j.issn.0001-5733.2010.10.011
Li, G. M., Zhang, L. K., Zhang, Z., Xia, X. B., Liang, W., and Hou, C. Q. (2021). New exploration progresses, resource potentials and prospecting targets of strategic minerals in the southern Qinghai-Tibet Plateau. Sediment. Geol. Tethyan Geol. 41 (2), 351–360. doi:10.19826/j.cnki.1009-3850.2021.03012
Li, H. L., Li, G. M., Zhang, Z., Zhang, L. K., Dong, S. L., Qing, C. S., et al. (2021). Genesis of jienagepu gold deposit in Zhaxikang ore concentration area, eastern Tethys himalayas: Constraints from He-Ar and in-situ S isotope of pyrite. Eart. Scie. 46 (12), 4291–4315. doi:10.3799/dqkx.2021.018
Liang, H. D., Jin, S., Wei, W. B., Gao, R., Ye, G. F., Zhang, L. T., et al. (2018). Lithospheric electrical structure of the middle Lhasa terrane in the south Tibetan plateau. Tectonophysics 731, 95–103. doi:10.1016/j.tecto.2018.01.020
Liang, W., Li, G. M., Ba, S. Y. D., Zhang, L. K., Fu, J. G., Huang, Y., et al. (2021). Metallogenesis of Himalaya gneiss dome: An example from Cuonadong gneiss dome in Zhaxikang ore concentration area. Min. Deposits 40 (05), 932–948. doi:10.16111/j.0258-7106.2021.05.003
Liang, W., Zheng, Y. C., Yang, Z. S., Li, Z. Q., Liu, Y. C., Liu, Y. F., et al. (2014). Multiphase and polystage metallogenic process of the Zhaxikang large-size Pb-Zn-Ag-Sb polymetallic deposit in southern Tibet and its implications. Acta Pet. Mineral. 33 (1), 64–78. doi:10.3969/j.issn.1000-6524.2014.01.005
Liang, X. F., Chen, Y., Tian, X. B., Chen, Y. S. J., Ni, J., Gallegos, A., et al. (2016). 3D imaging of subducting and fragmenting Indian continental lithosphere beneath southern and central Tibet using body-wave finite-frequency tomography. Earth Planet. Sci. Lett. 443, 162–175. doi:10.1016/j.epsl.2016.03.029
Liu, Z., Lin, W. J., Zhang, M., Xie, E. J., Liu, Z. M., and Wang, G. L. (2014). Geothermal fluid Genesis and mantle fluids contributions in Nimu Naqu, Tibet. Earth Sci. Front. 21 (6), 356–371. doi:10.13745/j.esf.2014.06.034
Luo, S. J. C., Qing, C. S., Li, G. M., Zhang, L. K., Dong, S. L., Fu, J. G., et al. (2020). Geochemical anomaly characteristics of Cuonadong dome, southern tibet. Geophys Geochem Explor 44 (1), 13–24. doi:10.11720/wtyht.2020.1001
Luo, Y. H., Xia, J. H., Liu, J. P., and Liu, Q. S. (2008). Joint inversion of fundamental and higher mode Rayleigh waves. Chin. J. Geophys. 51 (1), 242–249. doi:10.3321/j.issn:0001-5733.2008.01.030
Nabelek, J., Hetenyi, G., Vergne, J., Sapkota, S., Kafle, B., Jiang, M., et al. (2009). Underplating in the himalaya-tibet collision zone revealed by the hi-CLIMB experiment. Science 325 (5946), 1371–1374. doi:10.1126/science.1167719
Nelson, K. D., Zhao, W., Brown, L. D., Kuo, J., Che, J. K., Liu, X. W., et al. (1996). Partially molten middle crust beneath southern tibet: Synthesis of project INDEPTH results. Science 274 (5293), 1684–1688. doi:10.1126/science.274.5293.1684
Pang, Y, Zhang, H., Gerya, T. V., Liao, J., Cheng, H. H., and Shi, Y. L. (2018). The mechanism and dynamics of N-S rifting in southern Tibet: Insight from 3-D thermomechanical modeling. J. Geophys. Res. Solid Earth 123 (1), 859–877. doi:10.1002/2017JB014011
Park, C. B., Miller, R. D., and Xia, J. H. (1999). Multichannel analysis of surface waves. Geophysics 64 (3), 800–808. doi:10.1190/1.1444590
Qi, X. X., Zeng, L. S., Meng, X. J., Xu, Z. Q., and Li, T. F. (2008). Zircon SHRIMP U-Pb dating for Dala granite in the Tethyan Himalaya and its geological implication. Acta Pet. Sin. 24 (7), 1501–1508.
Shi, D. N., Wu, Z. H., Klemperer, S. L., Zhao, W. J., Xue, G. Q., and Su, H. P. (2015). Receiver function imaging of crustal suture, steep subduction, and mantle wedge in the eastern India–Tibet continental collision zone. Earth Planet. Sci. Lett. 414, 6–15. doi:10.1016/j.epsl.2014.12.055
Shi, D. N., Zhao, W. J., Klemperer, S. L., Wu, Z. H., Mechie, J., Shi, J. Y., et al. (2016). West–east transition from underplating to steep subduction in the India–Tibet collision zone revealed by receiver-function profiles. Earth Planet. Sci. Lett. 452, 171–177. doi:10.1016/j.epsl.2016.07.051
Tapponnier, P., Peltzer, G., Dain, A. Y., Armijo, R., and Cobbold, P. (1982). Propagating extrusion tectonics in Asia: New insights from simple experiments with plasticine. Geol. 10 (12), 611. doi:10.1130/0091-7613(1982)10<611:petian>2.0.co;2
Tapponnier, P., Xu, Z. Q., Roger, F., Meyer, B., Arnaud, N., Wittlinger, G., et al. (2001). Oblique stepwise rise and growth of the Tibet Plateau. Science 294 (5547), 1671–1677. doi:10.1126/science.105978
Taylor, M., Yin, A., Ryerson, F. J., Kapp, P., and Ding, L. (2003). Conjugate strike-slip faulting along the Bangong-Nujiang suture zone accommodates coeval east-west extension and north-south shortening in the interior of the Tibetan Plateau. Tectonics 22 (4), 1044. doi:10.1029/2002tc001361
Tian, B. Q., Pang, Z. H., Kong, Y. L., and Gong, Y. L. (2020). Exploration and amount fine evaluation of geothermal resources based on microtremor surver method. Sci. Technol. Dev. 16 (Z1), 367–374. doi:10.11842/chips.20200426001
Tian, X. B., Chen, Y., Tseng, T. L., Klemperer, S. L., Thybo, H., Liu, Z., et al. (2015). Weakly coupled lithospheric extension in southern Tibet. Earth Planet. Sci. Lett. 430, 171–177. doi:10.1016/j.epsl.2015.08.025
Unsworth, M., Wenbo, W., Jones, A. G., Li, S. H., Bedrosian, P., Booker, J., et al. (2004). Crustal and upper mantle structure of northern Tibet imaged with magnetotelluric data. J. Geophys. Res. 109 (B2), B02403. doi:10.1029/2002JB002305
Unsworth, M. J., Jones, A. G., Wei, W., Marquis, G., Gokarn, S. G., and Spratt, J. E.The INDEPTH-MT team (2005). Crustal rheology of the Himalaya and Southern Tibet inferred from magnetotelluric data. Nature 438, 78–81. doi:10.1038/nature04154
Wang, G., Wei, W. B., Ye, G. F., Jin, S., Jing, J. E., Zhang, L. T., et al. (2017). 3-D electrical structure across the Yadong-Gulu rift revealed by magnetotelluric data: New insights on the extension of the upper crust and the geometry of the underthrusting Indian lithospheric slab in southern Tibet. Earth Planet. Sci. Lett. 474, 172–179. doi:10.1016/j.epsl.2017.06.027
Wang, G. L., and Lin, W. J. (2020a). Main hydro-geothermal systems and their genetic models in China. Acta Geol. Sin. 94 (07), 1923–1937. doi:10.19762/j.cnki.dizhixuebao.2020224
Wang, G. L., Liu, Y. G., Zhu, X., and Zhang, W. (2020b). The status and development trend of geothermal resources in China. Earth Sci. Front. 27 (01), 1–9. doi:10.13745/j.esf.2020.1.1
Wang, R. C., Wu, F. Y., Xie, L., Liu, X. C., Wang, J. M., Yang, L., et al. (2017). A preliminary study of rare-metal mineralization in the Himalayan leucogranite belts, South Tibet. Sci. Sin. 47 (08), 871–880. doi:10.1007/s11430-017-9075-8
Wang, X. W., Wang, T. H., Gao, N. A., Liu, H. Y., Mao, X., Luo, L., et al. (2022). Formation mechanism and development potential of geothermal resources along the sichuan-tibet railway. Eart. Scie. 47 (3), 995–1011. doi:10.3799/dqkx.2022.059
Wei, W. B., Unsworth, M., Jones, A., Booker, J., Tan, H. D., Nelson, D., et al. (2001). Detection of widespread fluids in the Tibetan crust by magnetotelluric studies. Science 292 (5517), 716–719. doi:10.1126/science.1010580
Wu, F. Y., Liu, Z. C., Liu, X. C., and Ji, W. Q. (2015). Himalayan leucogranite: Petrogenesis and implications to orogenesis and plateau uplift. Acta Pet. Sin. 31 (1), 1–36.
Wu, F. Y., Wang, R. C., Liu, X. C., Xie, L., and Lei, X. (2021). New breakthroughs in the studies of Himalayan rare-metal mineralization. Acta Pet. Sin. 37 (11), 3261–3276. doi:10.18654/1000-0569/2021.11.01
Wu, J. J., Xu, X., Guo, X. Y., Lu, Z. W., Wu, Y., Xiang, B., et al. (2022). Crustal structure of the Cona rift, eastern Himalaya. Earth Sci. Front. 29 (4), 221–230. doi:10.13745/j.esf.sf.2022.4.66
Wu, Z. H., Zhang, Y. S., Hu, D. G., and Zhao, X. T. (2007b). Late cenozoic normal faulting of the qungdo’gyang graben in the central segment of the cona-oiga rift, southeastern tibet. J. Geomechanics (04), 297–306.
Wu, Z. H., Zhang, Y. S., Hu, D. G., Zhao, X. T., and Ye, P. S. (2007a). Quaternary normal faulting and its dynamics of the oiga graben in south-eastern tibet. Acta Geol. Sin. 81 (10), 1328–1337.
Wu, Z. H., Zhang, Y. S., Hu, D. G., Zhao, X. T., and Ye, P. S. (2008a). The quaternary normal faulting of the Cona-Oiga rift. Seismol. Geol. 30, 144–160. doi:10.3969/j.issn.0253-4967.2008.01.010
Wu, Z. H., Zhao, Y. S., Hu, D. G., and Ye, P. S. (2008b). Quaternary normal faulting and its dynamic mechanism of the Cona-Nariyong Co graben in south-eastern Tibet. Quat. Sci. 25, 490–502.
Xia, J. H., Gao, L. L., Pan, Y. D., Shen, C., and Yin, X. F. (2015). New findings in highfrequency surface wave method. Chin. J. Geophys. 58 (8), 2591–2605. doi:10.6038/cjg20150801
Xia, J. H., Miller, R. D., and Park, C. B. (1999). Estimation of near-surface shear-wave velocity by inversion of Rayleigh waves. Geophysics 64, 691–700. doi:10.1190/1.1444578
Xia, X. B., Li, G. M., Zhang, L. K., Zhang, Z., Cao, H. W., and Liang, W. (2022). Geological characteristics of and prospecting strategy for the Xianglin Be-Sn polymetallic ore deposit in the Cuonadong gneiss dome in southern Tibet. Earth Sci. Front. 29 (1), 93–106. doi:10.13745/j.esf.sf.2021.8.30
Xie, C. L., Jin, S., Wei, W. B., Ye, G. F., Zhang, L. T., Dong, H., et al. (2017). Varying Indian crustal front in the southern Tibetan Plateau as revealed by magnetotelluric data. Earth, Planets Space 69 (1), 1–17. doi:10.1186/s40623-017-0734-z
Xu, Q., Zhao, J. M., Yuan, X. H., Liu, H. B., and Pei, S. P. (2015). Mapping crustal structure beneath southern Tibet: Seismic evidence for continental crustal underthrusting. Gondwana Res. 27 (4), 1487–1493. doi:10.1016/j.gr.2014.01.006
Xu, Z. Q., Yang, J. S., Qi, X. X., Cui, J. W., Li, H. B., and Chen, F. Y. (2006). India-asia collision: A further discussion of N-S- and E-W-trending detachments and the orogenic mechanism of the modern himalayas. Geol. Bull. China 25 (1/2), 1–14.
Xue, S., Chen, Y., Liang, H. D., Li, X., Liang, X. F., Ma, X. B., et al. (2021). Deep electrical resistivity structure across the Gyaring Co Fault in Central Tibet revealed by magnetotelluric data and its implication. Tectonophysics 809, 228835. doi:10.1016/j.tecto.2021.228835
Xue, S., Lu, Z. W., Li, W. H., Wang, G. W., Wang, H. Y., and Liang, H. D. (2022). Electrical resistivity structure beneath the central Cona-Oiga rift, southern Tibet, and its implications for regional dynamics. Earth Sci. Front. 29 (2), 393–401. doi:10.13745/j.esf.sf.2022.2.3
Yin, A. (2006). Cenozoic tectonic evolution of the Himalayan orogen as constrained by along-strike variation of structural geometry, exhumation history, and foreland sedimentation. Earth-Science Rev. 76 (1-2), 1–131. doi:10.1016/j.earscirev.2005.05.004
Yin, X. F., Xu, H. R., Xia, J. H., Sun, S. D., and Wang, P. (2018). A travel-time tomography method for improving horizontal resolution of high-frequency surface-wave exploration. Chin. J. Geophys. 61 (6), 2380–2395. doi:10.6038/cjg2018L0373
Zeng, L. S., and Gao, L. E. (2017). Cenozoic crustal anatexis and the leucogranites in the Himalayan collisional orogenic belt. Acta Pet. Sin. 33 (5), 1420–1444.
Zeng, L. S., Gao, L. E., Xie, K. J., and Zeng, J. L. (2011). Mid-Eocene high Sr/Y granites in the Northern Himalayan Gneiss Domes: Melting thickened lower continental crust. Earth Planet. Sci. Lett. 303 (3-4), 251–266. doi:10.1016/j.epsl.2011.01.005
Zeng, L. S., Liu, J., Gao, L. E., Xie, K. J., and Wen, L. (2009). Early oligocene crustal anatexis and its geological significance in the yelashangbo dome, southern tibet. Chin. Sci. Bull. 54 (03), 373–381. doi:10.1007/s11434-008-0362-x
Zhang, J., and Guo, L. (2007). Structure and geochronology of the southern Xainza-Dinggye rift and its relationship to the south Tibetan detachment system. J. Asian Earth Sci. 29 (5-6), 722–736. doi:10.1016/j.jseaes.2006.05.003
Zhang, J. J. (2007a). A review on the extensional structures in the northern Himalaya and southern Tibet. Geol. Bull. China 26 (6), 639–649. doi:10.3969/j.issn.1671-2552.2007.06.003
Zhang, J. J., and Ding, L. (2003). East-west extension in Tibetan plateau and its significance to tectonic evolution. Chin. J. Geol. Sci. Geol. Sinica) 38 (2), 179–189. doi:10.3321/j.issn:0563-5020.2003.02.005
Zhang, J. J., Guo, L., and Zhang, B. (2007b). Structure and kinematics of the Yalashangbo dome in the northern Himalayan dome belt, China. Chin. J. Geol. 42 (1), 16–30. doi:10.3321/j.issn:0563-5020.2007.01.003
Zhang, J. J., Santosh, M., Wang, X. X., Guo, L., Yang, X. Y., and Zhang, B. (2012). Tectonics of the northern Himalaya since the India–asia collision. Gondwana Res. 21 (4), 939–960. doi:10.1016/j.gr.2011.11.004
Zhang, J. W., Li, H. A., Zhang, H. P., Xu, X. Y., Zhang, K., Lin, G. G., et al. (2020). Proliferating cell nuclear antigen (PCNA) overexpression in hepatocellular carcinoma predicts poor prognosis as determined by bioinformatic analysis. Chin. Med. J. 35 (08), 848–850. doi:10.1097/CM9.0000000000001192
Zhang, M., Lin, W. J., Liu, Z., Liu, Z. M., Hu, X. C., and Wang, G. L. (2014). Hydrogeochemical characteristics and genetic model of Gulu high-temperature geothermal system in Tibet, China. J. Chengdu Univ. Technol. Technol. Ed. 41 (03), 382–392. doi:10.3969/j.issn.1671-9727.2014.03.15
Zhang, Z., Li, G. M., and Zhang, L. K. (2022). Exploration and research progresses of rare metals in Himalayan belt, Tibet. Sediment. Geol. Tethyan Geol. 42 (2), 176–188. doi:10.19826/j.cnki.1009-3850.2022.04010
Zhang, Z. M., Kang, D. Y., Ding, H. X., Tian, Z. L., Dong, X., Qin, S. K., et al. (2018). Partial melting of himalayan orogen and formation mechanism of leucogranites. Earth Sci. 43, 82–98. doi:10.3799/dqkx.2018.005
Keywords: south tibetan detachment system, yalaxiangbo dome, S-wave velocity, zhaxikang mine concentration area, geothermal
Citation: Wang G, Lu Z, Li W, Wang H, Xue S, Cheng Y, Chen S, Wang H, Wu G and Cai W (2023) S-wave velocity characteristics and mineralization of the southern tibet detachment system-yalaxiangbo dome. Front. Earth Sci. 10:1086080. doi: 10.3389/feart.2022.1086080
Received: 01 November 2022; Accepted: 05 December 2022;
Published: 27 January 2023.
Edited by:
Xiao Xu, Sun Yat-sen University, ChinaCopyright © 2023 Wang, Lu, Li, Wang, Xue, Cheng, Chen, Wang, Wu and Cai. This is an open-access article distributed under the terms of the Creative Commons Attribution License (CC BY). The use, distribution or reproduction in other forums is permitted, provided the original author(s) and the copyright owner(s) are credited and that the original publication in this journal is cited, in accordance with accepted academic practice. No use, distribution or reproduction is permitted which does not comply with these terms.
*Correspondence: Zhanwu Lu, luzhanwu78@163.com; Wenhui Li, dereklee1984@126.com