Thermodynamic and kinematic structure of tropical cyclones in the western North Pacific based on ACARS/AMDAR
 Kosuke Ito1,2*
  Ren Yamamoto1
- 1Department of Physics and Earth Sciences, University of the Ryukyus, Nishihara, Japan
- 2Typhoon Science and Technology Research Center, Yokohama National University, Yokohama, Japan
Meteorological variables are often reported by commercial aircraft flying around tropical cyclones (TCs). They are archived in Aircraft Communications, Addressing, and Reporting System/Aircraft Meteorological Data Relay (ACARS/AMDAR). Therefore, they are potentially useful for constructing a composite mean structure of TCs based on in-situ measurements. The number of temperature and wind observations are 4.0
1 Introduction
The structure of the temperature and wind profiles of tropical cyclones (TCs) is important for understanding them and disaster prevention. Although in-situ observations are preferable to describe the true structure, aircraft observation missions of TCs by the Joint Typhoon Warning Center in the western North Pacific, where strong TCs appear most frequently in the world, were terminated in 1987. Since then, several aircraft observation campaigns have been conducted for research and operation (Chan et al., 2018; D’Asaro et al., 2014; Elsberry 1990; Elsberry and Harr 2008; Hirano et al., 2022; Ito et al., 2018; Newell et al., 1996; Wu et al., 2005; Yamada et al., 2021). However, in-situ measurements from these campaigns are still insufficient to construct a composite mean structure of TCs in the western North Pacific. In particular, the upper-tropospheric portion of the inner core is rarely observed, except during the Tropical Cyclones-Pacific Asian Research Campaign for the Improvement of Intensity Estimations/Forecasts (T-PARCII) projects (Ito et al., 2018; Yamada et al., 2021; Hirano et al., 2022), in which dropsondes were released from 43,000 ft.
The upper-level warm core is connected with the minimum sea level pressure (MSLP) through hydrostatic balance. Therefore, the MSLP has been estimated based on upper-level temperature observations using satellite microwave sounding (Knaff et al., 2000; Oyama et al., 2016). Komaromi and Doyle (2017) inferred that the maximum wind speed (Vmax) is related to the magnitude of warm cores based on the Global Hawk AV-6 flying above 100 hPa in the Atlantic Ocean. However, in the western North Pacific, it is difficult to validate the relationship between TC intensity and warm core magnitude based on in-situ observations, because of the insufficient number of samples.
Commercial aircraft data are potentially useful for addressing the thermodynamic and kinematic fields based on in-situ measurements. Commercial aircraft sometimes fly over TCs. In addition, meteorological variables are reported and compiled as Aircraft Communications, Addressing, and Reporting System/Aircraft Meteorological Data Relay [ACARS/AMDAR; NOAA/ESRL (2011)]. It has been used to construct climatological meteorological fields (Frehlich and Sharman 2010) and in data assimilation studies (Cardinali et al., 2003). However, to the best of our knowledge, a detailed analysis of the temperature and wind fields of TCs in the western North Pacific has not been carried out with ACARS/AMDAR. In fact, as envisioned, several in-situ observations are available around TCs, particularly the upper air sounding. They are useful to describe the composite mean structure of TCs in the western North Pacific.
The remainder of this paper is organized as follows. Section 2 explains the data used and the methodology. Section 3 describes the climatological mean of the warm core and the wind field. Section 4 contains the concluding remarks.
2 Method
We used the ACARS/AMDAR data from 2010 to 2020. The sampling rate varied from 10 s to 30 min. The accuracy of each horizontal wind component and temperature are
The TC center position, intensity, and size refer to the 6-hourly best track data from the Regional Specialized Meteorological Center (RSMC) Tokyo–Typhoon Center of the Japan Meteorological Agency (JMA). The RSMC Tokyo best track data were not considered before the TC reached the threshold of tropical storm status or an extratropical cyclone subjected to transition from the TC. The best track data were linearly interpolated in time to match the observation time of ACARS/AMDAR. To plot a figure in radius-pressure coordinates, we grouped the data into bins with radial and pressure intervals of 50 km and 50 hPa, respectively. When the number of observations is less than 10 in each grid, the composite mean was not shown.
Figure 1A displays the number of temperature observations that were used within 1,200 km from the TC center (hereafter represented as r < 1,200 km) in the western North Pacific. The total number was approximately 4.0
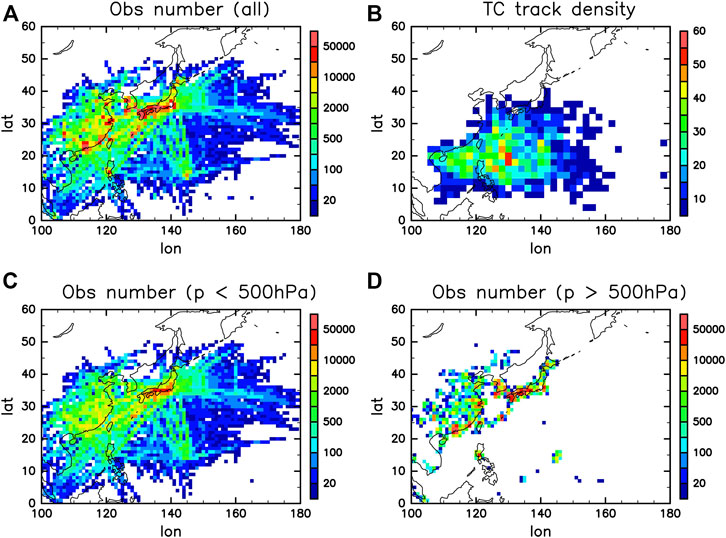
FIGURE. 1. (A) The number of the ACARS/AMDAR temperature observations within r < 1,200 km during 2010–2020 used in this study. (B) TC track density obtained from 6-hourly best track data during 2010–2020. The number of ACARS/AMDAR observations is divided into those (C) above 500 hPa and (D) below 500 hPa.
Figure 2 displays the observation density at each pressure level and radius from the TC center. The observation density peaked at 200–300 hPa, 500–700 hPa, and near the surface. These presumably correspond to the cruising altitudes of aircraft and departure/landings. The number of observations within r < 100 km was approximately 1.0
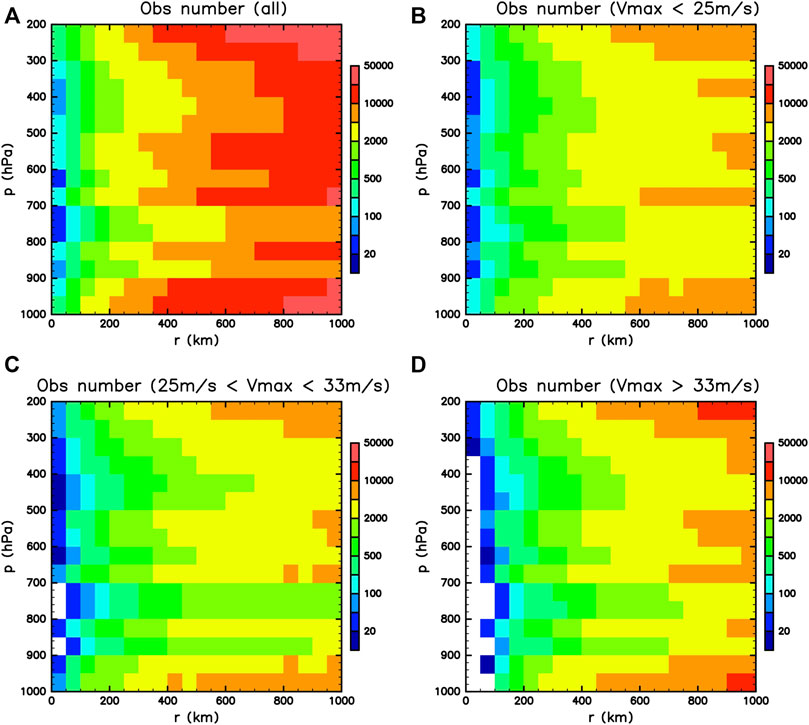
FIGURE. 2. (A) The number of the ACARS/AMDAR temperature observations during 2010–2020 used in this study in a radius-pressure coordinate. The observations are classified according to the maximum wind speed: (B) Vmax < 25 ms−1, (C) 25 ms−1 < Vmax < 33 ms−1, and (D) Vmax > 33 ms−1.
The warm core is defined as the temperature or potential temperature deviation with respect to the reference temperature. Typically, the reference temperature using the average within r < 1,000 km or a few hundred kilometers is implemented. However, the magnitude of the warm core depends on the choice of reference temperature (Durden 2013; Stern and Zhang 2016; Yamada et al., 2021). In this study, we employed the temperature and potential temperature anomaly with respect to the climatology for a given longitude, latitude, pressure, and pentad day of the year as a reference state. This clarifies the composite mean difference from that of the ordinary state. This approach is not compatible for the case study of a single TC, but it clarifies the impact of TCs and the favorable conditions for TC development. The climatology was constructed based on the 11-years (2010–2020) averaged ACARS/AMDAR data. The temperature and potential temperature anomalies obtained using these climatological values were represented as follows:
where
For comparison, we further calculated the temperature and potential temperature anomalies with a reference state averaged over the region between the rings of 800–1,200 km (hereafter, a 1,000 km ring for simplicity).
where
3 Result
3.1 Potential temperature field
Figure 3 shows the composite mean of the temperature, potential temperature and their anomalies throughout the observations. The contours of the temperature and potential temperature in the inner core region indicate the warm core of TCs in the upper-troposphere (200–400 hPa) (Figures 3A,B). The maximum composite mean temperature and potential temperature anomaly with respect to the climatology (1,000 km ring) is 6.0 K and 8.4 K (4.6 K and 7.1 K) within r < 50 km in the upper troposphere, respectively (Figures 3C–F). Strictly speaking, it is not the composite mean of the warm core magnitude of TCs, because the pressure level of the maximum temperature anomaly may differ depending on each TC. Nevertheless, the current result suggests that the composite mean warming is maximized around 300 hPa, and it can be used as a reference value for the warm core magnitude. The lower warm cores described by Stern and Nolan (2012) were not clearly observed in the current composite analysis. However, the temperature and potential temperature anomalies in the inner core region were weakly positive in the lower troposphere. The negative potential temperature anomaly around the surface represents cold air. Considering that low-level observations were mostly obtained over land, the results should be carefully interpreted. Presumably this is due to cold pool or evaporation over the land.
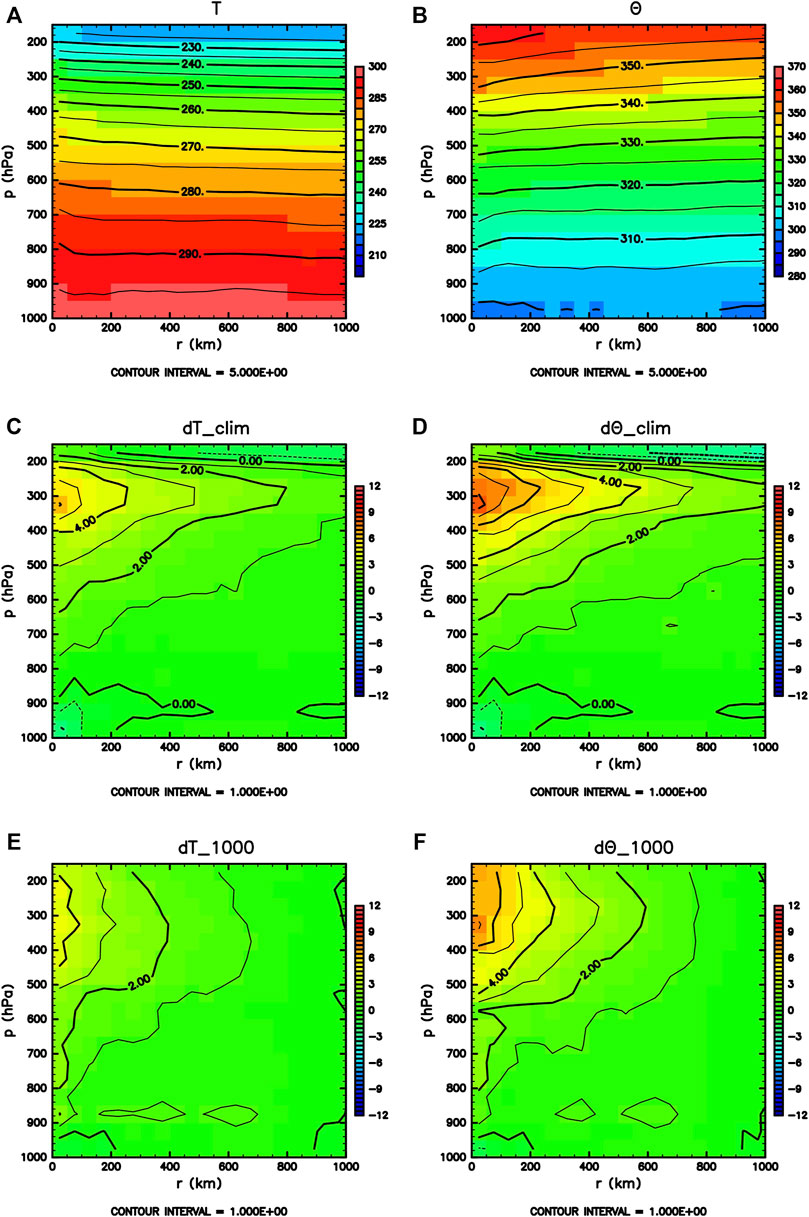
FIGURE. 3. Composite of (A)
The potential temperature anomaly more than 2.0 K with respect to climatology extends to more than 1,000 km in the upper troposphere (Figure 3D). This differs from the lower tropospheric warm anomaly, which is limited to a narrow region. The broad temperature and potential temperature anomaly in the upper troposphere is beyond 1,000 km, which is typically used as the definition of “environmental region”. Thus, if one defines a reference temperature with respect to the 1,000 km ring or less, one underestimates the warming influence of a TC in the upper troposphere. Temperature and potential temperature anomalies are negative above 200 hPa in the outer region. One possible explanation might be that the cold tropopause (relative to climatology) is favorable for TC development through the mechanism of wind-induced surface heat exchange (Emanuel 1986; Emanuel 2012).
To check the influence of reference states, Figures 3E,F shows the temperature and potential temperature anomalies with respect to values at the 1,000 km radius. The structures of the temperature and potential temperature anomalies are basically similar to those with respect to climatology. However, the warm anomaly is weaker in the upper troposphere and is confined within several hundred kilometers. As for the anomaly with respect to the 1,000 km ring, notable, most observations were obtained in the mid-latitudes where the meridional temperature gradient was large. Currently, the climatological-mean temperature at the center is colder than that at the 1,000 km ring by approximately 2 K in the lower troposphere and 0.5 K in the upper troposphere (figures not shown). This affects the difference in anomalies with different references.
The magnitude of the maximum warm potential temperature anomaly with respect to the climatology in the TC centers depends on the TC intensity (Figure 4). The anomaly is 6.4 K, 9.1 K, and 14.4 K for weak, moderate, and strong TCs, respectively. The region of warm air extends away from the TC center above 500 hPa with increasing intensity. The pressure level of the core magnitude of the warm anomaly does not depend on TC intensity. However, the warm anomaly region at the TC center became deeper for the stronger TCs.
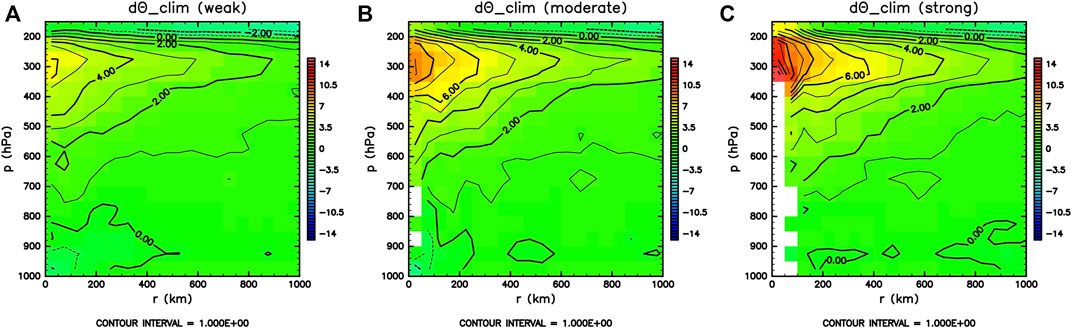
FIGURE. 4.
By grouping the potential temperature anomalies from the moderate TCs (25 ms−1 < Vmax < 33 ms−1) by size defined as a radius of 15 ms−1 wind (R15) in the best track, the depth and radius of the upper warm anomaly varied. Figure 5 shows that small TCs yield radially small and shallow upper-tropospheric warming. By contrast, large TCs yield a radially large and deep upper-tropospheric warming. We also found that the maximum of composite mean of potential temperature anomaly is stronger for large TCs (7.3 K, 7.8 K, and 10.8 K for small, medium, and large TCs, respectively). Therefore, the magnitude of the warm core was stronger for larger TCs. We consider the radial integration of the pressure gradient term in gradient wind balance to explain this.
where pc is the sea-level pressure at the radius of interest (including MSLP), v is the tangential wind,
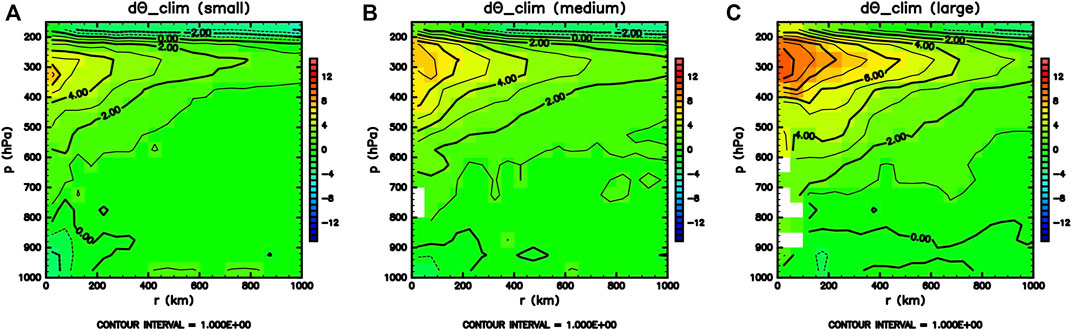
FIGURE. 5.
Therefore, the vertical profile of the potential temperature is highly relevant to the MSLP. However, it is not clear whether a single-level observation observed by aircraft can be used as a proxy for the MSLP. Figure 6A shows the relationship between the potential temperature anomaly with respect to the climatology at 250–350 hPa within r < 50 km, where the composite mean exhibited the maximum value (Figure 3), and MSLP in the best track. The increasing potential temperature anomaly was clearly associated with a decrease in the MSLP. The simple linear regression yields the MSLP (hPa) as shown below:
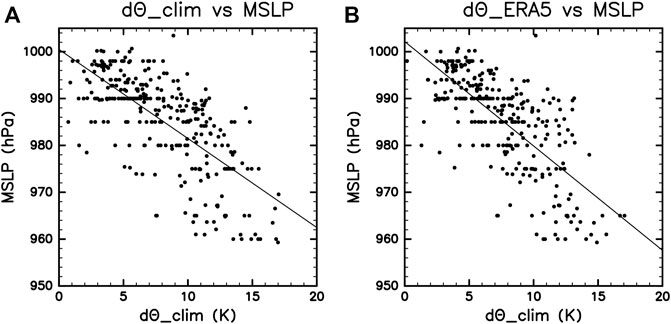
FIGURE. 6. The relationship between MSLP in the best track and potential temperature anomaly in 250–350 hPa within r < 50 km with respect to (A) climatology and (B) ERA5. The regression line is overplotted.
The root mean square difference (RMSD) between this simple statistical model and the best track was 7.33 hPa, which is comparable to, or smaller than the uncertainties in the best track and other techniques (Hoshino and Nakazawa 2007; Nakazawa and Hoshino 2009; Shimada et al., 2016; Ito et al., 2018; Higa et al., 2021). Although
with the RMSD of 7.20 hPa. In other words, a single commercial aircraft observation flying over a TC is beneficial for estimating the MSLP of TCs through Eqs. 6, 7, while we should be prudent to apply these equations to very strong TCs whose MSLP is lower than 960 hPa because the samples were rarely taken. It supports the validity of methodologies that use satellite-derived potential temperature anomalies for TC intensity estimation.
3.2 Wind field
Figure 7 shows the composite mean of the radial and tangential wind in radial-pressure coordinates. The depth of the strong cyclonic wind ranges from the lower troposphere to the upper troposphere for strong TCs. However, cyclonic wind is observed only in the middle and lower troposphere for weak TCs. In the main cruising altitudes for a longer flight (200–300 hPa), the composite-mean wind speed is much weaker than in the lower troposphere, while there is a chance that strong turbulence exists. Anticyclonic circulation was observed in the outer upper troposphere. This anticyclonic circulation became stronger with increasing TC intensity. The composite mean of the tangential wind was maximized at approximately 800 hPa. The corresponding height was higher than that observed (500–1,000 m) in dropsondes in the Atlantic Ocean (Powell et al., 2003). This might be because ACARS/AMDAR observations in the lower troposphere are mostly obtained over land, where the surface friction is very strong.
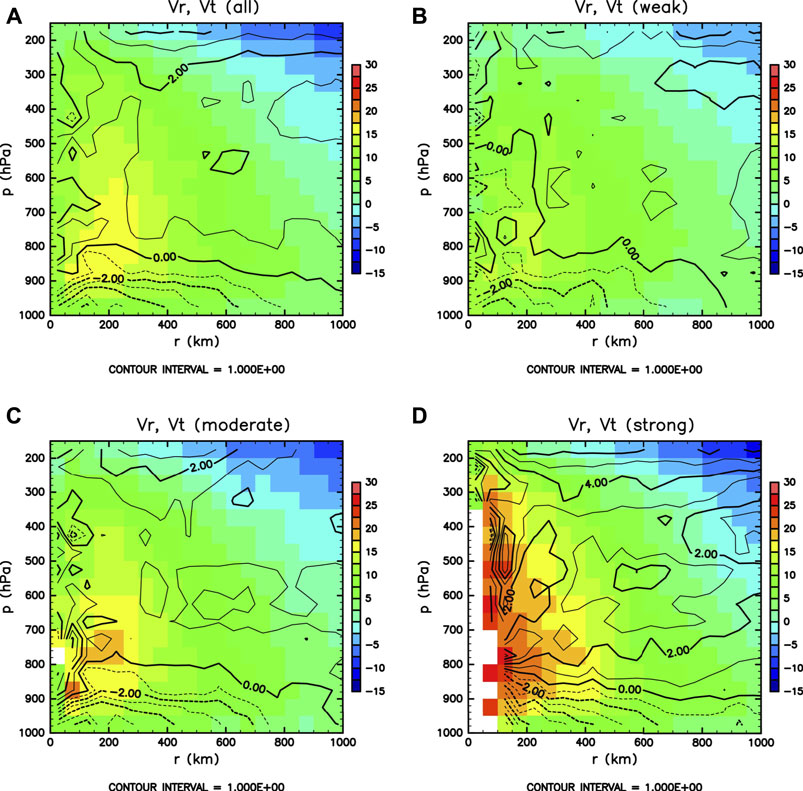
FIGURE. 7. The radial velocity (contour) and tangential velocity (shade) in a radial-pressure coordinate for (A) all TCs, (B) Vmax < 25 ms−1, (C) 25 ms−1 < Vmax < 33 ms−1, and (D) Vmax > 33 ms−1.
The radial wind profile indicates that low-level inflow and upper-level outflow can be clearly detected based on ACARS/AMDAR observations below 850 hPa and above 300 hPa, respectively. With increasing intensity, the inflow and outflow regions were larger. A low-level inflow of more than 1 ms−1 was observed within 600 km for weak TCs, whereas it was 1,000 km for strong TCs. The outflow became stronger with decreasing pressure, whereas the core of the outflow might be located above 200 hPa. Upper-level outflow was clearly observed above 300 hPa for strong TCs. The outflow was discernible beyond r = 1,000 km, supporting the idea that positive
The composite mean of absolute angular momentum (AAM) for each intensity category is shown in Figure 8. A relatively larger AAM is advected close to the TC center for strong TCs. As the AAM is nearly conserved except for the frictional loss at the surface and mixing around the tropopause (Hioki and Tsuboki 2021), the slantwise tilt of the constant AAM and radial gradient of radial wind indicate upward motion at 200 hPa even for weak TCs. In addition, the core height of the outflow is thought to be above 200 hPa. This core height is as high as observated in the Atlantic (Komaromi and Doyle 2017) or higher. The slope becomes flatter for strong TCs, implying that the upward air parcel experiences more outward motion. The calculus for an axisymmetric balanced vortex yields the slope along the constant AAM surface as follows:
where f is the Coriolis parameter,
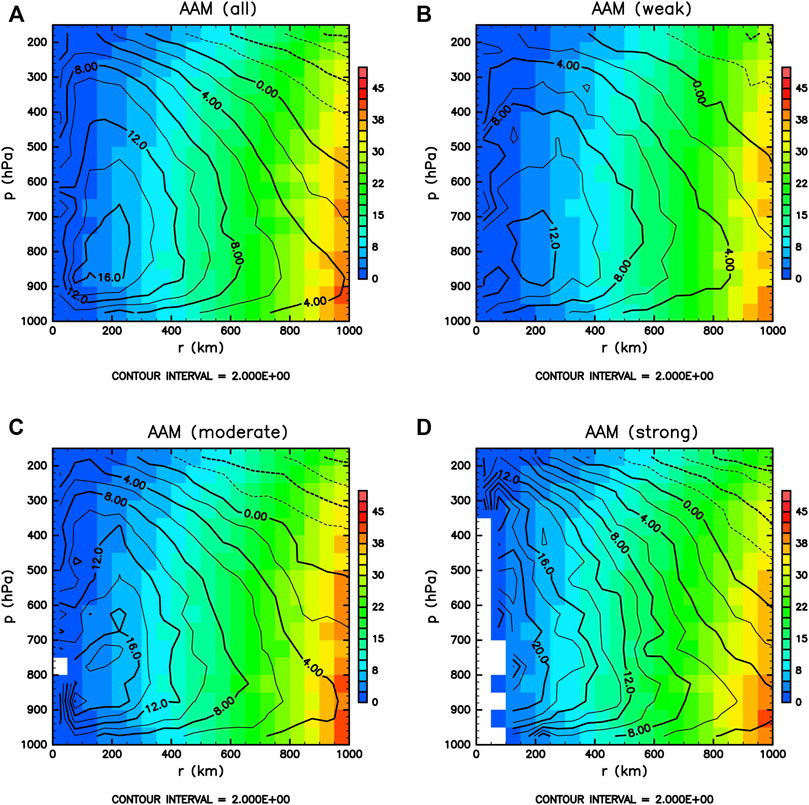
FIGURE. 8. AAM (
4 Concluding remarks
In-situ observations of TCs are very important for describing the true TC structure. Moreover, it has long been believed that such observations have become rare in the western North Pacific since 1987. The current study reveals that meteorological variables reported and archived in the ACARS/AMDAR are beneficial for several purposes. Due to the large number of observations, they are sufficient to construct the mean vertical-pressure cross section of potential temperature and wind fields, particularly for upper tropospheric conditions and weak-to-moderate TCs.
The well-known basic structures are reproduced in our composite analysis: Upper-level warm core, inflow in the lower troposphere, outflow in the upper troposphere, and slantwise upward motion. Several important findings have been produced in this study are summarized as follows. First, the upper-level warm potential temperature anomaly can be extended more than 1,000 km away from the center of the TCs, with respect to the climatology. It cautions a typical definition of a warm temperature anomaly from the environment, represented as a 1,000 km ring or less. Second, a large TC tends to have a deep and strong upper-level warm core for a given maximum wind speed. It is reasonable that a large TC for the given maximum wind speed has a low MSLP through gradient wind balance and that the low MSLP is connected to the vertically integrated thermodynamic property. Third, the peak pressure level of the potential temperature anomaly did not depend on the intensity. In addition, the core of the outflow was expected to be above 200 hPa, considering the AAM surface and weak radial wind at 200 hPa. Another contribution of this work is to provide the usefulness of potential temperature anomaly as a proxy for MSLP based on the in-situ observations.
Although the current study demonstrates the advantages of ACARS/AMDAR data for constructing the composite mean of the TC structure, few sections must be interpreted with caution. Low- and middle-tropospheric observations were mostly obtained over land. Therefore, it does not entirely represent the characteristics of TCs in the western North Pacific. In addition, the middle-to-low troposphere of the inner core is rarely observed for strong TCs. For this purpose, coordinated aircraft campaigns that penetrate the eyewalls of strong TCs such as T-PARCII are considered powerful in the western North Pacific.
Data availability statement
The original contributions presented in the study are included in the article/supplementary material, further inquiries can be directed to the corresponding author.
Author contributions
KI designed the study, discussed the results, and wrote the manuscript. RY performed the data analysis.
Funding
This research was supported by JST Moonshot R&D Grant Number JPMJMS2282 and MEXT KAKENHI Grant JP21H04992, JP21K03657, and JP18H01283.
Acknowledgments
We would like to thank NCAR/EOL for providing the data under the sponsorship of the National Science Foundation https://data.eol.ucar.edu/.
Conflict of interest
The authors declare that the research was conducted in the absence of any commercial or financial relationships that could be construed as a potential conflict of interest.
Publisher’s note
All claims expressed in this article are solely those of the authors and do not necessarily represent those of their affiliated organizations, or those of the publisher, the editors and the reviewers. Any product that may be evaluated in this article, or claim that may be made by its manufacturer, is not guaranteed or endorsed by the publisher.
References
Benjamin, S. G., Schwartz, B. E., and Cole, R. E. (1999). Accuracy of ACARS wind and temperature observations determined by collocation. Wea. Forecast. 14, 1032–1038. doi:10.1175/1520-0434(1999)014<1032:aoawat>2.0.co;2
Cardinali, C., Isaksen, L., and Andersson, E. (2003). Use and impact of automated aircraft data in a global 4DVAR data assimilation system. Mon. Weather Rev. 131, 1865–1877. doi:10.1175//2569.1
Chan, P., Wu, N., Zhang, C., Deng, W., and Hon, K. (2018). The first complete dropsonde observation of a tropical cyclone over the South China Sea by the Hong Kong Observatory. Weather 73, 227–234. doi:10.1002/wea.3095
D'Asaro, E., Black, P., Centurioni, L. R., Chang, Y-T., Chen, S., Foster, R. C., et al. (2014). Impact of typhoons on the ocean in the Pacific. Bull. Amer. Meteor. Soc. 95, 1405–1418.
Drüe, C., Frey, W., Hoff, A., and Hauf, T. (2008). Aircraft type-specific errors in AMDAR weather reports from commercial aircraft. Q. J. R. Meteorol. Soc. 134, 229–239. doi:10.1002/qj.205
Durden, S. L. (2013). Observed tropical cyclone eye thermal anomaly profiles extending above 300 hPa. Mon. Weather Rev. 141, 4256–4268. doi:10.1175/mwr-d-13-00021.1
Elsberry, R. L., and Harr, P. A. (2008). Tropical cyclone structure (TCS08) field experiment science basis, observational platforms, and strategy. Asia-Pacific J. Atmos. Sci. 44, 209–231.
Elsberry, R. L. (1990). International experiments to study tropical cyclones in the Western North Pacific. Bull. Amer. Meteor. Soc. 71, 1305–1316. doi:10.1175/1520-0477(1990)071<1305:ietstc>2.0.co;2
Emanuel, K. A. (1986). An air-sea interaction theory for tropical cyclones. Part I: Steady-state maintenance. J. Atmos. Sci. 43, 585–605. doi:10.1175/1520-0469(1986)043<0585:aasitf>2.0.co;2
Emanuel, K. (2012). Self-stratification of tropical cyclone outflow. Part II: Implications for storm intensification. J. Atmos. Sci. 69, 988–996. doi:10.1175/jas-d-11-0177.1
Frehlich, R., and Sharman, R. (2010). Climatology of velocity and temperature turbulence statistics determined from rawinsonde and ACARS/AMDAR data. J. Appl. Meteorology Climatol. 49, 1149–1169. doi:10.1175/2010jamc2196.1
Hersbach, H., Bell, B., Berrisford, P., Hirahara, S., Horányi, A., Muñoz-Sabater, J., et al. (2020). The ERA5 global reanalysis. Quart. J. Roy. Meteor. Soc. 146, 1999–2049.
Higa, M., Tanahara, S., Adachi, Y., Ishiki, N., Nakama, S., Yamada, H., et al. (2021). Domain knowledge integration into deep learning for typhoon intensity classification. Sci. Rep. 11, 1–10. doi:10.1038/s41598-021-92286-w
Hioki, T., and Tsuboki, K. (2021). Trajectory analyses on the warm core development and pressure falls of a developing typhoon as simulated by a cloud-resolving model. J. Meteorological Soc. Jpn. 99, 064–1350. doi:10.2151/jmsj.2021-064
Hirano, S., Ito, K., Yamada, H., Tsujino, S., Tsuboki, K., and Wu, C.-C. (2022). Deep eye clouds in tropical cyclone trami (2018) during T-PARCII dropsonde observations. J. Atmos. Sci. 79, 683–703. doi:10.1175/jas-d-21-0192.1
Hoshino, S., and Nakazawa, T. (2007). Estimation of tropical cyclone's intensity using TRMM/TMI brightness temperature data. J. Meteorological Soc. Jpn. 85, 437–454. doi:10.2151/jmsj.85.437
Ito, K., Yamada, H., Yamaguchi, M., Nakazawa, T., Nagahama, N., Shimizu, K., et al. (2018). Analysis and forecast using dropsonde data from the inner-core region of Tropical Cyclone Lan (2017) obtained during the first aircraft missions of T-PARCII. SOLA 14, 105–110. doi:10.2151/sola.2018-018
Knaff, J. A., Zehr, R. M., Goldberg, M. D., and Kidder, S. Q. (2000). An example of temperature structure differences in two cyclone systems derived from the Advanced Microwave Sounder Unit. Wea. Forecast. 15, 476–483. doi:10.1175/1520-0434(2000)015<0476:aeotsd>2.0.co;2
Komaromi, W. A., and Doyle, J. D. (2017). Tropical cyclone outflow and warm core structure as revealed by HS3 dropsonde data. Mon. Weather Rev. 145, 1339–1359. doi:10.1175/mwr-d-16-0172.1
Nakazawa, T., and Hoshino, S. (2009). Intercomparison of Dvorak parameters in the tropical cyclone datasets over the Western North Pacific. SOLA 5, 33–36. doi:10.2151/sola.2009-009
Newell, R., Hu, W., Wu, Z. X., Zhu, Y., Akimoto, H., Anderson, B. E., et al. (1996). Atmospheric sampling of supertyphoon mireille with NASA DC-8 aircraft on september 27, 1991, during PEM-west A. J. Geophys. Res. 101, 1853–1871. doi:10.1029/95jd01374
NOAA/ESRL, 2011: Aircraft meteorological data reports (AMDAR) and aircraft Communications addressing and reporting system (ACARS) data. Version 1.0. UCAR/NCAR - Earth Observing Laboratory.
Oyama, R., Nagata, K., Kawada, H., and Koide, N. (2016). Development of a product based on consensus between Dvorak and AMSU tropical cyclone central pressure estimates at JMA, 18. JMA: RSMC Tokyo-Typhoon Center Technical Review
Powell, M. D., Vickery, P. J., and Reinhold, T. A. (2003). Reduced drag coefficient for high wind speeds in tropical cyclones. Nature 422, 279–283. doi:10.1038/nature01481
Shimada, U., Sawada, M., and Yamada, H. (2016). Evaluation of the accuracy and utility of tropical cyclone intensity estimation using single ground-based Doppler radar observations. Mon. Wea. Rev. 144, 1823–1840. doi:10.1175/mwr-d-15-0254.1
Stern, D. P., and Nolan, D. S. (2012). On the height of the warm core in tropical cyclones. J. Atmos. Sci. 69, 1657–1680. doi:10.1175/jas-d-11-010.1
Stern, D. P., and Zhang, F. (2016). The warm-core structure of Hurricane Earl (2010). J. Atmos. Sci. 73, 3305–3328. doi:10.1175/jas-d-15-0328.1
Wu, C.-C., Lin, P-H., Aberson, S., Yeh, T-C., Huang, W-P., Chou, K-H., et al. (2005). Dropwindsonde observations for typhoon surveillance near the taiwan region (DOTSTAR) an overview. Bull. Amer. Meteor. Soc. 86, 787–790.
Yamada, H., Ito, K., Tsuboki, K., Shinoda, T., Ohigashi, T., Yamaguchi, M., et al. (2021). The double warm-core structure of Typhoon Lan (2017) as observed through the first Japanese eyewall-penetrating aircraft reconnaissance. J. Meteorological Soc. Jpn. 99, 063–1327. Ser. II. doi:10.2151/jmsj.2021-063
Keywords: warm core, tropical cyclone, aircraft, wind, temperature
Citation: Ito K and Yamamoto R (2022) Thermodynamic and kinematic structure of tropical cyclones in the western North Pacific based on ACARS/AMDAR. Front. Earth Sci. 10:1058262. doi: 10.3389/feart.2022.1058262
Received: 30 September 2022; Accepted: 23 November 2022;
Published: 05 December 2022.
Edited by:
Eric Hendricks, National Center for Atmospheric Research (UCAR), United StatesReviewed by:
Tao Gao, Institute of Atmospheric Physics, CAS, ChinaKelvin T. F. Chan, Sun Yat-sen University, China
Copyright © 2022 Ito and Yamamoto. This is an open-access article distributed under the terms of the Creative Commons Attribution License (CC BY). The use, distribution or reproduction in other forums is permitted, provided the original author(s) and the copyright owner(s) are credited and that the original publication in this journal is cited, in accordance with accepted academic practice. No use, distribution or reproduction is permitted which does not comply with these terms.
*Correspondence: Kosuke Ito, itokosk@sci.u-ryukyu.ac.jp