What affects the timing of tropical cyclone formation within a monsoon trough?
 Huijun Zong
 Liguang Wu
- 1School of Atmospheric Sciences, Nanjing University of Information Science and Technology, Nanjing, China
- 2Department of Atmospheric and Oceanic Sciences and Institute of Atmospheric Sciences, Fudan University, Shanghai, China
Although favorable environmental conditions for tropical cyclone (TC) formation have been known for a long time, physical factors that influence the timing of TC formation remain unclear. Idealized numerical simulations are conducted by placing identical tropical disturbances (TDs) in various locations within the monsoon trough to examine what affects the timing of TC formation. The timing of TC formation is evaluated by the development time of TDs, which ranges from 60 h to 189 h. Vertical misalignment, defined as the vortex tilt between mid-and low-level circulation centers of the TD, is closely related to TC formation timing. The mid-and low-level circulation centers tend to be vertically aligned when TC formation time approaches. Different from previous studies, vertical misalignment does not entirely depend on vertical wind shear. Vertical misalignment is directly induced by inconsistent translation speeds between the mid-and low-level circulation centers. However, the steering flows for the mid-and low-level circulation centers cannot fully explain the differences in translation speeds. Additionally, there is no strong connection between environmental conditions and TC formation timing for the TDs within the monsoon trough. Rossby energy dispersions of TDs and terrain effects have some impacts on TC formation timing but are not decisive in this study.
1 Introduction
Tropical cyclone (TC) formation requires a favorable environment, which exhibits the influence of the Coriolis force, positive low-level relative vorticity, weak vertical wind shear, warm sea surface temperature, high mid-level relative humidity, and instability between the surface and the mid-level (Gray, 1968; Gray, 1975; Gray, 1998). Such favorable environmental conditions facilitate the development of tropical disturbances (TDs) or tropical cloud clusters (TCCs) which have been regarded as precursors for TCs (Fu et al., 2012; Peng et al., 2012; Kerns and Chen, 2013). Once a TD has formed, a tropical cyclone formation alert will be issued if the possibility of it developing into a TC is high and expected to develop into a TC within 24 h. However, factors that influence when a TC will form remain unclear when compared to those factors that influence whether a TC will form or not.
As a measure of evaluating the fast or slow TD development into a TC, the development time is usually defined as a period from the formation of a TD or a TCC to its development into a TC (Nolan, 2007; Ge et al., 2013a; Teng et al., 2020). The development time varies in different environmental conditions. Vertical wind shear is an important factor that can affect TC formation time by its effects on the distribution of convection (Rappin and Nolan, 2012; Ge et al., 2013b; Tao and Zhang, 2014). Rappin and Nolan (2012) indicated that the development time depended on the magnitudes of vortex tilt which was dependent on the orientation of the vertical wind shear between the middle and lower levels as to the surface wind. Ge et al. (2013b) and Tao and Zhang (2014) suggested that vertical wind shear between upper and lower levels can affect the genesis efficiency or TC formation timing. In these studies, vortex tilt is viewed as a result of vertical wind shear during TC formation. Schecter and Menelaou (2020) further explored the shear-free evolutions of TDs with different initial vortex tilts and found that the large initial misalignment can also hinder the development of TDs. Additionally, in a no-shear environment, stronger environmental relative vorticity and higher mid- and low-tropospheric relative humidity can lead to a higher genesis efficiency (Ge et al., 2013a). However, the combined impacts of these environmental factors on the development time are still unclear.
Apart from the environmental factors, the development time is also related to internal processes associated with TC formation. The genesis efficiency is linked to the structure of the initial disturbance. Numerical studies suggested that the initial disturbance comprised of a mid-level vortex took more time to develop into a TC than that of a surface vortex (Nolan, 2007; Ge et al., 2013a). Also, the incipient disturbance of a deep vortex reaches tropical storm intensity more quickly than that of a shallow vortex (Nolan, 2007; Ge et al., 2013a). Radiation is also an important factor affecting the timing of TC formation by influencing convections (e.g., Nicholls and Montgomery, 2013; Nicholls, 2015; Muller and Romps, 2018; Ruppert et al., 2020; Smith et al., 2020; Yang and Tan, 2020; Yang et al., 2021). The radiation can stimulate convections by changing the heating lapse rate through the environmental radiative cooling in the nighttime (e.g., Tao et al., 1996; Melhauser and Zhang, 2014), enhancing convective instability induced by the heating disparities between the cloud top and base (e.g., Hobgood, 1986; Tao et al., 1996), and driving a secondary circulation caused by the radiative heating differences between the cloudy region and the clear-sky environment (e.g., Gray and Jacobson, 1977; Tao et al., 1996; Nicholls, 2015; Muller and Romps, 2018; Ruppert et al., 2020; Yang and Tan, 2020; Yang et al., 2021). It should be noted that most of the previous numerical studies investigated the influence of radiation on TC formation timing by comparing the experiments of tropical cyclogenesis with or without radiative effects. This helps us to understand the role of radiation in the acceleration of TC formation. However, no TC formation process can exclude radiative effects in the real world. Moreover, it is still not clear how it quantitatively affects TC formation timing.
Current understandings of the development time are mainly the effects of a single factor based on idealized numerical simulations. For tropical cyclogenesis in the real world, all the environmental factors and the relevant internal process should be synthetically concerned. Teng et al. (2020) found that TCCs develop into TCs more rapidly in easterly environments than in monsoon environments. Such results can be regarded as combined effects on the TC formation timing within different environments. However, disturbances even within the same kind of environment still show large differences. For example, two tropical storms named Haima and Meari in 2011 formed within the same monsoon trough over the western North Pacific (WNP). The Joint Typhoon Warning Center first issued tropical cyclone formation alerts for Haima at 16:30 UTC 16 on Jun and Meari at 03:00 UTC on 20 June Then they first reached tropical storm intensity at 00:00 UTC on 23 June and 18:00 UTC on 22 June, respectively. The precursor disturbance of Meari occurred later than that of Haima, but was much earlier to reach tropical storm intensity. The difference in the time between first issued tropical cyclone formation alert and TC formation for Haima and Meari was nearly 4 days. Hence, it leads to a question: what affects the timing of TC formation within a similar environment? The difference in TC formation timing for the 2 TCs may come from the structural differences of their precursor disturbances during the earlier stage. However, assuming that the TDs have the same structure and intensity and are in a similar environment, would there be no difference in TC formation timing?
In this study, we intend to find out what affects the timing of TC formation within the same kind of environmental background. Over the WNP, tropical cyclogenesis is closely associated with monsoon trough (e.g., Gray, 1968; Briegel and Frank, 1997; Ritchie and Holland, 1999; Molinari and Vollaro, 2013; Zong and Wu, 2015a). The trough satisfies dynamical environmental requirements that are critical for TC formation over the WNP (Gray, 1998; Fu et al., 2012). Most of the TDs or TCCs are embedded within a monsoon trough (Chen and Weng, 1998; Gray, 1998). Considering that the monsoon trough is a long-lasting system on the daily, weekly, and monthly scales (Harr and Wu, 2011; Molinari and Vollaro, 2013; Zong and Wu, 2015a), we chose the monsoon trough as the environmental large-scale background for the TD development. Following the distribution of TDs within the monsoon trough from the observations (Zong and Wu, 2015b), numerical simulations of the evolutions of identical TDs of the symmetry structures but in different locations with respect to the same monsoon trough were performed to obtain the results that were close to the reality. The identical TDs were used here since we aim to focus on the fast and slow development of TDs within a similar environment, and the influence of the TD structure on the development time has been discussed in detail in previous studies (Nolan, 2007; Ge et al., 2013a). The experimental design and method are introduced in Section 2. The simulated TD development and the influence of the initial environment are described in Section 3. Then, the main factor that influences the timing of TC formation within the monsoon trough and other influences are discussed in Sections 4, 5, respectively. A comparison of two cases is given in Section 6. Finally, a summary is given in Section 7.
2 Experimental design and method
In this study, idealized numerical experiments were conducted with the Advanced Research Weather Research and Forecasting (WRF-ARW) model (version 3.5.1) (Skamarock et al., 2008). To explore the different development of the TDs within the monsoon trough, the experiments which were initialized with TDs of the same symmetry structures but in different locations with respect to the identical monsoon trough were carried out. Ten TDs of the same structures were superimposed over the monsoon trough including the monsoon shear region and confluence zone (Figure 1A), which is consistent with the observed TD locations within the monsoon trough from Zong and Wu (2015b). The detailed initialization locations of the TDs within the monsoon trough of all the experiments are listed in Table 1. Based on the composited vertical structure of TDs from Zong and Wu (2015b), the maximum wind speeds of the TDs and their radii of them were all set by 8 m s−1 and 216 km (Figure 2A). Additionally, the simulation of a TD in a quiescent f-plane background was carried out for reference. The center of the TD in the quiescent f-plane experiment was set at 12°N, 145°E. The environmental parameters around the TD in the quiescent f-plane experiment were set based on the averages of the TC formation environment within the monsoon trough. No environmental flows were superimposed in the f-plane experiment.
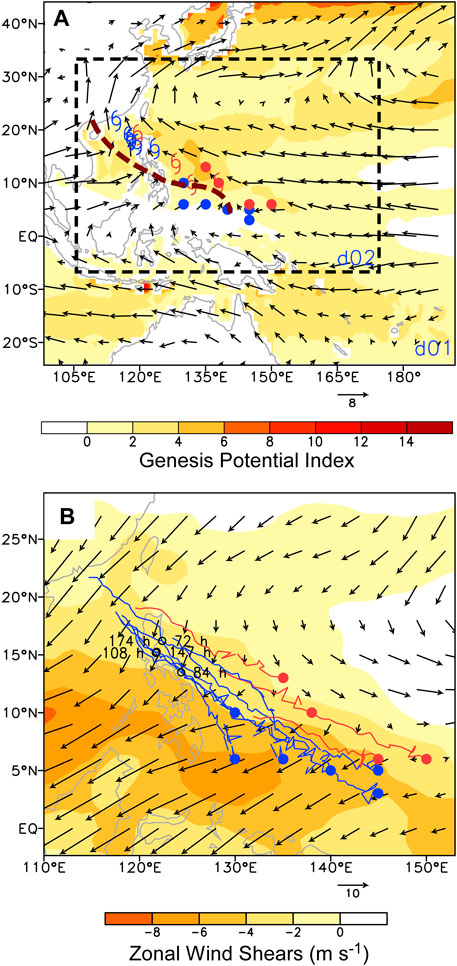
FIGURE 1. (A) Initial wind fields (vectors, m s−1) and genesis potential index (shaded), and (B) vertical wind shear (vectors, m s−1) and zonal wind shear (shaded, m s−1) between 500 hPa and 850 hPa. The red and blue marks and solid lines denote locations, and tracks prior to tropical cyclone formation of the fast and slow cases, respectively. The dots and typhoon marks indicate the locations of tropical disturbance centers initially and subsequent tropical cyclone formation, respectively. The black circles indicate the location where tropical disturbance centers approached the Philippine Islands.
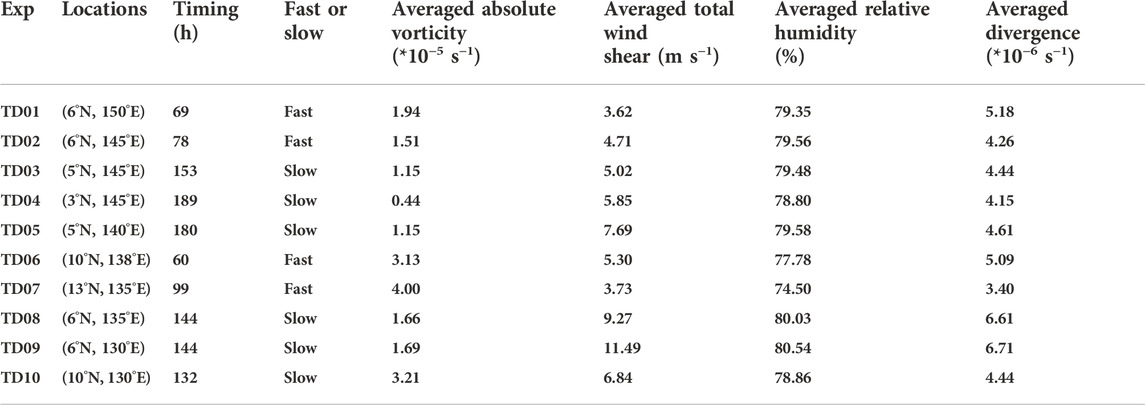
TABLE 1. List of the locations of the centers of the initial disturbances within the monsoon trough and brief descriptions for the later development. The initial disturbance within the quiescent background developed into a TC at 129 h. “Fast” indicates the TC formation time earlier than the TC that formed in the quiescent background while “Slow” indicate the TC formation time later than the TC that formed in the quiescent background. The earliest and latest TC formation time are marked with gray shades. The averaged absolute vorticity at 850 hPa (*10−5 s−1), magnitudes of the total vertical wind shear between 200 hPa and 850 hPa (m s−1), mid- and low-level relative humidity (averaged between 850 hPa and 600 hPa, %), and divergence at 200 hPa (*10−6 s−1) provided by the monsoon trough were calculated around the TD centers within a radius of 440 km at the initial time.
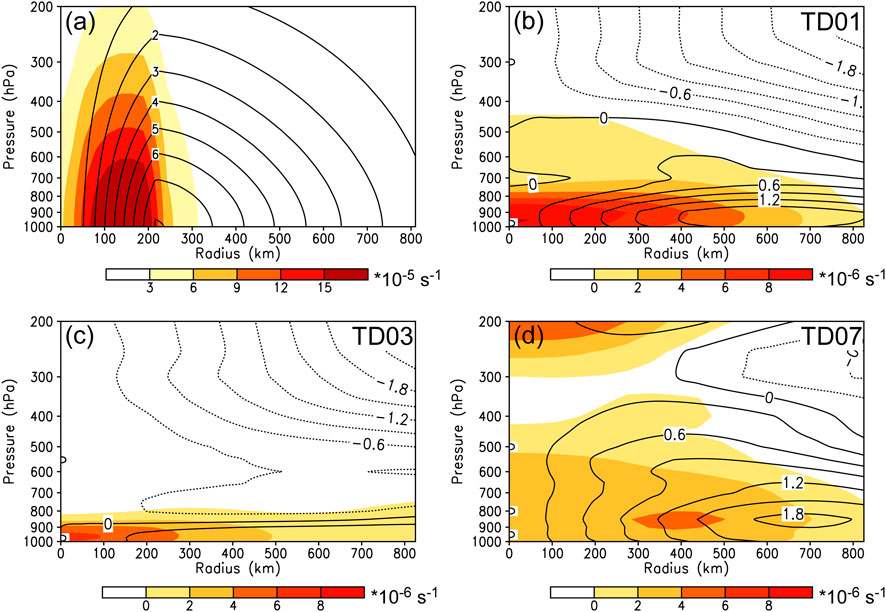
FIGURE 2. Vertical profiles of the symmetric azimuthal wind (contour, m s−1) and azimuthal symmetric relative vorticity (shaded, s−1) of tropical disturbances. (A) Indicates the vertical profile of an original tropical disturbance without superimpositions of the monsoon trough, and (B–D) indicate the vertical profiles of the superimpositions of the monsoon trough on tropical disturbances TD01, TD03, and TD07.
The superimposition of the monsoon trough led to a slight enhancement of the TD, but did not cause a boost in the TD intensity or any large differences in the intensity among the TDs. For example, the enhancement of the symmetric relative vorticity of TD01, TD03, and TD07 caused by the monsoon trough was one order of magnitude smaller than the symmetric relative vorticity of the original TD (Figure 2). When compared to the symmetric winds of the original TD, the enhancement on the symmetric winds was smaller and the maximum enhancement was far away from the radius of the maximum winds of the original TD (Figures 2B–D). The enhancement of the symmetric winds and relative vorticity of the other seven TDs was similar. However, the superimposition of the monsoon trough caused structural changes of the TDs. As shown by Figure 3A, the mid- and low-level flows around the TD center were concentric initially, which indicates that the initial structure of the original TD was in a vertical alignment. After being superimposed with the monsoon trough, the mid- and low-level circulation centers did not coincide, and asymmetries in the mid- and low-level winds around the TD center can also be seen (Figures 3B–D). The TDs became vertically misaligned. Although there existed vertical misalignments and horizontal asymmetries, the TDs in all the experiments almost began with the same intensities initially as shown by Figure 4. Overall, the superimposition of the monsoon trough caused unignorable changes in the TD structure other than the intensity.
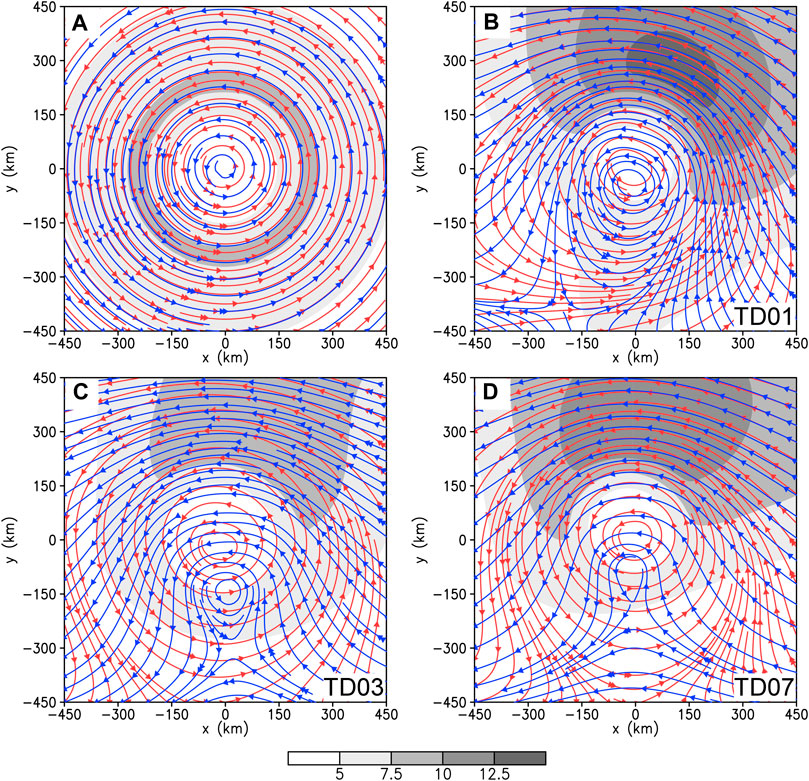
FIGURE 3. Initial streamlines of the horizontal flows at 1.5-km (red) and 4.5-km (blue) and wind speeds (shaded, m s−1). (A) Indicates the wind field of a tropical disturbance without any superimpositions of the monsoon trough while (B–D) indicate the wind fields of tropical disturbances TD01, TD03, and TD07 after being superimposed with the monsoon trough.
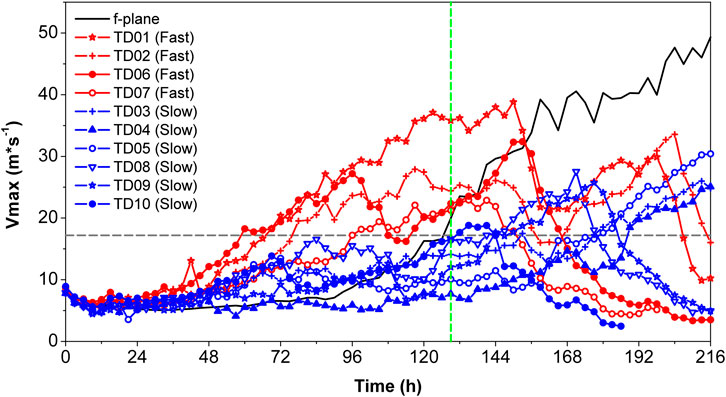
FIGURE 4. Time evolutions of the maximum symmetric wind speed at 10 m of the tropical disturbances (TDs). The red and blue marks and solid lines denote the wind speed evolutions of the fast and slow cases, respectively. The wind speed of the tropical storm intensity is marked by the gray line. The black solid line denotes the wind speed evolution of the TD in the quiescent f-plane background and the green dashed line indicates its formation time.
The monsoon trough as the TC formation environment in the experiments was obtained from the National Centers for Environmental Prediction (NCEP) Final (FNL) Operational Global Analysis data (https://rda.ucar.edu/datasets/ds083.2/) with 1°×1° latitude-longitude grids at 6-h intervals. All the physical variables between July and September from 2000 to 2010 were calculated to obtain the daily annual averages. Then a lowpass Lanczos filter with a 10-day cut-off period was applied to the variables in the FNL data in order to isolate high-frequency components from the original data (Duchon, 1979). The monsoon trough from the climatological daily-averaged low-frequency components at 00 UTC 1 July was used as the background of the TDs. As shown by Figure 1A, the low-level circulations of the monsoon trough were horizontally asymmetric and the trough axis was southeast-northwest oriented. At mid-levels, the southwesterly winds decreased while the easterly winds extended to the west since there were westerly shears to the north of the axis and easterly shears to the south of the axis (Figure 1B). As a result, the trough axis tilted to the west with height. All the TDs were embedded in the easterly shears. At upper levels, the trough disappeared and was replaced by the divergent flows and the tropical upper tropospheric trough.
To evaluate the likelihood of TC formation within the monsoon trough, the genesis potential index was applied. Considering that the dynamic parameters are important for TC formation over the WNP (Gray 1998; Fu et al., 2012), the dynamical genesis potential index (DGPI) proposed by Wang and Murakami (2020) was used here. DGPI shows a good performance on estimations of the genesis potential of the TCs over the western North Pacific. This index is written as follows:
where Vs is the magnitude of the total vertical wind shear (m s−1) between 200 hPa and 850 hPa, Uy is the meridional gradient of the zonal winds (s−1) at 500 hPa, ω is the vertical velocity (Pa s−1) at 500 hPa and η is the absolute vorticity (s−1) at 850 hPa. The DGPIs were high within the monsoon trough at the initial time, which suggests that all the TDs within the monsoon trough in the experiments had high probabilities of developing into TCs (Figure 1A). It is reasonable to use such a monsoon trough as the TC formation environmental background in this study.
Two interactive model domains were used with 41 vertical levels from the surface to 50 hPa with a center at (12°N, 145°E). The two nested grid domains have the dimensions of 397×301 (d01) and 835×511 (d02) grid points with resolutions of 27 km and 9 km, respectively (Figure 1A). The numerical simulations are integrated for 10 days. The fixed lateral boundary conditions were used in the model. The cumulus parameterization schemes included the Kain-Fritsch scheme (Kain 2004) for the 27-km resolution domain and no cumulus parameterization scheme for the 9-km resolution domain. The WRF Single-Moment 3-class (WSM3) and WRF Double-Moment 6-class (WDM6) schemes (Hong et al., 2004; Lim and Hong, 2010) were used for 27-km and 9-km resolution domains, respectively. Additionally, the Mellor-Yamada Nakanishi and Niino Level 2.5 (MYNN 2.5) Planetary Boundary Layer scheme (Nakanishi and Niino, 2006), the Rapid Radiative Transfer Model (RRTM) scheme for the longwave radiation (Mlawer et al., 1997) and the Dudhia scheme for the shortwave radiation (Dudhia, 1989) were used. All the experiments in this study adopted the same settings above.
The subsequent TC formation time is regarded as the time when the maximum azimuthal-mean tangential wind speed exceeds 17.2 m s−1 for the first time. Generally, the maximum tangential wind speed is also used for determining the TC formation time in numerical studies. However, it is noted that the monsoon trough circulations can lead to asymmetries of the TDs, and the asymmetries vary in the different locations within the monsoon trough. To minimize the interference from these asymmetries in determining the TC formation time, the maximum azimuthal-mean tangential wind speed was used to define the TC formation time instead. The simulated TC center was determined by the lowest sea-level pressure in a closed low-pressure area of intense cyclonic wind speeds, which were higher than 17.2 m s−1. Last, but not least, all the simulated TCs within the monsoon trough were checked for possessing warm cores or not, and the results show that all the simulated TCs had warm cores (figure omitted).
3 Simulated tropical disturbance development and the influence of the initial environmental conditions
Figure 4 shows the time evolutions of the maximum symmetric wind speed at 10 m of the precursor disturbances in this study. For the TD within a quiescent f-plane background, it took 129 h to develop into a TC. All the TDs within the monsoon trough finally developed into TCs. Although the monsoon trough provided favorable environmental conditions for TC formation, not all the TDs developed faster than that in a quiescent f-plane background. Compared to the TC formation timing of the TD within a quiescent f-plane background, four fast cases and six slow cases were identified. As Table 1 shows, the fastest case took 60 h (less than 3 days) to develop into a TC while the slowest one took 189 h (nearly 8 days).
TC formation within the monsoon trough has preferred spots. Briegel and Frank (1997) suggested that TCs tended to form in the monsoon confluence zone where monsoonal westerly winds meet easterly trade winds, while Ritchie and Holland (1999) and Zong and Wu (2015a) indicated that more TC formation events formed in the monsoon shear region where the trade winds lie north of the monsoonal westerlies. Regardless of the initial locations, most of the TDs developed into TCs in the monsoon shear region (Figure 1A), which is consistent with the observations from Zong and Wu (2015a).
Since the TDs were placed in different locations of the monsoon trough, the differences in the initial environmental conditions may lead to a distinction in TD development. The favorableness of the environment for TC formation is probably connected to TC formation timing. To examine the connection between initial environmental favorableness and TC formation timing, the environmental conditions including absolute vorticity at 850 hPa, vertical wind shear between 200 hPa and 850 hPa, mid- and low-level relative humidity (averaged between 850 hPa and 600 hPa), and divergence at 200 hPa for all the TDs within the monsoon trough were calculated around the TD centers within a radius of 440 km at the initial time based on the climatological mean monsoon trough from the FNL data as aforementioned.
Table 1 listed TC formation timing and initial environmental conditions for each TD within the monsoon trough, including low-level absolute vorticity, total vertical wind shear, averaged mid- and low-level relative humidity, and upper-level divergence. As shown by Table 1, it is noted that there existed large differences between the maxima and minima of the initial environmental low-level absolute vorticity and total vertical wind shear. Although the slowest case (TD04) had the weakest initial environmental low-level absolute vorticity, the fastest case (TD06) did not have the strongest one. Also, it can be found that some slow cases such as TD10 had more intense absolute vorticity than some fast cases (TD01, TD02, and TD06) did. The case that had the largest initial environmental total vertical wind shear did not take the longest time to develop into a TC while the one that had the smallest shear did not take the shortest time. The total vertical wind shear of TD03 (as a slow case) was smaller than those of the fastest case.
Compared to the initial environmental low-level absolute vorticity and total vertical wind shear, there were no remarkable differences between the maxima and minima of mid- and low-level averaged relative humidity and stronger upper-level divergence. The averaged relative humidity of each TD was higher than 70% and the environmental flows were divergent in the upper troposphere. It should be noted that higher initial environmental mid- and low-level averaged relative humidity and stronger upper-level divergence did not correspond to the fast cases. TD07 (as one of the fast cases) had the lowest relative humidity and weakest divergence while TD09 (as one of the slow cases) had the highest relative humidity and strongest divergence.
To sum up, not all the initial environmental conditions of the fast cases were more favorable than those of the slow cases. Some slow cases had more favorable initial environmental conditions than the fast cases did. There was no strong connection between initial environmental conditions and TC formation timing. Even for individual initial environmental factors, there is no strong connection between individual initial environmental factors and TD development time within the monsoon trough.
4 The influence of vertical misalignment on TC formation timing
4.1 The delay of TC formation timing
As aforementioned, the mid- and low-level circulation centers of the TDs became vertically misaligned after these TDs were superimposed with the monsoon trough. Due to different initial locations of TDs within monsoon trough, the tilting of the mid- and low-level circulation centers of the TDs also varied. The vertical misalignment is quantified by the distances between the mid- and low-level circulation centers. The circulation centers at 5.0-km and 1.5-km altitudes represent the mid- and low-level circulation centers, respectively.
Figure 5A shows the evolutions of the composited distances between the centers of the tropical disturbances (tropical cyclones later) at 1.5-km and 5.0-km altitudes and the maximum and minimum values of the distances of the mid- and low-level circulation centers for the fast and slow cases. All the distances finally decreased to their minima. For all the experiments within the monsoon trough, the mid- and low-level circulation centers tended to be vertically aligned as TC formation time approached. The composited distances for the fast cases were almost larger than those for the slow cases all the time. The composited distances for the fast cases showed a persistent decreasing trend before TDs developed into TCs. But the composited distances for the slow cases went through a short decrease and began to increase after 48 h. They reached their maximum at 69 h and then showed a decreasing trend. The maximum and minimum values of vertical misalignment of the slow cases showed a wider range of variations than those of the fast cases. The maximum and minimum values of the distances of the mid- and low-level circulation centers for the fast cases were also almost smaller than those for the slow cases. The remarkable differences in the distances between the fast and slow cases ranged from 48 h to 120 h, and the peak difference occurred at 69 h. The continuous larger vertical misalignment during these periods in the slow cases was responsible for the slower development and the delay of TC formation.
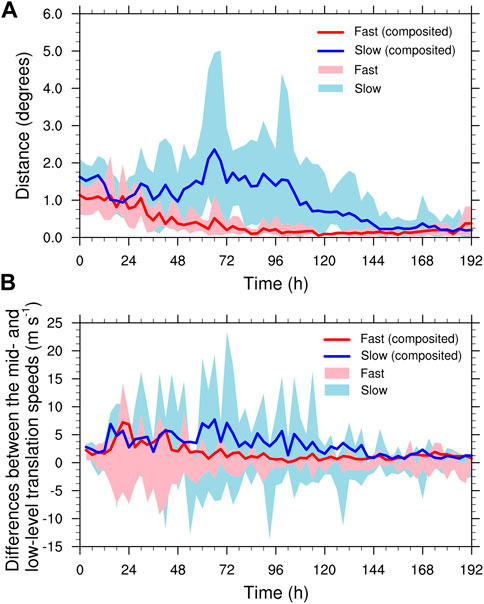
FIGURE 5. Time evolutions of (A) the composited distances between the centers of the tropical disturbances (tropical cyclones later) at 1.5-km and 5.0-km altitudes, and (B) composited differences in translation speeds of the circulation centers at 5.0-km and 1.5-km altitudes. The red and blue lines indicate the composited results of the fast and slow cases, respectively. The upper and lower boundaries of the curves indicate the maximum and minimum values of the distances of the mid- and low-level circulation centers and differences in mid- and low-level translation speeds of the fast (light pink) and slow (light blue) cases. Note that the composites are averages of the absolute values of the translation speed differences.
Compared with the initial vertical misalignment, the evolution of vertical misalignment during the entire TC formation process was important for the timing of TC formation. The continuous decreasing vertical misalignment indicated a faster development while the persistent large vertical misalignment indicated a slower development. It is necessary to look into the sums of vertical misalignment which is regarded as the accumulated distances during the entire TC formation process for all the TDs. It is found that the accumulated distances during the entire TC formation process in all the fast cases were smaller than those in all the slow cases (Figure 6). TC formation time within the monsoon trough increased with the accumulated distances as the linear regression line showed in Figure 6. We also calculated the accumulated distances during the period between 48 h and 120 h which shows remarkable differences in the vertical misalignment. TC formation timing within the monsoon trough also increased with the accumulated distances during this period. Large differences in the accumulated distances between the fast and slow cases can be also found.
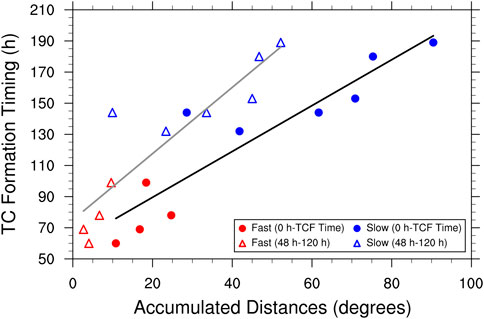
FIGURE 6. Relationship between the accumulated distances (sums of the distances) and TC formation timing within the monsoon trough. The markers of dots and triangles indicate the accumulated distances during the entire TC formation process and 48 h–120 h, respectively. The red and blue markers indicate the fast and slow cases, respectively. The lines are the linear regression lines based on the relationships above.
4.2 The cause of the persistent large vertical misalignment
Previous studies suggest that vertical wind shear between the mid- and low-level horizontal winds can cause a vertical misalignment between the mid- and low-level circulation centers (Davis and Ahijevych, 2012; Rappin and Nolan 2012; Tao and Zhang 2014). It is speculated that the evolution of vertical misalignment is influenced by this kind of vertical wind shear. Here the averaged magnitudes of vertical wind shear between 5.5-km and 1.5-km altitudes based on each disturbance center within an 810 km × 810 km box and its composited values for the fast and slow cases were calculated to examine the relationship between vertical wind shear and vertical misalignment. As shown by Figure 7A, the composited magnitudes of vertical wind shear of the fast cases were weaker than those of the slow cases before 96 h. It seems that the stronger total vertical wind shear corresponded to the larger vertical misalignment. The vertical wind shear showed an increasing trend in both fast and slow cases while vertical misalignment for both fast and slow cases finally tended to decrease as TC formation time approached as shown by Figure 5A. The evolutions of the magnitude of vertical wind shear were not consistent with those of vertical misalignment. The evolutions of vertical wind shear did not show synchronizations with those of vertical misalignment.
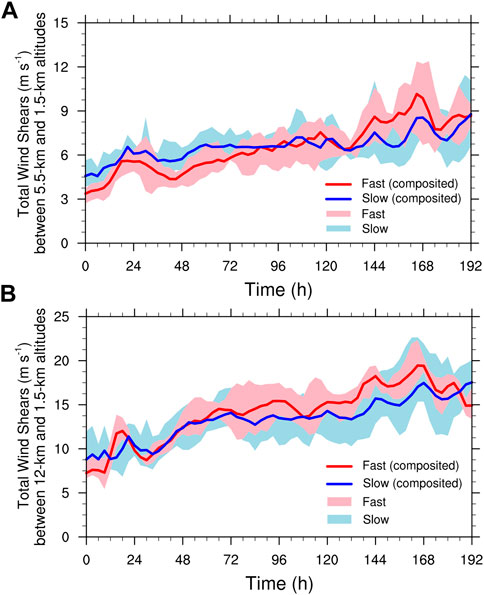
FIGURE 7. Time evolutions of the composited total vertical wind shear (A) between 5.5-km and 1.5-km altitudes (solid lines) and (B) between 12-km and 1.5-km altitudes (solid lines) averaged over an 810 km × 810 km box. The red and blue lines indicate the composited results of the fast and slow cases, respectively. The upper and lower boundaries of the curves indicate the maximum and minimum values of the total vertical wind shear of the fast (light pink) and slow (light blue) cases.
Rappin and Nolan (2012) suggested that the time evolution of the vortex tilt angle coincided with that of the vertical wind shear angle. The vortex tilt angles and vertical wind shear angles were also calculated for both fast and slow cases to further investigate the relationship between vertical misalignment and vertical wind shear. Figure 8A shows the evolutions of the composited vortex tilt angle and vertical wind shear angle between the mid- and low-level circulation centers. Except for the first 48 h, the evolutions of the vortex tilt angle and vertical wind shear angle for the fast cases did not coincide. The consistency between the vortex tilt angle and vertical wind shear angle of the slow cases was higher than that of the fast cases (Figure 8). However, there were many hours when the vortex tilt angle and vertical wind shear angle of the slow cases were inconsistent (Figure 8B). Additionally, Rappin and Nolan (2012) also suggested that the environment where the mean surface wind and shear were counter-aligned was conducive to a large vortex tilt. Figure 1 also shows the directions of the low-level winds and vertical wind shear between the mid and low levels for different TDs. Not all the TDs in the slow cases were in the environment where the low-level winds and vertical wind shear were counter-aligned. To sum up, the magnitude and orientation of vertical wind shear between the mid and low levels cannot fully determine the vertical misalignment of a TD during its development. The sustaining larger misalignment in the slow cases was not due to the magnitude or orientation of vertical wind shear.
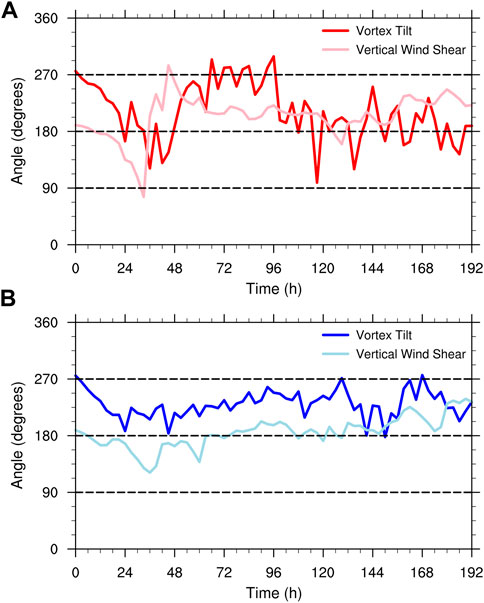
FIGURE 8. Time evolutions of the composited vortex tilt angle and 5.5–1.5 km vertical wind shear angle for the (A) fast and (B) slow cases. The vortex tilt was the distance between 5.0-km and 1.5-km circulation centers. The vertical wind shear angle was calculated based on the averaged vertical wind shear over an 810 km × 810 km box.
As a matter of fact, the vertical misalignment was directly correlated to inconsistent translation speeds between the circulation centers at mid and low levels. Figure 5B shows the composited differences in translation speeds of the circulation centers at 5.0-km and 1.5-km altitudes and the maximum and minimum values of the differences in mid- and low-level translation speeds for the fast and slow cases. Considering that the differences in translation speeds had positive and negative values that can lead to neutralization of each other, the composited differences were calculated as averages of the absolute values of the translation speed differences. As for the fast cases, the differences in the translation speeds between the mid-and low-level circulation centers showed a declining trend and finally got closer to zero (Figure 5B), which was in accordance with the evolution of the vertical misalignment (Figure 5A). In the slow cases, the large differences in the translation speeds during the period between 48 h and 120 h continued to hold for a long time and then began to decrease (Figure 5B). It was consistent with the persistent larger vertical misalignment between 48 h and 120 h and the following decrease of the vertical misalignment during the period approaching TC formation (Figure 5A).
Figures 9A,B show the composited translation speeds of the circulation centers at 1.5-km and 5.0-km altitudes. At the initial time, the composited translation speed of the mid-level circulation center was not equal to that of the low-level circulation center (Figures 9A,B). For the fast cases, the differences in the translation speeds between the mid-and low-level circulation centers decreased with time, consistent with the decreasing vertical misalignment (Figures 6B, 9A). Different from the fast cases, these differences in the slow cases reduced since 72 h, but followed by a short increase between 96 h and 108 h, and finally became small after 108 h. The sustaining large differences in the mid-and low-level translation speeds caused the maintenance of the large vertical misalignment in the slow cases.
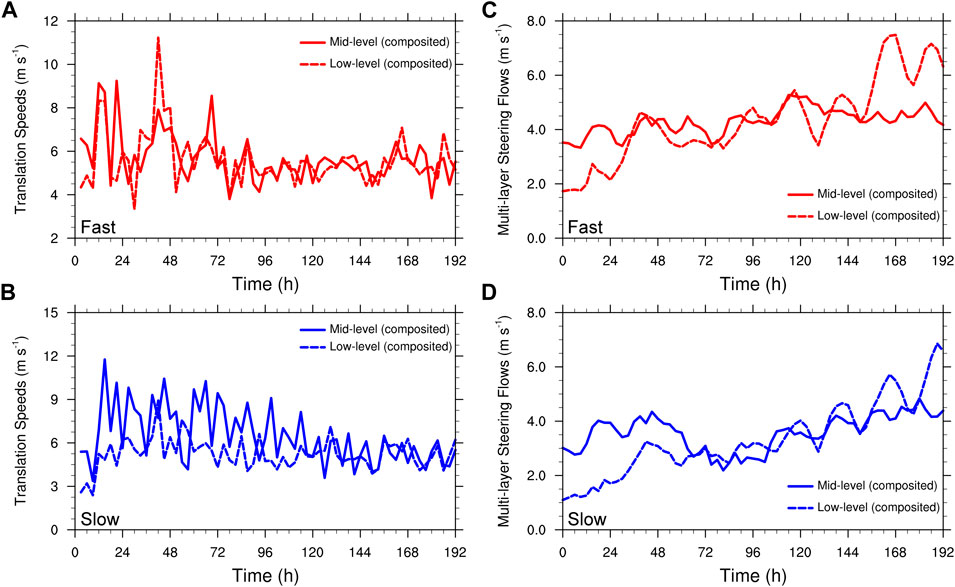
FIGURE 9. (A,B) The composited translation speeds of the circulation centers at 1.5-km and 5.0-km altitudes, and (C,D) the composited multi-layer steering flows of the circulation centers at 1.5-km and 5.0-km altitudes averaged over an 810 km × 810 km box. The red and blue lines indicate the fast and slow cases, respectively.
The translation speed of the circulation center was influenced by the environmental steering flows. Figures 9C,D show the composited steering flows for the circulation centers at 1.5-km and 5.0-km altitudes. In this study, the composited environmental multi-layer steering flows of the circulation centers for 5.0-km and 1.5-km altitude circulation centers averaged within an 810 × 810 km box were calculated. The steering flows for the low-level circulation centers were altitude-weighted averages of the winds around the low-level circulation center between 0.25-km and 2.75-km altitudes while those for the mid-level circulation centers were altitude-weighted averages of the winds around the mid-level circulation center but between 3.75-km and 6.5-km altitudes. Both altitude-weighted averages included 11 levels. The depth of the steering flows was chosen based on the vertical extension of the mid- and low-level circulations. As shown by Figure 9C, same as the composited translation speeds, the composited mid-level steering flows were faster than the composited low-level ones. The low-level steering flows of the fast cases caught up with the mid-level steering flows sooner than those of the slow cases. The discrepancy in the steering flows between the mid and low levels of the slow cases lasted for a longer time, which led to similar differences in the translation speeds of the slow cases. It should be noted that the steering flows were smaller than the translation speeds, which suggests the steering flows cannot fully explain the inconsistency of the translation speed of the mid-and low-level circulation centers.
5 Environmental influence and other factors
As mentioned before, the influence of environmental conditions is important for the development of TDs. In Section 3, it is found that there was no strong connection between initial environmental conditions and TC formation timing. However, the environmental conditions of the TDs were very likely to change since they moved during the TC formation process. The influence of environmental factors around each TD center during its developing process should also be considered. It is noted that only the environmental conditions before the first TC formed were considered to exclude the influence of the TCs that had already formed on the composited environmental conditions. The composited environmental relative vorticity, divergence, relative humidity, and total vertical wind shear around the TD centers averaged over an 810 km × 810 km box within the monsoon trough within the first 60 h were examined for the fast and slow cases.
During the first 60 h, the monsoon trough provided a deep layer of environmental positive relative vorticity which reached the maximum at 1.5-km altitude, mid- and low-level relative humidities which were higher than 70%, and upper-level divergence accompanied with intense upward motions for the fast cases (Figures 10A,B). For the slow cases, the environmental composited relative vorticities in the lower and middle troposphere were weaker than those for the fast ones (Figure 10C). But the mid-and low-level relative humidities of the slow cases were higher than those of the fast cases. During the first 18 h and the period between 30 h and 60 h, the fast cases had stronger upper-level divergences and more intense upward motions than the slow cases did (Figures 10B,D). Stronger upper-level divergences of the slow cases can be found between 18 h and 36 h, which were accompanied with the later but more intense upward motions.
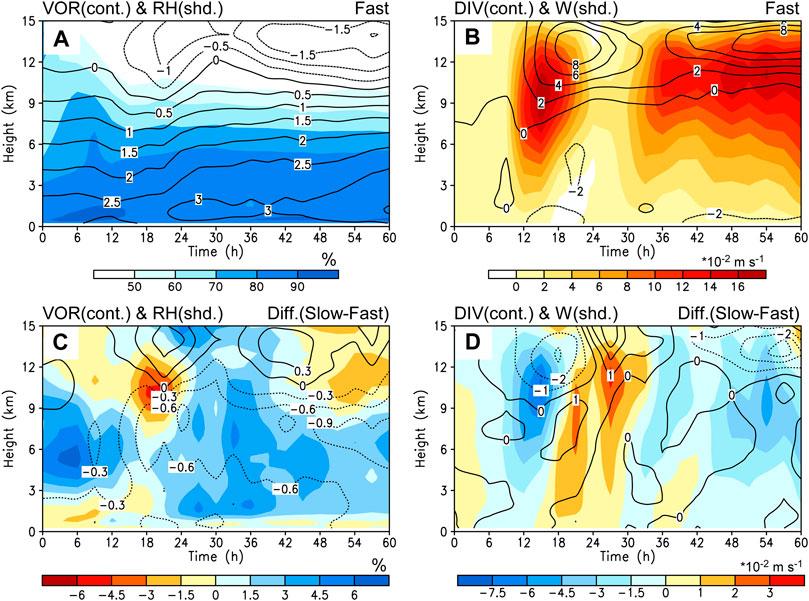
FIGURE 10. Time-height diagrams of the composited variables during the first 60 h for the fast cases (top) and the differences between slow and fast cases (bottom): (A,C) the relative vorticity (contour, 10−5 s−1) and relative humidity (shaded, %) averaged over an 810 km × 810 km box; (B,D) the divergence (contour, 10−5 s−1) averaged over an 810 km × 810 km box and vertical velocity (shaded, 10−2 m s−1) averaged over a 396 km × 396 km box.
Figure 7B shows the evolutions of the composited magnitudes of total vertical wind shear around the TD centers within a radius of 405 km between 12-km and 1.5-km altitudes for the fast and slow cases. The composited magnitude of deep vertical wind shear for the fast cases was smaller than those for the slow cases initially, but larger than those for the slow cases after 12 h. And then they were again smaller than those for the slow cases between 24 h and 36 h. Since 36 h, the differences in the total vertical wind shear between the fast and slow cases were small.
It is known that larger low-level positive relative vorticity, higher mid- and low-level relative humidities, stronger upper-level divergence, and weaker total vertical wind shear are more favorable for TC formation. Based on the above analysis, not all the environmental conditions of the fast cases were more favorable than those of the slow cases before the first TC formed. The slow cases had higher mid- and low-level environmental relative humidities while the fast cases had more intense mid- and low-level relative vorticities. And some environmental conditions of the fast cases were not always more favorable than those of the slow cases. The vertical wind shear and upper-level divergence of the slow cases sometimes were more favorable for TC formation. Overall, the environmental conditions during the TC formation process were not closely related to TC formation timing.
It is found that the evolutions of the circulations in the neighborhood of the TDs within the monsoon trough were different. Figure 11 shows the composited wind fields at 1.5-km altitude for the fast and slow cases at different times. Until the time that the latest TD of the fast cases developed into a TC, the composited wind fields of the fast cases showed that there was no obvious anticyclone in the downstream of the TD (Figures 11A–C). It indicates that there were no strong energy dispersions of the TDs of the fast cases. In contrast, anticyclones can be found in the downstream of the TDs of the slow cases, and they intensified with time, which indicates stronger energy dispersions of the TDs of the slow cases (Figures 11E,F). The stronger energy dispersion of the TDs in the slow cases may postpone the intensification of the TDs.
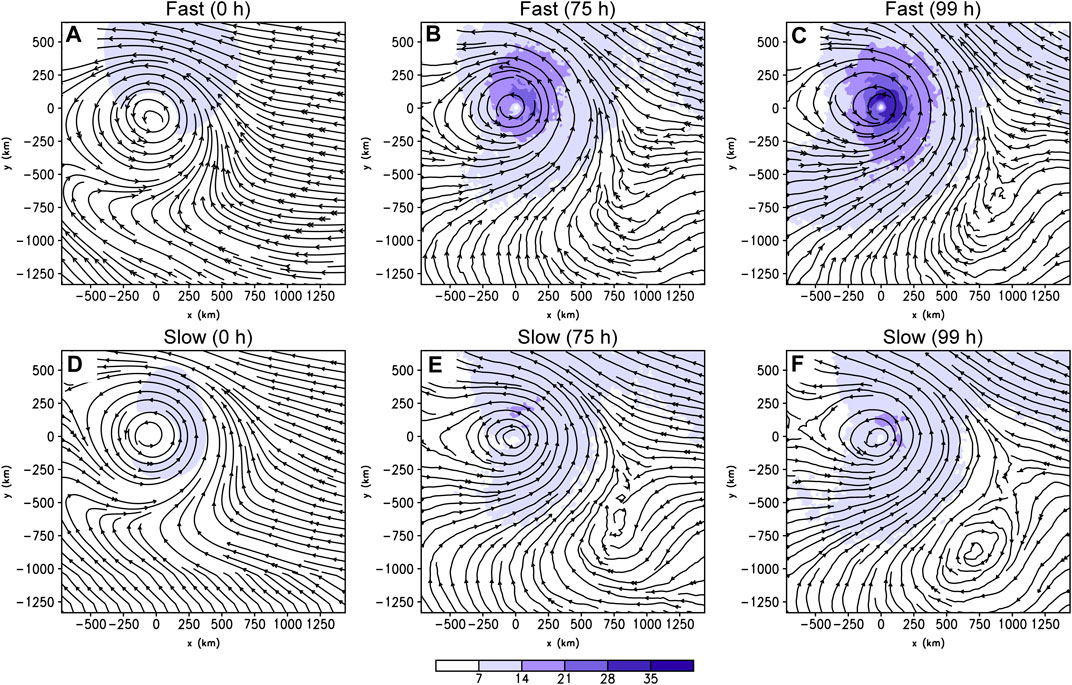
FIGURE 11. The composited wind fields at 1.5-km altitude at 0 h, 75 h, and 99 h. (A–C) indicate the fast cases while (D–F) indicate the slow cases. The position of (0,0) indicates the tropical disturbance (tropical cyclone later for the fast cases) center.
Additionally, TDs within the monsoon trough are likely to be affected by the terrain of the Philippine Islands. As shown by Figure 1B, the TDs of the fast cases did not cross over the Philippine Islands before they developed into TCs. Though most of the TDs of the slow cases did cross over the island before they developed into TCs, the time when they approached the Philippine Islands was already later than the TC formation timing of the faster cases. The crossing over the island of the TDs may put a brake on the intensifications of the TDs, but the influence played a part in the later stage of TC formation. The terrain effects were not the main cause for the delay of TC formation.
6 Comparisons of the development between TD02 and TD03
TD02 initialized at (6°N, 145°E) and TD03 initialized at (5°N, 145°E) had a great difference in the TC formation timing. It is of interest to investigate why a one-degree difference could cause a difference in the development time of 75 h. Since the initial locations of the TDs are quite close to each other, the environmental conditions around the two TD centers were similar. As shown by Table 1, the differences in the averaged low-level absolute vorticity, total vertical wind shear, mid- and low-level averaged relative humidity, and upper-level divergence around the TD centers between the two TDs were small. The enhancements of the symmetric azimuthal winds and relative vorticity induced by the monsoon trough were almost the same. Moreover, the initial vertical misalignments of the two TDs caused by the monsoon trough were also of little difference. Additionally, same as TD02, TD03 did not cross over the Philippine Islands before they developed into TCs. No effects of the island terrain were on the development of two TDs.
Although there was little difference in the environmental conditions and the initial vertical structures of the two TDs, the subsequent variations of the distances between the circulation centers of the TDs at 1.5-km and 5.0-km altitudes showed an unignorable difference. No persistent large vertical misalignment can be found during the development of TD02 while a period of increasing vertical misalignment can be found during the development of TD03. Figure 12 shows the distances between the circulation centers at 1.5-km and 5.0-km altitudes and the equivalent radar reflectivity factors at 4.5-km altitude for them. The circulation centers of TD02 tended to be vertically aligned as the distance was shortened (Figures 12A,B), while the distance between the circulation centers of TD03 changed little between 66 h and 75 h (Figures 12C,D). The equivalent radar reflectivity factors of TD02 show that the convections were more intense and concentrated near the TD center while those of TD03 showed that the convections were weaker and more outward from the TD center. The large vertical misalignment did not facilitate the development of the convections and concentrations of the convections toward the TD center.
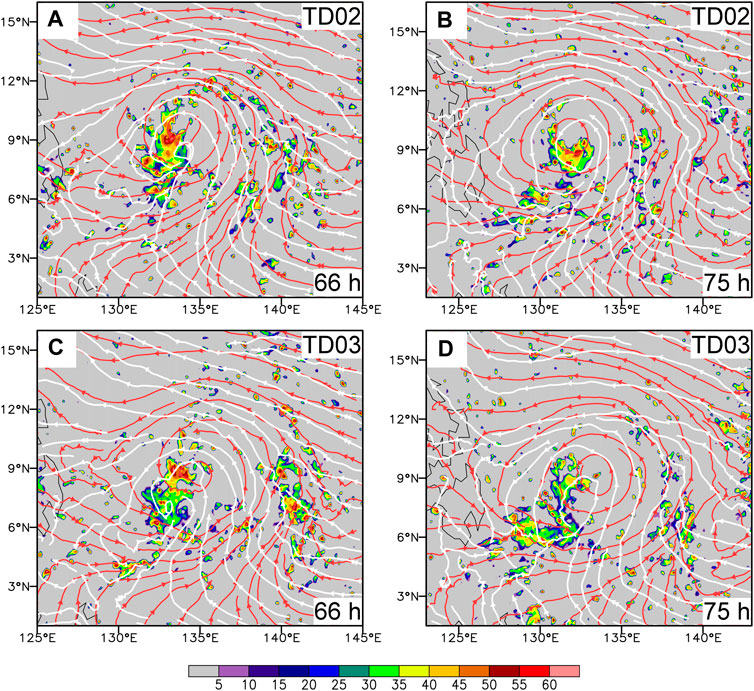
FIGURE 12. 1.5-km (red streamlines) and 5.0-km (white streamlines) wind fields and equivalent radar reflectivity factors at 4.5-km altitude (shaded, dBZ) of TD02 (A,B) and TD03 (C,D) at 66 h and 75 h, respectively.
7 Summary
In this study, the development of TDs placed in different locations of the same monsoon trough factors was examined to investigate the factors that influence the TC formation timing within a monsoon trough. Each simulated TD had the same symmetric structure and intensity at the initial time. The monsoon trough as a background providing favorable environmental conditions for TC formation was obtained from the climatological monsoon trough based on the observations. All the TDs developed into TCs and most of them formed in the monsoon shear region, which is consistent with the observations. The development time of TDs within the monsoon trough ranged from 60 h to 189 h. Based on the development time of the TD within a quiescent background, the developing TDs within the monsoon trough were divided into fast and slow cases.
The vertical misalignment between the mid-and low-level circulation centers was closely related to the timing of TC formation within the monsoon trough. The vertical misalignment ranged from 0 to 5°. The mid-and low-level circulation centers tended to be vertically aligned as TC formation time approached. The TDs of the slow cases had larger vertical alignments than those of the fast cases during the TC formation process. The sustaining larger vertical misalignment caused the delay of the TC formation timing. Rappin and Nolan (2012) suggested that vertical misalignment depended on vertical wind shear and vortex tilt and vertical wind shear had a consistent relationship. However, in our study, the time evolutions of the magnitude and angle of vertical misalignment did not coincide with those of the magnitude or angle of vertical wind shear. The magnitude and orientation of vertical wind shear between the mid and low levels cannot fully determine the vertical misalignment of a TD during its development. The vertical misalignment in this study came from the inconsistency of the translation speeds of the mid- and low-level circulation centers. The numerical study of Schecter and Menelaou (2020) suggested that vertical misalignment can exist in the shear-free environment of tropical cyclogenesis. It is possible that vertical misalignment in this study did not entirely depend on vertical wind shear. The steering flows for the mid- and low-level circulation centers were much weaker than the translation speeds. This suggests that there may be effects of other factors such as the effect of diabatic heating on translation speed.
The environmental conditions for the fast and slow cases indicated that not all the environmental conditions of the fast cases were more favorable than those of the slow cases. There was no strong connection between environmental conditions and TC formation timing. And some environmental conditions of the fast cases were not always more favorable than those of the slow cases. The stronger composited Rossby energy dispersions of the TDs in the slow cases indicated that the strong energy dispersion may postpone the intensification of the TDs. Additionally, the crossing over of the Philippine Islands only took effect in the later stage of TC formation of the slow cases when TDs in these cases had already developed more slowly than those in the fast cases. Hence, the energy dispersions and terrain effects were not the main cause for the delay of the TC formation timing.
Our study suggests that vertical misalignment is an important factor that affects the timing of TC formation within a similar environment. The persistent large vertical misalignment would prolong the TC formation time. It is suggested that the improvement in the observations of the mid-and low-level circulation centers of the TDs will help improve the prediction of the timing of TC formation within a similar favorable environment. Although we found that vertical misalignment played an important role in the TC formation timing within a similar environment, the underlying causes for vertical misalignment or the inconsistency of the translation speed between the mid- and low-level circulation centers still require further thorough investigations. In addition, for TDs within different environments, whether vertical misalignment is still an important factor in TC formation timing or not deserves further study.
Data availability statement
The raw data supporting the conclusion of this article will be made available by the authors, without undue reservation.
Author contributions
HZ and LW conducted analysis and writing. HZ conducted the numerical experiments and figures included in this manuscript.
Funding
This study was jointly supported by the National Natural Science Foundation of China (Grant No. 41705040, Grant No. 42150710531, and Grant No. 42192551), and the Natural Science Foundation of Jiangsu Province, China (Grant No. BK20170949). The numerical calculations in this paper have been done on the supercomputing system in the Supercomputing Center of Nanjing University of Information Science & Technology.
Conflict of interest
The authors declare that the research was conducted in the absence of any commercial or financial relationships that could be construed as a potential conflict of interest.
Publisher’s note
All claims expressed in this article are solely those of the authors and do not necessarily represent those of their affiliated organizations, or those of the publisher, the editors and the reviewers. Any product that may be evaluated in this article, or claim that may be made by its manufacturer, is not guaranteed or endorsed by the publisher.
References
Briegel, L. M., and Frank, W. M. (1997). Large-scale influences on tropical cyclogenesis in the western north Pacific. Mon. Wea. Rev. 125, 1397–1413. doi:10.1175/1520-0493(1997)125<1397:lsiotc>2.0.co;2v
Chen, T.-C., and Weng, S.-P. (1998). Interannual variation of the summer synoptic-scale disturbance activity in the western tropical pacific. Mon. Wea. Rev. 126, 1725–1733. doi:10.1175/1520-0493(1998)126<1725:ivotss>2.0.co;2
Davis, C. A., and Ahijevych, D. A. (2012). Mesoscale Structural Evolution of Three Tropical Weather Systems Observed during PREDICT. J. Atmos. Sci. 69, 1284–1305. doi:10.1175/JAS-D-11-0225.1
Duchon, C. E. (1979). Lanczos filtering in one and two dimensions. J. Appl. Meteorol. Clim. 18, 1016–1022. doi:10.1175/1520-0450(1979)018<1016:lfioat>2.0.co;2
Dudhia, J. (1989). Numerical study of convection observed during the winter monsoon experiment using a mesoscale two-dimensional model. J. Atmos. Sci. 46, 3077–3107. doi:10.1175/1520-0469(1989)046<3077:nsocod>2.0.co;2
Fu, B., Peng, M. S., Li, T., and Stevens, D. E. (2012). Developing versus nondeveloping disturbances for tropical cyclone formation. Part II: Western north Pacific. Mon. Wea. Rev. 140, 1067–1080. doi:10.1175/2011mwr3618.1
Ge, X., Li, T., and Peng, M. S. (2013a). Tropical cyclone Genesis efficiency: Mid-Level Versus Bottom Vortex. J. Trop. Meteorol. 19, 197–213. doi:10.16555/j.1006-8775.2013.03.001
Ge, X., Li, T., and Peng, M. (2013b). Effects of vertical shears and midlevel dry air on tropical cyclone developments. J. Atmos. Sci. 70, 3859–3875. doi:10.1175/JAS-D-13-066.1
Gray, W. M., and Jacobson, R. W. (1977). Diurnal variation of deep cumulus convection. Mon. Wea. Rev. 105, 1171–1188. doi:10.1175/1520-0493(1977)105<1171:dvodcc>2.0.co;2
Gray, W. M. (1968). Global view of the origin of tropical disturbances and storms. Mon. Wea. Rev. 96, 669–700. doi:10.1175/1520-0493(1968)096<0669:gvotoo>2.0.co;2
Gray, W. M. (1975). Tropical cyclone genesis. Dept. of Atmospheric Science Paper, 232. Fort Collins, CO: Colorado State University, 121.
Gray, W. M. (1998). The formation of tropical cyclones. Meteorol. Atmos. Phys. 67, 37–69. doi:10.1007/BF01277501
Harr, P. A., and Wu, C. (2011). “Tropical cyclone characteristics and monsoon circulations,” in The global monsoon system: research and forecast (World Scientific), 357–372.
Hobgood, J. S. (1986). A possible mechanism for the diurnal oscillations of tropical cyclones. J. Atmos. Sci. 43, 2901–2922. doi:10.1175/1520-0469(1986)043<2901:apmftd>2.0.co;2
Hong, S.-Y., Dudhia, J., and Chen, S.-H. (2004). A revised approach to ice microphysical processes for the bulk parameterization of clouds and precipitation. Mon. Wea. Rev. 132, 103–120. doi:10.1175/1520-0493(2004)132<0103:aratim>2.0.co;2
Kain, J. S. (2004). The kain–fritsch convective parameterization: An update. J. App. Meteorol. 43, 170–181. doi:10.1175/1520-0450(2004)043<0170:tkcpau>2.0.co;2
Kerns, B. W., and Chen, S. S. (2013). Cloud clusters and tropical cyclogenesis: Developing and nondeveloping systems and their large-scale environment. Mon. Weather Rev. 141, 192–210. doi:10.1175/MWR-D-11-00239.1
Lim, K.-S. S., and Hong, S.-Y. (2010). Development of an effective double-moment cloud microphysics scheme with prognostic cloud condensation nuclei (CCN) for weather and climate models. Mon. Weather Rev. 138, 1587–1612. doi:10.1175/2009MWR2968.1
Melhauser, C., and Zhang, F. (2014). Diurnal radiation cycle impact on the pregenesis environment of hurricane karl (2010). J. Atmos. Sci. 71, 1241–1259. doi:10.1175/JAS-D-13-0116.1
Mlawer, E. J., Taubman, S. J., Brown, P. D., Iacono, M. J., and Clough, S. A. (1997). Radiative transfer for inhomogeneous atmospheres: RRTM, a validated correlated-k model for the longwave. J. Geophys. Res. 102, 16663–16682. doi:10.1029/97JD00237
Molinari, J., and Vollaro, D. (2013). What percentage of western North Pacific tropical cyclones form within the monsoon trough? Mon. Weather Rev. 141, 499–505. doi:10.1175/MWR-D-12-00165.1
Muller, C. J., and Romps, D. M. (2018). Acceleration of tropical cyclogenesis by self-aggregation feedbacks. Proc. Natl. Acad. Sci. U. S. A. 115, 2930–2935. doi:10.1073/pnas.1719967115
Nakanishi, M., and Niino, H. (2006). An improved mellor–yamada level-3 model: Its numerical stability and application to a regional prediction of advection fog. Bound. Layer. Meteorol. 119, 397–407. doi:10.1007/s10546-005-9030-8
Nicholls, M. E., and Montgomery, M. T. (2013). An examination of two pathways to tropical cyclogenesis occurring in idealized simulations with a cloud-resolving numerical model. Atmos. Chem. Phys. 13, 5999–6022. doi:10.5194/acp-13-5999-2013
Nicholls, M. E. (2015). An investigation of how radiation may cause accelerated rates of tropical cyclogenesis and diurnal cycles of convective activity. Atmos. Chem. Phys. 15, 9003–9029. doi:10.5194/acp-15-9003-2015
Peng, M. S., Fu, B., Li, T., and Stevens, D. E. (2012). Developing versus nondeveloping disturbances for tropical cyclone formation. Part I: North atlantic. Mon. Wea. Rev. 140, 1047–1066. doi:10.1175/2011MWR3617.1
Rappin, E. D., and Nolan, D. S. (2012). The effect of vertical shear orientation on tropical cyclogenesis. Q. J. R. Meteorol. Soc. 138, 1035–1054. doi:10.1002/qj.977
Ritchie, E. A., and Holland, G. J. (1999). Large-scale patterns associated with tropical cyclogenesis in the western pacific. Mon. Wea. Rev. 127, 2027–2043. doi:10.1175/1520-0493(1999)127<2027:lspawt>2.0.co;2
Ruppert, J. H., Wing, A. A., Tang, X., and Duran, E. L. (2020). The critical role of cloud-infrared radiation feedback in tropical cyclone development. Proc. Natl. Acad. Sci. U. S. A. 117, 27884–27892. doi:10.1073/pnas.2013584117
Schecter, D. A., and Menelaou, K. (2020). Development of a misaligned tropical cyclone. J. Atmos. Sci. 77, 79–111. doi:10.1175/JAS-D-19-0074.1
Skamarock, W., Klemp, J., Dudhia, J., Gill, D., Barker, D., Duda, M., et al. (2008). A Description of the Advanced Research WRF Version 3. No. NCAR/TN-475+STR. Boulder, CO: University Corporation for Atmospheric Research. doi:10.5065/D68S4MVH
Smith, W. P., Nicholls, M. E., and Pielke, R. A. (2020). The role of radiation in accelerating tropical cyclogenesis in idealized simulations. J. Atmos. Sci. 77, 1261–1277. doi:10.1175/JAS-D-19-0044.1
Tao, D., and Zhang, F. (2014). Effect of environmental shear, sea-surface temperature, and ambient moisture on the formation and predictability of tropical cyclones: An ensemble-mean perspective. J. Adv. Model. Earth Syst. 6, 384–404. doi:10.1002/2014MS000314
Tao, W.-K., Lang, S., Simpson, J., Sui, C.-H., Ferrier, B., and Chou, M.-D. (1996). Mechanisms of cloud-radiation interaction in the tropics and midlatitudes. J. Atmos. Sci. 53, 2624–2651. doi:10.1175/1520-0469(1996)053<2624:mocrii>2.0.co;2
Teng, H.-F., Done, J. M., Lee, C.-S., Hsu, H.-H., and Kuo, Y.-H. (2020). Large-scale environmental influences on tropical cyclone formation processes and development time. J. Clim. 33, 9763–9782. doi:10.1175/JCLI-D-19-0709.1
Wang, B., and Murakami, H. (2020). Dynamic Genesis potential index for diagnosing present-day and future global tropical cyclone Genesis. Environ. Res. Lett. 15, 114008. doi:10.1088/1748-9326/abbb01
Yang, B., and Tan, Z.-M. (2020). Interactive radiation accelerates the intensification of the midlevel vortex for tropical cyclogenesis. J. Atmos. Sci. 77, 4051–4065. doi:10.1175/JAS-D-20-0094.1
Yang, B., Nie, J., and Tan, Z.-M. (2021). Radiation feedback accelerates the formation of typhoon haiyan (2013): The critical role of mid-level circulation. Geophys. Res. Lett. 48, e2021GL094168. doi:10.1029/2021GL094168
Zong, H., and Wu, L. (2015a). Re-examination of tropical cyclone formation in monsoon troughs over the Western North Pacific. Adv. Atmos. Sci. 32, 924–934. doi:10.1007/s00376-014-4115-2
Keywords: tropical cyclone formation timing, tropical disturbance, development time, vertical misalignment, monsoon trough
Citation: Zong H and Wu L (2023) What affects the timing of tropical cyclone formation within a monsoon trough?. Front. Earth Sci. 10:1046107. doi: 10.3389/feart.2022.1046107
Received: 16 September 2022; Accepted: 22 November 2022;
Published: 17 January 2023.
Edited by:
Wei Zhang, Utah State University, United StatesReviewed by:
Kelvin T. F. Chan, Sun Yat-sen University, ChinaChanh Kieu, Indiana University, United States
Copyright © 2023 Zong and Wu. This is an open-access article distributed under the terms of the Creative Commons Attribution License (CC BY). The use, distribution or reproduction in other forums is permitted, provided the original author(s) and the copyright owner(s) are credited and that the original publication in this journal is cited, in accordance with accepted academic practice. No use, distribution or reproduction is permitted which does not comply with these terms.
*Correspondence: Huijun Zong, huijun@nuist.edu.cn