Quantitative interpretation of coal industrial components using a gray system and geophysical logging data: A case study from the Qinshui Basin, China
 Jianhong Guo
 Zhansong Zhang1*
  Linqi Zhu
- 1Key Laboratory of Exploration Technologies for Oil and Gas Resources, Ministry of Education, Yangtze University, Wuhan, China
- 2Research Institute of Exploration & Development, Sinopec Jianghan Oilfeld Company, Wuhan, China
- 3Institute of Deep-Sea Science and Engineering, Chinese Academy of Sciences, Sanya, China
- 4Hubei Institute of Hydrogeology and Engineering Geology, Jingzhou, China
The content of industrial components of coalbeds, one of the main parameters of coalbed methane (CBM) reservoirs, is crucial in the entire coal mine resource exploration and exploitation process. Currently, using geophysical logging data to determine the content of industrial components is the most widely implemented method. In this study, the PZ block in the Qinshui Basin was employed as a target block to evaluate ash (Aad), fixed carbon (FCad), volatile matter (Vdaf), and moisture (Mad) under the air-dry (AD) base condition based on the autocorrelation between the geophysical logging curves and industrial component contents combined with the OBGM (1, N) model. The results indicate that 1) the geophysical logging curves combined with the OBGM (1, N) model can accurately predict the Aad and FCad contents and an increase in geophysical logging curve types can effectively improve the model performance, compared to using a single geophysical logging curve for prediction. 2) When predicting the Vdaf content, using the geophysical logging curves combined with Aad and FCad contents had the highest prediction accuracy. Further, prediction bias does not exist, compared to using only the geophysical logging curve or the autocorrelation between the industrial component contents. The entire evaluation process begins with an assessment of the Aad and FCad contents. Then, the Vdaf content was assessed using the content of these two industrial components combined with geophysical logging data. Finally, the Mad content was calculated using the volumetric model. Accurate application results were obtained for the verification of new wells, demonstrating the efficacy of the method and procedure described in this study. 3) The OBGM (1, N) model has the highest prediction accuracy compared with the multiple regression and GM (0, N) models, which have the same computational cost. The geophysical logging interpretation model of the proposed coalbed industrial component contents is simple to calculate and suitable for small samples, providing a new method for the evaluation process of industrial component contents.
1 Introduction
Currently, China is responsible for a significant proportion of coal production and consumption (Ward, 2016; Yang et al., 2018; He et al., 2020), in addition to having the highest coal sales worldwide (Gao et al., 2019). The Chinese government has made significant improvements toward the use of green coal resources (Jiang et al., 2010; Cai et al., 2011; Feng et al., 2020). With the current decline in conventional oil resources, the exploration and exploitation of unconventional oil and gas resources have become a research hotspot (Hamawand et al., 2013). Among them, coalbed methane (CBM) is a clean energy source (Palmer, 2010), and its exploration and exploitation is safer than conventional coal mining, in addition to producing less greenhouse gases (Karacan et al., 2011; Moore, 2012). Among coal quality parameters, the industrial components of coalbeds are crucial throughout the entire process of coal exploration and exploitation, mining, design, and processing (Feng et al., 2020). The industrial components of coalbeds can effectively evaluate the CBM content, whether they play a corrective role in the KIM or Langmuir coal order equations (Ahmed et al., 1991; Hawkins et al., 1992), or they directly use the industrial components of the coalbeds to predict the CBM content (Zhou and Guan, 2016; Zhou et al., 2015). Therefore, an accurate evaluation of the industrial components of coal quality is an important parameter that may lead to considerable economic benefits.
In an air-dry (AD) base state, coal industrial components contain ash (Aad), fixed carbon (FCad), volatile matter (Vdaf), and moisture (Mad). The simplest method of obtaining the content of each industrial component is to send coal samples from core boreholes to a laboratory for geochemical analysis (Shao et al., 2013; Roslin and Esterle, 2015), which is time-consuming and expensive, and the fragility of the CBM reservoirs during drilling limits the number of samples (Fu et al., 2009b; Wang et al., 2018). To solve this problem, several studies have proposed solutions; an example is using geophysical logging data, which has been widely employed worldwide, to evaluate the industrial component contents of coalbeds (Yegireddi and Bhaskar, 2009). Geophysical logging techniques have the advantage of being continuous and cost-effective as a reliable method for characterizing the variations in the physical properties of rocks at high resolution (Morin, 2005; Ghosh et al., 2014). By constructing a relationship between the geophysical logging data and industrial components, the variation curve of the industrial components in the CBM reservoirs can be predicted. Furthermore, this method can be extended to boreholes without coring samples but with the geophysical logging data, laying the foundation for subsequent mapping of the 2D contour distribution of industrial components and 3D refinement model (Zhou et al., 2015).
The evaluation of the coal industrial components quality has been promising. Initially, volumetric models and statistical analysis methods for the determination of coal quality were proposed by Bond and Mullen, respectively (Bond et al., 1971; Mullen, 1988); however, they could not be combined with geophysical logging data. Subsequently, Pan et al. analyzed the density logging response with a strong correlation to the Aad content and used this relationship to evaluate the industrial components of CBM reservoirs (Pan and Huang, 1998). It was then determined that the geophysical logging data are subject to multiple factors, the evaluation results of a single curve are not necessarily accurate, and multiple series of geophysical logging curves are more reliable in constructing a predictive model (Daniels et al., 1983; Chatterjee and Paul, 2013; Ghosh et al., 2014). With the development of mathematical methods, multiple regression (Zhang, 2013), machine learning (Zhou et al., 2016), and other methods have been gradually introduced to construct linear and nonlinear relationships between industrial components and geophysical logging curves. For example, (Liu et al., 2021) constructed linear relationships between the geophysical logging curves and industrial components and obtained promising results in the Qaidam Basin, whereas (Zhou and O'Brien, 2016) constructed relationships between the geophysical logging curves and multiple parameters, such as industrial components, using the Gaussian radial basis function (RBF) method, exhibiting the feasibility of a machine learning approach, and validated it in several studies. Similarly, methods such as fuzzy mathematics (Huang et al., 2020) have been applied to predict the contents of industrial components. However, it should be noted that these mathematical–statistical methods are based on a large sample size, and it is difficult to simplify them for small-sample datasets. The applicability of random forest and support vector machine methods, which are applicable to small-sample datasets, are also limited by the determination of hyperparameters and the uncertainty of the method.
Hence, this study applies the gray system OBGM (1, N) model, which is applicable to small-sample data, for predicting the industrial components of coal quality and evaluating the content of each industrial component in the PZ block based on geophysical logging data. The results indicate that using geophysical logging data combined with the OBGM (1, N) model can effectively predict the Aad and FCad contents. Further, using multiple logging curves can effectively improve the accuracy of industrial component predictions compared to using a single logging curve. This paper proposes a set of evaluation processes for industrial components applicable to the PZ block, considering the autocorrelation between the industrial component contents, and tests the model of this study using new wells, exhibiting the effectiveness of the proposed method.
2 Geological background
2.1 Overview of the study area
The PZ block is in the Qinshui Basin, Shanxi Province, China (Figure 1A), and started commercial production in 2016. The tectonics within the PZ block are dominated by near-north-south folds (Figures 1B,D), which occur in the form of backward-sloping intervals (small dip angles; mainly 5–15°; averaging <10°) (Xu et al., 2014). The No.3 and No.15 coal seams are the main coal seams for CBM exploration and exploitation (Figure 1C) (Lv et al., 2012). The No.3 coal seam is in the Shanxi Formation and is a shallow water deltaic sedimentary system with a stable thickness of 3.45–7.02 m and an average thickness of 5.74 m. The No.15 coal seam is in the Taiyuan Formation, which is a set of composite deposition systems of barrier wall lagoons and carbonate terraces. The swampy deposits developed on the barrier wall coast of the No.15 coal seam are stable, are 0.85–6.25 m thick, and have an average thickness of 2.62 m. From the analysis of the coal samples collected in the boreholes, the average vitrinite, inertinite, and exinite group contents of the coal samples from the No.3 coal seam were 75.14%, 20.61%, and 4.25%, respectively; the contents of the three microscopic components of the No.15 coal seam are 77.46%, 13.02%, and 9.53%, respectively, all of which are dominated by the specular group. The vitrinite reflectivity ranges within 3.18%–4.36% and 3.97%–4.25% for the No.3 and 15 coal seams, respectively, and are both anthracites in terms of thermal evolution.
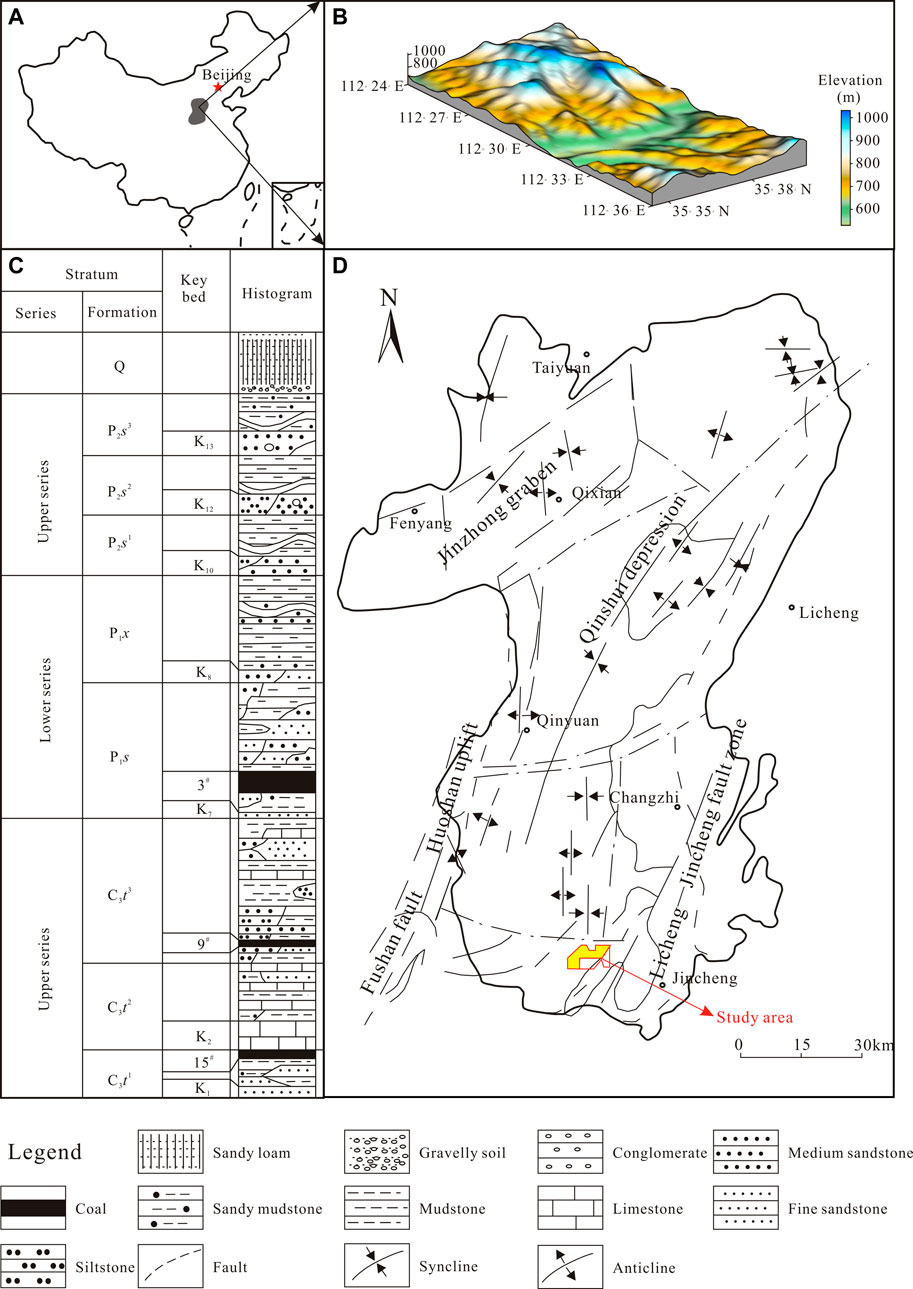
FIGURE 1. Schematic diagram of the PZ block in Qinshui Basin. (A) The location of the Qinshui Basin in China. (B) Geological schematic diagram of the PZ block. (C) Lithological column profile of the PZ block. (D) Schematic diagram of the location and geological structure of the study area.
2.2 Difficulties in the evaluation
As one of the oldest exploration and mining works in the PZ block, the number of boreholes with coring information is small. Seven parameter wells from the same batch were collected, and 59 sets of core coal samples, that met the experimental specifications and requirements, were collected. The bare-hole logging data only contained conventional logging curves; in the lithology logging series, caliper (CAL), natural gamma (GR), and spontaneous potential (SP) log curves were collected; in the resistivity logging series, there were deep lateral resistivity (RD) and shallow lateral resistivity (RS) log curves, and a few boreholes contained the flushed-zone resistivity (RXO) log curve; in the three-porosity logging series, compensation density (DEN), compensated neutron (CNL) and acoustic time difference (AC) log curves correlated, and there was no array acoustic or nuclear magnetic resonance (NMR) logging data. Compared to the later developed study blocks, the PZ block did not have a porosity logging curve with multiple source distances in the conventional series and no electric imaging logging series. Owing to the technological development at that time, the restricted core coal sampling, coupled with the lack of logging series, was difficult to upscale using data-driven machine learning methods. Therefore, this study used a gray system method applicable to small-sample datasets combined with geophysical logging data, to construct a coal quality industrial component prediction model.
3 Method principle
3.1 Gray static model GM (0, N)
The GM (0, N) model is a static model without derivatives, which is fundamentally different from the multiple linear regression model. The typical multiple linear regression model is based on the original data, whereas the GM (0, N) model is based on the new data series accumulated from the original data. The modeling form of the GM (0, N) model weakens the randomness among the original data (Zhang and Jiang, 2005; Zhu et al., 2012), increases data regularity, and requires a small amount of statistical data, which is more suitable for use in practical production.
Specifying
where
The static GM (0, N) model can construct the corresponding prediction model by least-squares fitting with the target accumulation sequence after completing the accumulation of the feature sequence. The predicted target sequence is then reduced (cumulative subtraction) to obtain the predictions.
3.2 OBGM (1, N) prediction model
Compared to the GM (0, N) model, the OBGM (1, N) model consists of first-order ordinary differential equations (Zeng et al., 2016; Zeng and Li, 2018). Here, assumptions must be made regarding the actual geophysical logging information, and it is clear from Figure 2 that the geophysical logging curve is a characterization of the physical properties of the formation rocks. During the geophysical logging data acquisition, the logging instrument is gradually lifted from the bottom to the wellhead, a process that can be viewed as a time series; that is, the actual response of the geophysical logging data reflects the physical properties of the measured rock, whereas the measurement time is another influencing factor. The response of each logging curve can then be affected by the coupling of rock physical property and time changes, and the response of the logging data is written as shown in Eq. 2:
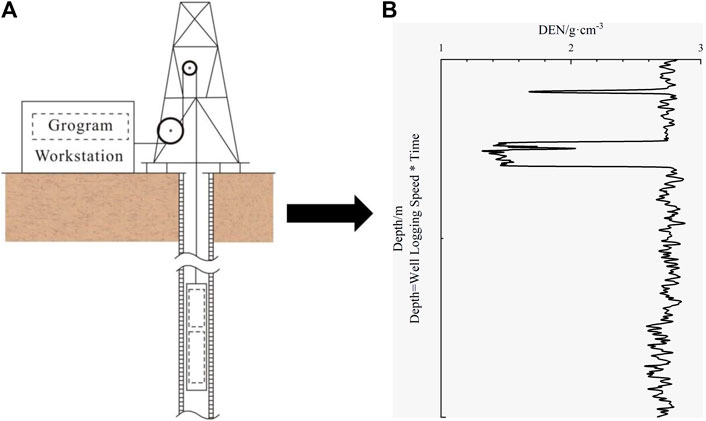
FIGURE 2. Geophysical logging data acquisition diagram. (A) Data collection process. (B) Schematic diagram of logging curves.
The OBGM (1, N) model is a simplified and improved model of the GM (1, 1) model in the case of N variables (geophysical logging curves), consisting of a system of N first-order ordinary differential equations, with each variable considered as a database of modeled system characteristics, and the system of equations for each variable forming the OBGM (1, N) model. The matrix transformation of Eq. 2 can be expressed as Eq. 3.
Adding the corresponding settable parameter column
The least-squares estimated parameter column of the OBGM (1, N) model can then be written as
where
The approximate time response equation corresponding to the OBGM (1, N) model is
In Eq. 7,
In this theory, there is a background value coefficient,
The parameters in Eq. 9 are expressed in a matrix as
In Eq. 10,
The OBGM (1, N) model is inexpensive to construct and does not require a significant number of calculations. Therefore, this study used geophysical logging curves as the basis for model construction, explored the effects of different curve numbers on the model, and recorded model performance for subsequent analysis.
4 Data preprocessing and quality checking
In this study, 59 sets of experimental samples were collected from wells PZ1–PZ7. The thickness of the CBM reservoirs was stable, and the industrial component determination method implemented industry standards: Aad, Mad, and Vdaf were determined by laboratory heating, and FCad was determined using the differential subtraction method.
During geophysical logging data processing, the depth of the core sample is normalized to avoid the effects of misalignment caused by the stretching of the drill pipe (Fu et al., 2009b), and the geophysical logging response values were normalized through dense layers on the coal seam to eliminate effects caused by the borehole environment and instrumentation. Simultaneously, this study investigated the dilation of the core drill hole in the PZ block and performed a dilation correction of the geophysical logging curve for the dilation section.
To verify the reliability of the experiments and pretreatment, correlation tests were performed on the samples. A significant correlation was observed when comparing the laboratory relative density on an air-dry basis (RDad) of the coal samples with the Aad contents (Figure 3A). The autocorrelation between the FCad and Aad contents was significant (Figure 3B), indicating the reliability of the sample experiment. As shown in Figure 3C, the PZ block dilation is not clear, and the box plot shows the CAL curve response values of each cored coal sample in the seven cored boreholes, by comparing the bit diameters (21.59 cm). The dilation rate of each borehole was determined to be within 15%; that is, the dilation correction was completed by fitting the logging response values of the undilated section to the dilated section by regression. After preprocessing was completed, the DEN curve response values also exhibited a significant correlation with the RDad content (Figure 3D) when comparing them (Zhou and O'Brien, 2016), indicating the reliability of the logging data in this study with the validity of the preprocessing. It should be noted that the actual corrected density logging response values differ from the laboratory apparent density, which is related to the actual formation envelope pressure, fracture conditions, and the effects of human correction.
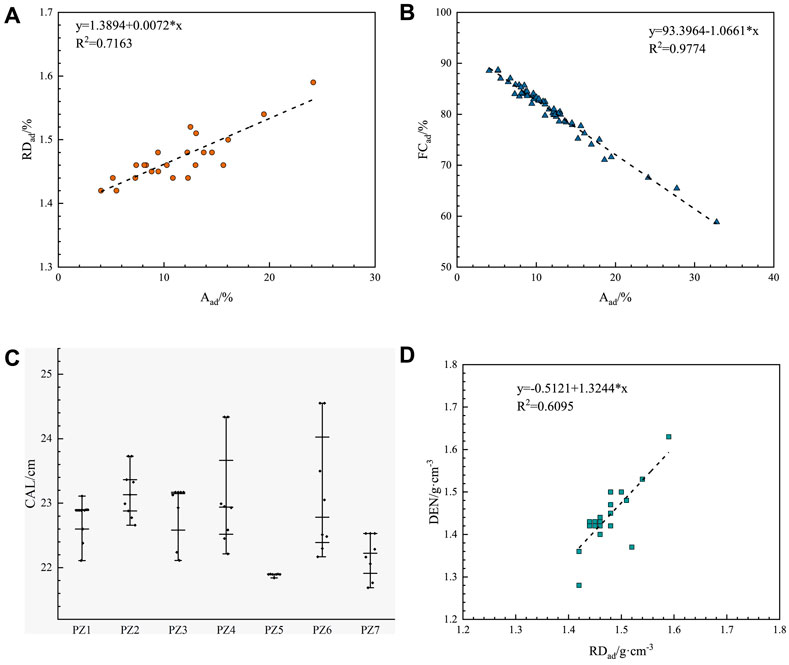
FIGURE 3. Pre-processing and quality checking of experimental data and geophysical logging processing of coal samples. (A) Correlation analysis plot of the Aad content and RDad. (B) Correlation analysis plot of the Aad content and the FCad content. (C) Dilation of core drilling. (D) Correlation analysis of the pre-processed DEN curve response values with the RDad of the laboratory coal samples.
5 Results
Pearson index analysis was performed using the geophysical logging data with the coalbed industrial component contents to identify geophysical logging curves that are sensitive to the industrial component contents (Table 1). The feasibility of using geophysical logging data to predict the industrial component contents has been confirmed in previous studies (Shao et al., 2013; Ghosh et al., 2016). Multiple logging curves are more reliable to predict the contents of the industrial components than using only the DEN curve (Zhou and O'Brien, 2016). Correlation analysis revealed significant correlations between the industrial component contents, the Aad content correlated significantly with the FCad content, and both correlated with the Vdaf content. The Aad content, as an industrial component, correlated significantly with other industrial component contents, and is typically the first to be evaluated (Liu et al., 2021).
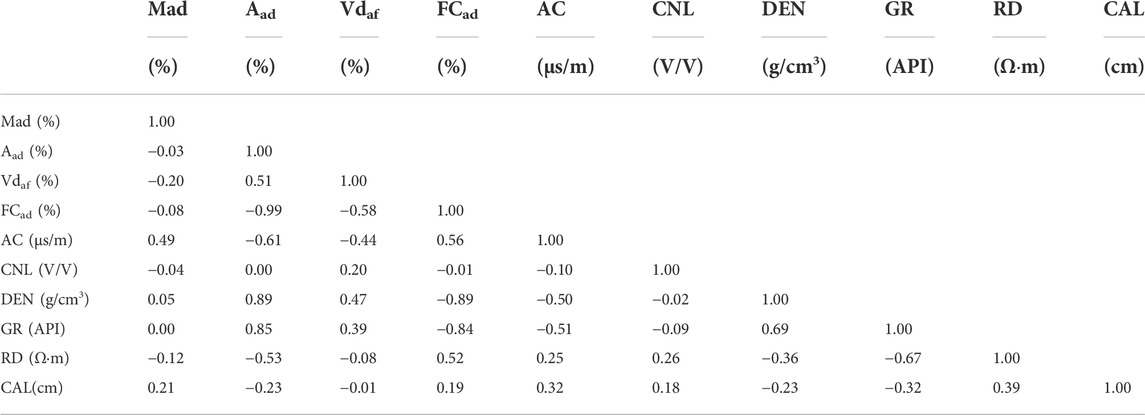
TABLE 1. The Pearson index analysis of the response values of the industrial components and the geophysical logging curves of coalbeds in the PZ block.
5.1 Evaluation prediction of Aad
Ash yield is vital, and the effect of the Aad content on the porosity and CBM content has been proven previously (Li et al., 2007; Zhou and Guan, 2016). The experimental Aad content in the study block ranged from 4.05% to 32.78%, with an average value of 11.8%. The correlation between each logging series and Aad content was plotted in this study (Figure 4). The correlation between the Aad content and the response values of the four curves (DEN, GR, AC, and RD) was outstanding, in which the Aad content correlated significantly with the response values of DEN and GR (Figures 4A,B). The coalbeds are not radioactive; thus, the response values of the GR curves are low, and their radioactivity mainly originates from clay minerals during coal formation (Shao et al., 2013; Liu et al., 2021), indicating that in addition to the DEN curve, the GR curve can also be an important curve for predicting Aad content. In addition, the response values of the AC curve and the logarithmically processed RD also exhibit slight correlation with the Aad content (Figures 4C,D); however, the correlation was weaker than that of GR and DEN, the correlation between the CAL curve and Aad content was insignificant, and the response of the CNL curve exhibited almost no correlation with the Aad content (Figures 4E,F). The Aad content exhibited a negative correlation with the FCad content. Shi et al. (2020) showed that in high-rank coals, for different coal structures, the vitrinite content of tectonic coals is significantly higher than that of undeformed coals, subjecting the different brittle coal rocks to different destructive effects. Different coal structures provide different adsorption areas for CBM, which slightly increases the gas content of tectonic coals overall; this has been verified by the analysis of deep coal in the Jiaozuo Coalfield (Hou et al., 2017). Similarly, Hou H. H et al. (2021), Hou et al. (2019) showed that coal seams with high vitrinite content and low ash yield contain higher gas contents. These combined factors led to an increase in the response values of the AC curve corresponding to the coalbed sections with respect to the RD curve (Fu et al., 2009a; Ren et al., 2018). Although the response of the RD curve is controlled by various factors (Hou H. H et al., 2021; Zhu et al., 2021, 2022), there is some correlation with the data. The analysis of this correlation was confirmed in the SZB block adjacent to the PZ block, indicating that the content of Aad correlates with the response values of the AC and RD curves.
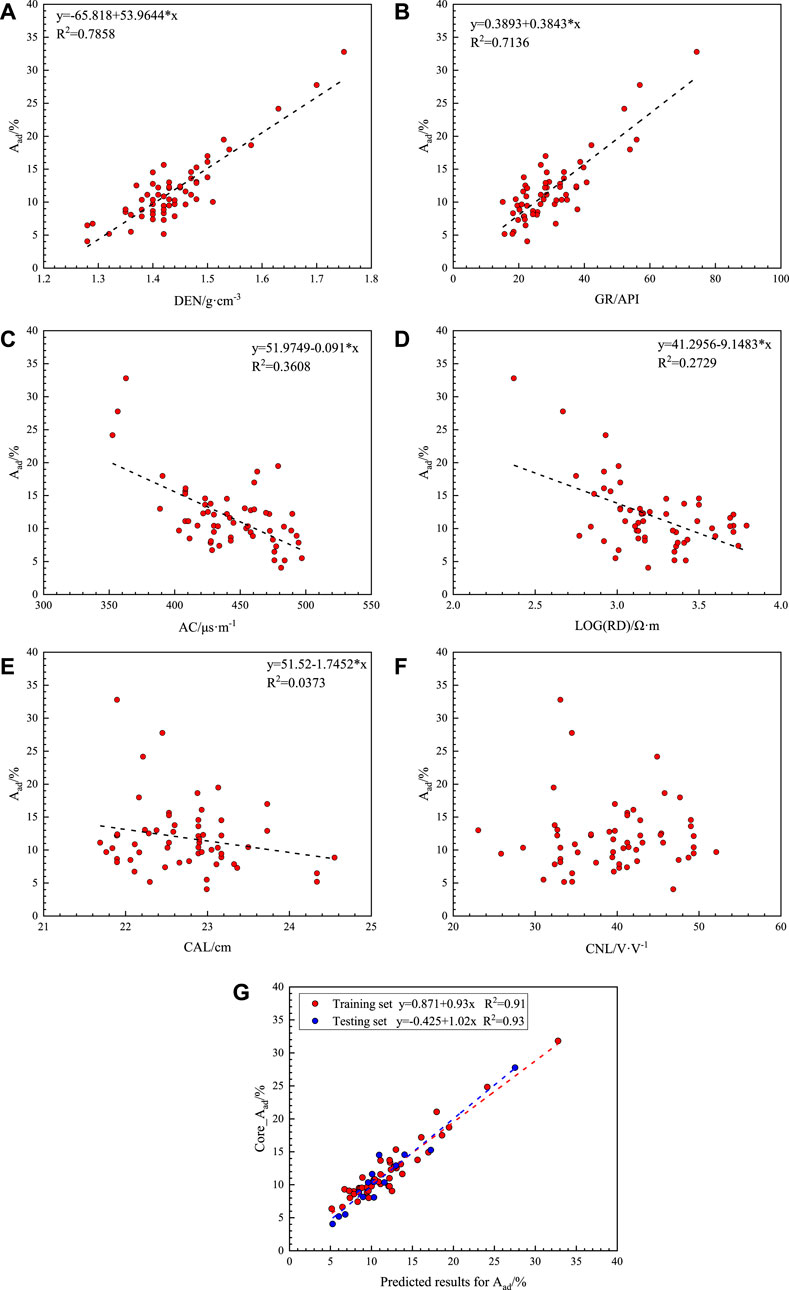
FIGURE 4. Correlation analysis of the Aad content and the geophysical logging data response with the predicted results of the Aad content. (A) Relationship between the Aad content and DEN. (B) Relationship between the Aad content and GR. (C) Relationship between the Aad content and AC. (D) Relationship between the Aad content and RD. (E) Relationship between the Aad content and CAL. (F) Relationship between the Aad content and CNL. (G) Performance of the OBGM (1, 5) prediction model on the training and test sets for the Aad content.
Analyzing Figure 4 and Table 1, the geophysical logging curves sensitive to the Aad content were determined, and the OBGM (1, N) model was used to predict the Aad content. A total of 59 groups of coal seam industrial components were collected, and 15 groups of Aad contents were randomly selected as the test dataset to verify the effect of the model.
While constructing the prediction model for the Aad content, the effect of the number of geophysical logging curves on the model was analyzed by increasing the number of geophysical logging curves. Table 2 presents the results and lists the training dataset and prediction effects of the test dataset involved in the construction of the model. The first column in Tables 2–4 show the combination of the cumulative curves, which gradually increased from 1. The second column shows the average relative error results of the back-judgments of the datasets involved in the construction of the prediction model, and the third to fifth columns show the test results of the randomly selected datasets, which were not involved in the model construction, showing the average relative, minimum relative, and maximum relative errors, respectively; the sixth to ninth columns show the parameters. That is, the parameter matrix demonstrated in Eq. 10 (bN, a, c, and d), correspond to the parameters in Eq. 9. Table 2 shows the prediction and evaluation results of the Aad content. With an increase in the number of geophysical logging curves, the relative error of both the training and test datasets decreased and stabilized when there were five geophysical logging curves. Because the response value of the CNL curve has almost no correlation with the content of Aad, the Aad content can be effectively predicted by using five logging curves (i.e., DEN, GR, AC, RD, and CAL). Currently, the average relative error of the test dataset of the Aad content was 12.42%, and the minimum relative error was 0.76%. The maximum relative error was 30.11%, which is the lowest value in each combination curve. Figure 4G shows the rendezvous diagram of the training and test datasets corresponding to the Aad content. It was determined that the model in this study effectively predicted Aad content, and the model had no deviation. The high correlation between the prediction and experimental results in the training and test data also proves the effectiveness of the model.
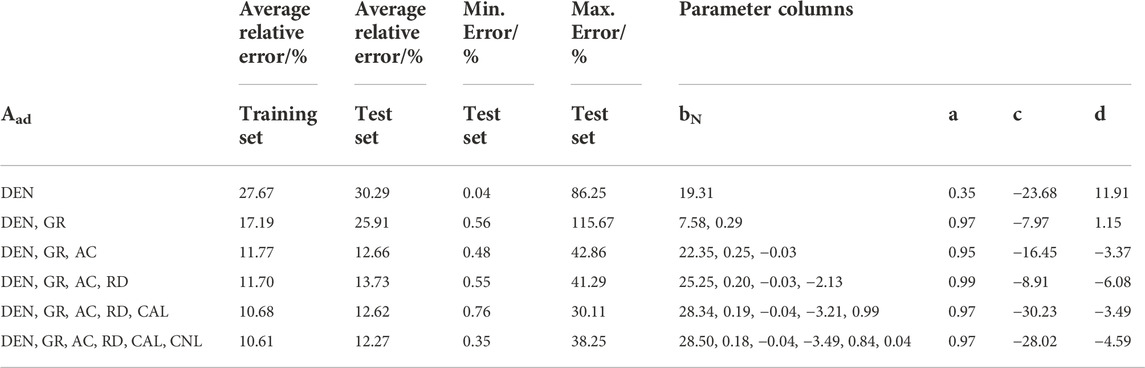
TABLE 2. Performance and parameters of the Aad content prediction models under different logging curves.
5.2 Evaluation prediction of FCad
The FCad content, similar to the Aad content, is an important geological parameter that plays a key role in the evaluation of CBM content (Ghosh et al., 2016; Zhou and Guan, 2016). The experimental FCad content in the study block ranged from 58.84% to 88.68%, with an average value of 80.82%. Because of the strong correlation between the FCad and Aad contents, the correlation between the FCad content and the response values of the geophysical logging curves was consistent with that of the Aad content, with an opposite trend (Figures 5A-D). For example, in the study block, the burial depths of different coal seams differ significantly, and the seam numbers are not distinguished in the autocorrelations of the industrial component contents. Based on the data, the effect of burial depth does not have a significant impact on the autocorrelation between the industrial component contents, the Mad content is lower in all cases, and the Mad content of the No.3 coal seam is slightly higher than that of the No.15 coal seam. The total sulfur content exhibits a significant difference, the total sulfur content of the No.15 coal seam is 7–10 times higher than that of the No.3 coal seam, the total sulfur content of the No.3 coal seam is approximately 0.5%, and that of the No.15 coal seam is approximately 2.7%. Considering the semi-industrial analysis of this study and the small amount of data in this block and the predominance of the No.3 coal seam, the data are processed in general. For coal seams with different burial depths, the discussion should be divided into layers if the amount of data meets the requirements (Hou H et al., 2021), particularly for coal rock sections with significant differences in coal structures (Hou et al., 2017).
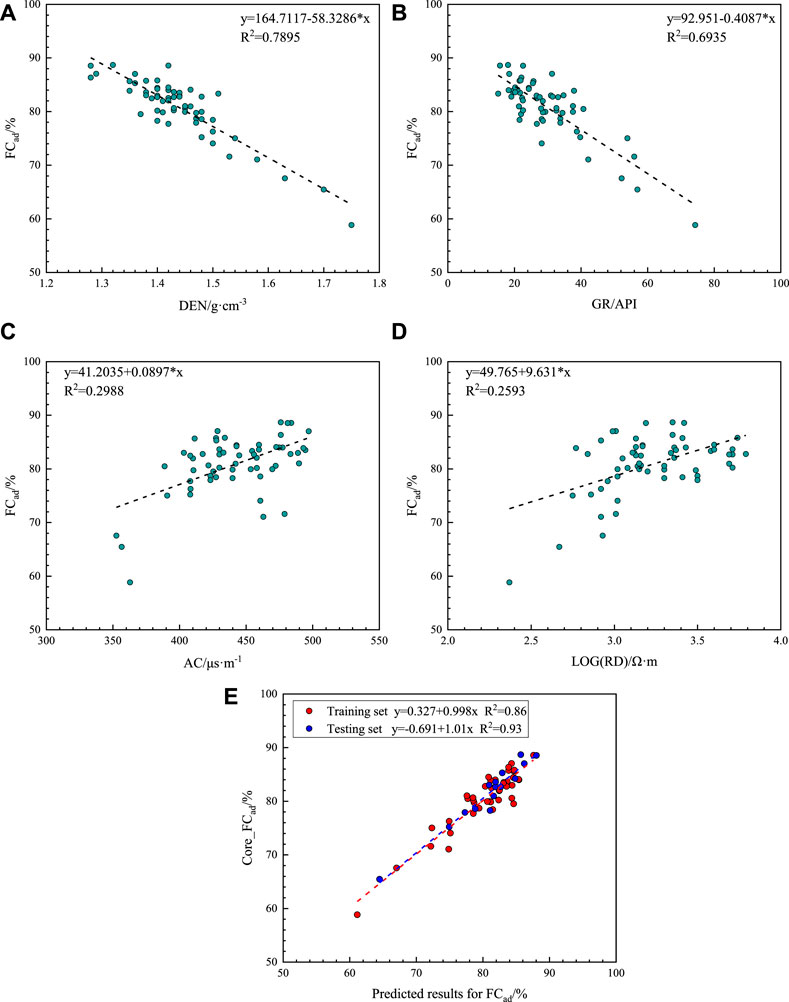
FIGURE 5. Correlation analysis of the FCad content and the geophysical logging data response with the predicted results of the FCad content. (A) Relationship between the FCad content and DEN. (B) Relationship between the FCad content and GR. (C) Relationship between the FCad content and AC. (D) Relationship between the FCad content and RD. (E) Performance of the OBGM (1, 5) prediction model on the training and test sets for the FCad content.
FCad and Aad used the same data samples in the study, and the process and results in the exploration of logging curves are listed in Table 3. The same results were obtained for the prediction of the Aad content, and the FCad content was accurately predicted when five curves were generated. The analysis determined that the model in this study effectively predicted the FCad content. The average relative error of the data in the test set was 1.42%, and the maximum relative error was 3.63%, with high prediction accuracy. Furthermore, Figure 5E shows that bias does not occur in the prediction results, and the fitting coefficient (R2) between the prediction and experimental results in the test data was 0.93, exhibiting the effectiveness of the prediction method.
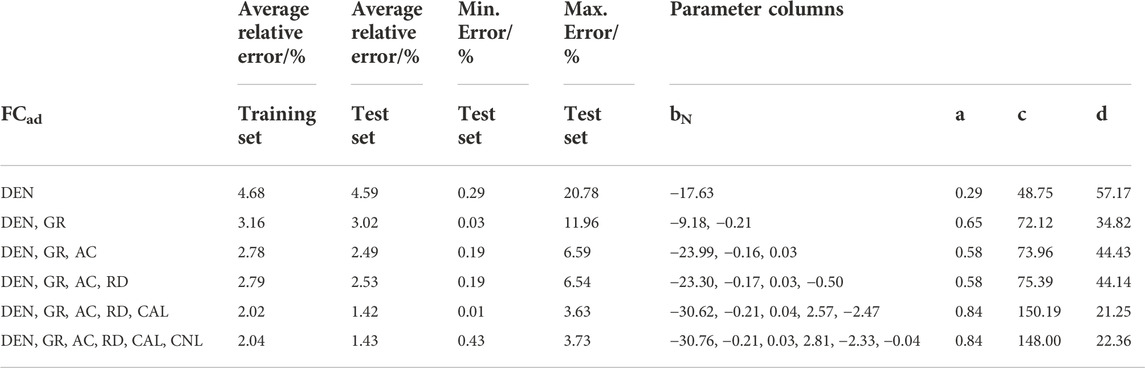
TABLE 3. Performance and parameters of the FCad content prediction models under different logging curves.
5.3 Evaluation prediction of Vdaf
The Vdaf content is dependent on several factors, such as the degree of coalification and sedimentary environment (J. Hou et al., 2014; Liu et al., 2021). It is also an important factor in determining the degree of coalification of coal rocks. It tends to increase and then decrease with increasing coalification, reaching maximum and minimum values in brown and anthracite coals, respectively. The Vdaf content of the coal samples from the PZ block measured in the laboratory ranged from 4.34% to 8.08%, with an average value of 5.47%. The Vdaf content was extremely low, and the block was a typical anthracite coal. The Pearson index and rendezvous plots (Figure 6) indicate that the correlation between the Vdaf content and the response values of the geophysical logging data was weak, and only the response values of DEN, GR, and AC are correlated (Figures 6A–C). Furthermore, the autocorrelation between the contents of industrial components indicated that the Aad content had a strong correlation with the numerical sum of the FCad and Vdaf contents (Figure 6D). Hence, two methods are proposed in this paper for the prediction of the Vdaf content. The first method is to compare the error using the same exploration, as in Sections 5.1, 5.2, by increasing the logging curves to construct a model. As presented in Table 4, the best results were achieved with six geophysical logging curves, and the average and maximum relative errors of the test dataset reached minimums. Thus, the prediction results of the training and test datasets were plotted (Figure 6E). The overall model was biased, with high predictions for low values of the core experiments and low predictions for high values of the experimental results, forming a significantly biased phenomenon (Figure 6E), although the error value of the Vdaf content predicted using the geophysical logging curves was low. This prediction effect does not have a simplified value despite the low error levels. Note that there was an abnormally high value in the test data of the Vdaf content; that is, the test result of the Vdaf content in the laboratory was 8.08% (shown in black arrows). To prevent the comparison of the abnormal point (shown in black arrows) to the subsequent models, this point is ignored when the correlation between the predicted and experimental data is discussed in subsequent multiple methods.
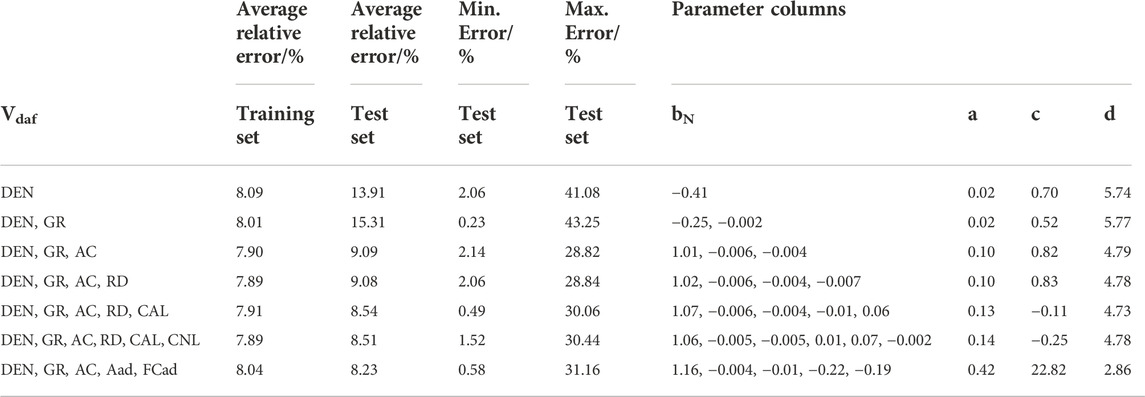
TABLE 4. Performance and parameters of the Vdaf content prediction models under different logging curves.
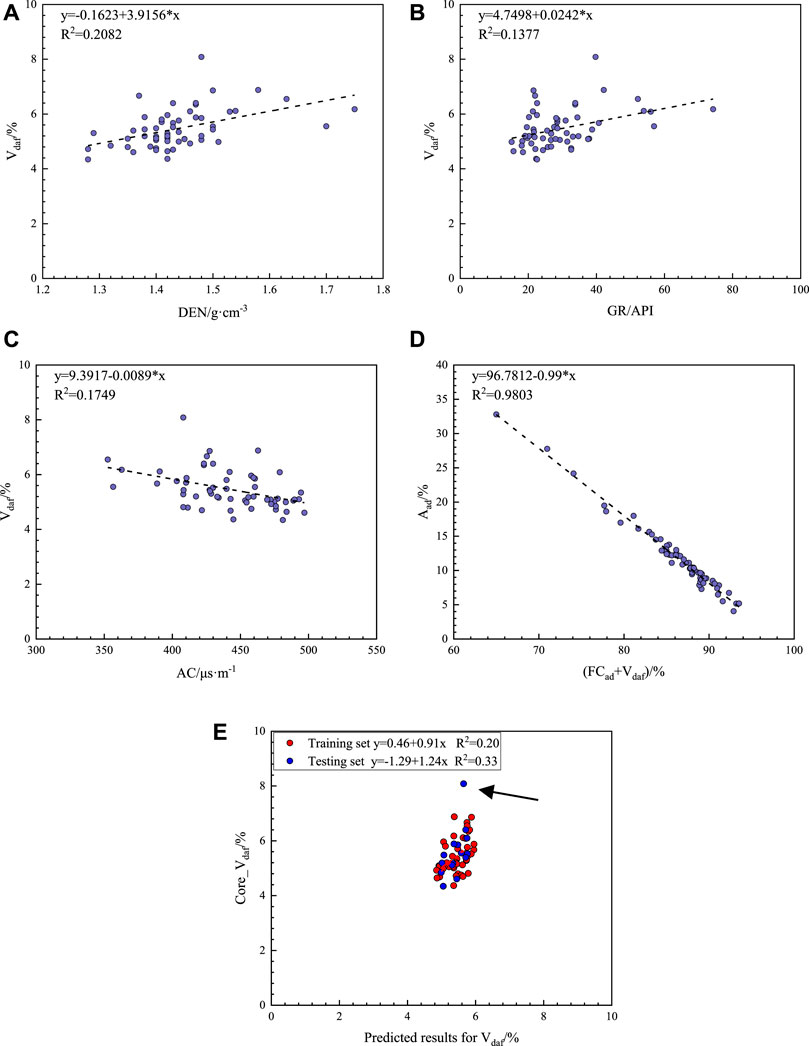
FIGURE 6. Correlation analysis of the Vdaf content and the geophysical logging data response with the predicted results of the Vdaf content. (A) Relationship between the Vdaf content and DEN. (B) Relationship between the Vdaf content and GR. (C) Relationship between the Vdaf content and AC. (D) Autocorrelation between industrial component contents. (E) Performance of the OBGM (1, 6) prediction model on the training and test sets for the Vdaf content.
Owing to the poor results of using only the logging curves directly, a second method was used in this study; that is, a calculation using the autocorrelation between industrial component contents according to the autocorrelation regression equation:
Calculations were performed according to the regression equation (Eq. 12), and to test the simplification of this method, the Aad and Vdaf contents in the test datasets are the results of the predictions in Sections 5.1, 5.2, rather than the core experimental results. The Vdaf content predicted from the autocorrelation of the industrial component content is shown in Figure 7A. Compared with the OBGM (1, 6) prediction model using only the geophysical logging curves directly, the correlation between the predicted and experimental results of the test dataset using autocorrelation Eq. 12 increased from 0.33 to 0.59. This phenomenon indicates that using the autocorrelation of industrial component contents is an effective prediction method.
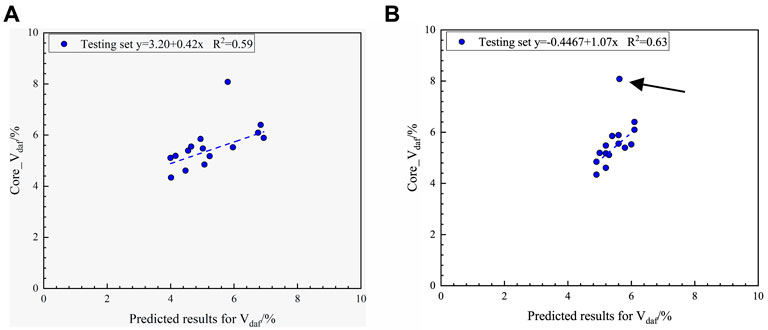
FIGURE 7. (A) Application effect of the Vdaf content prediction model constructed using industrial component content autocorrelation. (B) Application effect of the Vdaf content prediction model constructed using the geophysical logging curves and the industrial component contents combined with OBGM (1, 5) model.
This paper also proposes a new prediction model for predicting the Vdaf content, which is created by combining the geophysical logging curves sensitive to the Vdaf content and the Aad and FCad contents in the industrial components with the OBGM (1, N) while maintaining the test dataset. The values of the Aad and FCad contents in the test datasets also use the prediction results in Sections 5.1, 5.2, rather than the core experimental results (Figure 7B). By comparing the content prediction model of the Vdaf content constructed by three different combination modes, combined with the actual error data and correlation, it is considered that the prediction model using the geophysical logging curves combined with industrial component contents has the best effect, average relative error, and R2, and there is no significant prediction deviation. The construction method of comprehensive geophysical logging data and component relationships not only allows the original logging curve to participate but also considers the autocorrelation and cumulative error between industrial component contents. The prominent application effect also demonstrated the effectiveness of the model construction method. Note that there is no local magmatic intrusion. The change in the degree of coal metamorphism needs to meet Hilt’s law, which is a precondition (Hou H. H. et al., 2021). The corresponding model parameters are listed in the last row of Table 4.
5.4 Evaluation prediction of Mad
The current calculation of the Mad content in industrial components can be divided into two types: volumetric models (Liu et al., 2021) and geophysical logging curves combined with mathematical models (Zhou and O'Brien, 2016; Zhou et al., 2016). The correlation analysis of the Pearson index shows that the Mad content does not exhibit a significant correlation with the contents of various industrial components and the response values of the geophysical logging curves, and the PZ block does not collect sufficient data to use the data-driven method for model construction; therefore, the volumetric model was used for calculations in this study. The volumetric model treats coal rock as consisting of four industrial components, and because the CBM in this area is mainly in the adsorbed state rather than the free state, without considering the volume of CBM, it is determined by Eq. 13.
The corresponding Mad can then be expressed as
In Eqs 13, 14, Mad denotes the moisture on an air-dry basis (%), FCad the fixed carbon on an air-dry basis (%), Aad the ash on an air-dry basis (%), and Vdaf the volatile matter on an air-dry basis (%).
Through seven core boreholes in the PZ block, a complete procedure for evaluating the industrial component contents of coalbeds was obtained in this study. That is, the Aad and FCad contents are predicted using the geophysical logging curves, and the predicted components are then combined with the geophysical logging curves to predict the Vdaf content. Finally, the Mad content is calculated using the volumetric model, that is, the differential subtraction method.
5.5 Application of new wells
To ensure the validity and generalization of the model in this study, the model constructed by the industrial component content evaluation process, combined with the training dataset, was applied using two new wells in the block, PZ8 and PZ9. Figures 8A,B show the results and graphs of the two new wells. The first track in the figure is the log depth track; the second is the lithology logging track, containing CAL, GR, and SP curves; the third is the resistivity logging track, showing the RD curve; the fourth is the porosity logging series, containing CNL, AC, and DEN curves; the fifth to eighth tracks are the laboratory analysis values of each industrial component content and the model prediction curves in this study, Aad, FDad, Vdaf, and Mad, respectively; and the ninth track is the lithology channel, which contains the top and bottom plates of coal and mudstone lithologies. Figure 8C and Table 5 show a rendezvous diagram and listed data of the new wells, respectively. The prediction results of the Aad and FCad contents are uniformly distributed on both sides of the zero-error line in Figure 8C, and the prediction errors of each industrial component content are given in Table 5. The prediction effects of the Aad, FCad, and Vdaf contents in the new wells are consistent with the performance of the model on the test datasets, indicating the effectiveness and generalization of the method in this study. The prediction curves for the contents of FCad and Aad correlate with the experimental analysis of the changing trend, and the overall error of the prediction results for the Vdaf content is slightly higher than for the previous two, according to a thorough analysis that includes the actual geophysical logging plots and data table. Because the Mad content is calculated using the differential subtraction method, the accuracy of the evaluation of the contents of the first three components limits the prediction results of the Mad content, and the error is the cumulative error of the prediction of the three industrial component contents. Because the Mad content typically does not exceed 3% in this block, the small error accumulating continuously has an amplifying effect on Mad, giving a corresponding maximum relative error of 64.1%. Given that the prediction errors of the other three industrial component contents are consistent with the performance of the test data, this typically demonstrates the validity and generalization of the model in this study, which can provide a reliable method for industrial component content prediction in the field.
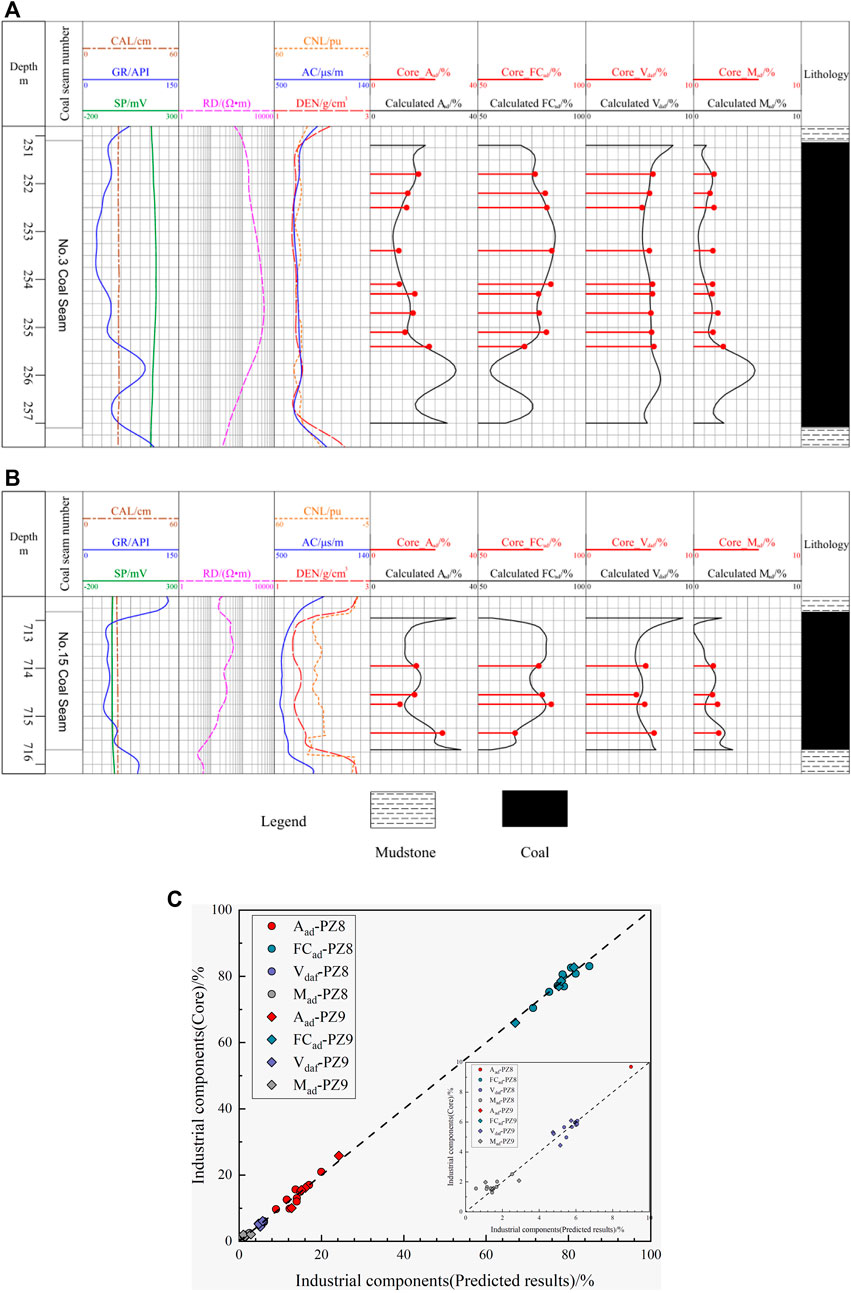
FIGURE 8. (A) Predicted industrial component contents of the new well PZ8 in the PZ block. (B) Predicted industrial component contents of the new well PZ9 in the PZ block. (C) Correlation between the predicted results and the experimental results for each industrial component in the new wells.
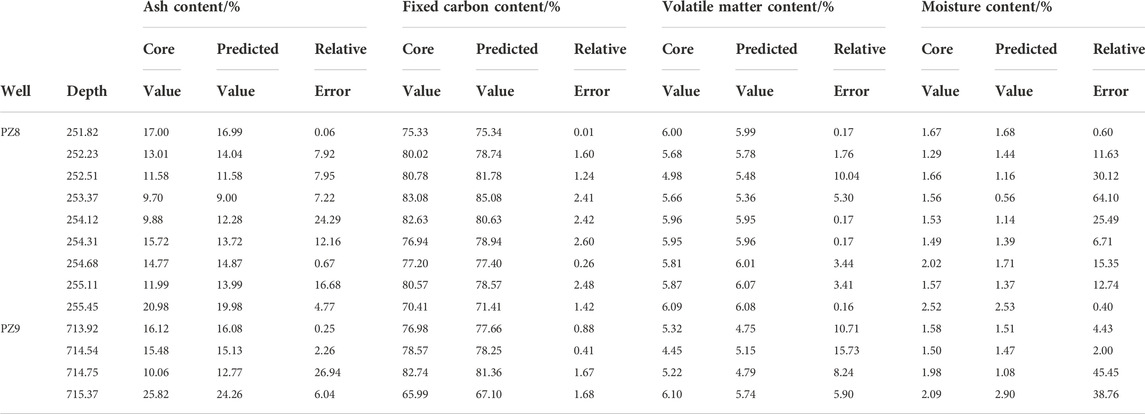
TABLE 5. Calculated and experimental values from wells of PZ8 and PZ9.
6 Discussion and analysis
6.1 Problem with determining the background value
In the method principle, the background value,
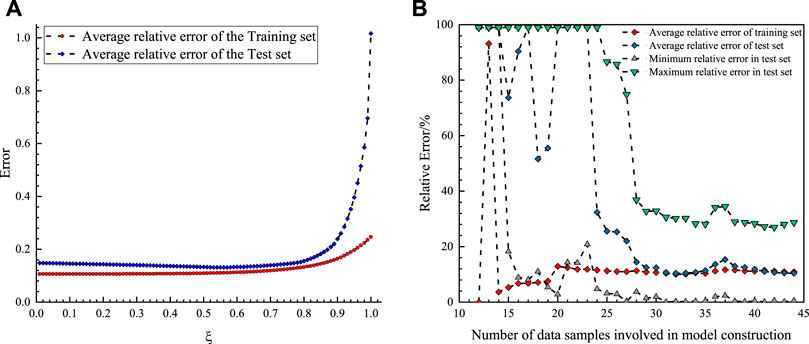
FIGURE 9. (A) The effect of changes in background value coefficients on the model performance (using the Aad content as an example). (B) The effect of data sample size on the prediction model performance (using the Aad content as an example).
6.2 Effect of the number of training datasets on the model
Gray systems are suitable for constructing evaluation models with small sample sizes. In contrast, data-driven methods, such as machine-learning methods, tend to have higher requirements for the amount of data in the sample. Although there are vector machine type methods for small-sample datasets, when applying these methods to build models, the determination of the hyperparameters must be combined with optimization modes, such as cross-validation or grid search, a process that is computationally expensive and difficult to avoid when the sample is small. In the OBGM (1, N) model, the magnitude of the background value,
6.3 Comparison of the methods
To further illustrate the advantages of the model in this study, the method used here was compared with the multiple regression method and static gray model (GM) (0, N). The same multiple regression and GM (0, N) models were constructed for the same data, using Aad content as an example. To compare the variability between the methods, consistent with the data explored previously for the OBGM model, 44 sets of data were used for the model construction, and 15 sets of the same data were used for the test data to show the performance of the model on the test data.
Eqs 15, 16 are the fitted equations of the multiple regression and static GM (0, N) models, respectively. Aad denotes the ash on an air-dried basis, Aad(1) the cumulative equation (1-AGO) of Aad, and DEN(1) the cumulative terms of DEN.
Table 6 shows the application effect of the three models for the prediction of the Aad content in the test dataset, and the analysis by the mean relative error indicates that the OBGM (1, N) model is better than the multiple regression and GM (0, N) models. The correlation between the prediction and actual coring results in the test dataset indicated that the model used in this study had the highest correlation and lowest maximum relative error. The OBGM (1, N) model had the most stable relative error and the highest correlation between the prediction and experimental results among the methods with the same computational cost.
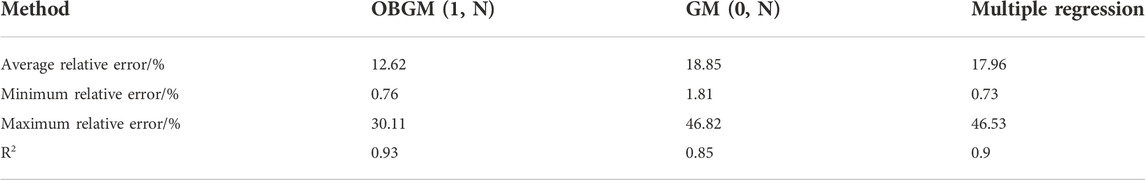
TABLE 6. Comparison of the application effect between different methods.
6.4 Error discussion
The prediction errors for the contents of the four industrial components were analyzed in this study. The prediction errors for the Aad and FCad contents can be grouped into the following categories:
1) The process of geophysical logging data acquisition is inevitably subject to interference, and the logging curve is a comprehensive characterization of the physical properties of the rock and contains noise information as well as disturbances during experiments, such as coal sample coring from the delivery to the laboratory. These types of errors are mainly systematic errors. The study as much as possible corrects errors caused by the instrumentation, borehole, and other environmental factors during the logging process by standardizing the preprocessing. Although there is a certain degree of human interference, the results after preprocessing demonstrates the feasibility of the method; for the experimental problem, this study shows the correlation between component contents and between the Aad and RDad contents, indicating that such errors are within acceptable limits.
2) In the process of matching logging response data, such as core depth homing and dilation correction, it is difficult to avoid the interference caused by human factors. However, such operations can significantly decrease the impact of instruments and construction, reducing the overall error.
It is not possible to construct a separate model to reject these two types of errors, and such errors can be ignored during the construction of the prediction model for industrial component contents; however, they will be added to the results. The predictions of the Aad and FCad contents indicated that the errors of both were within acceptable limits, and the model used in this study was advantageous.
In contrast, the prediction errors of the Vdaf and Mad contents are somewhat different from these errors. In addition to these two types of errors, there are cumulative errors in the prediction of the Aad and FCad contents. Because the Vdaf content is autocorrelated with the contents of other industrial components, two industrial component contents are used in the model construction, in addition to the geophysical logging data. The results of this study indicate that the use of both geophysical logs and industrial component contents to predict the Vdaf content yields better prediction results. Even after accounting for the cumulative error, it achieves more satisfactory practical use than when only geophysical logs or industrial component contents are used for autocorrelation.
The correlation between the Mad content and response of the geophysical logging data and the industrial component content was not significant, and the prediction model could not be constructed using machine learning methods when the sample size was small. Therefore, the prediction errors of the Mad content are all derived from the laboratory and cumulative errors of the first three component contents, which is why the prediction of the Mad content has the largest relative errors in the actual application of new wells.
This study provides a set of prediction models for the industrial component contents of coal seams in the PZ block, which is not processed by stratification owing to the limitation of sample quantity. In the case of coal seams with different geological backgrounds, burial depths, and coal seams, statistics and analyses must be performed in conjunction with specific data, particularly when there are significant differences in Mad content and the presence of magma intrusion (Hou et al., 2017; Hou H et al., 2021). Other factors must be considered before the evaluation process is determined using the OBGM model in conjunction with the actual data. Simultaneously, it should be noted that the gray system model involves the accumulation and reduction of sequences, and the change in data order has a minor impact on the prediction results but does not affect the conclusion.
6.5 Future trends
With the development of experiments, the progress and diversification of logging instruments can provide more accurate experimental data and geophysical logging information in the future (Zhou and O'Brien, 2016). Meanwhile, with an increase in the number of core samples, the sample data limitation is alleviated, and machine learning or deep learning methods can be used to construct industrial component prediction models, particularly for the prediction of Mad content, which can be further improved.
In the short term, the effective prediction of the industrial component contents, which can provide the variation curve of industrial component contents in the vertical direction of a single well, is conducive for the evaluation and prediction of the CBM content and helps in the identification of CBM resource dessert zones. For long-term benefits, there is guidance for the subsequent mining of high-quality coal.
7 Conclusion
In this study, the geophysical logging data were combined with the OBGM (1, N) model to construct a prediction model for the contents of coalbed industrial components, which plays a guiding role in the subsequent exploration of coalbed methane and coal mine resources. The following conclusions were made:
1) In this study, a set of prediction models was proposed for the industrial component contents applicable to the PZ block by combining the geophysical logging data with the OBGM (1, N) model based on the actual industrial component content data of the PZ block. For predicting the contents of Aad and FCad, the DEN, GR, AC, RD, and CAL curves were selected to obtain the best prediction effect. An increase in the geophysical logging curve types can effectively enhance the model performance, unlike when a single logging curve is used for the evaluation.
2) The modeling approach differs in the prediction of Vdaf and Mad contents, wherein the combination of geophysical logging curves with Aad and FCad contents provides the best prediction accuracy, compared to the autocorrelation of geophysical logging curves or industrial component contents. In this study, an evaluation procedure was achieved for the PZ block; that is, the Aad and FCad contents were first predicted using the geophysical logging data, the Vdaf content was then predicted, and finally the Mad content was calculated. This model was applied to new wells in the same block, and the validity of this process was demonstrated through error analysis.
3) Regarding model prediction accuracy, compared with the multiple regression and GM (0, N) models having the same computational cost, the OBGM (1, N) model has the best effect.
Therefore, the proposed geophysical logging interpretation model can cost effectively satisfy the effective evaluation of the industrial component contents of coalbeds in the PZ block and can provide a new method for evaluating the system of industrial component contents in this block.
Data availability statement
The original contributions presented in the study are included in the article/Supplementary Material, further inquiries can be directed to the corresponding author.
Author contributions
JG designed the study and wrote the manuscript. ZZ provided funding. HX and CZ developed the ideas. LZ contributed to revising the manuscript. CW added the geological understanding and mapping. All coauthors actively contributed to the manuscript with their comments, ideas, and suggestions.
Funding
This study was conducted in the Southern Shizhuang block of the Qinshui Basin and was financially sponsored by the Open Fund of the Key Laboratory of Exploration Technologies for Oil and Gas Resources, Ministry of Education (Nos. K2021–03 and K2021-08), National Natural Science Foundation of China (No. 42106213), and Hainan Provincial Natural Science Foundation of China (No. 421QN281).
Acknowledgments
The authors wish to express their gratitude to the staff of the Qinshui Coalfield in the Shanxi Province.
Conflict of interest
Author HX was employed by Sinopec Jianghan Oilfeld Company.
The remaining authors declare that the research was conducted in the absence of any commercial or financial relationships that could be construed as a potential conflict of interest.
Publisher’s note
All claims expressed in this article are solely those of the authors and do not necessarily represent those of their affiliated organizations, or those of the publisher, the editors and the reviewers. Any product that may be evaluated in this article, or claim that may be made by its manufacturer, is not guaranteed or endorsed by the publisher.
Supplementary material
The Supplementary Material for this article can be found online at: https://www.frontiersin.org/articles/10.3389/feart.2022.1031218/full#supplementary-material
Abbreviations
CBM, Coalbed methane; RBF, Gaussian radial basis function; AD, Air-dry basis; Aad, Ash on an air-dry basis; FCad, Fixed carbon on an air-dry basis; Vdaf, Volatile matter on air-dry basis; Mad, Moisture on an air-dry basis; RDad, Relative density on an air-dry basis; AC, Acoustic time difference log; DEN, Compensation density log; CNL, Compensated neutron log; CAL, Caliper log; SP, Spontaneous potential log; GR, Nature gamma log; RD, Deep lateral resistivity log; RS, Shallow lateral resistivity log; RXO, Flushed-zone resistivity log; R2, Fitting coefficient.
References
Ahmed, U., Johnston, D., and Colson, L. (1991). An advanced and integrated approach to coal formation evaluation. Paper presented at the SPE Annual Technical Conference and Exhibition.
Bond, L. O., Alger, R. P., and Schmidt, A. W. (1971). Well log applications in coal mining and rock mechanics.
Cai, Y., Liu, D., Yao, Y., Li, J., and Qiu, Y. (2011). Geological controls on prediction of coalbed methane of No. 3 coal seam in Southern Qinshui Basin, North China. Int. J. Coal Geol. 88 (2-3), 101–112. doi:10.1016/j.coal.2011.08.009
Chatterjee, R., and Paul, S. (2013). Classification of coal seams for coal bed methane exploitation in central part of Jharia coalfield, India - a statistical approach. Fuel 111, 20–29. doi:10.1016/j.fuel.2013.04.007
Daniels, J. J., Scott, J. H., and Liu, J. (1983). "Estimation of coal quality parameters from Geophysical well logs," in Transactions of the SPWLA 24th Annual logging Symposium 2, 1-19.
Feng, Y., Lu, J., Wang, J., Mi, J., Zhang, M., Ge, M., et al. (2020). Desulfurization sorbents for green and clean coal utilization and downstream toxics reduction: A review and perspectives. J. Clean. Prod. 273, 123080. doi:10.1016/j.jclepro.2020.123080
Fu, X., Qin, Y., Wang, G. G. X., and Rudolph, V. (2009a). Evaluation of coal structure and permeability with the aid of geophysical logging technology. Fuel 88 (11), 2278–2285. doi:10.1016/j.fuel.2009.05.018
Fu, X., Qin, Y., Wang, G. G. X., and Rudolph, V. (2009b). Evaluation of gas content of coalbed methane reservoirs with the aid of geophysical logging technology. Fuel 88 (11), 2269–2277. doi:10.1016/j.fuel.2009.06.003
Gao, M., Zhang, S., Li, J., and Wang, H. (2019). The dynamic failure mechanism of coal and gas outbursts and response mechanism of support structure. Therm. Sci. 23, S867–S875. doi:10.2298/tsci180610122g
Ghosh, S., Chatterjee, R., Paul, S., and Shanker, P. (2014). Designing of plug-in for estimation of coal proximate parameters using statistical analysis and coal seam correlation. Fuel 134, 63–73. doi:10.1016/j.fuel.2014.05.023
Ghosh, S., Chatterjee, R., and Shanker, P. (2016). Estimation of ash, moisture content and detection of coal lithofacies from well logs using regression and artificial neural network modelling. Fuel 177, 279–287. doi:10.1016/j.fuel.2016.03.001
Hamawand, I., Yusaf, T., and Hamawand, S. G. (2013). Coal seam gas and associated water: A review paper. Renew. Sustain. Energy Rev. 22, 550–560. doi:10.1016/j.rser.2013.02.030
Hawkins, J. M., Schraufnagel, R. A., and Olszewski, A. J. (1992). Estimating coalbed gas content and sorption isotherm using well log data.” in Paper presented at the SPE Annual Technical Conference and Exhibition.
He, Z., Xie, H., Gao, M., Deng, G., Peng, G., and Li, C. (2020). The fracturing models of hard roofs and spatiotemporal law of mining-induced stress in a top coal caving face with an extra-thick coal seam. Geomech. Geophys. Geo. Energy. Ge. Resour. 7 (1), 2. doi:10.1007/s40948-020-00202-9
Hou, H., Shao, L., Guo, S., Li, Z., Zhang, Z., Yao, M., et al. (2017). Evaluation and genetic analysis of coal structures in deep Jiaozuo Coalfield, northern China: Investigation by geophysical logging data. Fuel 209, 552–566. doi:10.1016/j.fuel.2017.08.020
Hou, H., Shao, L., Wang, S., Xiao, Z., Wang, X., Li, Z., et al. (2019). Influence of depositional environment on coalbed methane accumulation in the carboniferous-permian coal of the qinshui Basin, northern China. Front. Earth Sci. 13 (3), 535–550. doi:10.1007/s11707-018-0742-8
Hou, J., Zou, C., Huang, Z., Xiao, L., Yang, Y., Zhang, G., et al. (2014). Log evaluation of a coalbed methane (CBM) reservoir: A case study in the southern Qinshui Basin, China. J. Geophys. Eng. 11 (1), 5009. doi:10.1088/1742-2132/11/1/015009
Hou, H. H, H. H., Zhang, H. J., Shao, L. Y., Guo, S. Q., Zhao, M. E., and Wang, S. (2021). Coal macrolithotype distribution and its genetic analyses in the deep Jiaozuo coalfield using geophysical logging data. Acs Omega 6 (51), 35523–35537. doi:10.1021/acsomega.1c05012
Hou, H., H., Liang, G., Shao, L., Tang, Y., and Mu, G. (2021). Coalbed methane enrichment model of low-rank coals in multi-coals superimposed regions: A case study in the middle section of southern junggar basin. Front. Earth Sci. 15 (2), 256–271. doi:10.1007/s11707-021-0917-6
Huang, B., Qin, Y., Zhang, W., Zheng, Q., Shi, S., and Wang, G. (2020). Prediction of high-quality coalbed methane reservoirs based on the fuzzy gray model: An investigation into coal seam No. 8 in Gujiao, Xishan, North China. Energy Explor. Exploitation 38 (4), 1054–1081. doi:10.1177/0144598720901444
Jiang, B., Qu, Z., Wang, G. G. X., and Li, M. (2010). Effects of structural deformation on formation of coalbed methane reservoirs in Huaibei coalfield, China. Int. J. Coal Geol. 82 (3-4), 175–183. doi:10.1016/j.coal.2009.12.011
Karacan, C. O., Ruiz, F. A., Cote, M., and Phipps, S. (2011). Coal mine methane: A review of capture and utilization practices with benefits to mining safety and to greenhouse gas reduction. Int. J. Coal Geol. 86 (2-3), 121–156. doi:10.1016/j.coal.2011.02.009
Li, S., Zhang, C., Hu, A., Chen, D., and Yan, S. (2007). Building porosity model of coalbed using collocated cokriging. J. China Coal Soc. 32 (9), 980–983. doi:10.3321/j.issn:0253-9993.2007.09.019
Liu, S., Liu, R., Tang, S., Zhao, C., Liu, B., Diao, J., et al. (2021). Quantitative measurement on coal components through the interpretation model of geophysical log: A case study from the Qaidam Basin, NW China. Energy Explor. Exploitation 39 (6), 2027–2044. doi:10.1177/01445987211020450
Lv, Y., Tang, D., Xu, H., and Luo, H. (2012). Production characteristics and the key factors in high-rank coalbed methane fields: A case study on the fanzhuang block, southern Qinshui Basin, China. Int. J. Coal Geol. 96-97, 93–108. doi:10.1016/j.coal.2012.03.009
Mahmood, Z., and Khan, S. (2009). On the use of K-fold cross-validation to choose cutoff values and assess the performance of predictive models in stepwise regression. Int. J. Biostat. 5 (1). doi:10.2202/1557-4679.1105
Moore, T. A. (2012). Coalbed methane: A review. Int. J. Coal Geol. 101, 36–81. doi:10.1016/j.coal.2012.05.011
Morin, R. H. (2005). Hydrologic properties of coal beds in the powder river basin, montana. I. Geophysical log analysis. J. Hydrology 308 (1-4), 227–241. doi:10.1016/j.jhydrol.2004.11.006
Mullen, M. J. (1988). "Log evaluation in wells drilled for coal-bed methane," in Geology and coalbed methane resources of the northern San Juan Basin, Colorado and New Mexico. Rocky Mountain Association of Geologists. Denver. Rocky Mountain Association of Geologists, 113–124.
Palmer, I. (2010). Coalbed methane completions: A world view. Int. J. Coal Geol. 82 (3-4), 184–195. doi:10.1016/j.coal.2009.12.010
Pan, H., and Huang, Z. (1998). Log interpretation model of determining coalbed coal quality parameters. Geoscience 12 (3), 154
Ren, P., Xu, H., Tang, D., Li, Y., Sun, C., Tao, S., et al. (2018). The identification of coal texture in different rank coal reservoirs by using geophysical logging data in northwest Guizhou, China: Investigation by principal component analysis. Fuel 230, 258–265. doi:10.1016/j.fuel.2018.05.019
Roslin, A., and Esterle, J. S. (2015). Electrofacies analysis using high-resolution wireline geophysical data as a proxy for inertinite-rich coal distribution in late permian coal Seams, bowen Basin. Int. J. Coal Geol. 152, 10–18. doi:10.1016/j.coal.2015.08.003
Shao, X., Sun, Y., Sun, J., Tang, D., Xu, H., Dong, X., et al. (2013). Log interpretation for coal petrologic parameters: A case study of hancheng mining area, central China. Petroleum Explor. Dev. 40 (5), 599–605. doi:10.1016/s1876-3804(13)60078-6
Shi, J. X., Zeng, L. B., Dong, S. Q., Wang, J. P., and Zhang, Y. Z. (2020). Identification of coal structures using geophysical logging data in qinshui basin, china: investigation by kernel fisher discriminant analysis. Int. J. Coal Geol. 217, 103314. doi:10.1016/j.coal.2019.103314
Tan, L.-Z., Ouyang, A. J., Peng, X.-Y., Li, E.-X., Tung Khac, T., and Hao, L. (2015). A fast and stable forecasting model to forecast power load. Intern. J. Pattern Recognit. Artif. Intell. 29 (3), 1559005. doi:10.1142/s0218001415590053
Wang, Y., Liu, D., Cai, Y., Yao, Y., and Zhou, Y. (2018). Evaluation of structured coal evolution and distribution by geophysical logging methods in the Gujiao Block, northwest Qinshui basin, China. J. Nat. Gas Sci. Eng. 51, 210–222. doi:10.1016/j.jngse.2018.01.022
Ward, C. R. (2016). Analysis, origin and significance of mineral matter in coal: An updated review. Int. J. Coal Geol. 165, 1–27. doi:10.1016/j.coal.2016.07.014
Xu, H., Tang, D. Z., Tang, S. H., Zhao, J. L., Meng, Y. J., and Tao, S. (2014). A dynamic prediction model for gas-water effective permeability based on coalbed methane production data. Int. J. Coal Geol. 121, 44–52. doi:10.1016/j.coal.2013.11.008
Yang, N., Tang, S.-h., Zhang, S.-h., Xi, Z.-d., Li, J., Yuan, Y., et al. (2018). In seam variation of element-oxides and trace elements in coal from the eastern Ordos Basin, China. Int. J. Coal Geol. 197, 31–41. doi:10.1016/j.coal.2018.08.002
Yegireddi, S., and Bhaskar, G. U. (2009). Identification of coal seam strata from geophysical logs of borehole using Adaptive Neuro-Fuzzy Inference System. J. Appl. Geophys. 67 (1), 9–13. doi:10.1016/j.jappgeo.2008.08.009
Zeng, B., and Li, C. (2018). Improved multi-variable grey forecasting model with a dynamic background-value coefficient and its application. Comput. Industrial Eng. 118, 278–290. doi:10.1016/j.cie.2018.02.042
Zeng, B., Luo, C., Liu, S., Bai, Y., and Li, C. (2016). Development of an optimization method for the GM(1, N) model. Eng. Appl. Artif. Intell. 55, 353–362. doi:10.1016/j.engappai.2016.08.007
Zhang, C., and Jiang, Q. (2005). The prediction of small sample time-displacement data based on GM(0, N) and RBF. Comput. Eng. Appl. 5, 62. doi:10.3321/j.issn:1002-8331.2005.05.022
Zhang, Z. (2013). On coalbed methane industrial components and gas content calculation model in heshun area. Well Logging Technol., 37(1), 99. doi:10.16489/j.issn.1004-1338.2013.01.021
Zhou, B., and O'Brien, G. (2016). Improving coal quality estimation through multiple geophysical log analysis. Int. J. Coal Geol. 167, 75–92. doi:10.1016/j.coal.2016.09.013
Zhou, D., Wang, Z., and Li, X. (2016). The application of GRNN and LS-SVM to coal properties calculation. Geophys. Geochem. Explor. 40 (1), 88. doi:10.1016/S0375-9601(01)00735-6
Zhou, F., and Guan, Z. (2016). Uncertainty in estimation of coalbed methane resources by geological modelling. J. Nat. Gas Sci. Eng. 33, 988–1001. doi:10.1016/j.jngse.2016.04.017
Zhou, F., Yao, G., and Tyson, S. (2015). Impact of geological modeling processes on spatial coalbed methane resource estimation. Int. J. Coal Geol. 146, 14–27. doi:10.1016/j.coal.2015.04.010
Zhu, J., Fu, T., Mao, D., Li, H., Huang, Z., and Wang, J. (2012). Static calibration and decoupling of multi-dimensional force sensor based on GM(0, N) model. J. Grey Syst. 24 (3), 225. doi:10.1155/2012/490810
Zhu, L., Ma, Y., Cai, J., Zhang, C., Wu, S., and Zhou, X. (2021). Key factors of marine shale conductivity in southern china-part I: The influence factors other than porosity. J. Petroleum Sci. Eng. 205, 108698. doi:10.1016/j.petrol.2021.108698
Keywords: coal quality analysis, industrial components, ash content, geophysical logging data, Qinshui Basin, OBGM (1, N)
Citation: Guo J, Zhang Z, Xiao H, Zhang C, Zhu L and Wang C (2023) Quantitative interpretation of coal industrial components using a gray system and geophysical logging data: A case study from the Qinshui Basin, China. Front. Earth Sci. 10:1031218. doi: 10.3389/feart.2022.1031218
Received: 29 August 2022; Accepted: 26 September 2022;
Published: 06 January 2023.
Edited by:
Mingjun Zou, North China University of Water Resources and Electric Power, ChinaReviewed by:
Biao Guo, North China University of Water Conservancy and Electric Power, ChinaHaihai Hou, Liaoning Technical University, China
Copyright © 2023 Guo, Zhang, Xiao, Zhang, Zhu and Wang. This is an open-access article distributed under the terms of the Creative Commons Attribution License (CC BY). The use, distribution or reproduction in other forums is permitted, provided the original author(s) and the copyright owner(s) are credited and that the original publication in this journal is cited, in accordance with accepted academic practice. No use, distribution or reproduction is permitted which does not comply with these terms.
*Correspondence: Zhansong Zhang, Zhangzhs@yangtzeu.edu.cn