Nanoindentation-Based Three-Parameter Fracability Evaluation Method for Continental Shales
 Siwei Meng
 Dongxu Li
 Qi Wang3
 - 1Research Institute of Petroleum Exploration and Development, Beijing, China
- 2PetroChina Daqing Oilfield Co., Ltd., Daqing, China
- 3Petrochina Foreign Cooperation Administration Department, Beijing, China
- 4University of Texas at Austin, Austin, TX, United States
- 5China University of Mining and Technology (Beijing), Beijing, China
Shale fracturing evaluation is of great significance to the development of shale oil and gas resources, but the commonly used shale evaluation methods (e.g., the method using the brittleness index based on mineral composition or elastic parameters) have certain limitations. Fractures and beddings affecting fracturing are not considered in these methods. Therefore, it is necessary to develop a new method to evaluate fracturing more comprehensively. The samples used in this research were taken from four typical continental shale basins of China, namely the Bohai Bay Basin, the Ordos Basin, the Songliao Basin, and the Junggar Basin. From a microscopic point of view, a three-parameter evaluation method involving multi-dimensional factors has been developed based on the nanoindentation method. Then, the fracturing coefficient K2 is obtained by combining the ratio β of the fracture indentation to the total indentation and the uneven coefficient m. After that, the fracability coefficient K3 is the ratio of the elastic modulus parallel to bedding to that perpendicular to bedding. Finally, the correlation between fracability coefficients K1, K2, and K3 is used to evaluate the overall fracturing performance of shale. The results of this evaluation method are in good agreement with the actual fracturing performance. It can be concluded that this method is highly reliable and practical and well worthy of promoted applications.
Introduction
With the increasing demand for oil and gas resources all around the world, shale oil has become a key field for the exploration and development of unconventional oil and gas resources globally. The fracturing evaluation is of great significance to the development of shale oil and gas resources. Previous practice of shale fracability evaluation mostly uses the brittleness index to reflect the degree of difficulties in creating complex fracture networks (Ai et al., 2016; Li et al., 2017; Qin and Yang, 2019; Tang et al., 2019; Zhang et al., 2020). At present, two types of brittleness indexes are commonly used for shale, namely the mineral composition-based and rock mechanical parameter-based ones. However, during actual fracturing, the in-situ stress, the natural fracture development degree, bedding, and internal structure all have significant impacts on the shale fracability (Zhang et al., 2018a; Xie et al., 2020; Yang et al., 2020; Mao et al., 2021; Zhang et al., 2021).
In 2013, some scholars developed a fracability evaluation method using three rock mechanical parameters, namely the Young’s modulus, Poisson’s ratio, and uniaxial tensile strength, as the independent variables, and the fracability coefficient as a dependent variable, which yet ignored the impact of mineral composition (Yuan et al., 2013). In 2014, some scholars proposed a comprehensive evaluation method for shale gas fracability, which uses a radar chart of six geomechanical parameters to rank the fracability of shale gas reservoirs. However, this method cannot be used for quantitative analysis (Zhao et al., 2015). In 2015, some scholars proposed an evaluation method for shale gas fracability by integrating three features of shale (the brittleness, fracture toughness, and natural weak plane), but the impact of rock mechanical parameters was not addressed (Chen et al., 2017). In 2017, some scholars set up an evaluation system for shale fracability comprising five factors—the brittleness index, rock mineral content, cohesion, natural fractures, and porosity to evaluate the fracability of the Niutitang Formation. Nonetheless, this research neglected the impact of organic matter and in-situ stress difference (Di et al., 2019).
The evaluation methods mentioned above mostly evaluate the fracability from a macro point of view, and rarely perform evaluation from a micro point of view. Over the past few years, many researchers have gradually applied the nanoindentation technique to studying the mechanical properties of rocks. Some scholars calibrated the indentation position by integrating the nanoidentation with the backscattered electron diffraction (BSE) and measured the mechanical property of kerogen at the nano scale. They found out that the elastic modulus of kerogen was 5–9 GPa, and higher kerogen content would reduce the overall elastic modulus of rock (Kumar et al., 2012; Shukla et al., 2015). Some scholars proposed a nanoindentation-based evaluation model for the fracture toughness of coal, which estimates the fracture energy and fracture area according to the brittle failure theory and the pop-in feature on the loading curve (Manjunath and Birendra, 2019). Some scholars obtained the mechanical properties of dry and saltwater-saturated coal samples at the nano scale through nanoindentation tests and compared them with the results of the traditional acoustic testing, based on which the limitations of the traditional acoustic testing are concluded (Zhang et al., 2018b).
The study addresses the typical continental shale of the Bohai Bay Basin, the Ordos Basin, the Songliao Basin, and the Junggar Basin in China. With the X-ray diffraction (XRD) test, scanning electron microscopy (SEM), and the nanoindentation test of the grid identation mode, the mechanical parameters of rocks such as elastic modulus, hardness, and fracture toughness are obtained. The evaluation results are in good agreement with the actual fracturing treatment performance and fracturing numerical simulation result. It is shown that this method is highly reliable and practical, and thus well worthy of promoted applications. This study provides an idea and technical method for evaluation of the continental shale and is valuable for revealing the mechanical behavior of shale and realizing efficient development of shale gas.
Testing Methods
Test Samples
The test samples were obtained from the Bohai Bay, Ordos, Songliao, and Junggar Basins, respectively (Figure 1). The Bohai Bay Basin is a faulted basin composed of a series of Paleogene half-graben sags. The Paleogene is a typical lacustrine sedimentary system having experienced two secondary cycles of lake transgression and regression. Located in the north of Xinjiang, the Junggar Basin covers an area of about 13 × 104 km2, which is a multi-stage superimposed basin occurring on an amalgamation block. Located in Northeast China, the Songliao Basin crosses over three provinces, Heilongjiang, Jilin, and Liaoning, and extends from NE to SW, with a NS length of about 820 km, a EW width of 350 km, and an area of about 26 × 104 km2, bounded by the Nenjiang Fault in the west and the Mudanjiang Fault in the east. It is a large Mesozoic-Cenozoic continental sedimentary basin. Located in the west of the North China Platform, the Ordos Basin covers an area of about 25 × 104 km2 developing the Paleozoic and Mesozoic two petroleum systems. In this article, shale samples with parallel bedding and vertical bedding are prepared respectively. The tested shale sample is mixed curing with epoxy resin and curing agent, whose size is set as length of 5mm, width of 5 mm and thickness of 3 mm. Then, the cured samples will be polished by using the polished section with 15, 9, 3 and 0.5 μm to ensure the smoothness of sample.
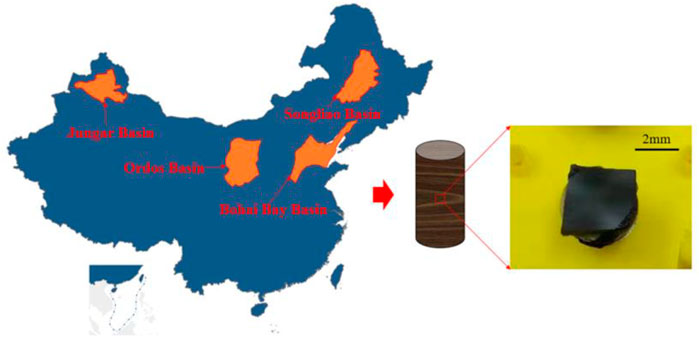
FIGURE 1. Distribution of samples.
Testing Methods
XRD
The TTR III multifunctional X-ray diffractometer manufactured by Rigaku (Japan) was used for mineral composition analysis. Each mineral crystal has its specific X-ray diffraction spectrum, whose characteristic peak intensity is positively related to the mineral content in a sample. The positive correlation (the K value) between the content of a mineral and the intensity of its characteristic diffraction peak can be determined as a prior by testing. Subsequently, the content of this mineral can be obtained by measure the intensity of its characteristic peak in an unknown sample.
SEM
The Apreo field-emission scanning electron microscope (FE-SEM), manufactured by FEI (America), was used for SEM, which is able to perform a fast qualitative or quantitative micro analysis for the multi-element composition by electron beam scanning. In the process of testing, information such as the sample number, accelerating voltage, scale, amplification factor, date, time, and working distance can be obtained. Researcher has established the correlation between shale pore structure, pore size distribution, and rock mechanical properties at the nano scale by the methodology based on the FE-SEM and digital image processing (Liu and Ostadhassan, 2017).
Nanoindentation Technique
Testing Principles and Steps
The nanoindentation technique uses the high-precision sensor to control the indenter to press into and out of a sample and record the changes in load and displacement during this process. Figure 2 illustrates the mechanism of indentation. As shown in Figure 3, a typical process of nanoindentation has three stages: loading, holding, and unloading. In the loading stage, the press-in depth increases with the increase in the pressing load, which is associated with elastic and plastic deformation. The holding stage is designed to eliminate the effect of the sudden force change on the calculation of mechanical parameters. In the unloading stage, the indentation partially recovers, with the reduction in load. It is assumed that only elastic deformation occurs in this stage, based on which the mechanical properties at the indentation point is calculated.

FIGURE 2. Principle of nanoindentation.
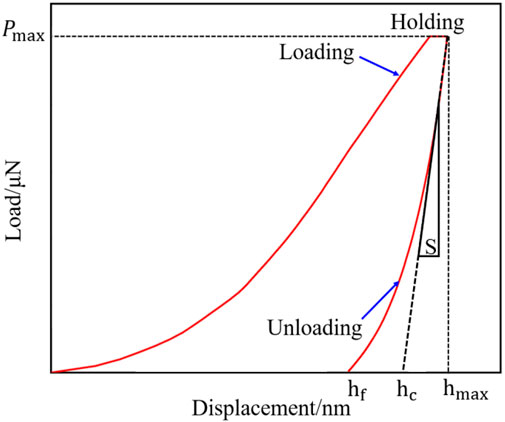
FIGURE 3. Load vs. displacement for nanoindentation.
In this study, the quasi-static nanoindentation test with a fixed maximum load was carried out, and the grid indentation method is used, with a total of 100 indentation points for each sample. Due to the high heterogeneity across the rock surface, a great number of indentation points were measured using the grid indentation mode, which allows for statistical analysis of the rock microscopic mechanical properties. During the test, the nanoindenter was pressed into the shale surface at a loading rate of 100 μN/s, held in place for 5 s as soon as the load reaches the maximum value of 1 mN, and then gradually popped out of the shale surface at an unloading rate of 100 μN/s. Its displacement-load path is shown in Figure 3.
Theory
According to the relationship between indentation and load (specifically, the proportional relationship between the maximum load Fmax adopted in the test and the contact area Ac of sample) (Oliver and Pharr, 1992), the rock hardness H can be expressed as:
where, Fmax is the maximum load in N, and Ac is the projected contact area in m2.
The contact stiffness S of the sample can be obtained from the initial slope of the unloading section as:
where S is the contact stiffness in kN/mm.
Fracture toughness can be determined via the energy analysis (Cheng et al., 2002). In the operation process of nanoindentation, the total energy U is composed of elastic energy Ue and plastic energy Up. As irreversible energy, Up can be further decomposed into pure plastic energy Upp and fracture energy Ufrac. Therefore, the following equation is obtained:
where U is the total energy in J; Ue is the elastic energy in J; Up is the plastic energy in J; Upp is the pure plastic energy in J; Ufrac is the fracture energy in J. Ue and Up can be obtained from the diagram of load vs. displacement, as shown in Figure 4.
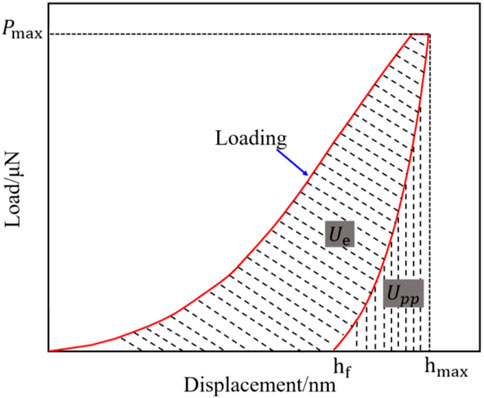
FIGURE 4. Ue and Up in the diagram of load vs. displacement.
The relationship between UPP and U is as follows:
The propagation of fractures generates Ufrac, and the corresponding critical energy release rate Gc can be obtained using the following equation:
where, Gc is the critical energy release rate in N/m; Am is the maximum fracture area in m2, calculated using the relationship between the indenter depth and area.
The fracture toughness Kic can be calculated using the following equation:
Test Results
Mineral Analysis Results
The bulk mineral composition is listed in Table 1, which varies greatly among different samples. Quartz and clay minerals are two main mineral component, with the content of 14.6–30.8% and 6.2–50.1%, respectively. Other minerals include apatite, plagioclase, calcite, dolomite, etc. The samples from the Bohai Bay Basin presents the calcite content as high as 20.2%, while other samples almost contain no calcite. Table 2 shows that there are remarkable differences in the relative composition of clay minerals. The samples from the Ordos and Songliao Basins have high relative content of I/S, while the samples from the Junggar Basin have smectite content high up to 72%. As for the samples from the Bohai Bay Basin, the C/S is the main component for clay minerals, reaching 58%.
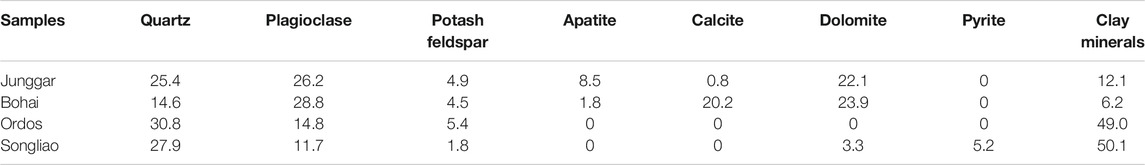
TABLE 1. Composition of bulk minerals.
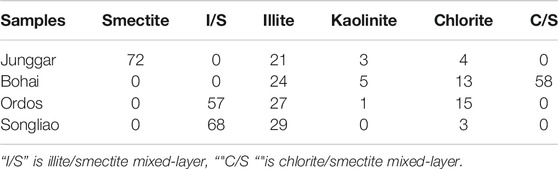
TABLE 2. Composition of clay minerals.
Figure 5 presents the histograms of the compositions of bulk minerals and clay minerals. The samples from the Songliao and Ordos Basins have similar compositions, which are greatly different from those of the samples from the other two basins.
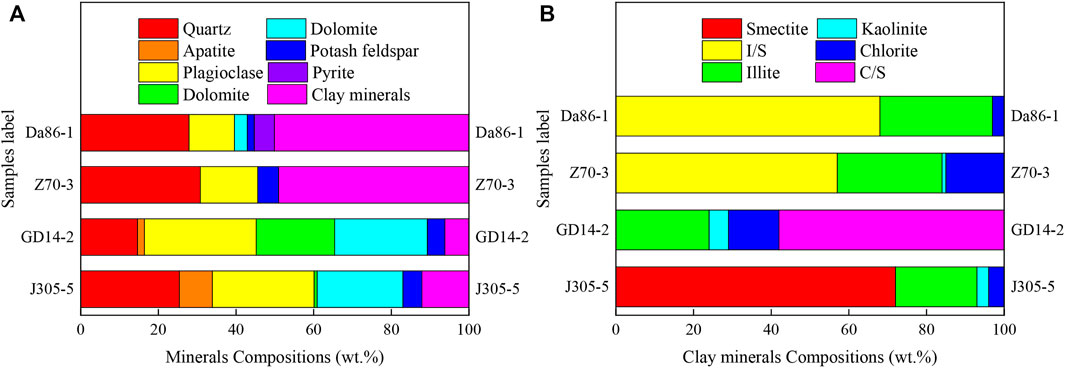
FIGURE 5. Histograms for compositions of (A) bulk minerals and clay minerals (B).
Microscopic Pore Characteristics
SEM analysis is used to study different pore sizes, pore types, and micro-fractures. Figure 6 shows the typical SEM images of rock samples from four basins. Most of the pore sizes are at the micro/nano scale and some organic matter also occurs. The pore types include residual intergranular pores and feldspar dissolution pores. There is also locally-developed calcite. There are prominent micro-fractures in some reservoir rocks. In addition to the initial pores on the surface of shale, there are also many pores caused by the whole or partial exfoliation of massive minerals. And beyond that, there are also microscopic fissures developed at the edges of the mineral grains and pores throughout the mineral grains. The pore structure is affected by the sedimentary environment, and the geological structure has a great impact on the pore structure (Yang et al., 2016; Lin et al., 2017).

FIGURE 6. SEM images. (A) Ordos Basin. (B) Junggar Basin. (C) Bohai Bay Basin. (D) Songliao Basin.
Results of Nanoindentation
Figure 7 shows the calculated frequency distribution of the grid hardness for the four basins. For the Junggar Basin, the maximum hardness is 9.704 GPa, the minimum is 0.232 GPa, averaging 3.466 GPa, and the hardness is mainly distributed in the range of 0.232–4 GPa. For the Songliao Basin, the hardness presents a maximum of 6.231 GPa, and a minimum of 0.217 GPa, averaging 2.215 GPa, and is mainly distributed in the range of 0.2–1 GPa. For the Bohai Bay Basin, the maximum hardness is 5.692 GPa, the minimum is 0.296 GPa, averaging 3.225 GPa, and the hardness is mainly distributed in the range of 3.5–5 GPa. For the Ordos Basin, the maximum and minimum hardness is 8.614 and 0.176 GPa, respectively, with an average of 2.796 GPa, and the hardness is mainly distributed in the range of 0.176–3 GPa. It can be concluded that the Junggar Basin has the largest average hardness, while the Songliao Basin has the smallest average value.
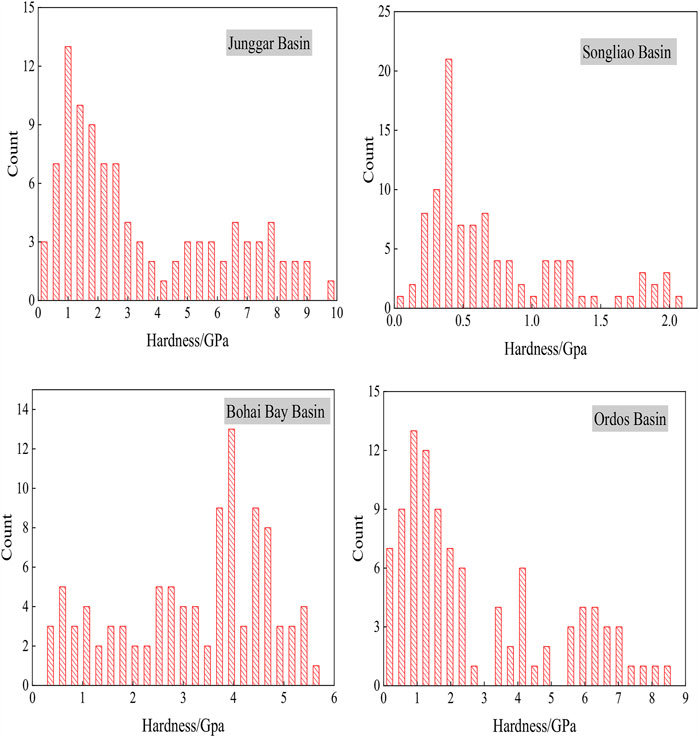
FIGURE 7. Statistical results of hardness.
Figure 8 shows the calculated frequency distribution of the grid elastic moduli for the four basins. For the Junggar Basin, the elastic modulus presents a maximum of 67.289 GPa and a minimum of 5.244 GPa, averaging 35.252 GPa; the elastic moduli are mainly distributed in the range of 15–30 GPa. For the Songliao Basin, the elastic modulus presents a maximum of 42.207 GPa and a minimum of 7.118 GPa, averaging 22.128 GPa; the elastic moduli are mainly distributed in the range of 20–50 GPa. For the Bohai Bay Basin, the elastic modulus presents a maximum of 42.287 GPa and a minimum of 9.649 GPa, averaging 26.783 GPa; the elastic moduli are mainly distributed in the range of 20–35 GPa. For the Ordos Basin, the elastic modulus presents a maximum of 53.535 GPa and a minimum of 2.281 GPa, averaging 26.903 GPa; the elastic moduli are mainly distributed in the range of 15–40 GPa. It can be concluded that the Junggar Basin has the largest average elastic modulus, while the Songliao Basin has the smallest average value.
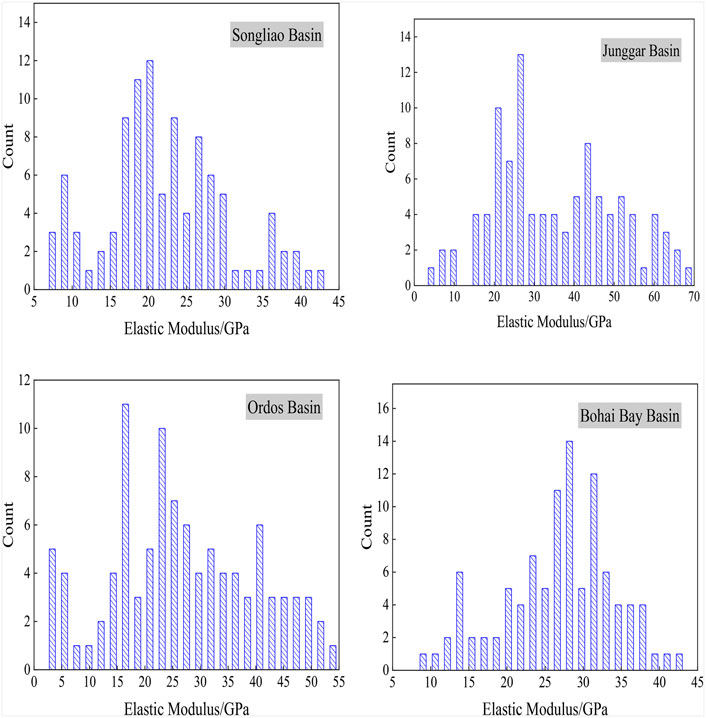
FIGURE 8. Statistical results of elastic moduli.
Figure 9 shows the calculated frequency distribution of the grid fracture toughness for the four basins. For the Junggar Basin, the fracture toughness is associated with a maximum of 26.773 MPa m1/2 and a minimum of 5.291 MPa m1/2, averaging 15.659 MPa m1/2; the fracture toughness is mainly distributed in the range of 10–20 MPa m1/2. For the Songliao Basin, the fracture toughness is associated with a maximum of 17.117 MPa m1/2 and a minimum of 4.913 MPa m1/2, averaging 10.396 MPa m1/2; the fracture toughness is mainly distributed in the range of 5–13 MPa m1/2. For the Bohai Bay Basin, the fracture toughness is associated with a maximum of 19.707 MPa m1/2 and a minimum of 5.832 MPa m1/2, averaging 14.624 MPa m1/2; the fracture toughness is mainly distributed in the range of 14–20 MPa m1/2. For the Ordos Basin, the fracture toughness is associated with a maximum of 24.379 MPa m1/2 and a minimum of 3.616 MPa m1/2, averaging 13.646 MPa m1/2; the fracture toughness is mainly distributed in the range of 8–18 MPa m1/2. It can be concluded that the Bohai Bay Basin has the largest average fracture toughness, while the Songliao Basin has the smallest average value.
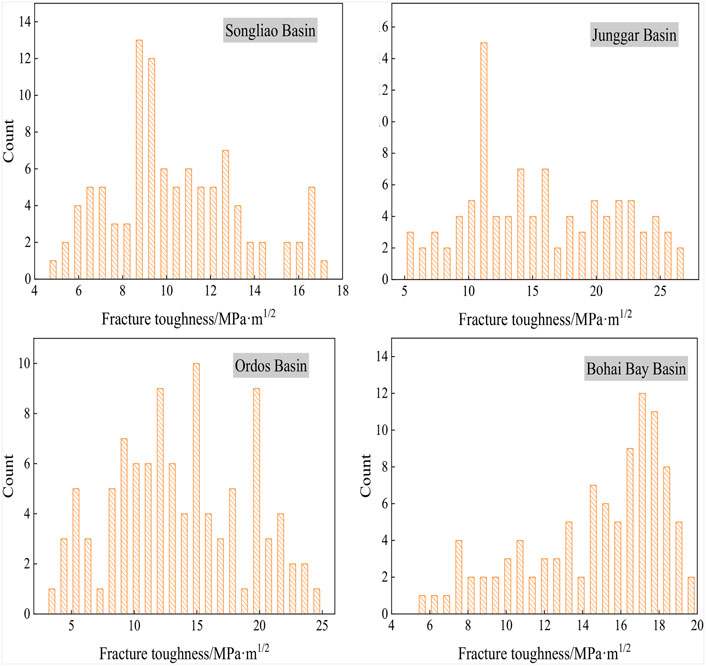
FIGURE 9. Statistical results of fracture toughness.
Discussion
Brittleness Index K1
In the elastic deformation stage of materials, the stress is directly proportional to the strain, which conforms to the Hooke’s Law. The ratio of the two is termed the elastic modulus Er of the material. The greater the Er value is, the higher the shale fracability is, which indicates a positive correlation between the two. Hardness H refers to the ability of shale to resist hard materials pressing into its local surface. The greater the H value is, the higher the shale fracability (also a positive correlation). Fracture toughness Kc refers to the ability of shale to prevent the crack from progagating and is a quantitative indicator to measure the toughness of materials. The greater the Kc value is, the lower the shale fracability is (a negative correlation). According to the relationships between the above relevant variables and shale fracability, the shale fracability is positively correlated with the brittleness index K1 defined as below:
As shown in Eq. 6, the dimension of the fracability coefficient K1 is m−1. For convenience of the subsequent analysis and discussion, K1 has multiplied with a unit length to obtain a dimensionless index. Figure 10 shows the distribution of mechanical parameters for the four basins. The K1 values for all of the four basins are obtained, which are shown in Table 3.
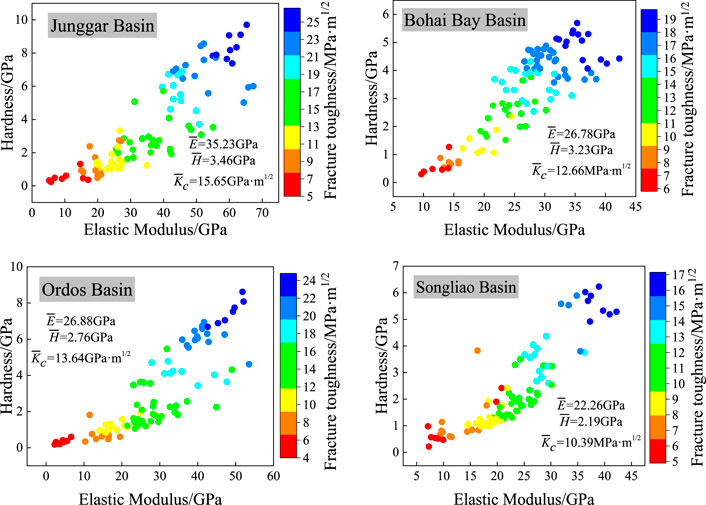
FIGURE 10. Distribution of mechanical parameters for the four basins.
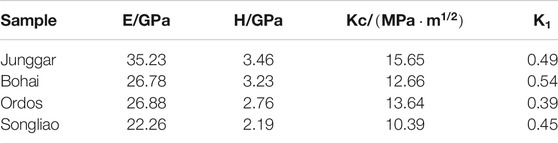
TABLE 3. Calculation of the fracability coefficient K1.
Based on the brittleness index K1 calculated using the above equation, a comprehensive evaluation was made for the fracability of the shale in the four basins. The shale in the Junggar Basin has high fracability coefficient K1 values mainly of 0.4–0.6 (averaging 0.49), due to that it has the largest elastic modulus and hardness. The shale in the Bohai Bay Basin has low fracability coefficient K1 values mainly of 0.3–0.5 (averaging 0.4), owing to its lower elastic modulus and hardness. The shale in the Songliao Basin is associated with the fracability coefficient K1 of 0.3–0.8 (averaging 0.45), and that in the Ordos Basin has the fracability coefficient K1 values of 0.3–0.5 (averaging 0.39, the lowest). However, the average K1 values of the shale in the four basins are found with only minor differences.
Brittleness Index K2
m is a parameter for the Weibull distribution, known as the Weibull modulus. In this research, the higher the m values of corresponding mechanical parameters (such as elastic modulus and hardness) are, the less the discreteness of parameter x is, which implies less discreteness of corresponding mechanical parameters of rock and thus lower rock heterogeneity. Therefore, the higher the 1/m value is, the higher the heterogeneity is. β represents the proportion of special load-displacement curves featuring fractures and pores to the total curves. The larger the β value is, the stronger the heterogeneity is. Hence, β/m is used to evaluate the heterogeneity—the larger the β/m value is, the greater the heterogeneity is.
Figures 11 and 12 show the heterogeneity coefficient β and m for the four regions, respectively. And then the brittleness index K2 is calculated, as shown in Table 4. The samples from the Bohai Bay Basin have the largest proportion of curves featuring fractures and pores, and thus higher heterogeneity. The calculated fracability coefficient K2 of the shale is the highest in the Bohai Bay Basin (7.01) and the lowest in the Songliao Basin (4.08).
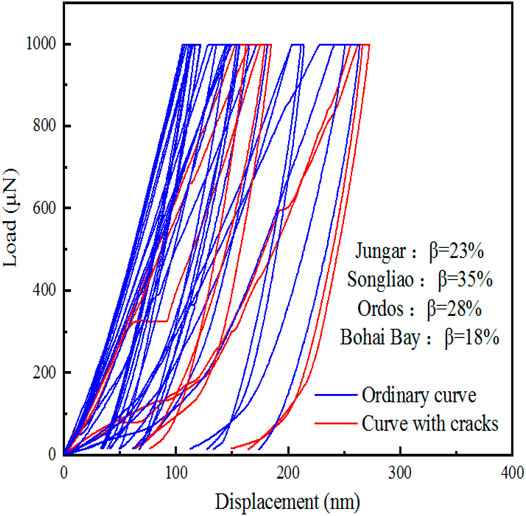
FIGURE 11. Heterogeneity coefficient β for the four basins.
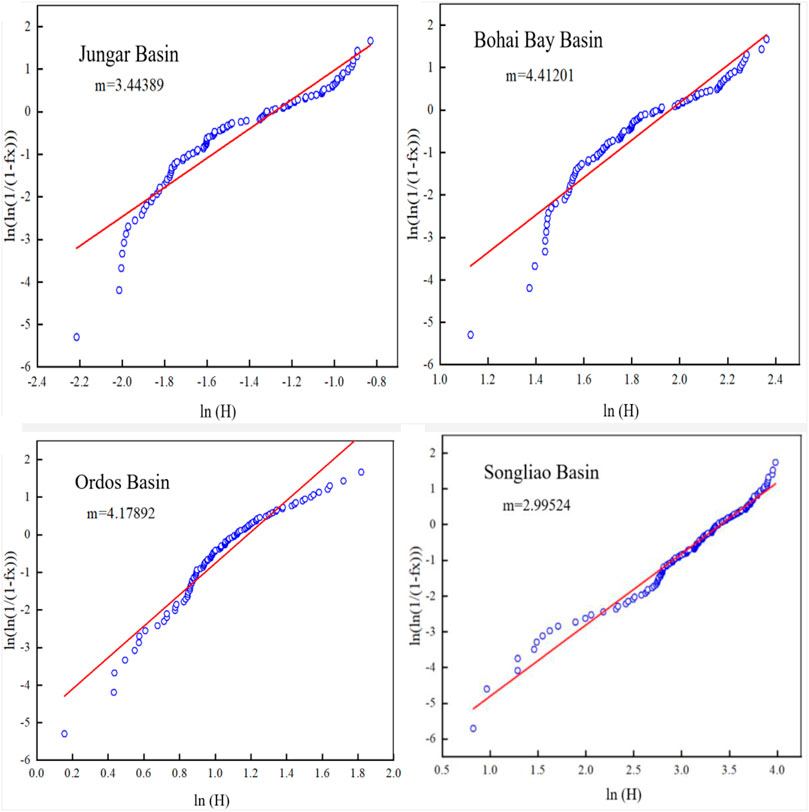
FIGURE 12. Heterogeneity coefficient m for the four basins.
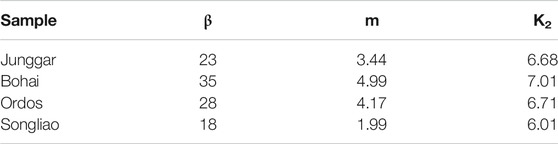
TABLE 4. Calculation of the fracability coefficient K2.
Brittleness Index K3
The brittleness index characterizes the difficulties in creating complex fracture networks by hydraulic fracturing. With a higher brittleness index, the reservoir is more sensitive to fracturing and the resultant fractures are more complex. The elastic modulus reflects the ability of shale to preserve the fractures after being fractured. Some researchers analyzed the kerogen morphology and nanomechanical properties of oil shale cored in different directions (parallel and perpendicular to the bedding plane) (Alstadt et al., 2016).
As shown in Figures 13, 14, there is usually a great difference between the elastic moduli in the horizontal and vertical bedding directions. A greater difference is preferred for fractures to propagate along the bedding plane.
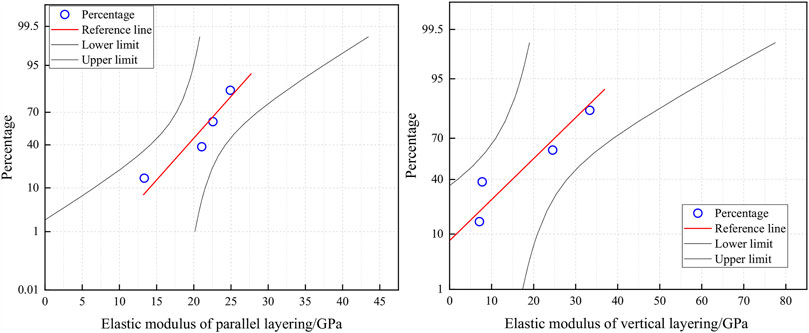
FIGURE 13. Normal distribution of elastic moduli parallel to and perpendicular to beddings.
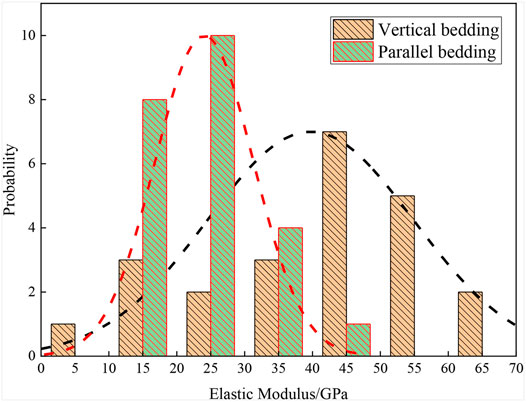
FIGURE 14. Distribution of elastic moduli parallel and perpendicular to beddings.
The ratio between the elastic moduli in the directions in relation to the bedding plane is directly related to the fracability, so the ratio of the elastic modulus parallel to the bedding plane to that perpendicular to the bedding plane can be used to represent brittleness. Therefore, the fracability coefficient K3 is defined as below:
where
Based on upscaling and analysis of the nanoindentation test data, the elastic moduli of shale parallel and perpendicular to beddings at the centimeter scale were obtained, and a new model to calculate the brittleness index was established. The calculated brittleness index K3 is shown in Table 5. For samples from the Ordos Basin, there is a great difference between samples parallel and perpendicular to beddings, and the fracability coefficient K3 is the largest (2.01). For samples from the Songliao Basin, the difference between samples parallel and perpendicular to beddings is the smallest, and the fracability coefficient K3 is thus the lowest (1.27).
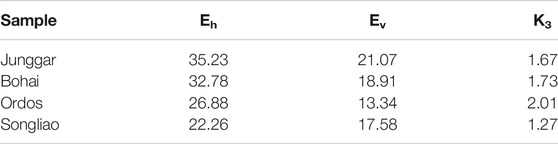
TABLE 5. Calculation of the fracability coefficient K3.
Three-Parameter Evaluation
The three fracability coefficients K1, K2, and K3 based on the nanoindentation test are all dimensionless and the sum of them can characterize the overall fracability of shale. In addition, weight factors α1, α2 and α3 should be defined for the summation to represent the impact degree of each fracability coefficient on the overall fracability. To this end, four cases are discussed in this research. First, assuming α1+α2+α3 = 1 and all the three indexes produce the same impact (in other words,
The calculated brittleness index B with different α1, α2, and α3 values for each basin is shown in Table 6 and Figure 15. Except for Case 4, the Bohai Bay Basin has the most distinctive fracability. In Cases 1 and 3, there is little difference in fracability between the Junggar and Ordos Basins. In Figure 16, the fracability based on the mineral composition analyzed from the rock cutting are compared. Figure 17 shows the microscopic comprehensive evaluation for the producibility of the continental shale oil in the four basins by previous research (Jin et al., 2021). Comparison shows that Case 2 is more consistent with the field conditions. Therefore, α1 = 0.85, α2 = 0.03, and α3 = 0.12 are used, and the above equation is rewritten as:
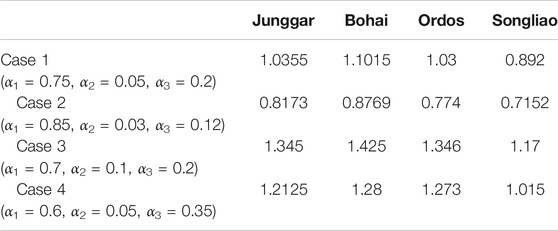
TABLE 6. Fracability in cases of different values of weight factors.
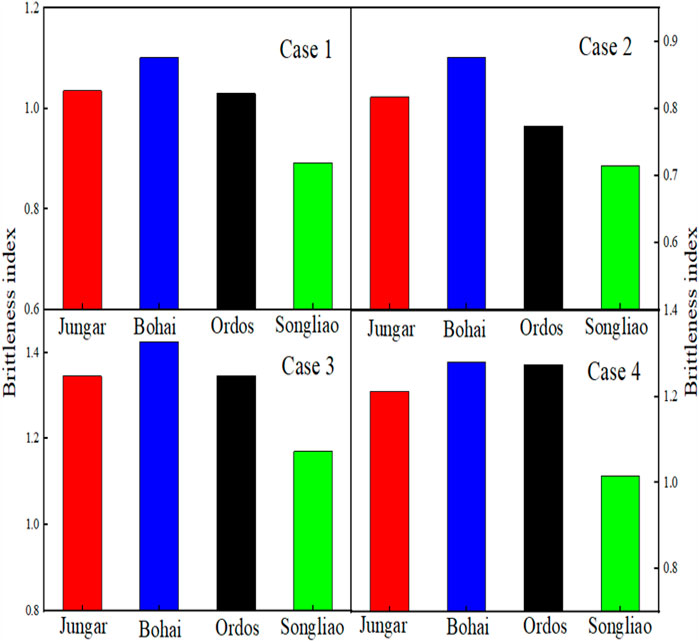
FIGURE 15. Overall fracability for all the four basins in the four cases.
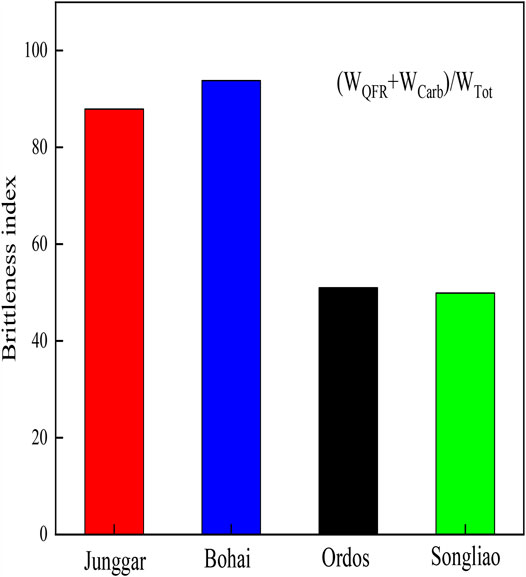
FIGURE 16. Fracability based on mineral composition.
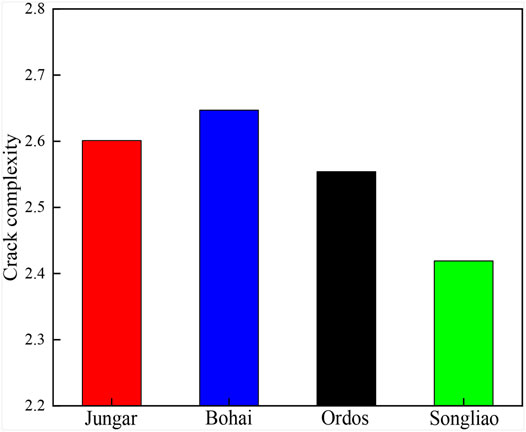
FIGURE 17. Microscopic comprehensive evaluation for shale oil producibility (Jin et al., 2021).
As shown in Figure 18, the fracability of the shale reservoir is determined from the perspectives of the point (K1), area (K2), and volume (K3) parameters and the 3D distribution of fracability is obtained. The redder the color in the figure is, the greater the fracability is; the bluer the color is, the lower the fracability is.
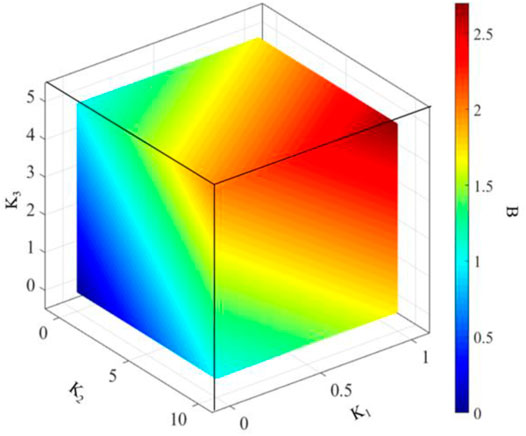
FIGURE 18. 3D distribution of fracability.
Conclusion
This research addresses the typical continental shale of the Bohai Bay, Ordos, Songliao, and Junggar Basins in China. via the XRD mineral analysis, SEM, and nanoindentation test using the grid indentation testing mode, the elastic modulus, hardness, and fracture toughness of rocks are obtained. Furthermore, the three fracability parameters K1, K2, and K3 are obtained by analyzing the measured mechanical parameters, resulting in the ultimate fracability coefficient B = 0.7K1+0.1K2+0.2K3.
1) The point fracability coefficient is obtained:
2) The area fracability coefficient is obtained:
3) The volume fracability coefficient is obtained:
4) With the sum of the three subordinate fracability coefficients, the overall fracability of shale is characterized. In addition, weight factors α1, α2, and α3 should be defined for the summation to represent the impact degrees of the three parameters on fracability. With the composition of minerals taken into account, the weight factors are finally determined as: α1 = 0.85, α2 = 0.03, and α3 = 0.12, and in other words, the ultimate fracability index B = 0.85K1+0.03K2+0.12K3.
Data Availability Statement
The raw data supporting the conclusions of this article will be made available by the authors, without undue reservation.
Author Contributions
All authors contributed to the conceptualization, methodology and manuscript preparation.
Funding
The research was funded by National Key R&D Program of China (2018YFE0196000) and Foundation Program for Directly Affiliated Institutions of CNPC (2019D-500808).
Conflict of Interest
DL was employed by the PetroChina Daqing Oilfield Co., Ltd.
The remaining authors declare that the research was conducted in the absence of any commercial or financial relationships that could be construed as a potential conflict of interest.
Publisher’s Note
All claims expressed in this article are solely those of the authors and do not necessarily represent those of their affiliated organizations, or those of the publisher, the editors and the reviewers. Any product that may be evaluated in this article, orclaim that may be made by its manufacturer, is not guaranteed or endorsed by the publisher.
References
Ai, C., Zhang, J., Li, Y.-w., Zeng, J., Yang, X.-l., and Wang, J.-g. (2016). Estimation Criteria for Rock Brittleness Based on Energy Analysis during the Rupturing Process. Rock Mech. Rock Eng. 49 (12), 4681–4698. doi:10.1007/s00603-016-1078-x
Alstadt, K. N., Katti, K. S., and Katti, D. R. (2016). Nanoscale Morphology of Kerogen and In Situ Nanomechanical Properties of Green River Oil Shale. J. Nanomech. Micromech. 6 (1), 04015003. doi:10.1061/(ASCE)NM.2153-5477.0000103
Chen, J., Cao, H., and Sun, P. (2017). Fracability Evaluation of Shale in the Niutitang Formation in Northwestern Hunan. Earth Sci. Front. 24 (6), 390–398. doi:10.13745/j.esf.yx.2017-2-50
Cheng, Y., Li, Z., and Cheng, C. (2002). Scaling Relationships for Indentation Measurements. Philos. Magazine A 82, 1821–1829. doi:10.1080/01418610208235693
Di, S., Hong, J., Lv, P., Ye, W., Li, H., Zhang, J., et al. (2019). Method for Fracturability Evaluation of Tight Oil Reservoirs in the Shulu Sag. Well Logg. Technol. 43 (5), 536–541. doi:10.16489/j.issn.1004-1338.2019.05.018
Jin, X., Li, G., Meng, S., Wang, X., Liu, C., Tao, J., et al. (2021). Microscale Comprehensive Evaluation of continental Shale Oil Recoverability. Pet. Exploration Develop. 40 (01), 256–268. doi:10.1016/s1876-3804(21)60021-6
Kumar, V., Curtis, M. E., Gupta, N., Sondergeld, C. H., and Rai, C. S. “Estimation of Elastic Properties of Organic Matter and Woodford Shale through Nano-Indentation Measurements,” in Proceedings of the Society of Petroleum Engineers - SPE Canadian Unconventional Resources Conference 2012, Calgary, Alberta, Canada, October-November 2012. doi:10.2118/162778-MS
Li, Y., Jia, D., Rui, Z., Peng, J., Fu, C., and Zhang, J. (2017). Evaluation Method of Rock Brittleness Based on Statistical Constitutive Relations for Rock Damage. J. Pet. Sci. Eng. 153, 123–132. doi:10.1016/j.petrol.2017.03.041
Lin, D., Wang, J., Yuan, B., and Shen, Y. (2017). Review on Gas Flow and Recovery in Unconventional Porous Rocks. Adv. Geo-energ. Res. 1 (1), 39–53. doi:10.26804/ager.2017.01.04
Liu, K., and Ostadhassan, M. (2017). Microstructural and Geomechanical Analysis of Bakken Shale at Nanoscale. J. Pet. Sci. Eng. 153, 133–144. doi:10.1016/j.petrol.2017.03.039
Manjunath, G. L., and Jha, B. (20192038). Nanoscale Fracture Mechanics of Gondwana Coal. Int. J. Coal Geology. 204, 102–112. doi:10.1016/j.coal.2019.02.007
Mao, S., Zhang, Z., Chun, T., and Wu, K. (2021). Field-Scale Numerical Investigation of Proppant Transport Among Multicluster Hydraulic Fractures. SPE J. 26 (1), 307–323. doi:10.2118/203834-PA
Oliver, W. C., and Pharr, G. M. (1992). An Improved Technique for Determining Hardness and Elastic Modulus Using Load and Displacement Sensing Indentation Experiments. J. Mater. Res. 7 (6), 1564–1583. doi:10.1557/JMR.1992.1564
Shukla, P., Taneja, S., Sondergeld, C., and Rai, C. (2015). Nanoindentation Measurements on Rocks. Fracture, Fatigue, Fail. Damage Evol. 5, 99–105. doi:10.1007/978-3-319-06977-7_13
Qin, H., and Yang, X. (2019). Study on Interpretation Method of Brittleness Logging in Tight Reservoir. Well Logg. Technol. 43 (5), 509–513 & 530. doi:10.16489/j.issn.1004-1338.2019.05.013
Tang, J., Wu, K., Zuo, L., Xiao, L., Sun, S., and Ehlig–Economides, C. (2019). Investigation of Rupture and Slip Mechanisms of Hydraulic Fractures in Multiple-Layered Formations. SPE J. 24 (5), 2292–2307. doi:10.2118/197054-PA
Xie, J., Tang, J., Yong, R., Fan, Y., Zuo, L., Chen, X., et al. (2020). A 3-D Hydraulic Fracture Propagation Model Applied for Shale Gas Reservoirs with Multiple Bedding Planes. Eng. Fracture Mech. 228, 106872. doi:10.1016/j.engfracmech.2020.106872
Yang, L., Chen, C., Liu, Y., and Zheng, Y. (2020). A Comparative Study of Ion Diffusion during Water Imbibition in Shale, sandstone and Volcanic Rock. Capillarity 3 (2), 16–27. doi:10.46690/capi.2020.02.01
Yang, L., Ge, H., Shi, X., Cheng, Y., Zhang, K., Chen, H., et al. (2016). The Effect of Microstructure and Rock Mineralogy on Water Imbibition Characteristics in Tight Reservoirs. J. Nat. Gas Sci. Eng. 34, 1461–1471. doi:10.1016/j.jngse.2016.01.002
Yuan, J., Deng, J., Zhang, D., Li, D., Yan, W., Chen, C., et al. (2013). Fracability Evaluation of Shale-Gas Reservoirs. Acta Pertolei Sinica 34 (3), 523–527. doi:10.7623/syxb201303015
Zhang, F., An, M., Zhang, L., Fang, Y., and Elsworth, D. (2020). Effect of Mineralogy on Friction-Dilation Relationships for Simulated Faults: Implications for Permeability Evolution in Caprock Faults. Geosci. Front. 11 (2), 439–450. CNKI:SUN:GSFT.0.2020-02-008. doi:10.1016/j.gsf.2019.05.014
Zhang, J., Ai, C., Li, Y.-w., Che, M.-G., Gao, R., and Zeng, J. (2018a). Energy-based Brittleness index and Acoustic Emission Characteristics of Anisotropic Coal under Triaxial Stress Condition. Rock Mech. Rock Eng. 51, 3343–3360. doi:10.1007/s00603-018-1535-9
Zhang, J., Li, Y., Pan, Y., Wang, X., Yan, M., Shi, X., et al. (2021). Experiments and Analysis on the Influence of Multiple Closed Cemented Natural Fractures on Hydraulic Fracture Propagation in a Tight sandstone Reservoir. Eng. Geology. 281, 105981. doi:10.1016/j.enggeo.2020.105981
Zhang, Y., Lebedev, M., Al-Yaseri, A., Yu, H., Xu, X., Sarmadivaleh, M., et al. (2018b). Nanoscale Rock Mechanical Property Changes in Heterogeneous Coal after Water Adsorption. Fuel 218, 23–32. doi:10.1016/j.fuel.2018.01.006
Keywords: nanoindentation, shale, brittleness index, fracability, mechanical properties
Citation: Meng S, Li D, Wang Q, Tao J, Su J, Li H, Jin X and Yang L (2021) Nanoindentation-Based Three-Parameter Fracability Evaluation Method for Continental Shales. Front. Earth Sci. 9:797405. doi: 10.3389/feart.2021.797405
Received: 18 October 2021; Accepted: 01 December 2021;
Published: 23 December 2021.
Edited by:
Yuwei Li, Liaoning University, ChinaReviewed by:
Jiawei Li, Texas A&M University, United StatesJun Zhang, Northeast Petroleum University, China
Copyright © 2021 Meng, Li, Wang, Tao, Su, Li, Jin and Yang. This is an open-access article distributed under the terms of the Creative Commons Attribution License (CC BY). The use, distribution or reproduction in other forums is permitted, provided the original author(s) and the copyright owner(s) are credited and that the original publication in this journal is cited, in accordance with accepted academic practice. No use, distribution or reproduction is permitted which does not comply with these terms.
*Correspondence: Xu Jin, jinxu@petrochina.com.cn; Liu Yang, shidayangliu@126.com