Exploration Process and Genesis Mechanism of Deep Geothermal Resources in the North Jiangsu Basin, East China: From Nothing to Something
 Yibo Wang1,2
  Yang Bai3
  Lijuan Wang4 Junpeng Guan4
  Yaqi Wang1,2,5*
  Zhuting Wang6 Jie Hu7 Shengbiao Hu1,2,5
- 1State Key Laboratory of Lithospheric Evolution, Institute of Geology and Geophysics, Chinese Academy of Sciences, Beijing, China
- 2Innovation Academy for Earth Science, Chinese Academy of Sciences, Beijing, China
- 3College of Mining Engineering, Taiyuan University of Technology, Taiyuan, China
- 4Key Laboratory of Earth Fissures Geological Disaster, Ministry of Land and Resources, Geological Survey of Jiangsu, Nanjing, China
- 5College of Earth and Planetary Sciences, University of Chinese Academy of Sciences, Beijing, China
- 6School of Mines, China University of Mining and Technology, Xuzhou, China
- 7State Key Laboratory of Oil and Gas Reservoir Geology and Exploitation, Chengdu University of Technology, Chengdu, China
Geothermal resources, as an important member of clean renewable energy, of which the exploration, development, and utilization of geothermal resources, especially deep geothermal resources, are of great significance for achieving carbon peaking and carbon neutrality. Taking the North Jiangsu Basin (NJB) as an example, this paper reviews the exploration process of deep geothermal resources in the basin and presents the latest results. The study shows that the NJB is a typical “hot basin” with an average heat flow value of 68 mW/m2. In this region, the deep geothermal resource favorable areas in the NJB are mainly distributed in the depressions, in particular those near the Jianhu uplift, i.e., the Yanfu depression and the Dongtai depression. In addition, the genesis mechanism of the deep geothermal resource favorable area in the NJB is best explained by the “two stages, two sources” thermal concentration, that is, “two stages” means that the transformation of the lithospheric thermal regime are caused by the late Mesozoic craton destruction in East China, and the Cenozoic lithospheric extension; these two tectono-thermal events together lead to the deep anomalous mantle-source heat (the first source), and the upper crustal-scale heat control is mainly caused by thermal refraction (the second source). Overall, this case study underlines new ideas of understanding the geothermal genesis mechanism in East China, which can guide for the exploration and development of deep geothermal resources at the basin scale.
Introduction
The deepening energy crisis and increasing environmental pollution force humans to focus more on new energy sources. Solar and wind energy have made great progress in recent years, while the more widely distributed, low-carbon, and sustainable geothermal energy has lagged, accounting for a small proportion of the total new energy. Geothermal energy that can be used around the clock is more stable and universal than wind and solar energyin addition, it is cleaner and safer than nuclear energy (Lund and Toth, 2020; Tester et al., 2006). The widespread use of geothermal energy can fill the gap left by wind and solar energy subject to weather changes, so that clean renewable energy, including geothermal energy, wind, and solar energy, can play a more substantial role in a country’s energy structure and effectively promote the development of low-carbon economy (Hou et al., 2018; Zhu et al., 2015). The Chinese government has committed to adopt strong policies and measures to peak CO2 emissions by 2030 (emission peak) and strive to achieve carbon neutrality by 2060. Undoubtedly, geothermal utilization will contribute enormously to this process.
North Jiangsu Basin (NJB) that located in Jiangsu Province is a very favorable area to carry out geothermal development and utilization in China at present for the following reasons: 1) The NJB is a typical “hot summer and cold winter” area with a strong heating demand market, and the high population density and energy consumption in the area enhance the feasibility of adopting geothermal heating; 2) detailed geological information guarantee for the development and utilization of geothermal resources; 3) a strong economic base is an important driving force for the efficient utilization of geothermal resources in the NJB, and 4) it also provides an possible model for the future utilization of geothermal resources in the Yangtze River Delta region. Overall, this case study guides the exploration and development of deep geothermal resources in the basin, as well as enrich the genesis mechanism of geothermal characteristics in the Lower Yangtze from the spatio-temporal perspective.
This paper updates and summarizes high-quality temperature profiles from representative wells drilled in the NJB, establishes columns of thermal conductivity, density, and porosity throughout the NJB formations (or rocks) of different geological ages. In this study, characteristics of the deep temperature field distribution in the NJB are analyzed to reveal the geothermal resource potential, in combining with geological and geophysical data, to comprehensively discuss the genesis mechanism and dynamical background of the present-day thermal state of the NJB.
Geologic Setting
The NJB generally trends NE-SW, covering an area of about 35,000 km2. The main body of the NJB is located in the northern part of Jiangsu province, adjacent to the Binhai uplift in the north, connected to the Lusu uplift in the northwest, adjacent to the Su’nan uplift in the south, and deep into the South Yellow Sea in the east, belonging to the onshore part of the North Jiangsu-South Yellow Sea Basin (Figure 1). Tectonically, the NJB belongs to the back-arc area of the Meso-Cenozoic West Pacific tectonic domain and is part of the Lower Yangtze Craton. The tectonic pattern of “one uplift (Jianhu uplift in the middle) and two depressions (the northern Yanfu depression, and the southern Dongtai depression)" in the NJB can be further subdivided into 22 highs and sags (Figure 1).
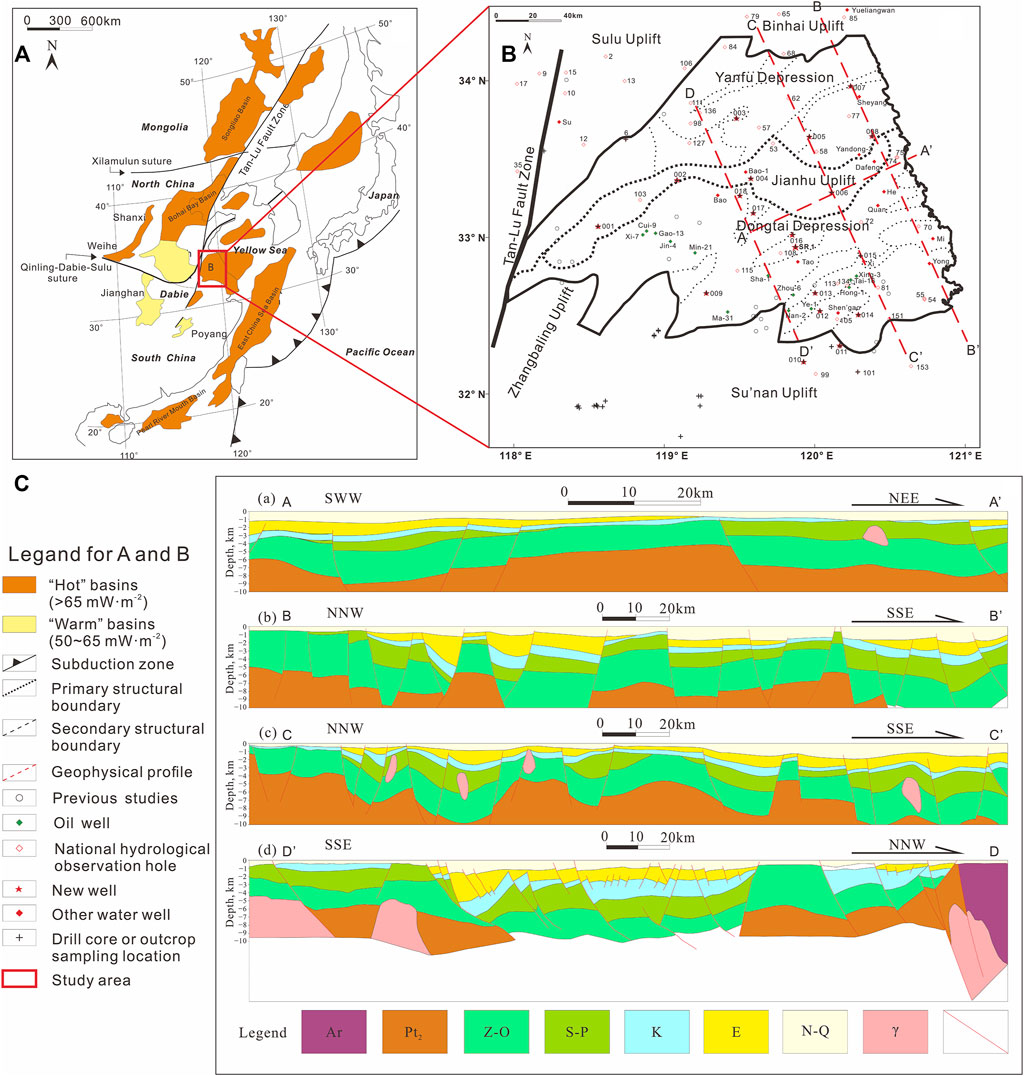
FIGURE 1. Tectonic, geological interpretation sections and geothermal information of the North Jiangsu Basin. (A) is modified after Grimmer et al. (2002); (B) is modified after Wang et al. (2020), Wang et al. (2021a); (C) (a, b, c) are integrated geological profiles with joint inversion of resistivity, gravity, and magnetic data, and (C) (d) is depth-converted seismic interpretation, (C) (a, c) are modified from Wang et al. (2020), (b) is from Wang et al. (2021a), (d) is integrated from Chen (2010) and Qiao et al. (2012).
The NJB is a Middle Cenozoic fracture-depression type sedimentary basin which dominated by the Tertiary formation, and the Late Cretaceous Taizhou Formation to Tertiary lacustrine-riverine strata are developed, with the maximum sedimentary thickness of about 7 km (Figure 2). The Pre-Jurassic formations form the basement of the NJB, where the Pre-Permian strata are buried (Shu et al., 2005). The Late Cretaceous-Tertiary strata of the NJB is divided into the Taizhou Formation (K2t), the Fu’ning Formation (E1f), the Dai’nan Formation (E2d), the Sanduo Formation (E2s), the Yancheng Formation (Ny), and the Dongtai Formation (Qd) from the bottom up (Shu et al., 2005). The lithology and characteristics of strata in the NJB are shown in Table 1.
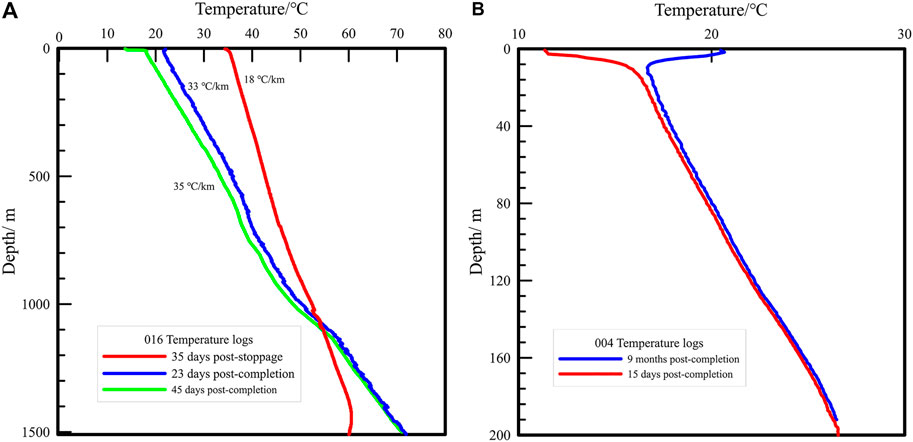
FIGURE 2. The difference between unsteady temperature measurement and steady-state temperature measurement.
TABLE 1. Representative strata of the North Jiangsu Basin (Revised from Wang (2020) and oil company reports).
During the Triassic, the NJB was uplifted by the collision of the North China Craton and the Yangtze Craton, and possible southward extrusion of the Siberian plate (Guo et al., 2012; Yin and Nie, 1993). Since then, the NJB is primarily characterized by four main stages of tectonic evolution: 1) Yizheng movement (ca. 83 Ma), which is marked by the Taizhou Formation unconformity overlying the Chishan or Pukou Formations, forming the tectonic pattern of “two uplifts and one depression”; 2) Wubao movement (ca. 55 Ma), the low-angle unconformity of the Dai’nan Formation overlies the Fu’ning Formation; 3) Zhenwu movement (about 50 Ma), the Dai’nan Formation is unconformably overlain by the Sanduo Formation; 4) Sanduo movement (ca. 38–25 Ma), the Yancheng Formation unconformably overlies the Sanduo Formation, with Neocene-Quaternary fluvial facies (Qian, 2001; Shu et al., 2005; Qiu et al., 2006).
Proposed geothermal study of the NJB include two main parts before 2005: 1) the deep temperature field study based on the existing test oil temperature (Wang, 1989; Wang et al., 1995); 2) the thermal history inversion work based on the present-day geothermal field, and the exploration of the relationship between heat and oil and gas (Wang, 1987; Wang, 1989; Zeng, 2005). Since 2018, the Geological Survey of Jiangsu Province and the Institute of Geology and Geosciences of the Chinese Academy of Sciences have carried out a lot of drilling, coring, steady-state temperature measurement, thermal property testing, and numerical simulation. The process of above work is as follows: 1) laying and drilling of boreholes; 2) census of the NJB geothermal field; 3) identification of key target areas; 4) detailed investigation of target areas; 5) laying and drilling of pilot holes; 6) numerical simulation study; 7) finalization of deep hole points. Besides, steady-state temperature monitoring, fracturing, and pumping tests are steadily being planned and advanced.
Steady-State Temperature Logs
From November 2018 to January 2019, we designed and constructed fifteen 200-m-deep boreholes with full well coring, numbered 001–015 in Figure 1. In 2019, we constructed three geothermal wells (800–1500 m) in the preliminary target area, numbered 016–018 (Figure (B)). Finally, in 2020–2021, a 4700 m deep well (SR1 in Figure 1B) was drilled to validate previous studies and provide the basis for further work. During this period, we carried out steady-state temperature measurements on 104 wells in the NJB and its adjacent area and calculated 78 high-quality heat flow values, based on which heat flow maps of the NJB (Figure 1A).
Steady-State Temperature Measurement
Borehole temperature measurement is the most effective and direct means of obtaining the present-day temperature field. Systematic steady-state temperature measurement refers to temperature measurement performed after the temperature in the borehole has reached the in-situ temperature of the formation. The drilling process severely affects the borehole temperature, mainly in the circulation of drilling fluid and frictional heat generation. Therefore, a considerable period is needed to recover the formation temperature from the end of drilling to the time of temperature measurement. Yu (1991) estimated the time required for recovery of drilling disturbance temperature: 0.5–1.5 times and 10–20 times of drilling time is required to recover 90 and 99% of formation temperature, respectively.
Although temperature measurements are required in most completion reports of a borehole, the vast majority of tests are conducted within 2 days of completion and cannot meet the requirements for the regional thermal regime studies. The temperature measurement curves of Borehole 016 (1500 m; drilling time, 37 days; mud circulation time, 2 days) in the NJB at 35 days post-stoppage, 23 days post-completion, and 45 days post-completion shows that the temperature at the neutral point gradually decreases at the shallow end and increases at the deep end as the time of static well progresses (Figure 2A). The ground temperature gradient at 45 days post-completion is about twice the initial measured ground temperature gradient and combined with the drilling time, the temperature data is usually considered as steady-state temperature measurement data. More recently, the steady-state temperature measurement conditions can be achieved after tens of days of static wells. As shown in Figure 2B, the deep temperature measurement curves of Borehole 004 (200 m; drilling time, 7 days; no mud circulation) do not differ much between 15 days and 9 months after completion, as such, the temperature measurement after 15 days of completion has reached the steady-state temperature measurement condition. In summary, drilling depth, drilling time, mud circulation time, and completion process closely affect the judgment of the steady-state condition of drilling temperature.
Temperature Logging
Geothermal work in the NJB began in the 1970s when oil companies conducted systematic temperature measurements on several exploration wells located in the southern NJB. Wang (1989) and Wang et al. (1995) collected steady-state temperature data from 21 wells and studied the geothermal field in the NJB in conjunction with the hydrostatic reservoir temperatures of 161 wells. The distribution of heat flow measurement points in the NJB and adjacent areas is generally uneven and very sparse (Figure 1).
From 2018 to 2020, temperature logs of 104 boreholes in the NJB and its adjacent areas were acquired, and the representative temperature profiles are shown in Figures 3A–G. Additionally, in this study, we collected 385 drill stem tests (DST) data from 58 boreholes in the NJB (Figure 3H). Temperature records below the water level of the borehole better reflect the true temperature of the formation, which exclude the effect of the thermal conductivity difference between air and water. We determine the water level of the borehole which is usually less than 40 m in the NJB (Figure 3) on the basis of the vertical variation of temperature, When the depth is greater than 50 m, the temperature increases linearly or nearly linearly, which is a conduction-type temperature measurement curve. Based on the temperature data, the temperature gradient of each log was calculated using the least-squares method, ranging from 22 to 59°C/km, with an average temperature of 32 ± 6°C/km for the NJB (weighted average based on the area of each tectonic unit).
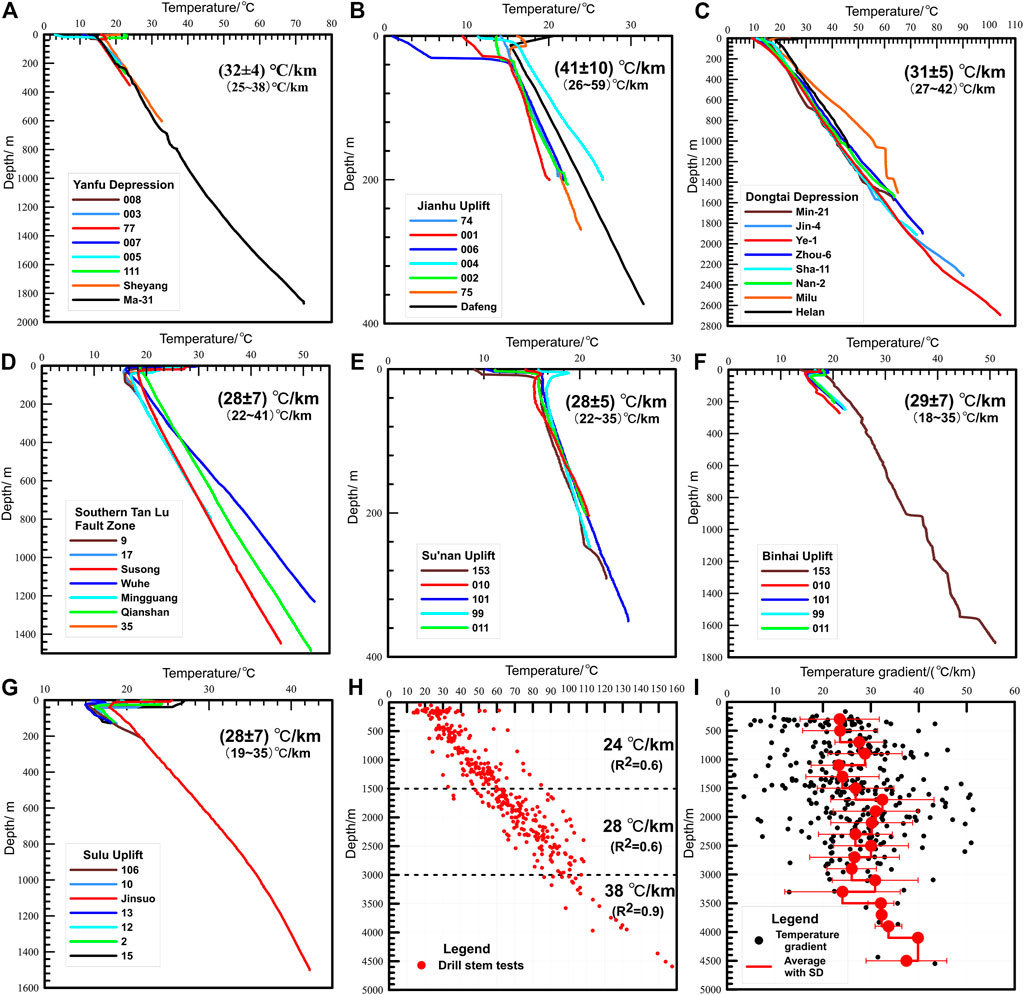
FIGURE 3. The new drill stem tests data, temperature gradient, and temperature-depth profiles for the measured boreholes in each sub-structural unit of the North Jiangsu Basin and its adjacent areas.
Temperature Gradient
The vast majority of the DST data are from the Dongtai Depression. A large number of test oil temperatures show that the temperature gradually increases with increasing depth. Moreover, the DST data are divided into three geothermal gradient sections (Figure 3H): 0–1500 m, 1500–3000 m, and >3000 m. The gradient of 0–1500 m and 1500–3000 m are about 24 and 28°C/km, respectively. As for the section deeper than 3000 m, the temperature gradient is up to 38°C/km. The distribution of the temperature gradient and depth (Figure 3I) reveals that the gradient gradually increases with depth in the shallow part (below 1000 m), and the average value of the gradient increases from 23°C/km to about 30°C/km. From 1000 m to 1800 m, the change of the gradient approximately repeats the above trend, increasing from 23°C/km to 31°C/km. The geothermal gradient stabilizes from a depth of 1800 m to about 3500 m, with the average value fluctuating around 30°C/km. The gradient tends to increase gradually at a depth of 3500 m, and the average value of the temperature gradient reaches 40°C/km at a depth of 4100 m.
Based on the non-D quality data (heat flow can be classified into A,B,C and D categories according to the quality, where A data is the best and D data is for reference only) collected from the basin and neighboring areas (Jiang et al., 2019), we mapped the temperature gradient above the Yancheng Formation (N1-2yn, inclusive) in the NJB by Kriging interpolation method (Figure 4) (Stein, 1999). The east-central NJB and the eastern edge of Dongtai depression are high gradient areas on the plane, with an average geothermal gradient value higher than 35°C/km. The average temperature gradient of the NJB, the Dongtai depression, the Yanfu depression and Jianhu uplift are 31 ± 6°C/km, 39°C/km, 30°C/km and 39°C/km, respectively. Notably, it is crucial to compare and study the temperature gradient over the region with specific layers in mind.
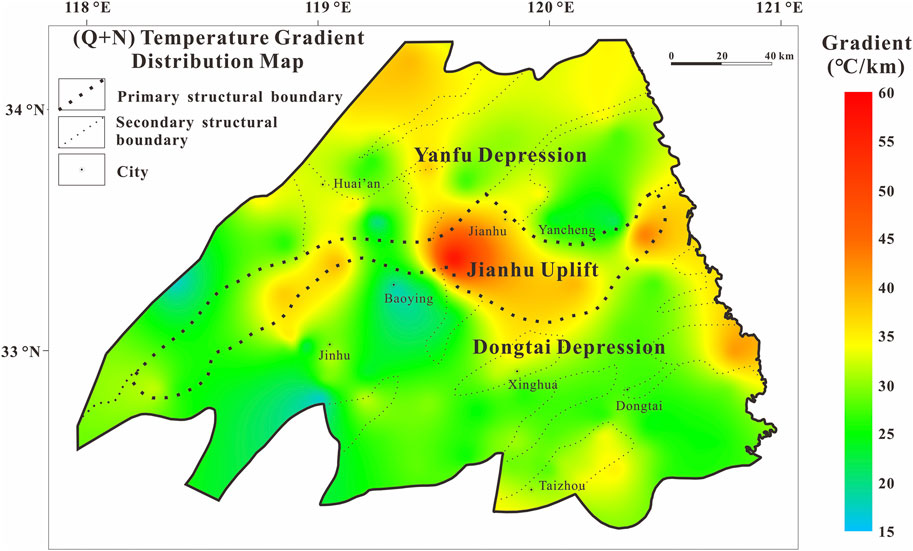
FIGURE 4. Distribution of the (Q + N) temperature gradient in the North Jiangsu Basin.
Vertically, there is a general trend of gradual increase from top to bottom based on the statistical results of single wells. The geothermal gradient in the NJB increases with depth, and the gradient in Ny, E2s-E2d is generally lower than that in the E1f-K2t. The Neoproterozoic and Quaternary formations are characterized by a low temperature gradient of 15–30°C/km, probably as a result of the influence of lithology and groundwater activity in the shallow formations. The high sandy content of the Ny, E2s, and E2d formations leads to high stratigraphic thermal conductivity and low gradient, resulting in generally lower gradient in the shallow. The Paleocene and Upper Cretaceous rocks have relatively high mud content, with gradient values between 30 and 40°C/km.
Thermal Physical Parameters Measurement
Thermal Conductivity
Rock thermal physical parameters are the basis for conducting regional geothermal field studies. Since 1986–1988, outcrop and core samples have been collected three times in the NJB to test the thermal conductivity of some strata (Wang, 1989; Wang et al., 1995). During 2018–2020, the Institute of Geology and Geophysics, Chinese Academy of Sciences and Geological Survey of Jiangsu Province systematically collected a large number of rock samples in the geothermal study of the NJB and carried out a series of thermal conductivity tests, which greatly improved the regional thermal conductivity column. Because of the large stratigraphic span and uneven distribution, the thermal conductivity values compiled in this study were combined with previous research results (Wang, 1989; Wang et al., 1995) to obtain weighted average values of thermal conductivity for different strata based on the number of test blocks. The thermal conductivity test results are shown in Table 2 (the thermal conductivity values are those of the dry rock samples measured at room temperature).
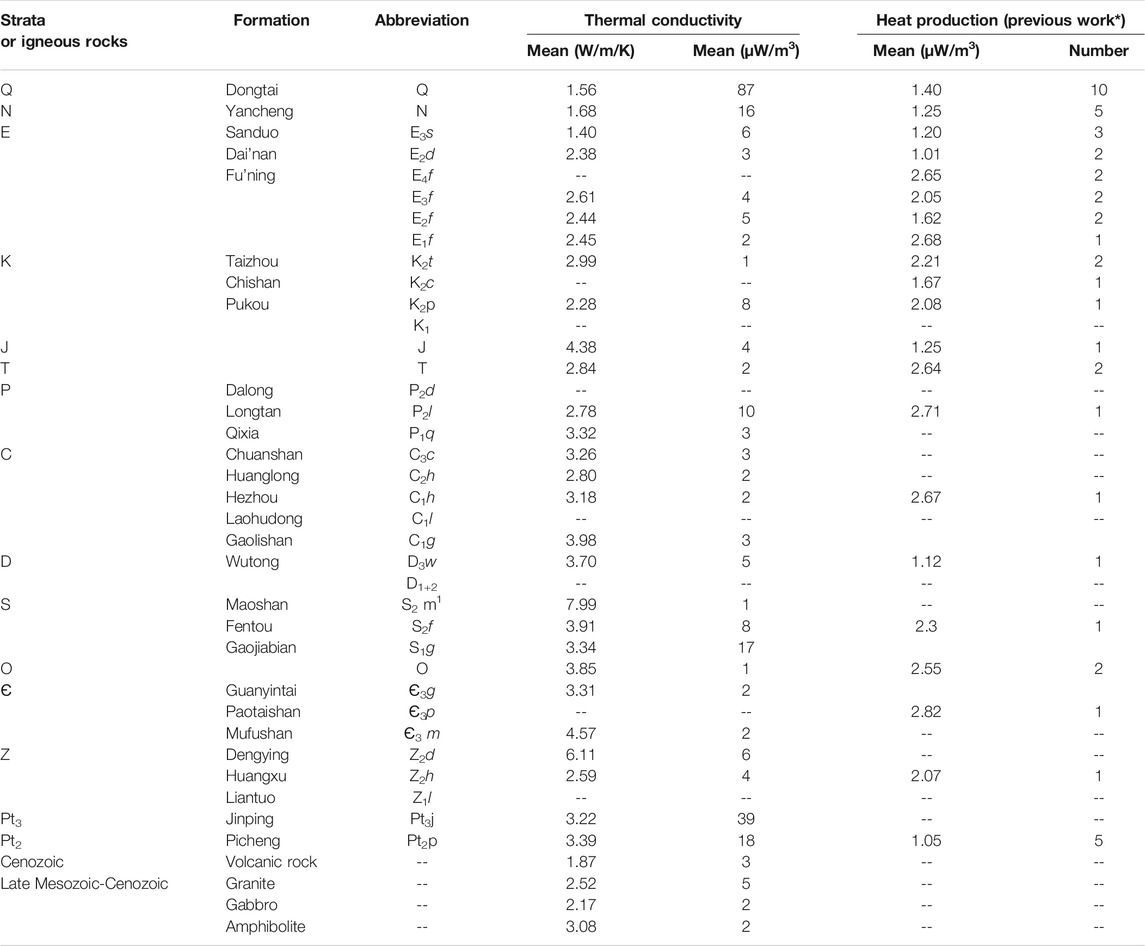
TABLE 2. Thermal conductivity and heat production of different rock types in the North Jiangsu Basin.
The results show that the average rock thermal conductivity the strata in the region fluctuates widely, and the minimum value in the test results is the Quaternary clay and sand with thermal conductivity of 0.6 W/m/K; the maximum value is the Silurian S2m1 with thermal conductivity of 7.99 W/m/K (Figure 5A). In general, the thermal conductivity shows a gradual decreasing trend from old to new with the stratigraphy. The thermal conductivity of the Paleozoic strata is generally higher than 3.0 W/m/K; the Mesozoic strata have the next highest thermal conductivity, mostly 2.0–3.0 W/m/K; and the Cenozoic strata have the lowest thermal conductivity, between 1.5 and 2.5 W/m/K. The stratigraphic thermal conductivity of the NJB can be roughly divided into two different layers, namely, the shallow low thermal conductivity layer and the deep high thermal conductivity layer. The thermal conductivity of the shallow Cretaceous-Quaternary is low (<2.7 W/m/K), especially thermal conductivity of the Late Paleogene-Quaternary is mostly less than 2.0 W/m/K, which can provide good cover for heat preservation. The thermal conductivity of the deeper Ediacaran-Jurassic is relatively high, generally greater than 3.0 W/m/K, especially the thermal conductivity of the Silurian-Devonian and Ediacaran-Cambrian can exceed 4.0 W/m/K, and the thermal conductivity of the Late Ediacaran Dengying Group can exceed 6.0 W/m/K, all of which can be used as good thermal conductivity and thermal storage layers. The thermal conductivity of magmatic rocks gradually increase with the change of composition from basic to acidic, and the thermal conductivity of medium-acidic to basic magmatic rocks is low overall, especially the thermal conductivity of Cenozoic basic volcanic rocks is comparable to that of Cenozoic sedimentary cover.
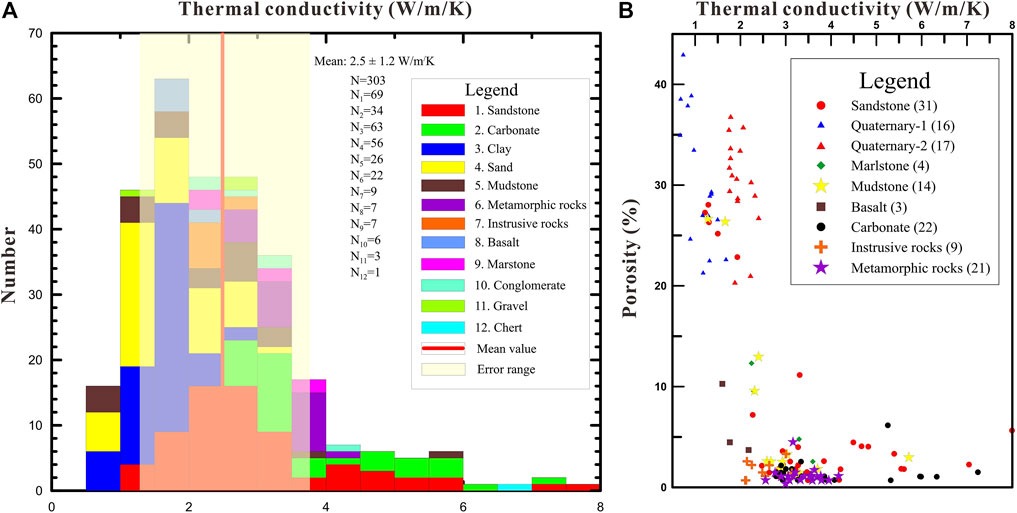
FIGURE 5. Distribution of thermal conductivity (A) and its relationship with porosity (B) of different rock types in the North Jiangsu Basin.
The most important factor affecting large differences in thermal conductivity is the difference in lithology, while other influencing factors such as the degree of metamorphism and porosity (Figure 5B) also have a large effect on thermal conductivity, and the effects of temperature, pressure, and anisotropy on thermal conductivity should not be ignored (Wang, 2020; Wang et al., 2021b).
Heat Production
In this study, the radioactive element contents of 47 samples were tested and compiled for U, Th, and K. The method proposed by Rybach (1976) was used to calculate the stratigraphic heat production. The content of U and Th was measured by ICP- MS, and the content of K was measured using atomic absorption spectroscopy. The test and summary results are shown in Table 2.
The results show that the average heat production of the rocks of all rock types in the varies little between 1.1 and 2.7 mW/m3, with the lowest heat production in the Middle Proterozoic Picheng Group and the highest heat production in the fourth section of the Paleogene Fu’ning Formation. The difference in heat production is closely related to lithological changes, and rocks with more silt and mud content tend to have larger heat production. Therefore, more work on heat production test work should be carried out to obtain precise constraints on the heat flow contribution and deep temperature variation in different depths of the strata.
Heat Flow
The regional heat flow map is an important representation of the thermal background of a tectonic unit, and an important basis for regional geothermal resource evaluation, target area preference, and mining design. The density of heat flow measurement point distribution and the quality of heat flow data in the NJB is high in China and even in the world. In this study, we obtained seven new high-quality heat flow values in the key blank areas of the NJB (e.g., the northern margin of the Jinhu sag and the eastern margin of the Dongtai Depression) (Table 3). Combining the 72 geothermal heat flow data measured in 2018 (Wang et al., 2020) and 165 published heat flow data in and around the basin, we mapped the heat flow distribution in the NJB, as shown in Figure 6.
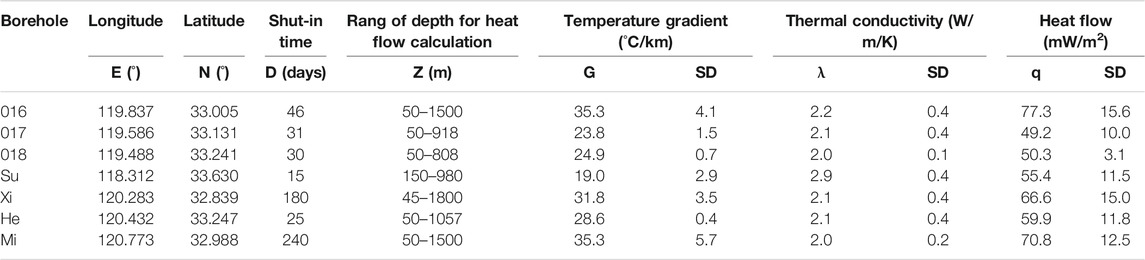
TABLE 3. Information table of new heat flow in the northern Jiangsu basin.
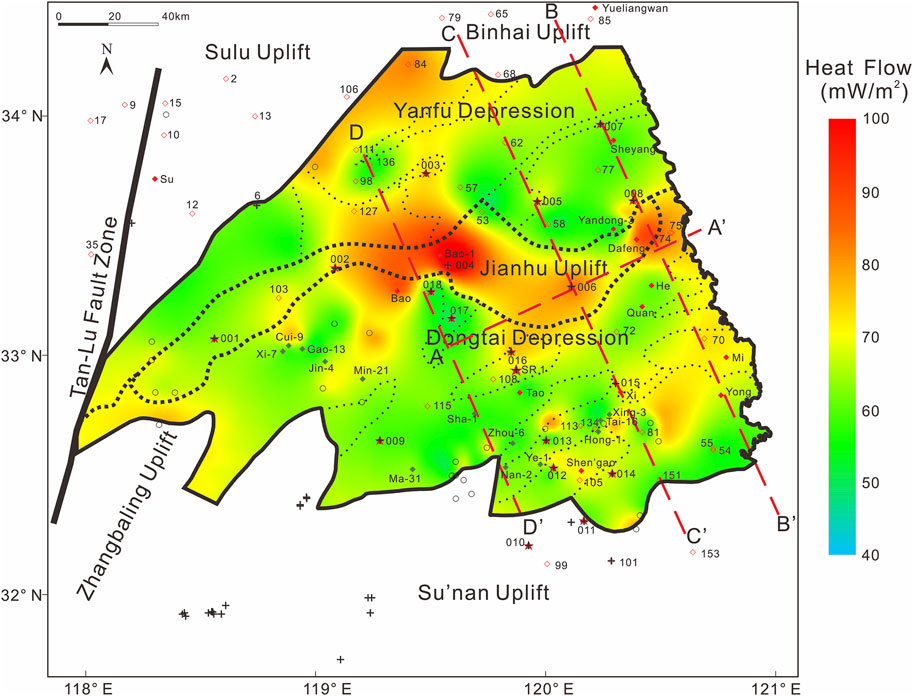
FIGURE 6. Heat flow distribution map of the North Jiangsu Basin.
The average heat flow value of the NJB is 68 mW/m2, which is typical of “hot basin” in East China (≥65.0 mW/m2). Figure 6 shows that the east-central part of the Jianhu uplift, the northern part of the Jinhu sag, and the eastern margin of the Dongtai Depression in the basin are relatively high heat flow areas, with mean heat flow values above 70 mW/m2, which is higher than the average value of 62 mW/m2 in continental China. The Huai’an high area has the highest mean heat flow of 73 mW/m2, followed by the Jianhu uplift, Sujiazui high, and Yuhua high. Statistical calculations of heat flow values for each sub-tectonic unit in the basin show that the heat flow in the uplift or high areas is higher than that in the depression area, but heat flow in some of the highs in the depression area is also higher, and some of them even exceed that in the uplift area, indicating that the highs in the depression may also be favorable areas for deep geothermal convergence.
Characteristics of the Deep Temperature Field in the North Jiangsu Basin
One-Dimensional Temperature Field Calculation
The characteristics of the deep temperature field are an important basis for studying both the thermal structure of the lithosphere and the deep geothermal resources. The parameters that determine the temperature distribution at different depths z include surface temperature T0, surface heat flow q0, rock thermal conductivity K, and rock heat generation rate A. The surface temperature can be obtained from the multi-year surface average temperature; the surface heat flow comes from the drilling temperature and rock thermal conductivity measurements; and the thermal conductivity and heat production of the rocks come from the latest results of this update and compilation. Based on the previously published and newly added heat flow values of the NJB and its adjacent areas, the kriging interpolation method was used to interpolate the values in the whole area, with one point taken at 50 km, and a total of 480 interpolation points were taken in the study area.
Under the condition of one-dimensional steady-state heat conduction, for the distribution area of uniformly layered rocks, the thermal conductivity and heat production within a single layer can be approximated as constants (the measured averages are obtained according to different lithologies), and the corresponding deep temperature can be calculated by the following equation:
Where T0 is the temperature of the constant temperature zone, °C; q0 denotes the surface heat flow, mW/m2; K represent the thermal conductivity of certain crustal layer, W/m/K; A is the heat production of each layer, mW/m3.
Based on Fourier’s law, the temperature distribution at different depths of the NJB was calculated using parameters such as surface temperature, heat flow, rock thermal conductivity, and heat production, as shown in Figure 7. The favorable distribution area of geothermal resources in the NJB is wide, and its high temperature areas are mainly distributed in the Jinhu sag and its northern margin, the east-central part of Jianhu uplift, and the eastern margin of Dongtai depression, which reach 80°C at 2 km and about 200°C at 5 km.
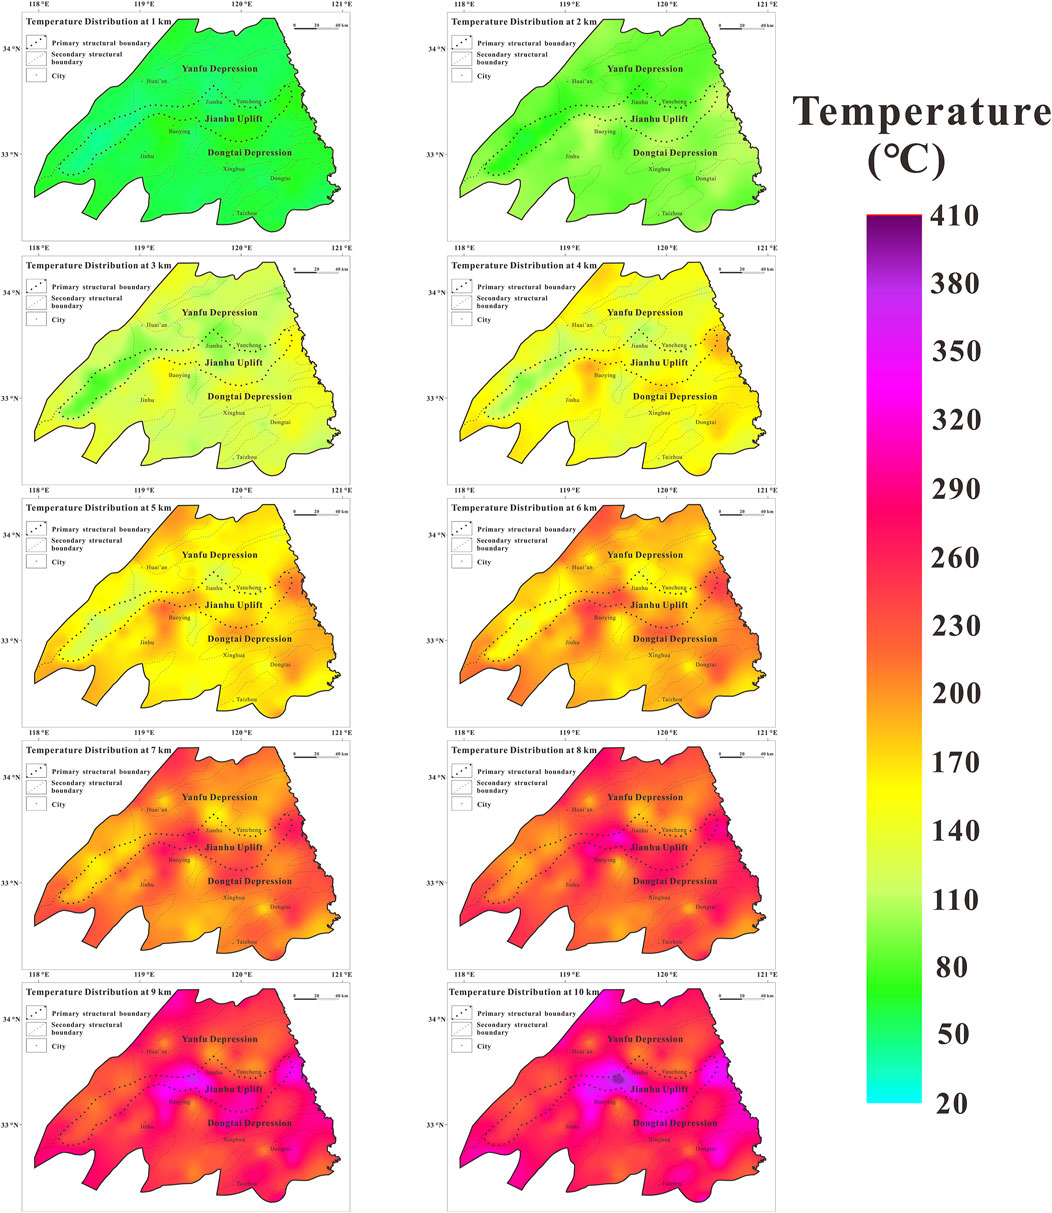
FIGURE 7. Distribution characteristics of the geothermal field at different depths of 1–10 km in the North Jiangsu Basin.
The Two-Dimensional Temperature Field Profile
Since the “one uplift and two depressions” pattern in the NJB charactered the NEE-SWW spreading, we choose the profiles that are perpendicular to it when simulating the 2D temperature field. Accordingly, we choose three profiles, BB′, CC′, and DD’ in Figure 1, to simulate the two-dimensional temperature field. To reduce the influence of the shallow thermal refraction and the setting of the bottom boundary heat flow on the results, we performed the simulations at a depth of 20 km.
The bottom boundary heat flow was assigned in segments based on the combination of the regional average heat flow value and the measured heat production. For each different strata or rock body, the assignment of thermal physical parameters, including the density, specific heat capacity, thermal conductivity and heat production of rocks, is also required. The initial values of the temperature in the thermostatic zone of the profile model were set regarding the annual average temperature of the province (Liu et al., 2003), and adiabatic boundaries were set at on both sides of the profile. Therefore, the temperature profiles of different profiles have certain differences in the three profiles. In order to more clearly portray the variation of the regional temperature field, we use different scale bars for the 2D temperature field profiles.
In summary, we simulated the temperature distribution at different depths on the profiles using parameters such as surface temperature, rock thermal conductivity, heat generation rate, and so on, and continuously optimized the parameters to match the observed heat flow using an interactive method. Finally, we obtained three large-scale 2D temperature field simulations (Figure 8).
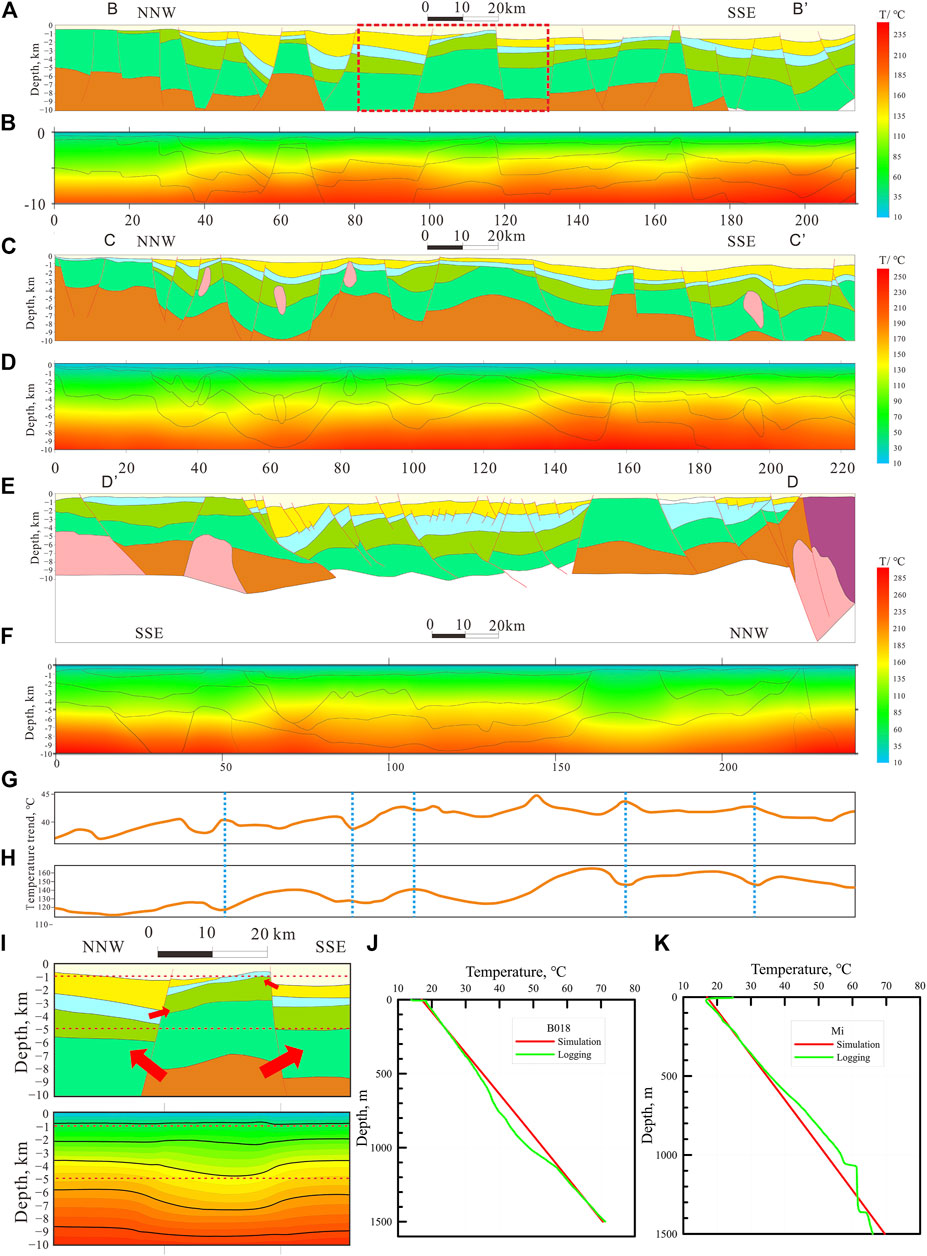
FIGURE 8. (A–E), two-dimensional temperature field simulation of sections B-B, C-C, and D-D′ in Figure 1C. (G,H) represents the temperature variation of profile C-C′ in Figure 1 at 0.5 and 4.5 km depth, respectively. Plot (I) is a zoomed-in view of the stratigraphic and simulation results in Figure a (red dashed box). (J,K) are comparisons of simulated and measured values of depth-temperature curves in 2 boreholes.
The heat flow map of the NJB (Figure 6) shows that the there is a strong convergence of heat flow at the uplifts or highs, i.e., a significant thermal refraction effect occurs, with higher heat flow values relative to the depressions and sags (Xiong and Zhang, 1988; Wang et al., 2015). Two-dimensional temperature field simulations of the BB′ profile (Figure 1) reveal that the area where the isothermal surface uplift occurs is concentrated in the southern depressions, which does not correspond significantly to the convergence of heat flow. Heat flow distribution and two-dimensional temperature field simulation of the profiles CC′ and DD’ (Figure 1) show that the uplifts and highs also have a strong heat flow convergence. However, the area where the isothermal surface is uplifted occurs in the Dongtai depression in the south and the Yanfu depression in the north, rather than concentrated in the Jianhu uplift. Besides, we plotted the temperature variation at 0.5 and 4.5 km depths using profile CC’ as an example, as shown in Figures 8G,H. The trends of the two in the lateral direction indicate a very clear mirror image phenomenon, manifesting the variability of the lateral heat transfer of thermal conductivity at different depths. This aspect will be discussed in detail in the genesis mechanism section.
To check the reliability of the simulation results, we selected some boreholes adjacent to the simulated section and carried out a comparative analysis between the simulated and measured values. The analysis shows that most of the temperature profiles obtained from the simulations have a good fit with the measured data (both in the temperature gradient and the bottom-hole temperature). For example, the overall deviation of borehole B018 (Figure 8J) is about 1%, while this deviation is approximately 6% in Borehole Milu (Figure 8K). In addition, the preliminary logging work (bottom-hole temperature) on the borehole SR1 (Figure 1) similarly confirmed the reliability of the simulation results.
Geothermal Genesis Mechanism of the North Jiangsu Basin
The present-day temperature field of the basin is both the end of the thermal evolution process and the beginning of the thermal history recovery. The study of the present-day thermal state of the NJB confirms that the basin was not always characterized by high heat flow everywhere, which can be well explained by the theory of “thermal refraction” at the crustal scale. However, as an important part of the Lower Yangtze Craton, the “hot basin” property of the NJB should be the product of deep dynamical processes. Exploring this process from the perspective of time and deep processes can help to understand the geothermal genesis of the NJB, which consists of three main questions: 1) What are the thermal evolution processes of the Lower Yangtze Craton? 2) What are the deep mechanisms controlling the “hot basin” properties of the NJB? 3) Where are the geothermal resource “sweet spots” at different depths in the NJB? Based on the above questions, we discuss the geothermal causal mechanism in the NJB.
Thermal History and Geodynamics of the Lower Yangtze Craton
The polarization of the present-day geothermal background of the East Asian sedimentary basins (Figure 1A) seems to imply that they experienced different tectono-thermal events. As one of the most critical “hot” (≥65 mW/m2) and oil-bearing basins in the Yangtze Craton, the thermal evolution and dynamical background of the NJB is a scientific issue of interest.
Since the Mesozoic, the subduction of the Izanagi plate led to dehydration/decarbonization of the overlying plate, and the strong unsteady flow of the big mantle wedge caused the craton destruction in East China, peaking at the end of the Early Cretaceous (Zhu et al., 2012; Zhu et al., 2017), accompanied by strong convective erosion and peridotite-melt interactions (He, 2014; Zhang, 2005), while the upper crust underwent large-scale extensional tectonic deformation (Lin and Li, 2021; Lin and Wei, 2018) (Figure 9C). Large-scale magmatism from 135–120 Ma enriched mantle sources existed in the Lower Yangzi Craton (Wu et al., 2005; Wu et al., 2019) (Figure 9B). Compared with the ancient craton, the lithosphere of the Lower Yangtze Craton is getting weaker and warmer. However, the dramatic increase in surface heat flow often lags behind significant erosion and magmatism (He, 2014). Thermal history studies of oil boreholes in Jurong and Taixing show that the surface heat flow reached a maximum of 85–93 mW/m2 at about 128 Ma (Figure 9A). During the Late Cretaceous, trench retreat and slab reversal occurred, often accompanied by lithospheric extension and re-emergence of magmatism (Sun et al., 2008) (Figure 9B), as well as partial tectonic deformation (biotite 40Ar-39Ar age) (Lin and Li, 2021) (Figure 9C). Cenozoic basalts are identified as coming from a barren mantle, reflecting lithospheric thinning (Xu, 2001; Xu et al., 2009). During the Eocene and Oligocene, surface heat flow in the NJB reached 78–86 mW/m2 (Figure 9A), as evidenced by apatite fission track and vitrinite reflectivity data (Ro) (Zeng, 2005). After 30–40 Ma, the thickness of the lithosphere increased to varying degrees, mainly as a result of thermal decay (Xu, 2001). Thereafter, the NJB gradually enters the thermal subsidence process in the late extensional stage, characterized by a gradual decrease in surface heat flow and lithospheric temperature. Numerical simulations by He (2015) show that the difference between the thickness of the thermal and seismic lithosphere (rheological boundary layer) gradually decreases from west to east, indicating that the viscosity coefficient of the large mantle wedge gradually decreases to the east, and suggesting that this is the result of subduction and dehydration of the western Pacific plate. Therefore, we considered the effect of this result in the schematic diagram of the evolution of the thermal structure of the NJB lithosphere (Figure 9E).
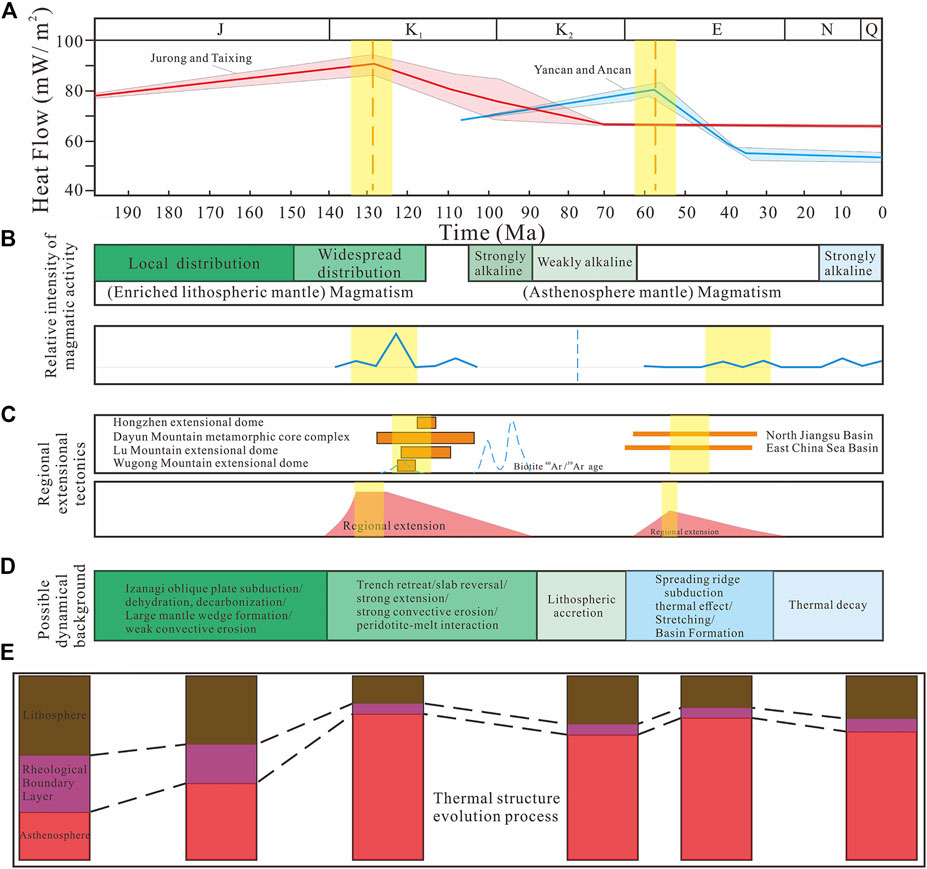
FIGURE 9. The thermal regime transition process of the Lower Yangtze Craton in Mesozoic and Cenozoic ((A) thermal history evolution (modified from Zeng (2005)); (B) relative intensity of magmatic activity (data are from https://data.mendeley.com/datasets/yjjx5fvhvm/2 and https://github.com/CodrIocas/Oxygen); (C) regional extensional tectonics (modified from Lin and Li (2021)); (D) possible dynamical background; (E) schematic illustration of the evolution process of the lithospheric thermal structure of cratons in East China (revised from He and Zhang (2018))).
Lithospheric-Scale Thermal Control Mechanisms
Based on the above analysis, we suggest that the thermal control mechanism of the Lower Yangtze Craton, including the NJB, at the lithospheric scale, can be summarized as “two stages” thermal concentration (Figure 10).
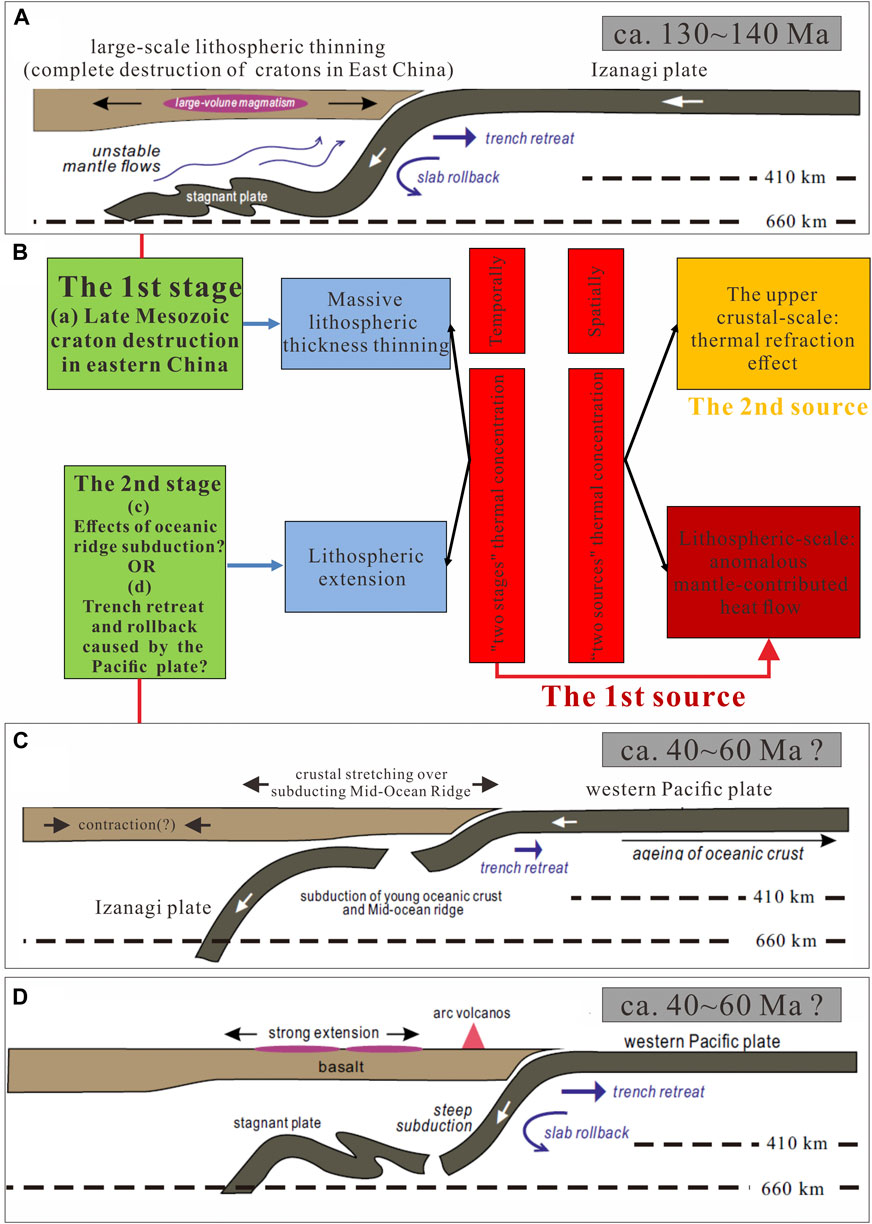
FIGURE 10. The kinetic mechanism and model of “two stages, two sources” thermal concentration in the Lower Yangtze Craton ((A), (C), and (D) are the possible kinetic background of the thermal concentration in the Lower Yangtze Craton ((C) and (D) are the are two possible mechanisms causing lithospheric extension) (modified from Zhu et al. (2017)); (B) is the “two stages, two sources” thermal concentration model).
Temporally, during the Late Mesozoic (ca. 140 Ma) (Figure 10A), the Izanagi plate subducted beneath the East Asian big mantle wedge, the trench retreated and the slab rollback, causing strong unstable flow in the overlying mantle, resulting massive magmatic activity and extensional tectonic deformation in the shallow (Zhu et al., 2017), and the craton destruction in East China led to a huge thinning of the lithosphere thickness of the Lower Yangtze Craton.
Since about 60 Ma (Figure 10C), the Pacific plate gradually succeeded the Izanagi plate and influenced the tectonic evolution of East Asia (Zhu et al., 2017). The subduction of the Pacific plate in the NW or W direction led to the previous Izanagi plate to gradually subduct into the mantle. Due to the presence of the mid-ocean ridge connecting two oceanic plates (Izanagi plate and Pacific plate), which may have caused regional extension of the lithosphere above the plate window (Zhu et al., 2017), the tectono-thermal event (45–60 Ma) of this period was recorded in the Lower Yangtze Craton under the influence of the subduction of the mid-ocean ridge. As the age of the subducted oceanic crust became older, high-angle subduction led to trench retreat and slab rollback, and regional extensional tectonics became more intense during the Oligocene-Miocene, along with large number of basaltic rocks forming in the back-arc region (Xu, 2001; Niu, 2005). Besides, it has been suggested that the Cenozoic volcanism and high heat flow in the basins of East China are mainly due to the back-arc extension caused by the subduction of the western Pacific plate (He, 2015; Liu et al., 2016; Qiu et al., 2016) (Figure 10D).
Most studies support that during this period, the Lower Yangtze experienced an extensional tectonic setting. Even though there was no magmatism during part of the period (46–56 Ma) (Wu and Wu, 2019; Liu et al., 2020), the high heat flow corresponding to the extensional setting has been widely accepted (Currie, 2004). Unlike central China, such as the Shanxi Rift System, which may has also been affected by subduction of the mid-ocean ridge and the Pacific plate (Liu et al., 2017; Su et al., 2021), the lithospheric thickness of the Lower Yangtze Craton has been substantially thinned due to the effects of Late Mesozoic craton destruction. Overall, the high heat flow in East China may be controlled by the combination of lithospheric extension, magmatic activity, and so on (Lei, 2012; Lei et al., 2013).
The Upper Crustal-Scale Thermal Control Mechanisms
The influence of stratigraphic relief on the crustal-scale temperature field is mainly reflected in the difference of rock thermal conductivity (similar to the fact that water always preferentially transfers to the direction of lower resistance), resulting in the redistribution of heat in the lateral direction or the thermal refraction effect.
In this study, the thermal conductivity of Paleozoic and Ediacaran rocks in the NJB is much greater than that of sedimentary layers since the Mesozoic, and even much greater than that of Neogene rocks (Table 2). This makes the geothermal field not all converge toward the shallow uplift area, but is related to the stratigraphic thickness and distribution scale of the Paleozoic and Ediacaran strata. The larger the scale of the Paleozoic and Ediacaran strata with high thermal conductivity layers, the greater this control factor. Therefore, from the upper crustal scale, the Dongtai depression on the south side of Jianhu uplift has the strongest controlling effect on the regional geothermal field.
On the other hand, the control aspect of the temperature field. As shown in Figure 8I, high thermal conductivity rocks have higher thermal conductivity compared to nearby low thermal conductivity mudstones and sandstones, and heat will be preferentially transferred in the high thermal conductivity strata or rocks during the upward heat transfer. In the shallow section (about <3 km), heat converges from the depression to the uplift; in the deep section (about 3 km deeper), the situation is reversed, heat converges from the uplift to the depression. In detail, it can be generally divided into three parts: the first, (<1 km) uplift area with high temperature; the second, (about 2–3 km) depression area with high temperature; and the third section, (about 3.5–5 km) depression area with significantly higher temperature. Based on the above measurements and simulations, it is not difficult to derive the “sweet spots” of geothermal resources at different scales in the NJB.
Conclusion
We determined the thermal conditions of the NJB using the latest high-quality heat flow, thermal conductivity, and heat production of the rocks. A detailed discussion of the causal mechanisms of the present-day geothermal features in the NJB was carried out. The salient conclusions regarding the thermal state of the NJB are as follows:
1. The study of 79 heat flow points scattered in the NJB and its adjacent region shows that the average values of temperature gradient and heat flow in the NJB are 31°C/km and 68 mW/m2, respectively.
2. The “sweet spots” of geothermal resources in the NJB are different at different study scales. Both the measured and numerical simulation results indicate that the favorable area of deep geothermal resources is mainly concentrated in the depression area near the Jianhu uplift.
3. The genesis mechanism of geothermal characteristics in the NJB is best explained by the “two stages, two sources”. “Two stages” means that the transformation of the lithospheric thermal regime (such as, huge lithospheric thickness thinning) caused by the late Mesozoic craton destruction in East China, and the Cenozoic lithospheric extension; these two tectono-thermal events together determine the deep anomalous mantle-source heat, and the upper crustal-scale heat control is mainly caused by thermal refraction.
From geophysical exploration and regional drilling, census of steady-state temperature measurements, to important regional drilling and initial selection of target locations, geophysical exploration of target areas and simulation of deep temperature fields, and then to the identification of superior geothermal resources and drilling verification, geothermal research work in the North Jiangsu Basin has made great progress: from nothing to something”. The exploration process and genesis mechanism of deep geothermal resources in the North Jiangsu Basin have gradually matured, laying a solid foundation for the next step of development and utilization of deep geothermal resources, and providing new ideas for the study on the genesis mechanism of geothermal characteristics in East China.
Data Availability Statement
The raw data supporting the conclusions of this article will be made available by the authors, without undue reservation.
Author Contributions
Conceptualization, YW and YB; methodology, ZW; software, JH; validation, JH and SH; formal analysis, YW and YW; investigation, YW, LW, JG, and ZW; data curation, YB, JG, and ZW; writing—original draft preparation, YW; writing—review and editing, JH; visualization, ZW; supervision, SH; project administration, YW; funding acquisition, LW. All authors have read and agreed to the published version of the article.
Funding
This research was accomplished under the support of National Key R&D Program of China (Grant No. 2021YFA0716003), State Key Laboratory of Lithospheric Evolution (SKL-K202104), National Natural Science Foundation of China (Grant No. 42074096), and Geological Survey of Jiangsu Province (JITC-1802AW2292; JITC-1902AW2919).
Conflict of Interest
The authors declare that the research was conducted in the absence of any commercial or financial relationships that could be construed as a potential conflict of interest.
Publisher’s Note
All claims expressed in this article are solely those of the authors and do not necessarily represent those of their affiliated organizations, or those of the publisher, the editors and the reviewers. Any product that may be evaluated in this article, or claim that may be made by its manufacturer, is not guaranteed or endorsed by the publisher.
Acknowledgments
We are grateful to the Geological Survey of Jiangsu Province very much, who provided help on the sample collection and borehole selection that are important for the study on the geothermal field and genesis mechanism.
References
Chen, A. (2010). Tectonic Features of the Subei Basin and the Forming Mechanism of its Dustpan-Shaped Fault Depression. Oil Gas Geology. 31, 140–150.
Grimmer, J. C., Jonckheere, R., Enkelmann, E., Ratschbacher, L., Hacker, B. R., Blythe, A. E., et al. (2002). Cretaceous−Cenozoic History of the Southern Tan-Lu Fault Zone: Apatite Fission-Track and Structural Constraints from the Dabie Shan (Eastern China). Tectonophysics 359, 225–253. doi:10.1016/s0040-1951(02)00513-9
Guo, X., Encarnacion, J., Xu, X., Deino, A., Li, Z., and Tian, X. (2012). Collision and Rotation of the South China Block and Their Role in the Formation and Exhumation of Ultrahigh Pressure Rocks in the Dabie Shan Orogen. Terra Nova 24, 339–350. doi:10.1111/j.1365-3121.2012.01072.x
He, L. (2014). Numerical Modeling of Convective Erosion and Peridotite‐melt Interaction in Big Mantle Wedge: Implications for the Destruction of the North China Craton. J. Geophys. Res. Solid Earth 119, 3662–3677. doi:10.1002/2013jb010657
He, L. (2015). Thermal Regime of the North China Craton: Implications for Craton Destruction. Earth-Science Rev. 140, 14–26. doi:10.1016/j.earscirev.2014.10.011
He, L., and Zhang, L. (2018). Thermal Evolution of Cratons in China. J. Asian Earth Sci. 164, 237–247. doi:10.1016/j.jseaes.2018.06.028
Hou, J., Cao, M., and Liu, P. (2018). Development and Utilization of Geothermal Energy in China: Current Practices and Future Strategies. Renew. Energ. 125, 401–412. doi:10.1016/j.renene.2018.02.115
Jiang, G., Hu, S., Shi, Y., Zhang, C., Wang, Z., and Hu, D. (2019). Terrestrial Heat Flow of continental China: Updated Dataset and Tectonic Implications. Tectonophysics 753, 36–48. doi:10.1016/j.tecto.2019.01.006
Lei, J. (2012). Upper-mantle Tomography and Dynamics beneath the North China Craton. J. Geophys. Res. Solid Earth 117. doi:10.1029/2012jb009212
Lei, J., Xie, F., Fan, Q., and Santosh, M. (2013). Seismic Imaging of the Deep Structure under the Chinese Volcanoes: An Overview. Phys. Earth Planet. Interiors 224, 8. doi:10.1016/j.pepi.2013.08.008
Lin, W., and Li, J. (2021). Cretaceous Two Stage Extensional Tectonic in Eastern Eurasia Continent and its Geodynamics. Acta Petrologica Sinica 37, 2303–2323.
Lin, W., and Wei, W. (2018). Late Mesozoic Extensional Tectonics in the North China Craton and its Adjacent Regions: a Review and Synthesis. Int. Geology. Rev. 2018, 1–29. doi:10.1080/00206814.2018.1477073
Liu, J. Y., Zhuang, D. F., Luo, D., and Xiao, X. (2003). Land-cover Classification of China: Integrated Analysis of AVHRR Imagery and Geophysical Data. Int. J. Remote Sensing 24, 2485–2500. doi:10.1080/01431160110115582
Liu, K., Zhang, J., Xiao, W., Wilde, S. A., and Alexandrov, I. (2020). A Review of Magmatism and Deformation History along the NE Asian Margin from Ca. 95 to 30 Ma: Transition from the Izanagi to Pacific Plate Subduction in the Early Cenozoic. Earth-Science Rev. 2020, 103317. doi:10.1016/j.earscirev.2020.103317
Liu, Q., Zhang, L., Zhang, C., and He, L. (2016). Lithospheric thermal Structure of the North China Craton and its Geodynamic Implications. J. Geodynamics 102, 139–150. doi:10.1016/j.jog.2016.09.005
Liu, X., Zhao, D., Li, S., and Wei, W. (2017). Age of the Subducting Pacific Slab beneath East Asia and its Geodynamic Implications. Earth Planet. Sci. Lett. 464, 166–174. doi:10.1016/j.epsl.2017.02.024
Lund, J. W., and Toth, A. N. (2020). Direct Utilization of Geothermal Energy 2020 Worldwide Review. Geothermics 90, 101915. doi:10.1016/j.geothermics.2020.101915
Niu, Y. (2005). Generation and Evolution of Basaltic Magmas: Some Basic Concepts and a New View on the Origin of Mesozoic–Cenozoic Basaltic Volcanism in Eastern China. Geol. J. China Universities 11, 9–46.
Qian, J. (2001). Oil and Gas fields Formation and Distribution of Subei Basin-research Compared to Bohai Bay Basin. Acta Petrolei Sinica 22, 12–16.
Qiao, X., Li, G., Li, M., and Wang, Z. (2012). CO2 Storage Capacity Assessment of Deep saline Aquifers in the Subei Basin, East China. Int. J. Greenhouse Gas Control. 11, 52–63. doi:10.1016/j.ijggc.2012.07.020
Qiu, H., Xu, Z., and Qiao, D. (2006). Progress in the Study of the Tectonic Evolution of the Subei basin, Jiangsu, China (In Chinese with English Abstract). Geol. Bull. China 2006, 1117–1120.
Qiu, N., Zuo, Y., Xu, W., Li, W., Chang, J., and Zhu, C. (2016). Meso-Cenozoic Lithosphere Thinning in the Eastern North China Craton: Evidence from thermal History of the Bohai Bay Basin, North China. J. Geology. 124, 195–219. doi:10.1086/684830
Shu, L., Wang, B., Wang, L., and He, G. (2005). Analysis of Northern Jiangsu Prototype basin from Late Cretaceous to Neogene. Geol. J. China Universities 11, 534–543.
Stein, M. L. (1999). Interpolation of Spatial Data: Some Theory for Kriging. New York: Springer-Verlag New York.
Su, P., He, H., Tan, X., Liu, Y., Shi, F., and Kirby, E. (2021). Initiation and Evolution of the Shanxi Rift System in North China: Evidence from Low㏕emperature Thermochronology in a Plate Reconstruction Framework. Tectonics 40, 6298. doi:10.1029/2020tc006298
Sun, W., Ling, M., Wang, F., Ding, X., Hu, Y., Zhou, J., et al. (2008). Pacific Plate Subduction and Mesozoic Geological Event in Eastern China. Bull. mineralogy, Petrol. Geochem. 27, 218–225.
Tester, J. W., Anderson, B. J., Batchelor, A., Blackwell, D., DiPippo, R., Drake, E., et al. (2006). The Future of Geothermal Energy. Cambridge, Massachusetts: Massachusetts Institute of Technology, 358.
Wang, J., Pang, Z., Hu, S., He, L., and Qiu, N. (2015). Geothermics and its Application. Beijing: Science press.
Wang, L. (1989). Geothermal Study on the Oil and Gas Basin (In Chinese with English Abstract). Nanjing: Nanjing University Press.
Wang, L., Li, C., Shi, Y., and Wang, Y. (1995). Distribution of Geotemperature and Terrestrial Heat Flow Density in Lower Yangtze Area (In Chinese with English Abstract). Chin. J. Geophys. 38, 469–476.
Wang, Y. (2020). Differences of Thermal Regime of the Cratons in Eastern China and Discussion of its Deep Dynamic Mechanism. Beijing: University of Chinese Academy of Sciences. University of Chinese Academy of Sciences.
Wang, Y. (1987). Geothermal Characteristics of the Subei Basin and its Relationship with Oil and Gas. Nanjing: Department of Earth Sciences. Nanjing University.
Wang, Y., Hu, D., Wang, L., Guan, J., Bai, Y., Wang, Z., et al. (2020). The Present-Day Geothermal Regime of the North Jiangsu Basin, East China. Geothermics 88, 101829. doi:10.1016/j.geothermics.2020.101829
Wang, Y., Wang, L., Bai, Y., Wang, Z., Hu, J., Hu, D., et al. (2021a). Assessment of Geothermal Resources in the North Jiangsu Basin, East China, Using Monte Carlo Simulation. Energies 14, 259. doi:10.3390/en14020259
Wang, Y., Wang, Z., Shi, L., Rong, Y., Hu, J., Jiang, G., et al. (2021b). Anisotropic Differences in the Thermal Conductivity of Rocks: A Summary from Core Measurement Data in East China. Minerals 11, 1135. doi:10.3390/min11101135
Wu, F.-Y., Yang, J.-H., Xu, Y.-G., Wilde, S. A., and Walker, R. J. (2019). Destruction of the North China Craton in the Mesozoic. Annu. Rev. Earth Planet. Sci. 47, 173–195. doi:10.1146/annurev-earth-053018-060342
Wu, F., Lin, J., Wilde, S., Zhang, X., and Yang, J. (2005). Nature and Significance of the Early Cretaceous Giant Igneous Event in Eastern China. Earth Planet. Sci. Lett. 233, 103–119. doi:10.1016/j.epsl.2005.02.019
Wu, T. J., and Wu, J. (2019). Izanagi-Pacific ridge Subduction Revealed by a 56 to 46 Ma Magmatic gap along the Northeast Asian Margin. Geology 47, 953. doi:10.1130/g46778.1
Xiong, L., and Zhang, J. (1988). Relationship between Geothermal Gradient and the Relief of Basement Rock in North China Plain. Chin. J. Geophys. 1988, 146–155.
Xu, Y.-G. (2001). Thermo-tectonic Destruction of the Archaean Lithospheric Keel beneath the Sino-Korean Craton in China: Evidence, Timing and Mechanism. Phys. Chem. Earth, A: Solid Earth Geodesy 26, 747–757. doi:10.1016/s1464-1895(01)00124-7
Xu, Y., Li, H., Pang, C., and He, B. (2009). On the Timing and Duration of the Destruction of the North China Craton. Sci. Bull. 54, 3379–3396. doi:10.1007/s11434-009-0346-5
Yin, A., and Nie, S. (1993). An Indentation Model for the North and South China Collision and the Development of the Tan-Lu and Honam Fault Systems, Eastern Asia. Tectonics 12, 801–813. doi:10.1029/93tc00313
Yu, H. (1991). Mine Geothermal and Heat Harm Control (In Chinese with English Abstract). Beijing: Coal Industry Press.
Zeng, P. (2005). The Application of the Thermometric Indicators to the Study of thermal Evolution in the Lower-Yangtze Region (In Chinese with English Abstract). Beijign: China University of Geosciences, 79–93.
Zhang, H.-F. (2005). Transformation of Lithospheric Mantle through Peridotite-Melt Reaction: A Case of Sino-Korean Craton. Earth Planet. Sci. Lett. 237, 768–780. doi:10.1016/j.epsl.2005.06.041
Zhu, J., Hu, K., Lu, X., Huang, X., Liu, K., and Wu, X. (2015). A Review of Geothermal Energy Resources, Development, and Applications in China: Current Status and Prospects. Energy 93, 466–483. doi:10.1016/j.energy.2015.08.098
Zhu, R.-X., Yang, J.-H., and Wu, F.-Y. (2012). Timing of Destruction of the North China Craton. Lithos 149, 51–60. doi:10.1016/j.lithos.2012.05.013
Keywords: The North Jiangsu Basin, genesis mechanism, heat flow, geothermal resources, thermal refraction, East China
Citation: Wang Y, Bai Y, Wang L, Guan J, Wang Y, Wang Z, Hu J and Hu S (2021) Exploration Process and Genesis Mechanism of Deep Geothermal Resources in the North Jiangsu Basin, East China: From Nothing to Something. Front. Earth Sci. 9:784600. doi: 10.3389/feart.2021.784600
Received: 28 September 2021; Accepted: 25 November 2021;
Published: 13 December 2021.
Edited by:
Yinhui Zuo, Chengdu University of Technology, ChinaReviewed by:
Jian Chang, China University of Petroleum, ChinaYiduo Liu, University of Houston, United States
Zongxing Li, Chinese Academy of Geologi-cal Sciences (CAGS), China
Copyright © 2021 Wang, Bai, Wang, Guan, Wang, Wang, Hu and Hu. This is an open-access article distributed under the terms of the Creative Commons Attribution License (CC BY). The use, distribution or reproduction in other forums is permitted, provided the original author(s) and the copyright owner(s) are credited and that the original publication in this journal is cited, in accordance with accepted academic practice. No use, distribution or reproduction is permitted which does not comply with these terms.
*Correspondence: Yaqi Wang, wangyaqi@mail.iggcas.ac.cn