Loading Rate Dependence of Rock Strength Under Triaxial Compression
 Yang Tang
 Hailong Zhang1,3*
 - 1School of Civil Engineering, Chongqing University of Arts and Sciences, Chongqing, China
- 2School of Civil Engineering, Chongqing University, Chongqing, China
- 3China Construction Seventh Engineering Division Co., Ltd., Zhengzhou, China
- 4State Key Laboratory of Coal Mine Disaster Dynamics and Control, Chongqing, China
Knowledge regarding the time-dependent behavior of rocks is essential to estimate the long-term deformation and stability of underground structures. The rock strength increases with the increasing loading rate. However, the loading rate dependence in postfailure regions under confining pressure remains unclear. In this study, triaxial compression tests were conducted on four types of rocks to examine the loading rate dependence in both peak and postfailure regions. Results demonstrate that an increase in residual strength with a tenfold increase in the strain rate was approximately proportional to 4% of the residual strength. Furthermore, the increase in peak strength with a tenfold increase in the strain rate increased at a rate of approximately 4% of peak strength. The obtained results were applicable to all the sample rocks and can be easily employed for improving the constitutive equations. Finally, the effect mechanism of the confining pressure on the loading rate dependence of rock strength is discussed.
Introduction
The loading rate dependency of rock is one of the fundamental mechanical properties, which is essential in understanding the mechanism of earthquake and geological tectonic movements (Wasantha et al., 2015) and estimating the long-term stability of underground structures, e.g., mining roadway and underground storage (Mahanta et al., 2017; Tang et al., 2018; Wang et al., 2020). In the past few years, loading rate dependency of rock strength has been studied by many researchers, and Hashiba and Fukui (2015) provided a literature review regarding the loading rate dependence of rock strength.
The effect of the loading rate on the peak strength in uniaxial compression has been studied extensively over the years. For instance, Okubo et al. (1990) observed that the uniaxial compression strength (UCS) increased with the loading rate and that their relation could be obtained using a parameter n, which was also referred to as the stress corrosion index (Sano et al., 1981). In triaxial compression, the loading rate dependence is as important as that in uniaxial compression because underground rock is subjected to triaxial compression. However, only a few studies related to this topic have been published until now because of the difficulty associated with the entailed experimental procedures. Okubo et al. (1990) observed that the triaxial compressive strength (TCS) increased proportionally with respect to the logarithm of the loading rate and that the loading rate dependence of TCS was similar to that of UCS. Hokka et al. (2016) presented a systematic study on the mechanical properties of granite and calibrated the parameters of the Hoek–Brown model. Okubo et al. (2013) observed that the increment of TCS (△σ) when considering a tenfold increase in loading rate was almost independent of the confining pressure.
Many of the problems associated with rock mechanics in engineering, with respect to tunnel excavation and the storage of natural gas (Wang et al., 2021a; Wang et al., 2021b), are strongly related to the mechanical properties of rocks in the postfailure region (Gao and Kang, 2017). Therefore, studying the loading rate dependence of rocks in these regions has practical significance, as does that in the prefailure region up to peak strength. However, few studies have addressed the loading rate dependence in postfailure regions under uniaxial and triaxial conditions. Hashiba et al. (2006) and Hashiba et al. (2009) observed that the shape of the stress-strain curves in triaxial compression did not fundamentally change with the loading rate and indicated that the percentage of change of stress with a tenfold loading rate increase in the postfailure region did not greatly differ from that of the peak strength.
Although some studies have investigated the loading rate dependence of rocks in the postfailure region, there are no clear conclusions regarding the loading rate dependence of residual strength under triaxial conditions. In this study, a new experimental method proposed by Hashiba et al. (2006) was used to conduct a series of triaxial compression tests for four types of rocks. Special attention was devoted to the loading rate dependence of peak and residual strengths, which was rarely investigated until now.
Material and Methods
Specimen Description
Four types of rocks were obtained for testing, namely, Tage tuff, which has well seismic behavior and only distributes in the Tochigi Prefecture of Japan, Ogino tuff and Emochi andesite, which are the main building materials from the Fukushima Prefecture of Japan, and Jingkou sandstone from the landslide area around the Three-Gorges Reservoir in Chongqing, China. The mechanical properties of these rocks are presented in Table 1. The specimens were cored from a block of rock and cut into cylindrical shapes with a diameter of 25 mm and a height of 50 mm. The end surfaces of the specimens were polished smooth and straight to meet the International Society for Rock Mechanics (ISRM) standard. Tests were conducted after the specimens were air-dried for approximately 2 weeks. Typical specimens were shown in Figure 1A.
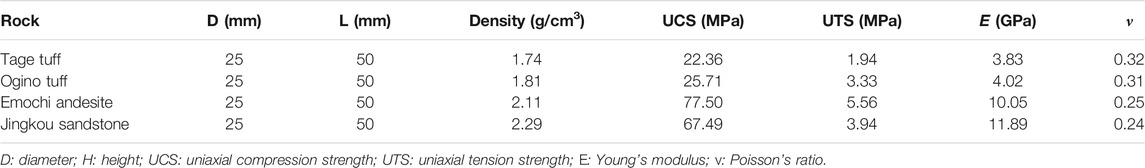
TABLE 1. Mechanical properties of the rocks used in this study.
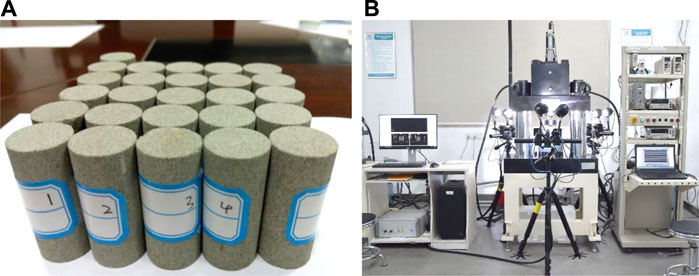
FIGURE 1. Pictures of (A) specimens and (B) test system.
Test System
The triaxial compression test was conducted using a servo-controlling test system (Tang et al., 2019), as shown in Figure 1B. This testing system had a loading capacity of 500 kN and a displacement capacity of 10 mm. The maximum confining pressure was limited to 10 MPa. A strain gauge-type loading cell was used to measure the loading, and a linear variable differential transformer was used to measure the displacement. A high-accuracy data recording system was used to continuously and simultaneously record the axial load and displacement.
Test Description
Axial-strain-rate control was employed in this study, and the alternative strain rate experimental method proposed by Hashiba et al. (2006) was utilized to conduct all the tests. Figure 2 presents a schematic of this method. The strain rate was alternated between high and low (CH and CL, respectively) based on a predetermined strain interval (Δε). The complete stress-strain curves for high and low strain rates could be estimated based on a specimen (Hashiba et al., 2006).
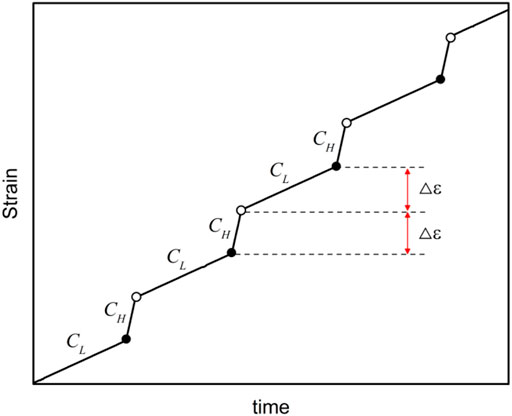
FIGURE 2. Increase in strain with time through an alternative strain rate (ASR) test. The strain rate is alternated between CL and CH at the predetermined strain interval △ε. CH/CL was set to 10 in all the tests.
In this study, the confining pressures were 0, 3, 6, and 9 MPa. The strain rate was alternated between 10−4/s (CH) and 10−5/s (CL), and the strain intervals were set to 5 × 10⁻⁴ (Δε) in uniaxial compression and 8 × 10⁻⁴ in triaxial compression, as per the suggestions of Hashiba et al. (2006). Data were recorded with a time step of 1 s. More than three specimens of each type of rock were employed for each testing condition.
Peak Strength
Figure 3 shows the typical stress-strain curves of Tage tuff and Jingkou sandstone recorded during the alternative strain rate tests (Hashiba et al., 2006; Lei et al., 2008). The results of the Ogino tuff and Emochi andesite were similar to those of the Tage tuff and Jingkou sandstone, respectively. The solid line represents an experimental stress-strain curve modulated with the alternating strain rate. The dashed lines are considered to be the stress-strain curves under low (CL) and high (CH) strain rates, which are obtained via spline interpolation (Hashiba et al., 2006). The peak strengths under CL and CH can be obtained from these stress-strain curves.
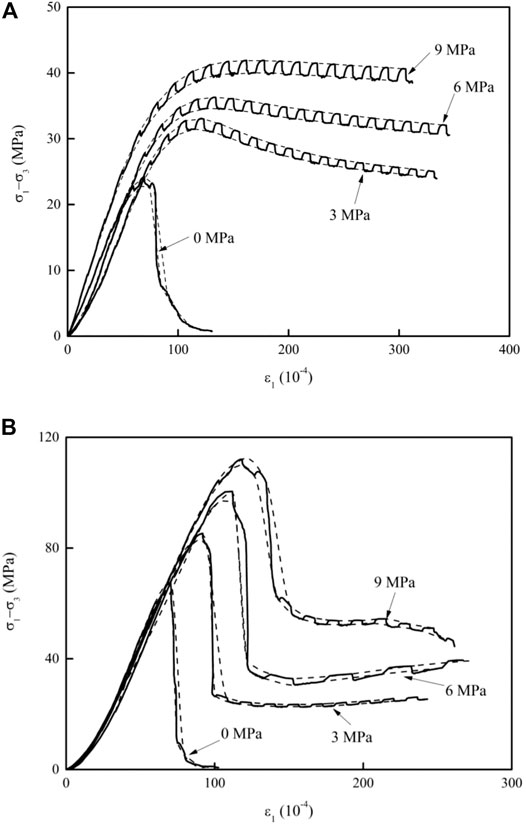
FIGURE 3. Stress-strain curves under different confining pressures in the ASR test. The dashed lines are obtained via spline interpolation. CH/CL = 10. (A) Tage tuff and (B) Jingkou sandstone.
For the Tage tuff presented in Figure 3A, stress fluctuation with alternating strain rates was not obvious at a low stress level. Subsequently, the stress fluctuation became increasingly obvious with the increasing strain. After achieving the peak stress, stress decreases with an increase in strain. The higher the confining pressure, the smaller the stress degradation. The stress continues to fluctuate with the alternating strain rate in the postfailure region, indicating the loading rate dependence of the region.
For the Jingkou sandstone presented in Figure 3B, stress fluctuation with alternating strain rates was not obvious at low stress levels. Then, a stress drop occurred after achieving peak strength. The stress drop under confining pressure is larger than that of the Tage tuff. Further, stress continues to fluctuate with the alternating strain rate in the postfailure region.
Figure 4 shows the peak strengths (differential stresses) of the four rocks under CL (open symbol) and CH (solid symbol). Each peak strength indicates the average value of the three specimens. The effects of the confining pressure on Jingkou sandstone and Emochi andesite were larger than those on the Tage tuff and Ogino tuff, respectively.
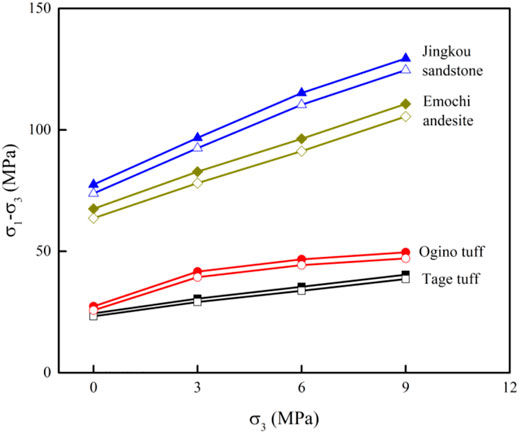
FIGURE 4. Relation between the peak strength (deviator stress) and confining pressure of four rocks under high and low strain rates (solid and open symbols, respectively). CH/CL = 10.
Figure 5A shows the relation between Δσ and the peak strength (differential stress). Δσ indicates the stress increment of the peak strength with a tenfold increase in the strain rate. Both the vertical and horizontal axes of the figure are normalized by the UCS. A straight line in the figure was obtained via a linear regression analysis. Data regarding the Ogino tuff and Jingkou sandstone were obtained from slightly above the line. In contrast, data regarding the Tage tuff and Emochi andesite were obtained from slightly below the line.
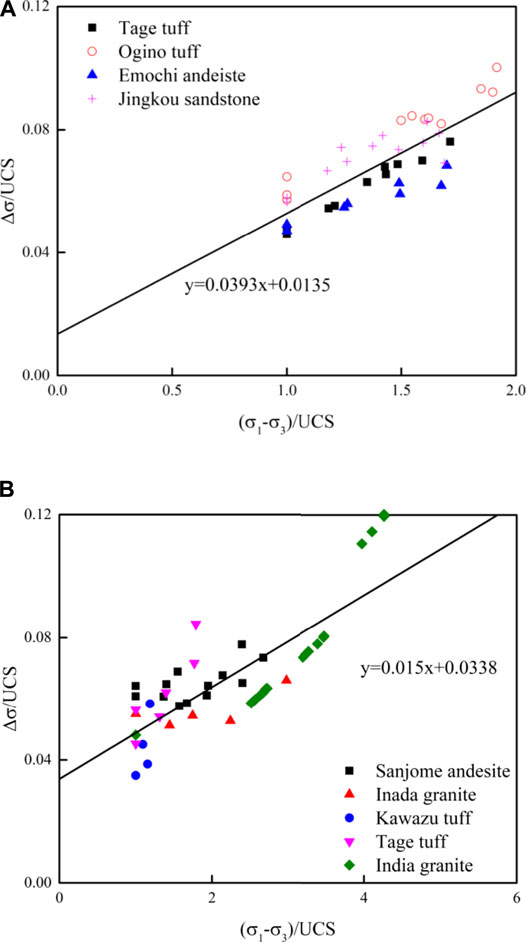
FIGURE 5. Increment of the peak strength with a tenfold increase in the strain rate, △σ. The vertical and horizontal axes are normalized based on the uniaxial compressive strength (UCS). The straight line indicates the fitting results of all data: (A) this study and (B) previous studies.
Figure 5B presents the results obtained by Okubo et al. (2013) and Hashiba and Fukui (2015). Previously, Δσ was calculated using the following equation (Hashiba and Fukui, 2015) based on the values of n:
where σf is the peak strength and n is the index of the loading rate dependence of peak strength (Okubo et al., 1990). A straight line was also obtained via a linear regression analysis.
In this study and previous studies, Δσ increases with the peak strength or confining pressure. Herein, the slope of the regression line is 0.0393, which is larger than that in a previous study, i.e., 0.0150. Data on the four types of rocks in Figure 5A show a similarly increasing rate or slope with the peak strength. In Figure 5B, the slope of the data varies with the type of rock. This potentially indicates the increased reliability of this study.
Residual Strength
The stress-strain curve differs significantly from specimen to specimen in the postfailure region. Therefore, it is almost impossible to obtain the loading rate dependence using the conventional testing method, wherein a specimen is tested using a predetermined loading rate and the results of many specimens are compared. To overcome the effects of scattering, Okubo et al. (1990) proposed a testing method in which the loading rate is increased once in a test. If the loading rate is increased just before the peak strength was achieved, the increase in stress with the increase in the loading rate can be interpreted as the loading rate dependence of peak strength. This testing method was successfully applied to obtain the loading rate dependence of peak strength. However, the successful application of this method requires considerable experience. Hashiba et al. (2006) proposed a new testing method in which the strain rate was alternately changed between low and high. This method has been extensively used, and its results have been reported (Okubo et al., 2006; Hashiba and Fukui, 2016). However, the loading rate dependence in postfailure regions remains unclear.
In postfailure regions, it is difficult to conduct tests when the strain rate is alternately varied. In particular, it is very difficult to conduct this test just after achieving peak strength, where the stress level tends to rapidly decrease. Therefore, we opted to obtain the loading rate dependence when the stress decreased gently and subsequently termed this as the residual stress region. As displayed in Figure 3, stress changes gently after the strain (critical strain) became 200 × 10−4 for Tage tuff. Therefore, this region is regarded as a residual stress region. After carefully examining the stress-strain curves, the critical strains were determined to be 200 × 10−4 for the Ogino tuff and 150 × 10−4 for the Jingkou sandstone and Emochi andesite.
The stress increment of the residual strength when considering a tenfold increase in the strain rate in the residual stress region (Δσr= σH− σL) was calculated using the method proposed by Hashiba et al. (2009). The σH and σL values were set equal to the stresses at the intersections of the straight line with the slope, which was equal to the unloading modulus and stress-strain curves at high and low strain rates, respectively.
Figure 6 shows the relation between the Δσr and residual strength (deviator stress) of the four types of rock samples. The vertical and horizontal axes of the figure were normalized by UCS. A straight line in the figure was obtained via a linear regression analysis with a slope of 0.0432. The slope of Δσ (0.0393) in Figure 5A is close to that of Δσr (0.0432) in Figure 6. This suggests the possibility that the mechanism of the loading rate dependence of residual strength is closely related to that of the peak strength.
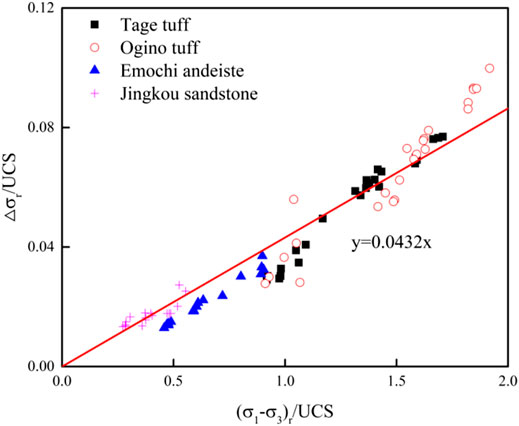
FIGURE 6. Increment of the residual strength with a tenfold increase in the strain rate, △σr. The vertical and horizontal axes are normalized based on the UCS. The straight line indicates the fitting results of all data.
Discussion
In this study, Δσ and Δσr increase with the confining pressure because the peak and residual strengths increase with the increasing confining pressure, indicating that the increment of peak strength under CH is larger than that under CL (or when Δσ is held constant). This phenomenon could be explained from the point of view of the evolution of microscopic cracks. At lower loading rates, there is sufficient time for cracks to propagate and connect to each other, resulting in decreasing peak strength. When considering a high strain rate, cracks propagate with the limit time, resulting in high strength. The higher the confining pressure, the greater the difficulty associated with crack propagation, and higher restrictions related to the confining pressure can be observed. However, the restriction is the difference for rocks CH and CL, resulting in a difference in strength increment under CH and CL with the increasing confining pressure. Therefore, Δσ increases in conjunction with the confining pressure. The effect of the confining pressure on Δσr can be explained in a similar manner as that of Δσ.
Figure 4 shows that the peak strength increases with the confining pressure; Figure 4A shows that Δσ increases with confining pressure. Eq. 1 can be approximated as follows (Hashiba and Fukui, 2015):
where
Okubo et al. (2013) and Hashiba (2015) show that n is directly proportional to the peak strength. Therefore, σfʹ/σf is almost equal to nʹ/n and △σʹ is almost equal to △σ, indicating that the confining pressure has little effect on the increase in strength with the increasing loading rate. Hashiba and Fukui (2015) also reported these results. However, the above discussion only pertains to rocks with low strength.
Conclusion
The loading rate dependence is closely related to the time-dependent behavior of rocks. However, the loading rate dependence in postfailure regions under confining pressure remains unclear. In this study, we experimentally investigated four rock types to clarify the loading rate dependence in both the peak and postfailure regions, where stress is observed to only decrease slowly.
Results indicate that the increase in residual strength when considering a tenfold increase in the strain rate (Δσr) is approximately proportional to 4% of the residual strength.
Furthermore, we established that the increase in peak strength when considering a tenfold increase in the strain rate (Δσ) increases approximately at the rate of 4% of the peak strength.
Eqs 2, 3 show that the percentage of stress change in the postfailure region was almost equal to that of the peak strength, and these equations were applicable to all the types of rocks investigated in this study. This is interesting, and future studies are necessary to determine whether these equations can be applied to a wider range of rock types. Regardless, the two aforementioned equations are very simple and easy to use for improving constitutive equations.
Future studies will also be necessary for dealing with the loading rate dependence at low stress levels in prefailure regions and just beyond the peak strength in postfailure regions. The former is related to the long-term stability of underground structures, whereas the latter is related to their collapse. In both cases, more accurate measurements and higher stability of the servo-control system are necessary.
Data Availability Statement
The original contributions presented in the study are included in the article/supplementary material; further inquiries can be directed to the corresponding author.
Author Contributions
Conceptualization, SO; methodology, YT and HZ; formal analysis, HZ; writing—original draft preparation, YT; writing—review and editing, YT, JX, and XL; funding acquisition, YT.
Funding
This research was funded by the Natural Science Foundation of Chongqing, China (cstc2019jcyj-msxmX0488), the Science and Technology Research Program of Chongqing Municipal Education Commission (KJQN201901338), and the China Postdoctoral Sciences Foundation (2021M693751).
Conflict of Interest
HZ was employed by the China Construction Seventh Engineering Division Co., Ltd.
The remaining authors declare that the research was conducted in the absence of any commercial or financial relationships that could be construed as a potential conflict of interest.
Publisher’s Note
All claims expressed in this article are solely those of the authors and do not necessarily represent those of their affiliated organizations or those of the publisher, the editors, and the reviewers. Any product that may be evaluated in this article or claim that may be made by its manufacturer is not guaranteed or endorsed by the publisher.
References
Gao, F., and Kang, H. (2017). Experimental Study on the Residual Strength of Coal under Low Confinement. Rock Mech. Rock Eng. 50 (2), 285–296. doi:10.1007/s00603-016-1120-z
Hashiba, K., and Fukui, K. (2015). Index of Loading-Rate Dependency of Rock Strength. Rock Mech. Rock Eng. 48 (2), 859–865. doi:10.1007/s00603-014-0597-6
Hashiba, K., and Fukui, K. (2013). Index of Time-Dependency for Rock and its Application for the Assessment of the Long-Term Stability of Underground structuresThe 2013 ISRM International Symposium. Wroclaw, Poland.
Hashiba, K., and Fukui, K. (2016). Time-dependent Behaviors of Granite: Loading-Rate Dependence, Creep, and Relaxation. Rock Mech. Rock Eng. 49 (7), 2569–2580. doi:10.1007/s00603-016-0952-x
Hashiba, K., Lei, M., Okubo, S., and Fukui, K. (2009). Loading-rate Dependency of Stress-Strain Curve for Rocks in the post-failure Region. J. Mining Mater. Process. Inst. Jpn. 125 (3), 98–105. doi:10.2473/journalofmmij.125.98
Hashiba, K., Okubo, S., and Fukui, K. (2006). A New Testing Method for Investigating the Loading Rate Dependency of Peak and Residual Rock Strength. Int. J. Rock Mech. Mining Sci. 43 (6), 894–904. doi:10.1016/j.ijrmms.2005.12.005
Hokka, M., Black, J., Tkalich, D., Fourmeau, M., Kane, A., Hoang, N. H., et al. (2016). Effects of Strain Rate and Confining Pressure on the Compressive Behavior of Kuru Granite. Int. J. Impact Eng. 91 (5), 183–193. doi:10.1016/j.ijimpeng.2016.01.010
Lajtai, E. Z., Duncan, E. J. S., and Carter, B. J. (1991). The Effect of Strain Rate on Rock Strength. Rock Mech. Rock Engng 24 (2), 99–109. doi:10.1007/bf01032501
Lei, M., Hashiba, K., and Okubo, S. (2008). Loading Rate Dependency of Complete Stress-Strain Curve of Various Rock Types. China: Proc. 14th World Conf. Earthquak. Eng. Beijing.
Mahanta, B., Tripathy, A., Vishal, V., Singh, T. N., and Ranjith, P. G. (2017). Effects of Strain Rate on Fracture Toughness and Energy Release Rate of Gas Shales. Eng. Geology. 218, 39–49. doi:10.1016/j.enggeo.2016.12.008
Mahmutoğlu, Y. (2006). The Effects of Strain Rate and Saturation on a Micro-cracked marble. Eng. Geo. 82, 137–144.
Okubo, S., Fukui, K., and Qi, Q. (2006). Uniaxial Compression and Tension Tests of Anthracite and Loading Rate Dependence of Peak Strength. Int. J. Coal Geol. 68 (196–204), 196–204. doi:10.1016/j.coal.2006.02.004
Okubo, S., Hashiba, K., and Fukui, K. (2013). Loading Rate Dependency of the Strengths of Some Japanese Rocks. Int. J. Rock Mech. Mining Sci. 58 (1), 180–185. doi:10.1016/j.ijrmms.2012.09.003
Okubo, S., Nishimatsu, Y., and He, C. (1990). Loading Rate Dependence of Class II Rock Behaviour in Uniaxial and Triaxial Compression Tests-An Application of a Proposed New Control Method. Int. J. Rock Mech. Mining Sci. Geomechanics Abstr. 27 (6), 559–562. doi:10.1016/0148-9062(90)91007-t
Sano, O., Ito, I., and Terada, M. (1981). Influence of Strain Rate on Dilatancy and Strength of Oshima Granite under Uniaxial Compression. J. Geophys. Res. Atmosph. 86 (10), 9299–9311. doi:10.1029/jb086ib10p09299
Tang, Y., Okubo, S., Xu, J., and Peng, S. (2019). Progressive Failure Behaviors and Crack Evolution of Rocks under Triaxial Compression by 3D Digital Image Correlation. Eng. Geology. 249, 172–185. doi:10.1016/j.enggeo.2018.12.026
Tang, Y., Okubo, S., Xu, J., Zhang, H., and Peng, S. (2018). Loading-Rate Dependence of Rocks in Postfailure Region under Triaxial Compression. Adv. Mater. Sci. Eng. 2018, 1–12. doi:10.1155/2018/1496127
Wang, J., Wang, X., Zhang, Q., Song, Z., and Zhang, Y. (2021b). Dynamic Prediction Model for Surface Settlement of Horizontal Salt Rock Energy Storage. Energy 235, 121421. doi:10.1016/j.energy.2021.121421
Wang, J., Zhang, Q., Song, Z., and Zhang, Y. (2020). Creep Properties and Damage Constitutive Model of Salt Rock under Uniaxial Compression. Int. J. Damage Mech. 29 (6), 902–922. doi:10.1177/1056789519891768
Wang, J., Zhang, Q., Song, Z., Zhang, Y., and Liu, X. (2021a). Mechanical Properties and Damage Constitutive Model for Uniaxial Compression of Salt Rock at Different Loading Rates. Int. J. Damage Mech. 30 (5), 739–763. doi:10.1177/1056789520983868
Keywords: triaxial compression, loading rate, residual strength, peak strength, postfailure region
Citation: Tang Y, Zhang H, Xu J, Okubo S and Liu X (2021) Loading Rate Dependence of Rock Strength Under Triaxial Compression. Front. Earth Sci. 9:728366. doi: 10.3389/feart.2021.728366
Received: 21 June 2021; Accepted: 16 August 2021;
Published: 09 September 2021.
Edited by:
Junbao Wang, Xi’an University of Architecture and Technology, ChinaReviewed by:
Shiyu Liu, Huaqiao University, ChinaYanjun Shen, Xi’an University of Science and Technology, China
Copyright © 2021 Tang, Zhang, Xu, Okubo and Liu. This is an open-access article distributed under the terms of the Creative Commons Attribution License (CC BY). The use, distribution or reproduction in other forums is permitted, provided the original author(s) and the copyright owner(s) are credited and that the original publication in this journal is cited, in accordance with accepted academic practice. No use, distribution or reproduction is permitted which does not comply with these terms.
*Correspondence: Hailong Zhang, zhanghl@cqwu.edu.cn