Quantitative Analysis of the Debris Flow Societal Risk to People Inside Buildings at Different Times: A Case Study of Luomo Village, Sichuan, Southwest China
 Li Wei
 Kaiheng Hu
 Jin Liu3
- 1Key Laboratory of Mountain Hazards and Earth Surface Process, Chinese Academy of Sciences, Chengdu, China
- 2Institute of Mountain Hazards and Environment, Chinese Academy of Sciences, Chengdu, China
- 3Three Gorges Jinsha River Chuanyun Hydropower Development Co., Ltd., Chengdu, China
Debris flows, which cause massive economic losses and tragic losses of life every year, represent serious threats to settlements in mountainous areas. Most deaths caused by debris flows in China occur in buildings, and the death toll is strongly dependent on the time people spend indoors. However, the role of time spent indoors in the quantitative analysis of debris flow risk has been studied only scarcely. We chose Luomo village in Sichuan atop a debris flow alluvial fan to study the influence of the temporal variation in the presence of people inside buildings on the societal risk. Two types of days (holidays vs. workdays) and two diurnal periods (daytime vs. nighttime) were considered in our risk evaluation model. A questionnaire survey was conducted for each family in the village, and the probability of the temporal impact of a debris flow on every household was calculated based on the average amount of time each member spent in the house. The debris flow hazard was simulated with FLO-2D to obtain the debris flow intensity and run-out map with return periods of 2, 10, 50, and 100 years. The risk to buildings and societal risk to residents were calculated quantitatively based on the probabilities of debris flow occurrence, the probability of the spatial impact, and the vulnerabilities of buildings and people. The results indicated that societal risk on holidays is always higher than that on weekdays, and societal risk at night is also much higher than that in the daytime, suggesting that the risk to life on holidays and at night is an important consideration. The proposed method permits us to obtain estimates of the probable economic losses and societal risk to people by debris flows in rural settlements and provides a basis for decision-making in the planning of mitigation countermeasures.
Introduction
Debris flows are the most frequent and destructive hazards in mountainous regions. In particular, China is affected by debris flows every year and consequently suffers enormous casualties and losses of property, especially in rural settlements. During the period 2005–2018, China experienced 12,836 debris flow events (Technical guidance center for geological hazards, 2018, Ministry of natural resources of China, 2018), with approximately 855 events occurring every year. The majority of these disasters occurred in rural settlements with poor disaster prevention and recovery capabilities (Chen et al., 2013; Li et al., 2016; Ding et al., 2018). For example, the 2017 debris flow that occurred in Tongzilin Gully caused 25 fatalities and economic losses totalling 160 million RMB in Luomo village, and the 2018 debris flow disaster that struck Jiajia Gully led to 31 fatalities and destroyed 18 buildings in Shuimo County.
In the context of these hazards, quantitative risk assessments of debris flows have become an indispensable tool for risk management and mitigation. The two priorities in the assessment of debris flow risk in rural settlements are evaluating the risks posed to buildings and life; however, while the risk to buildings has been studied by many researchers, few studies have focused on the risk to life. The dynamics of the populace significantly affect the exposure of people to natural hazards and the corresponding risk to life (Chen et al., 2004; Aubrecht et al., 2012; Ara, 2014), particularly because the locations and presence of people in rural settlements always vary with the time of day (Van Westen, 2004). Many studies have carried out risk evaluations of seismic hazards (Aubrecht et al., 2012; Ara, 2014), tsunamis (Taubenböck et al., 2009), residential fires (Sekizawa, 1991) and risk management (Zhang et al., 2013; Aubrecht et al., 2014) in consideration of the spatiotemporal distribution of the residential population. For example, ARA. (2014) assessed the impact of the spatiotemporal distribution of the residential population on earthquake loss in Bangladesh. The population in each building was considered separately during the daytime and nighttime for the modelling, and the result indicated a high positive correlation between the spatiotemporal distribution of the population and the potential fatalities. Taubenböck et al. (2009) calculated the population distributions in buildings with different purposes based on a questionnaire survey combined with an automatic object-oriented, hierarchical classification methodology. Furthermore, the temporal distribution of the residential population is also closely related to emergency rescue and evacuation plans in risk management. However, relatively little research has been carried out on the impact of the temporal distribution of the residential population on the debris flow risk. The most common approach is to employ the statistical average number of work hours to reflect the temporal impact on risk to life (Bell and Glade, 2004; Corominas et al., 2005; Mousavi et al., 2011); however, this metric cannot indicate the presence of the population in different locations and at different times of day.
According to statistics of the time of death caused by debris flow disasters in China, most casualties occurred inside buildings at night (Wei, 2020), and the number of fatalities differed significantly between holidays and workdays. Nevertheless, the number of inhabitants living on debris flow fans, which are prone to further debris flows, continues to increase as a consequence of the relocation and settlement programme in China (Li et al., 2017). Moreover, the relocated populace tends to be concentrated; as a result, debris flows pose serious threats to the buildings and residents in these rural settlements. Therefore, to conduct a pragmatic risk assessment, it is necessary to analyse the impacts of the temporal distribution of the population in buildings on the societal risk posed by debris flows.
In this paper, a quantitative risk assessment approach is developed to investigate the debris flow risk to buildings and life in a rural settlement in Southwest China. The impacts of temporal variations in the presence of the residential population in buildings on the societal risk are evaluated by separately analysing the distributions of people on holidays and workdays and during the daytime and nighttime. The quantitative risk results will be helpful for identifying high-risk groups in rural settlements and for reducing property damage and loss of life.
Study Area
Geomorphology
Luomo Village is a small rural settlement (102°37′47″E, 27°35′42″N) situated 364 km southwest of the capital city of Sichuan Province. The village is located on the debris fan of Niunaidu Gully (Figure 1), which frequently experiences debris flows that pose a serious threat to Luomo village.
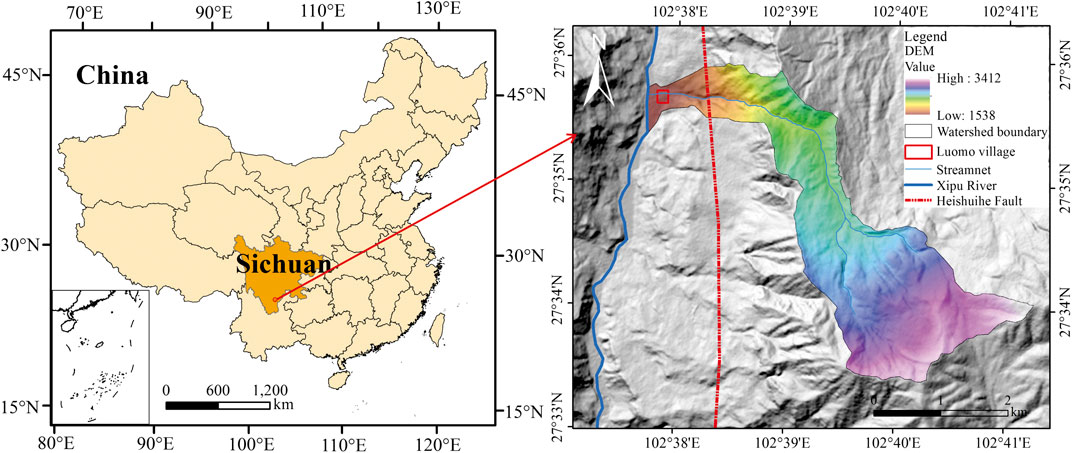
FIGURE 1. Location and topographical map of Niunaidu Gully.
Niunaidu Gully is a moderate-elevation mountainous landform cut by various ravines; in plan view, the shape of the gully is approximately rectangular with an area of 7.47 km2, and the length of the main channel is approximately 5.2 km. The elevation of the watershed varies from 3,412 m above sea level (a.s.l.) to 1,538 m a.s.l. with a relative height difference of 1874 m. From the mouth of the gully to the junction of the debris flow gully with the main Xiluo River, the overall longitudinal gradient of the main channel changes greatly from 120‰ in the upper reaches to 210–470‰ in the middle and lower reaches and 150–180‰ in the lower reaches (Panzhihua Lulingyi Geological Engineering Co., LTD, 2019). The zone of debris flow transport is located in the elevation range of 1,600–2,300 m, and the deposition zone is located below 1,600 m.
Geology
The main fault developed in Niunaidu Gully is the Heishuihe Fault, which strikes north-south and is approximately 75 km. According to the ground motion parameter zoning map of China (GB18306–2015), the peak ground acceleration and peak period of the seismic response spectrum in the study area are 0.30 g and 0.45 s, respectively, indicating a high seismic intensity. Primarily Quaternary debris flow deposits and Holocene diluvium containing cobbles and gravel are distributed along the main channel, whereas mainly Quaternary colluvial deposits occupy the middle and lower parts of the gully slopes, and the bedrock is predominantly intrusive rock from the Yanshanian to the Indosinian. The region is characterized by a large number of collapses and unstable slopes due to the complex geological conditions, providing an abundance of loose sediment for debris flows. The loose sediments are mainly produced from landslide, rock avalanche and soil erosion on slope. According to a detailed field investigation and the interpretation of remote sensing imagery, approximately 603,600 m3 of loose sediment has been deposited in the main channel and upper slope with elevation above 2300 m (Panzhihua Lulingyi Geological Engineering Co., LTD, 2019).
CLIMATE
The climate in the study area is controlled by the southwest monsoon and the dry continental air of northern India with distinct wet and dry seasons. There are no rainfall observation facilities in Niunaidu Gully. The annual mean precipitation of Puge County is 1,176.3 mm, and the maximum and minimum amounts of annual precipitation are 1,291.2 and 601.5 mm, respectively, where 89.2% of all precipitation falls from May to October. The maximum daily, hourly, and 10 min amounts of precipitation are 157.5, 51.2, and 15.2 mm, respectively. According to isolines of the annual precipitation in Puge County, the average annual amount of precipitation that falls in the Niunaidu Basin is approximately 900–1000 mm.
RESIDENTS
Luomo village has been settled for approximately 30 years, having been built on what was once forestland, and the local people are mainly ethnic Yi. Today, approximately 400 people live in this village, and the number of residents is increasing due to policies intended to alleviate poverty and relocate the populace in China. The main livelihood for the villagers is grazing and farming, and the proportion of teenagers is relatively high. Primary school and kindergarten children account for 46.2% of the total population, while secondary and high school students account for only 8.9% of the total.
Historical Debris Flow Events
A catastrophic debris flow struck this area at approximately 02:30 on July 2, 1987, damaging approximately 40 houses of the forest protection station located on the fan. These houses were uninhabited at that time; hence, only one person, who was inebriated in the forest, died as a result of the event. Then, debris flows in the gully occurred again in 1997, 2006, 2016, and 2017; fortunately, these events did not result in vast property damage or considerable loss of life. As evidenced by these events, debris flows continue to pose a severe threat to Luomo village, and mitigation measures are urgently needed.
Methodology
Risk Calculation
In this paper, only the risk to buildings and the societal risk to people in buildings are considered. The risk to buildings is defined as the annual loss of building value, while the societal risk refers to the annual probability that one or more persons within buildings will be killed by debris flows (Dai et al., 2002). The approach used to calculate the risks is based on Morgan et al. (1992). The calculation method is as follows:
where R(BD) is the annual loss of building value, P(H) is the annual probability of debris flow occurrence,
When an element may be affected by debris flows triggered by different return periods, the risk induced by debris flows of different sizes needs to be summed to give the total risk (Fell et al., 2005). Then, Equation 1 and Equation 2 should be written as
where n is the number of debris flow hazards.
Probabilities of the Annual Debris Flow Occurrence, Seasonal Debris Flow Occurrence and Temporal Impact
The annual probability of debris flow occurrence P(H) was roughly determined by the recurrence interval of triggering rainfall used in this study. The seasonal probability of debris flow occurrence
Hazard Simulation
The probability of the spatial impact
where
where α and β are empirical coefficients obtained from a laboratory test and Cv is the volumetric concentration of sediment.
The input parameters in FLO-2D include the Manning coefficient n, laminar flow resistance parameter k, and empirical coefficients α and β. In addition, debris flow discharge is also required as a boundary condition for the simulation.
Vulnerability
Vulnerability is defined as the “degree of loss” of a given element exposed to a debris flow of a given magnitude, and the value ranges from 0 (no loss) to 1 (total loss) (Silva and Pereira, 2014). The vulnerability of people was assigned a value of 0.9, and the vulnerability of a person in a building was determined by multiplying the vulnerability of the building by the vulnerability of people, namely, 0.9 times that building’s vulnerability.
The vulnerability of buildings V(B) in this study was determined based on the debris flow intensity and the characteristics of buildings according to Silva and Pereira (2014) as follows:
where M and R are the debris flow intensity and building resistance, respectively. Both the intensity and the resistance range from 0 to 1. The value of intensity was assigned based on the depth and velocity of the debris flow at the location of the specific building derived from the result of a hazard simulation (BUWAL, 1997; Petrascheck and Kienholz, 2003; Rickenmann et al., 2006). The classification of the intensity and proposed values are presented in Table 1.
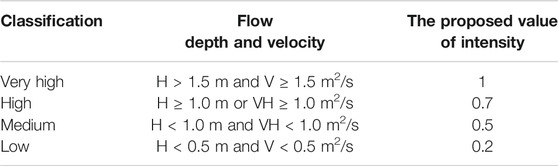
TABLE 1. Classification of the intensity and proposed values.
Building resistance is the inherent specific characteristics of the buliding that can withstand certain intensity (Li et al., 2010). All the relevant indicators should be considered (Papathoma-Köhle et al., 2011), but it is hard to collect all the relevant information in practice. Four characteristics of bulidings were deterimeined to be important, these characteristics are constructuction structre, number of floors, buliding row toward specific torrent, the bounding wall range. The buliding resistance of individual buliding was calculated by modifying the equation proposed by Silva and Pereira (2014) as follows:
where CS is the resistance score for the construction structure; NF is the resistance score for the number of floors; BR is the resistance score for the number of the row of the building from the torrent -; BW is the resistance score for the bounding wall range; and a, b, c, and d are the weights of CS, NF, BR, and BW, respectively.
Based on the relative contribution of each weight to the building vulnerability, the values of a, b, c, and d are taken as 0.4, 0.15, 0.3, and 0.15, respectively. The resistance scores of the four factors and the weights of CS, NF, BR, and BW are presented in Table 2. These values were determined based on expert knowledge and a detailed investigation of historical debris flow events that occurred in Southwest China.
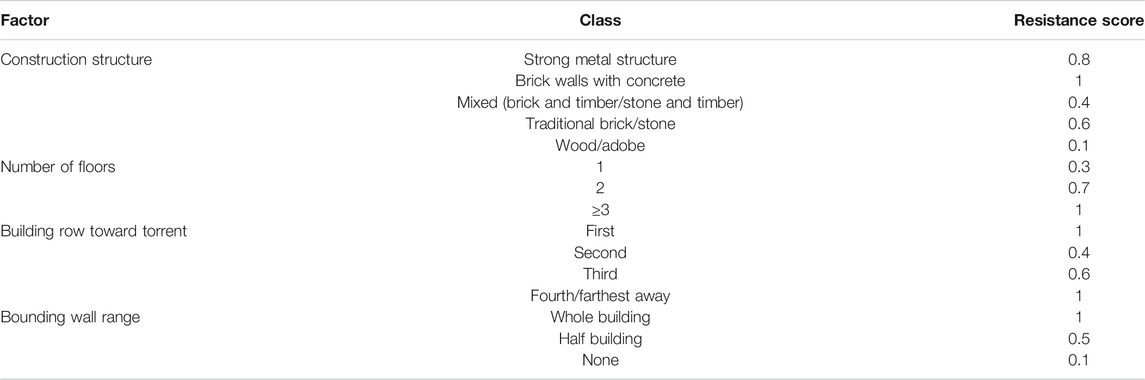
TABLE 2. Proposed values of the resistance scores of buildings.
Risk Analysis
Debris Flow Analysis
Luomo village has experienced various debris flow disasters of different sizes throughout its 30 years history. Events with different sizes and return periods of 2, 10, 50, and 100 years (annual occurrence probabilities P (H) = 0.5, 0.1, 0.02, and 0.01, respectively) were simulated for run-out and intensity calculations. The intensities of rainfall with 2-, 10-, 50-, and 100-years return periods were 54.6, 91.8, 124.8, and 138.6 mm/day, respectively. The peak flow discharges triggered by the rainfall with these four return periods were calculated based on the empirical methods in the Specification of Geological Investigation for Debris Flow Stabilization (China geological disaster prevention engineering association, 2018). The detailed calculation process is illustrated in Liu et al. (2014).
A digital elevation model (DEM) of the Niunaidu watershed with a spatial resolution of 2 m × 2 m was employed for the simulations. Values of 0.09, 0.12, and 0.2 were adopted for Manning’s roughness coefficient for gully, arbour forest, and building areas, respectively, and n = 0.04 was determined for the rest of the simulation area. The resistance parameter K was assumed to equal 2,285, which was typically used in the literature (Tecca et al., 2007; Chen and Chuang, 2014; Castellia et al., 2017).
The volumetric concentration
where
Both the yield stress and the viscosity depend on the volumetric debris flow concentration
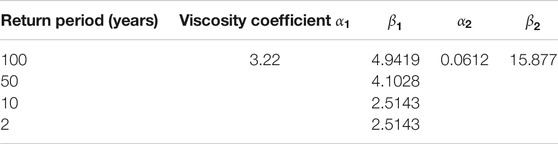
TABLE 3. Empirical coefficients used in the FLO-2D debris flow modelling.
The debris flow run-out map is shown in Figure 2. Based on a field investigation, the return period of the rainfall that triggered the 1987 debris flow event was 50 years (Panzhihua Lulingyi Geological Engineering Co. LTD, 2019). Figure 3 clearly shows that the simulated run-out zone of a debris flow with a 50-years return period is roughly consistent with the extent of the run-out zone corresponding to the 1987 event, indicating the high accuracy of the simulation.
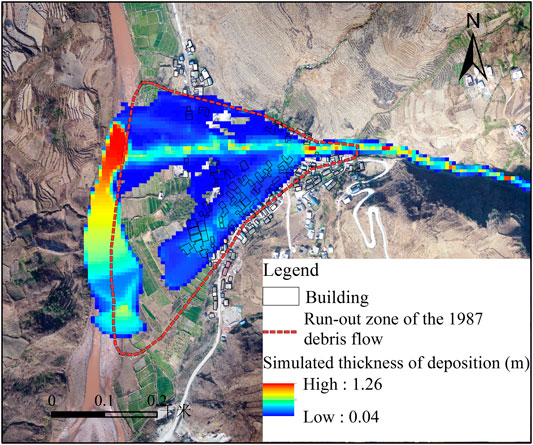
FIGURE 2. Distribution of building vulnerability values in Luomo village (T = 100 a).
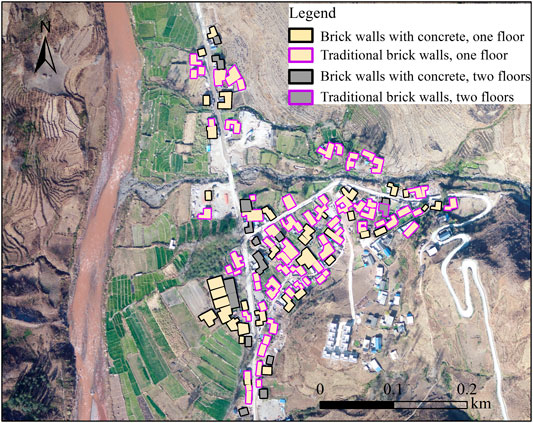
FIGURE 3. Run-out zone for a debris flow with a recurrence interval of 50 years in Niunaidu Gully.
Vulnerability
The characteristics of buildings were acquired from a field investigation. Figure 4 and Figure 2 show the spatial distributions of construction structures and the number of floors of buildings in the village. Most buildings in Luomo village are brick structures with one floor, and the bounding walls always surround half of the building area. The vulnerability of buildings was calculated according to Equation 5 and Equation 6, and the vulnerability of buildings affected by a debris flow with a 100-years return period is presented in Figure 5. The maximum building vulnerability is 0.315, and highly vulnerable buildings are distributed mainly near the channel.
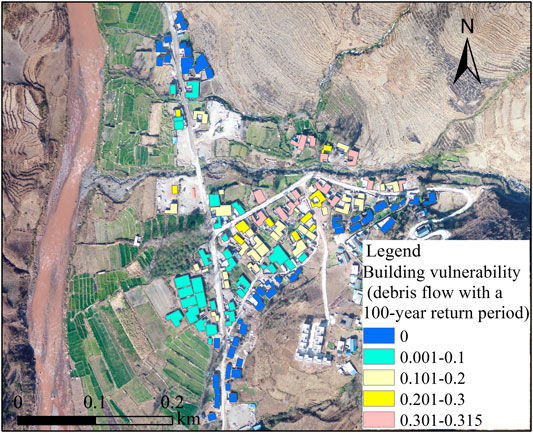
FIGURE 4. Distributions of construction structures and the number of floors of buildings in Luomo village.
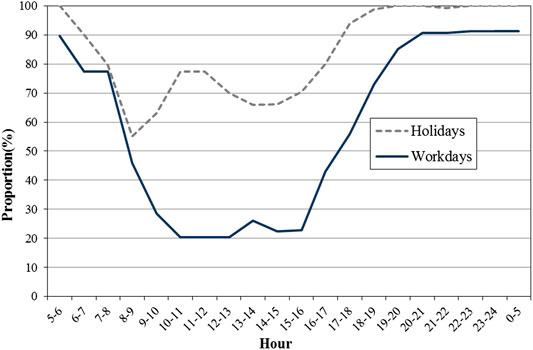
FIGURE 5. Proportions of household members in buildings at different times on different days.
The vulnerability of people was assumed to be 0.9; therefore, the vulnerability of a person in a building was calculated as 0.9 times that building’s vulnerability.
Presence of People in Buildings
The majority of injuries and fatalities caused by debris flows in China occur in buildings, which is primarily the consequence of damage to the building. Only the risk to the life of people in buildings was considered in this study. Therefore, the duration that people stay inside a building is required to determine the probability of the temporal impact
The residents of Luomo village are farmers, herders, housewives, students, and shopkeepers. The periods during which people are present in different buildings vary greatly. To determine the durations of residents within buildings, the details of human activities in each building were obtained by conducting a survey of people in their residences. Based on the method proposed by Pratima (2005), data on the hourly presence of each family member were recorded, and then the total number of people in a given building was summed up for each hour. Next, the number of people in the whole village during each hour on holidays (including the weekend) and workdays and during the daytime and nighttime were calculated, and the results are presented in Figure 6 and Table 4.
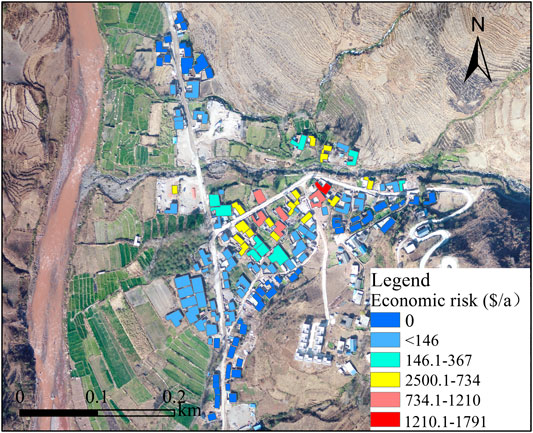
FIGURE 6. Risk map for buildings in Luomo village.

TABLE 4. Proportions (%) of household members in buildings in Luomo Village on different days.
Figure 5 demonstrates that the proportion of people inside buildings varies distinctly between daytime and nighttime, and there is also a significant difference between holidays and workdays. The proportions of people inside buildings on holidays and on workdays show similar patterns throughout a given day, and the trends exhibit three periods. The number of people staying indoors decreases sharply beginning at 06:00 and then increases significantly beginning at 16:00, and the proportion fluctuates during 06:00–16:00. Both on holidays and on weekends, the most people are present at night, while the fewest people are within buildings at noon. According to the statistics of debris flow events that occurred in Southwest China, the fatalities caused by debris flows occurred mainly during the period of 20:00–06:00. Therefore, we divided a day into two time periods, namely, daytime (06:00–20:00) and nighttime (20:00–06:00), to explore the proportions of people within buildings during these two periods for holidays and workdays. The maximum difference between the proportion of people in buildings during the daytime and that during the nighttime on holidays is approximately 40%, while that on workdays is approximately 70%. Furthermore, the maximum difference between the proportion of people in buildings during the daytime on holidays and on workdays is approximately 60%, while that during the nighttime is 10%; this disparity occurs because students living on campus go back to the village on holidays. The high proportions of people present in buildings at night and on holidays correspond to an increased risk to the lives of those residents. Therefore, it is necessary to calculate the risk to life of people in buildings separately for the daytime and for the nighttime and on both holidays and workdays.
Probability of the Temporal Impact
The temporal probabilities of a particular person in a building
where
Risk to Buildings
The seasonal probability of debris flow occurrence
The risks to buildings posed by debris flows with different return periods were calculated separately, and the total risk of buildings was obtained by summing the risks caused by the four scenarios. Figure 5 presents the risk to buildings in Luomo village. The total potential loss of buildings in the village amounts to approximately $18,600 per year, and the maximum economic loss of a single building is $1759. In Puge County, the 2017 average disposable personal income (DPI) of a family with four members was $5,271. Thus, the risk to buildings is relatively low compared with the average income of a household.
Societal Risk to People in Buildings
We have heretofore assumed that the probability of the temporal impact

FIGURE 7. Societal risk map on holidays in Luomo village.

FIGURE 8. Societal risk map on workdays in Luomo village.
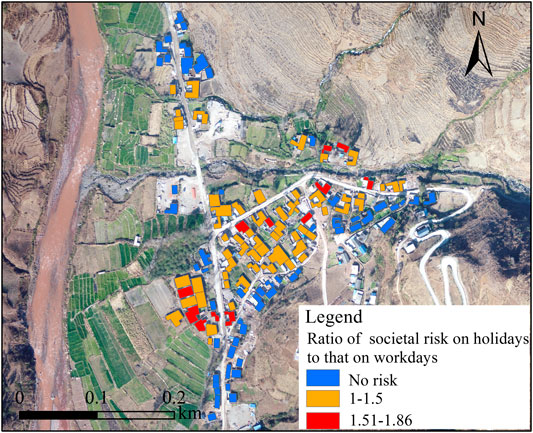
FIGURE 9. Ratio of societal risk on holidays to that on workdays in Luomo village.
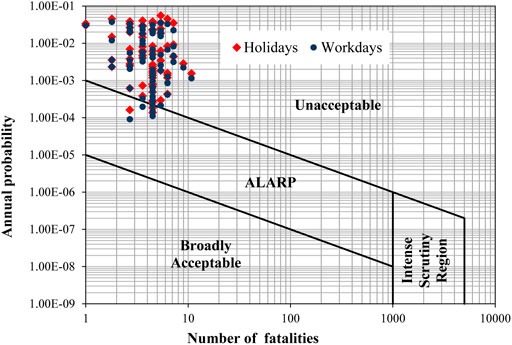
FIGURE 10. F–N curves for the debris flow societal risk on holidays and workdays in Luomo village.
Moreover, the societal risk to people in the daytime and nighttime was calculated separately (Figures 11 and 12), the ratios of the risk values during the nighttime to those during the daytime are presented in Figure 13. In addition, the values were similarly plotted in an F-N chart (Figure 14 During the daytime, the values of societal risk to people staying inside seven buildings fall within the ALARP risk zone, and the values of societal risk to people living in 65 buildings fall within the unacceptable zone. In contrast, during the nighttime, the number of buildings with societal risk values falling within the ALARP zone decreases from 7 to 5, and the number of buildings within the unacceptable zone increases from 65 to 69. Furthermore, the ratios of the individual risk in each building during the nighttime to that during the daytime range from 1.0 to 7.1, which indicates a distinctly significant difference in societal risk among different buildings between these two time periods.

FIGURE 11. Societal risk map during the daytime in Luomo village.
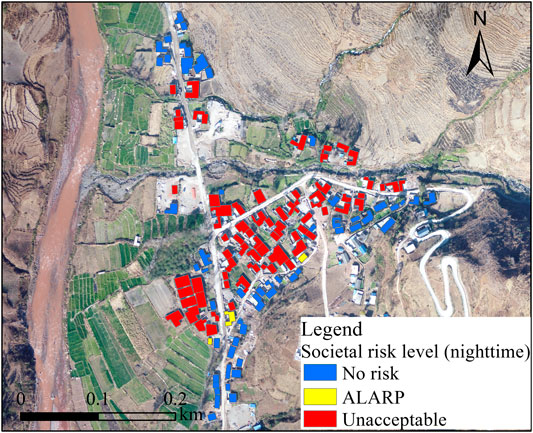
FIGURE 12. Societal risk map during the nighttime in Luomo village.
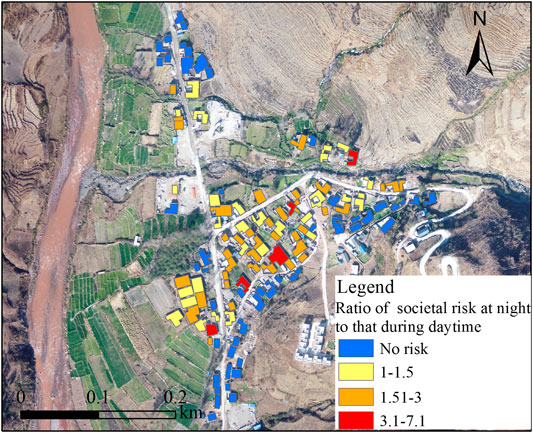
FIGURE 13. Ratio of the societal risk during the daytime to that at night in Luomo village.
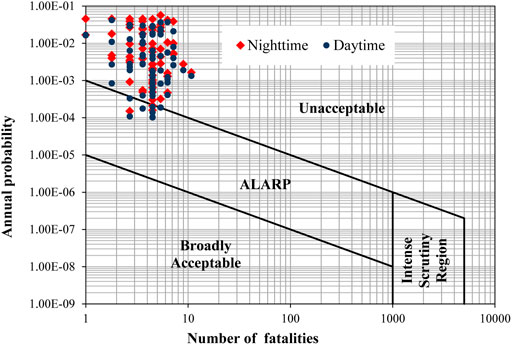
FIGURE 14. F–N curves for the debris flow societal risk during the daytime and nighttime in Luomo village.
Discussion
The paper provides a procedure to quantitatively evaluate the debris flow risk to buildings and human life in a rural settlement. The specificity of this procedure resides in distinguishing the presence of residents on different types of days and during different times of day rather than using rough estimates of the time people spend in their houses. The risk results show that the risk to buildings in Luomo village is relatively low. However, the societal risk to people in most buildings is considered unacceptable by the (Geotechnical Engineering Office, 1998) of Hong Kong (1998). It is worth noting that the societal risk to people on holidays is generally higher than that on workdays: the average risk on holidays is 1.35 times the risk on workdays. The distinct increase in risk on holidays is affected mainly by the occupation of the local people. Among all the inhabitants, the students including primary school and kindergarten children, secondary and high school students take a large proportion (55.1% of the total). All the students stay at home on holidays and result in high proportions in buildings. Moreover, the overall risk to a person at night is greater than that to a person in the daytime: the average risk at night is 1.79 times that in the daytime. The significant difference in risk between the daytime and nighttime is caused mostly by the presence of children at home after school and the return of the shepherds. This shows likelihood strategy and age structure has a significant effect on the presence of people in buildings in China. For example, the more students in the settlement, the greater the disparity of societal risk may be between on holidays and workdays. The more residents who work at home, the smaller the differences of risk may be during the daytime and nighttime.
The safety of human life is the chief motivation of controlling and preventing debris flows in China. The distinctions made with regard to the societal risk between the two types of days and between the two time periods allow more careful and comprehensive plans to be made for non-structural debris flow mitigation measures. When the debris flow risk to life exceeds the acceptable standard, a series of effective measures should be taken to reduce the risk. The majority of fatalities caused by debris flows are attributable to damage to buildings. Thus, damage to buildings and the presence of people indoors are the two factors that result in the death of people within buildings. Between them, the destruction of buildings is related to debris flow hazards and the building vulnerability, while the presence of people within buildings is affected by multiple factors, such as the climate conditions, age, livelihood strategies, occupation, awareness of disaster prevention, and building function. Therefore, to reduce the debris flow risk to life, both the risk to buildings and the probability of the presence of people in buildings should be reduced by mitigation measures.
The debris flow risk to buildings is reduced mainly through controlling the hazard and decreasing the building vulnerability. For the first approach, debris flow prevention and control measures are already required in the Niunaidu Gully to reduce the debris flow occurrence frequency and dynamic intensity. For the second approach, measures to reduce the vulnerability of buildings include the relocation, optimization, and improvement of construction structures and the construction of protective facilities (Attems et al., 2019).
Debris flows are ubiquitously characterized by their sudden occurrence with a relatively high flow velocity, and their impact forces result in a low survival rate for people indoors. Therefore, reducing the probability of people within buildings when a debris flow occurs is essential for decreasing the risk to life. First, the accuracy of monitoring and early warning systems should be enhanced to guide scientific decisions for evacuation (Cui, 2009). Second, the public perception of risk should be improved by publicity and evacuation drills, which should emphasize the safety of families comprising only the elderly, children, and foreign tenants. Finally, high-strength evacuation shelters with reasonable layouts should be constructed to reduce the reluctance of residents to evacuate due to the concern about the safety of the shelter and the length of the evacuation route.
To date, the authorities of Puge County have planned a series of engineering countermeasures in Niunaidu Gully, including the construction of check dams, protection embankments, and the construction of a culvert along the highway. However, some new buildings were constructed in the area very close to the channel because the owners considered this region to be very safe after the implementation of structural measures. Hence, it will be necessary to evaluate the residual risk after the implementation of these mitigation measures, and substantial work is required to improve the disaster prevention awareness of the residents of Luomo Village.
Taking into account the steps of the risk calculation, some limitations and uncertainty are involved. Some data in the study have to be assumed subjectively. For example, the vulnerability indictors of building and the corresponding weights are assumed subjectively. The uncertainty indicated buildings vulnerability should be investigated in detail, sufficient samples of buildings damaged by debris flow are required to get more accurate indictors for the vulnerability. In relation to vulnerability of people, a constant value of 0.9 was assigned, which is not realistic since the vulnerability of a person varies with the magnitude or intensity of the debris flow. Moreover, the probability of temporal impact to people was determined by the average value among all family members, which ignores differences in the activity and duration among the different family members.
Furthermore, it should be noted that the specific societal risk in different times in Luomo village can only be a reference for concentrated rural settlement where likelihood strategy and age structure are similar to Luomo village. The farmers’ likelihood activities vary greatly with the social and economic conditions in China, especially in the southwestern ethnic areas (He, 2013). For example, in another village called Dahuadi village in Puge County, the proportion of teenagers is low and the main livelihood for the villagers is sericulture, residents stay in the house most of the day during the summer, therefore the difference of societal risk at different times is small. Besides, societal risk of a settlement at different times is not constant because the likelihood strategy and age structure are likely to change with time (Ding et al., 2020). Future research should be conducted to discuss societal risk in different times in other types of rural settlement with non-agricultural activities such as tourism services and factory work, which can deepen our understanding of the impact of temporal presence of people in buildings on societal risk of debris flow.
Conclusion
Damage to buildings and loss of life are the two serious consequences induced by debris flows in rural settlements. The debris flow risk to persons can be reduced effectively by knowing the accurate and dynamic distribution of the residents. The study develops a concise method to calculate the probabilities of the temporal impact on the life of residents in buildings and first provides visual societal risk to people inside buildings at different times in the F-N chart in a concentrated rural settlement in Southwest China. This approach is more reliable and applicative than the rough estimate method. In addition, we proposed a novel quantitative analysis procedure to evaluate the impact of the temporal variation in the presence of people in buildings on the societal risk of debris flows. First, debris flows with return periods of 2, 10, 50, and 100 years were simulated through FLO-2D to obtain the run-out zones and intensities of the debris flows. Then, both the hazard intensity and the building resistance were selected to calculate the building vulnerability, and four factors, namely, the construction structure, the number of floors, the number of the row of the building from the torrent, and the bounding wall range, were used to determine the building resistance with different weights. The probability of the temporal impact on people was obtained by a questionnaire survey and calculated as the average percentage of amount of time every member spent in the building. Finally, the risk to buildings and the societal risk to people inside buildings were calculated, and the societal risk was calculated on two types of days, namely, holidays and workdays, and during the daytime and the nighttime of a given day separately.
The final results show that the total potential loss of buildings in Luomo village is relatively low. However, the societal risks to residents in 67 buildings on workdays and 69 buildings on holidays are considered unacceptable by the (Geotechnical Engineering Office, 1998) of Hong Kong (1998): the risk on holidays is 1.0–1.86 (average of 1.35) times that on weekdays. Moreover, the societal risks of residents in 65 buildings in the daytime and 69 buildings at night are similarly unacceptable: the risk in the nighttime is 1.0–7.1 (average of 1.79) times that in the daytime. The results further reveal that the activities of people on different types of days or at different times play an important role in the ultimate risk to life; accordingly, more details concerning population dynamics should be considered in future risk evaluations and future research should be conducted in other types of rural settlement with different likelihood strategy and age structure.
Despite some limitations and uncertainty in the risk evaluation process, the procedure for assessing the debris flow risk is valuable for obtaining an overview of the risk to people on holidays and workdays and during the daytime and nighttime. These risk results will allow local authorities to clearly identify households with high societal risk on holidays and workdays and during the daytime and nighttime and plan effective countermeasures for the watershed.
Data Availability Statement
The original contributions presented in the study are included in the article/Supplementary Material, further inquiries can be directed to the corresponding author.
Author Contributions
KH initiated and sponsored this work; LW carried out the risk analysis and wrote the manuscript; JL assisted with data analysis.
Funding
This research was funded by the National Natural Science Foundation of China (41790434), the Research on Intelligent Monitoring and Early Warning Technology of Debris Flow on Sichuan-Tibet Railway (K2019G006).
Conflict of Interest
Author JL was employed by the company Three Gorges Jinsha River Chuanyun Hydropower Development Co., Ltd.
The remaining authors declare that the research was conducted in the absence of any commercial or financial relationships that could be construed as a potential conflict of interest.
References
Ara, S. (2014). Impact of temporal population distribution on earthquake loss estimation: a case study on sylhet, Bangladesh. Int. J. of Disaster Risk Sci. 5, 296–312. doi:10.1007/s13753-014-0033-2
Attems, M. S., Thaler, T., Genovese, E., and Fuchs, S. (2019). Implementation of property-level flood risk adaptation (PLFRA) measures: choices and decisions. WIREs: Water. 7 (3), e1404. doi:10.1002/wat2.1404
Aubrecht, C., Freire, S., Neuhold, C., Curtis, A., and Steinnocher, K. (2012). Introducing a temporal component in spatial vulnerability analysis. Disaster Advances. 5 (2), 48–53.
Aubrecht, C., Steinnocher, K., and Huber, H. (2014). DynaPop – population distribution dynamics as basis for social impact evaluation in crisis management. in Proceedings of the 11th international ISCRAM conference. Editors S. R. Hiltz, M. S. Pfaff, L. Plotnick, and P. C. Shih (Pennsylvania, United States: University Park), 314–318.
Bell, R., and Glade, T. (2004). Quantitative risk analysis for landslides Examples from Bíldudalur, NW-Iceland. Nat. Hazards Earth Syst. Sci. 4, 117–131. doi:10.5194/nhess-4-117-2004
BUWAL (1997). Berücksichtigung der Hochwassergefahren bei raumwirksamen Tätigkeiten. Berne, Switzerland: Empfehlungen ,Bundesamt für Umwelt Wald und Landschaft.
Castellia, F., Frenia, G., Lentini, V., and Fichera, A. (2017). Modelling of a debris flow event in the Enna area for hazard assessment. Procedia Eng. 175, 287–292. doi:10.1016/j.proeng.2017.01.026
Chen, J. C., and Chuang, M. R. (2014). Discharge of landslide-induced debris flows: case studies of Typhoon Morakot in southern Taiwan. Nat. Hazards Earth Syst. Sci. 14 (7), 1719–1730. doi:10.5194/nhess-14-1719-2014
Chen, K. P., McAneney, J., Blong, R., Leigh, R., Hunter, L., and Magill, C. (2004). Defining area at risk and its effect in catastrophe loss estimation: a dasymetric mapping approach. Appl. Geogr. 24 (2), 97–117. doi:10.1016/j.apgeog.2004.03.005
Chen, N. S., Yang, C. L., Zhou, W., Hu, G. S., Deng, M. F., and Yang, K. (2011). Debris flow exploration technology. Beijing, China: Science Press, 137.
Chen, Y., Tan, Y., and Mao, C. (2013). Mountain hazards, risk management, disaster- preventive and poverty-alleviating resettlement. Journal of catastrophology. 28 (2), 138–144. doi:10.3969/j.issn.1000811X.2013.02.027
China geological disaster prevention engineering association (2018). Specification of geological investigation for debris flow stabilization (T/CAGHP 006-2018). Wuhan, China: China University of Geosciences Press, 1–76.
Corominas, J., Copons, R., Moya, J., Vilaplana, J. M., Altimir, J., and Amigó, J. (2005). Quantitative assessment of the residual risk in a rockfall protected area. Landslides. 2, 343–357. doi:10.1007/s10346-005-0022-z
Cui, P. (2009). Advances in debris flow prevention in China. Science of Soil and Water Conservation. 7 (5), 7–13. doi:10.3969/j.issn.16723007.2009.05.002
Dai, F. C., Lee, C. F., and Ngai, Y. Y. (2002). Landslide risk assessment and management: an overview. Eng. Geol. 64 (1), 65–87. doi:10.1016/S0013-7952(01)00093-X
Ding, M. T., Miao, C., and Huang, T. (2018). On characteristics and evolution analysis of valley settlement in the upper reaches of Min River. J. South China Normal Univ. (Soc. Sci. Ed.). 43 (8), 37–43. doi:10.13718/j.cnki.xsxb.2018.08.008
Ding, M. T., Tang, C., Huang, T., and Gao, Z. M. (2020). Dynamic vulnerability analysis of mountain settlements exposed to geological hazards: a case study of the upper Min River, China. Adv. Civ. Eng. 2020, 1–13. doi:10.1155/2020/8887487
Fell, R., Ho, K. K. S., Lacasse, S., and Leroi, E. (2005). A framework for landslide risk assessment and management. International Conference on Landslide Risk Management, Vancouver, Canada, May 31-June 3, 599–600.
Geotechnical Engineering Office (1998). Landslides and boulder falls from natural terrain: interim risk guidelines. Geotechnical Engineering Office, The Government of the Hong Kong Special Administrative Region.
He, R. W. (2013). The spatial difference of famer’s livelihood situation and livelihood choice in representative mountain areas: a case study of liangshan Yi autonomous prefecture, sichuan Province. Doctor of Philosophy dissertation, Institute of mountain hazards and environment, Chinese academy of sciences, 113.
HSE (1992). The tolerability of risk from nuclear power stations. London, United Kingdom: Health and Safety Executive.
Li, C., Li, S., Feldman, M. W., Li, J., Zheng, H., and Daily, G. C. (2017). The impact on rural livelihoods and ecosystem services of a major relocation and settlement program: a case in Shaanxi, China. Ambio. 47, 245–259.doi:10.1007/s13280-017-0941-7
Li, X., Huang, J. C., Xu, H. J., Zhu, C. B., and Liu, T. (2016). The characteristics analysis of debris flow fan in Nujiang alpine canyon region. J. Yunnan Univ. 38 (5), 750–757. doi:10.7540 /j.ynu.20160035
Li, Z., Nadim, F., Huang, H., Uzielli, M., and Lacasse, S. (2010). Quantitative vulnerability estimation for scenario-based landslide hazards. Landslides. 7, 125–134. doi:10.1007/s10346-009-0190-3
Liu, J. F., You, Y., Chen, X. Q., Liu, J. K., and Chen, X. C. (2014). Characteristics and hazard prediction of large-scale debris flow of Xiaojia gully in Yingxiu Town, sichuan Province, China. Eng. Geol. 180, 55–67. doi:10.1016/j.enggeo.2014.03.017
Morgan, G. C., Rawlings, G. E., and Sobkowicz, J. C. (1992). Evaluating total risk to communities from large debris flows, Proceedings of 1st Canadian symposium on geotechnique and natural hazards. Vancouver, BC, Canada: BiTech Publishers, 225–236.
Mousavi, S. M., Omidvar, B., Ghazban, F., and Feyzi, R. (2011). Quantitative risk analysis for earthquake - induced landslides-emamzadeh ali, Iran. Eng. Geol. 122, 191–203. doi:10.1016/j.enggeo.2011.05.010
O’Brien, J. (1986). Physical processes, rheology and modeling of mudflows. Fort Collins, CO, United States: Colorado State University. Doctor of Philosophy dissertation.
Panzhihua Lulingyi Geological Engineering Co. LTD (2019). Investigation report of debris flow in Niunaidu gully in Puge county. Bureau of natural resources of Puge County, 1–28.
Papathoma-Köhle, M., Kappes, M., Keiler, M., and Glade, T. (2011). Physical vulnerability assessment for alpine hazards: state of the art and future needs. Nat. Hazards. 58, 645–680. doi:10.1007/s11069-010-9632-4
Petrascheck, A., and Kienholz, H. (2003). Hazard assessment and mapping of mountain risks in Switzerland. In Debris-flow hazards mitigation: mechanics, prediction and assessment, D. Rickenmann, and C Chen (Eds.), 3rd international conference on debris-flow hazards mitigation. Rotterdam, Netherlands: Millpress, 25–39.
Pratima, S. (2005). Population vulnerability for earthquake loss estimation using community based approach with GIS, Institude for geo-information science and Earth observation, Enschede, Netherlands. Doctor of Philosophy dissertation.
Rickenmann, D., Laigle, D., Mcardell, B. W., and Hübl, J. (2006). Comparison of 2D debris-flow simulation models with field events. Comput. Geosci. 10 (2), 241–264. doi:10.1007/s10596-005-9021-3
Sekizawa, A. (1991). Statistical analyses on fatalities characteristics of residential fires. Fire Saf. Sci. 3, 475–484.
Silva, M., and Pereira, S. (2014). Assessment of physical vulnerability and potential losses of buildings due to shallow slides. Nat. Hazards. 72, 1029–1050. doi:10.1007/s11069-014-1052-4
Smith, K. (1990). The application of the ALARP principle to safety assessment by the nuclear installations inspectorate, Institution of Nuclear Engineers on the use of ALARA in the nuclear industry. London, United Kingdom: Royal Aeronautical Society.
Taubenböck, H., Goseberg, N., Setiadi, N., Lämmel, G., Moder, F., Oczipka, M., et al. (2009). “Last-Mile” preparation for a potential disaster – interdisciplinary approach towards tsunami early warning and an evacuation information system for the coastal city of Padang, Indonesia. Nat. Hazards Earth Syst. Sci. 9, 1509–1528. doi:10.5194/nhess-9-1509-2009
Tecca, P. R., Genevois, R., Deganutti, A. M., and Armento, M. C. (2007). “Numerical modelling of two debris flows in the Dolomites (Northeastern Italian Alps),” in Chen, and Major (Eds), Debris-flow hazards mitigation: mechanics, prediction, and assessment. Netherlands: Millpress, 179–188.
Technical guidance center for geological hazards (2018). Ministry of natural resources of China 2018National notification of geological disasters in China, 1–6.
Van Westen, C. J. (2004). “Geo-information tools for landslide risk assessment: an overview of recent developments,” Proceedings 9th international symposium on landslides. Editors W. A. Lacerda, M. Ehrlich, S. A. B. Fontoura, and A. S. F. Sayao (Rio de Janeiro, Brasil: Balkema), 1, 39–56. doi:10.1201/b16816-6
Wei, L. (2020). Quantitative risk assessment of debris flow to villages-case studies in Hengduan Mountainous area. Doctor of Philosophy dissertation. Institute of Mountain Hazards and Environment, Chinese Academy of Sciences, 44, 52.
Yang, H. J., Hu, K. H., and Wei, F. Q. (2013). Methods for computing rheological parameters of debris-flow slurry and their extensibilities. J. Hydraul. Eng. 44 (11), 1338–1346. doi:10.13243/j.cnki.slxb.2013.11.002
Keywords: debris flow, risk, vulnerability, building, settlement, temporal distribution of residents, southwest China
Citation: Wei L, Hu K and Liu J (2021) Quantitative Analysis of the Debris Flow Societal Risk to People Inside Buildings at Different Times: A Case Study of Luomo Village, Sichuan, Southwest China. Front. Earth Sci. 8:627070. doi: 10.3389/feart.2020.627070
Received: 08 November 2020; Accepted: 18 December 2020;
Published: 29 January 2021.
Edited by:
Xiekang Wang, Sichuan University, ChinaReviewed by:
Mingtao Ding, Southwest Jiaotong University, ChinaJianqi Zhuang, Chang’an University, China
Copyright © 2021 Wei, Hu and Liu. This is an open-access article distributed under the terms of the Creative Commons Attribution License (CC BY). The use, distribution or reproduction in other forums is permitted, provided the original author(s) and the copyright owner(s) are credited and that the original publication in this journal is cited, in accordance with accepted academic practice. No use, distribution or reproduction is permitted which does not comply with these terms.
*Correspondence: Kaiheng Hu, khhu@imde.ac.cn