Coupled Short- and Medium-Term Geophysical Signals at Etna Volcano: Using Deformation and Strain to Infer Magmatic Processes From 2009 to 2017
 Marco Aloisi
 Alessandro Bonaccorso
 Flavio Cannavò
 Gilda M. Currenti
- Istituto Nazionale di Geofisica e Vulcanologia, Sezione di Catania-Osservatorio Etneo, Catania, Italy
In active volcanoes a main challenge is to identify and characterize the dynamics of magmatic sources from deformation and strain data. This task is of primary importance in frequently eruptive volcanoes, such as Etna. After the main flank eruption of 2008–2009 and until 2017, Etna volcano was characterized by a lively eruptive activity of different phases. These comprised 44 lava fountain episodes from the New South East Crater (NSEC), two sequences of close episodes of lava fountains from the Voragine crater (VOR), as well as some periods of summit effusive activity with a more prolonged supply of lava flows. Several studies have described and modeled single lava fountains episodes of the NSEC and VOR, in particular through high precision data from borehole strain-meters. In this study, we broaden the analysis also considering the medium-term volcano recharging/discharging periods preceding/accompanying the different eruptive phases during 2009–2017 by constraining the source positions through deformation recorded by the permanent GPS network. Together with the modeling deduced from the strain-meter data we produce a more complete representation of the different sources that characterized the different periods both in the medium-term (i.e., the preparatory phases showing inflation and the eruptive phases showing deflation) and in the short-term (i.e., the fast discharge associated with eruptive events). Our modeling explains the pathway of magma from the intermediate-shallow plumbing system to the surface and highlights a clear separation between the inflation and the deflation source depths, coherently with petrological constraints on the spatio-temporal evolution of magma transfer and storage.
Introduction
The monitoring and study of ground deformation pursue the goal to provide a clear contribution to understanding of magma ascent processes both during the preparatory and final phases leading to the eruptions in the various volcanoes that are monitored throughout the world. Magma during ascent can usually be stored in reservoirs that form, through the gradual accumulation of magma, sources of internal overpressure. In turn, these gradually deform the volcanic edifice, which responds with an inflation. Then, during the eruptive phases the volcano releases the accumulated pressures and its edifice returns to equilibrium showing a deflation. Through the recording of the deformation patterns, the geodetic techniques allow us to constrain the position and the shape of the magmatic sources (for a review Dzurisin, 2003, 2007 and citations herein).
Two general problems characterize the modeling of the deformation signals recorded in the last decades: (i) eruptions are usually not frequent phenomena in the same volcano, and in most of the active volcanoes it is necessary to wait long intervals (from several years to tens-hundreds of years) between subsequent eruptions; (ii) the smaller the eruptions, i.e., if they involve reduced erupted volumes, the more difficult it is to detect appreciable deformation variations because of the resolution of the current instrumentation. As a result, in the various volcanoes worldwide, the few strongest eruptions are usually better studied.
Etna has been frequently erupting in the last 40 years, showing a great variety of eruptive styles. Since 1971, there have been eighteen major flank eruptions, numerous summit eruptions, periods of permanent Strombolian activity and hundreds of explosive events generating lava fountains (for a review of the Etna activity see Branca and Del Carlo, 2004; Allard et al., 2006). In the 30-year period (1980–2010), the ground deformation monitoring systems on Etna enabled investigating and modeling the storage sources of numerous effusive flank eruptions. All these major eruptions shared the same deformation dynamics: a medium-term recharging period (lasting months to years) that precedes the eruption producing the inflation of the volcano. The recharge phase ends with the propagation of the final intrusions (i.e., the feeder dikes) that produce marked and rapid deformation. The eruptive phase then begins, characterizing the discharge phase causing the volcano deflation. During 1980–2010 the deformation sources associated with these cycles of charging/discharging medium-term phases were inferred at depths ranging between 0 and 9 km b.s.l. (e.g., Bonforte et al., 2008; Aloisi et al., 2011), a zone that is defined as the shallow-intermediate plumbing system. Results of the modeling of the sources for the main eruptions, as obtained from ground deformation studies, are reported in Bonaccorso and Davis (2004), Bonforte et al. (2008), Aloisi et al. (2011), Bruno et al. (2012), and Patanè et al. (2013). The studies mainly investigated the pressurization phases recorded during the inflation preceding the eruption onset. For the period from 2002 to 2006 Palano et al. (2017) reviewed the inflation /deflation preceding /accompanying the three main flank eruptions 2002–2003, 2004 and 2006 by using GPS data in a common modeling approach. However, the heterogeneity of the models and approaches used by the various Authors in the previous studies poses serious problems when a comparison of the inferred source is needed to investigate the long-period/multi-eruption dynamics. Indeed, the identification of different sources and mechanical parameters of the medium does not guarantee a comparable class of solutions, which should be required to avoid bias and to compare the positions, dimensions and volumes changes of the sources with consistency.
The co-eruptive deformation associated with lava fountains has usually been very small and difficult to detect by classic geodetic measurements such as GPS. However, by the end of 2014, four high precision borehole strain-meters have been installed. These instruments were capable of detecting clear strain changes associated with the lava fountaining activity, providing a tool to infer the source feeding the associated explosive activity (i.e., Bonaccorso et al., 2013, 2016).
In this paper, we provide a homogenous and consistent overview of the different active sources in the period 2009–2017. We did this by re-analyzing the medium-term recharging phases that preceded the different eruptions and the medium-term discharge periods characterized by cycles of several lava fountains or prolonged effusive phases. Finally, for some significant periods, we constrained the positions of the pressure sources and their volume changes that produced the deformation patterns recorded by the permanent GPS network. We used a uniform modeling approach to obtain comparable solutions of the inferred sources. This allowed a more complete and robust representation of the different sources that acted during the different recharging (i.e., medium-term preparatory phases) and discharging (i.e., the eruptive phases) phases. We highlight and discuss how the inferred sources are in agreement with a recent conceptual model of the Etnean plumbing system, made up of different magma storage zones, which were constrained by petrological and geochemistry studies (i.e., Kahl et al., 2015; Cannata et al., 2018). To the best of our knowledge, this is the first study where results from GPS and borehole strain-meter networks are used together to investigate medium- and short-term deformation sources at Etna volcano.
Etna 2009–2017 Activity
In the last decade, the activity of Mt. Etna did not produce major flank eruptions but instead has been characterized by tens of lava fountain events. A lava fountain is a powerful gas emission ejecting lava fragments to heights ranging from tens to hundreds of meters (Wilson and Head, 1981; Wolff and Sumner, 2000). In the Hawaiian cases the lava fountains typically range from ~ 10 to 100 m in height, and occasionally reach more than 500 m. Most of the material returns to the surface to form pyroclastic cones, rootless flows or lava ponds (Head and Wilson, 1987). Lava fountains at Etna are often different from the Hawaiian style for their more explosive power and for the formation of a several kilometers high, sustained eruptive column causing widespread ash fallout (e.g., Calvari et al., 2011; Bonaccorso et al., 2014). It is for this reason that they have often been referred as “paroxysmal” (e.g., Bonaccorso et al., 2011a,b, 2013; Gambino et al., 2016) to highlight their greater power when compared to the Hawaiian lava fountains.
After the last flank eruption of 2008–2009, there were 52 lava fountains from January 2011 to May 2016, erupted from Etna's main craters (Figure 1). 45 episodes (44 from January 2011 to December 2013, and one episode in December 2014) led to the formation of the New South East crater (NSEC), next to the existing South East crater (SEC) SEC crater (inset in Figure 1). Moreover, two sequences of 4 and 3 events took place at the Voragine crater (VOR) on 3–5 December 2016 and 18–21 May 2016, respectively. Generally, all of the 2011–2013 lava fountain episodes from the NSEC showed generally similar main characteristics, with the height of the lava fountain reaching 300–1,000 m, ash columns reaching 5–9 km, and associated 4–6 km long lava flows descending the eastern flank of the volcano (i.e., Calvari et al., 2011; Behncke et al., 2014; De Beni et al., 2015). The average total DRE (density rock equivalent) volume of magma emitted during each of the 2011–2013 NSEC lava fountains, including both pyroclastic products and lava flows, was ~ 2.5 × 10⁶ m3 per event (De Beni et al., 2015). After the 2011–2013 NSEC lava fountains, the eruptive activity switched to moderate lava effusion from the NSEC toward NE during January–April and July–August 2014. On 28 December 2014, a further lava fountain episode occurred at the NSEC (Gambino et al., 2016).
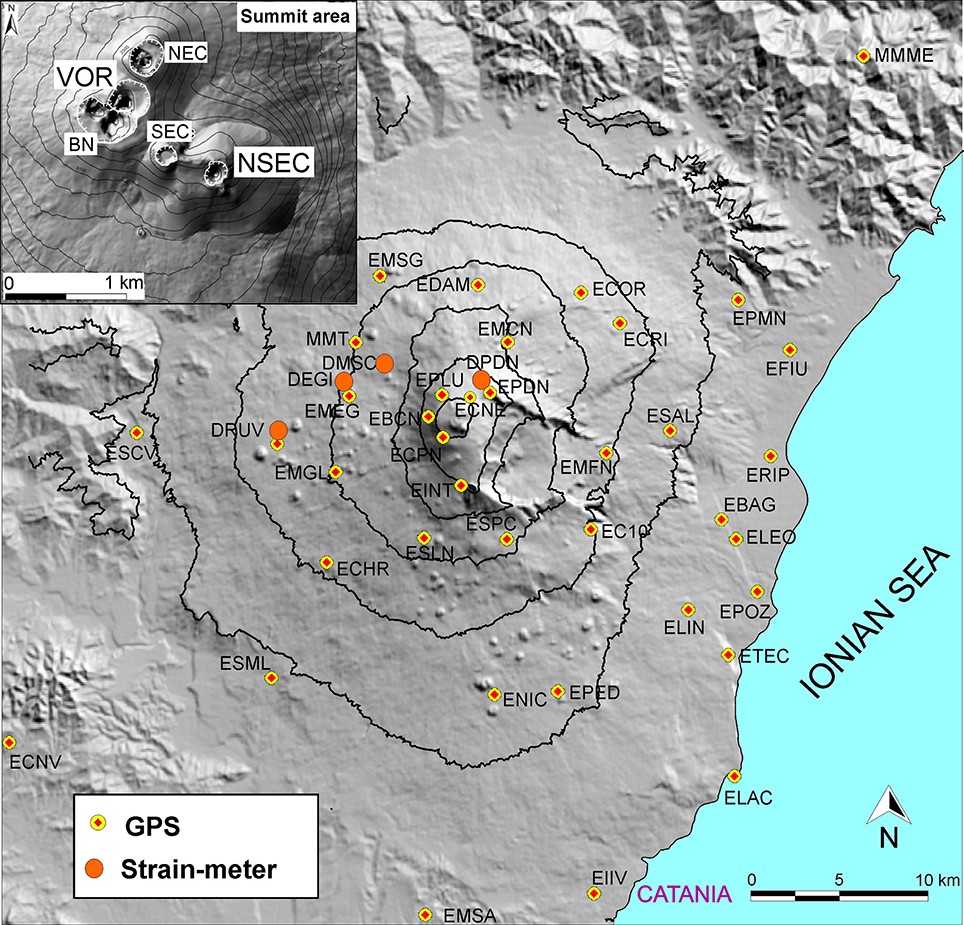
Figure 1. Etna map and multidisciplinary stations used in this study (GPS and borehole dilatometer networks). In the upper-left inset, the detail of the summit craters is shown. They are: Voragine (VOR), NE crater (NEC), Bocca Nuova (BN), SE crater (SEC), New SE crater (NSEC).
VOR is part of the main central crater and, in the last decades, has been much less active than the NSEC. Before 2015, the two main eruptive episodes were a sub-plinian explosion on 22 July, 1998 (Bonaccorso, 2006) and a powerful lava fountain on 4 September, 1999 (Calvari et al., 2002; Harris and Neri, 2002). After these two episodes, activity through the VOR was relatively quiet for several years until the sudden and powerful sequence on 3-5 December, 2015, with a further eruption in May, 2016. The lava fountains of 3–5 December 2015 rank among the most violent to have occurred at Etna in the last two decades (Aloisi et al., 2017; Bonaccorso and Calvari, 2017). A summary of 2009–2017 eruptive activity is shown in Table 1.
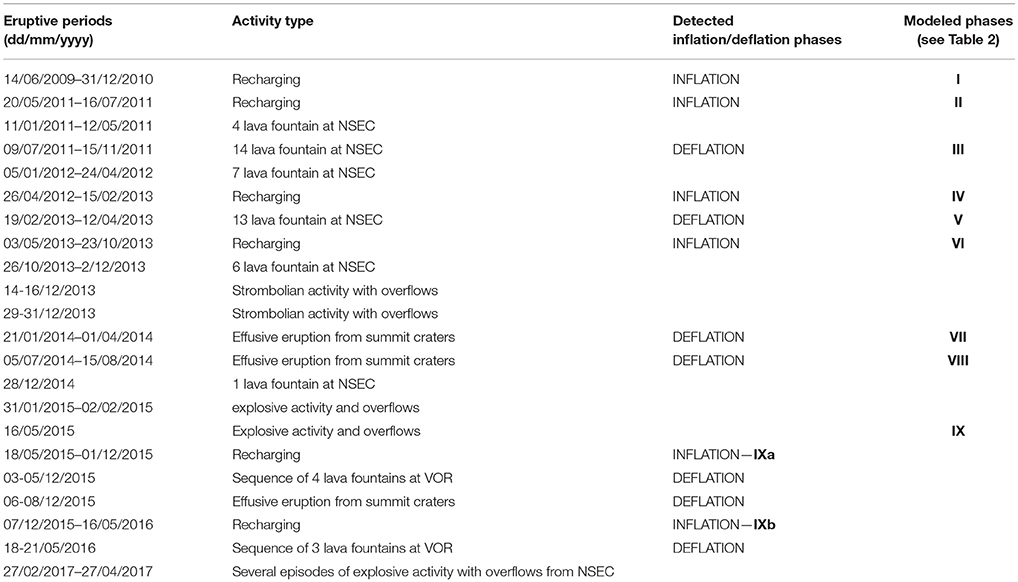
Table 1. Eruptive periods from June 2009 to April 2017 with the type of eruptive activity and the detected inflation or deflation phases modeled in this study.
The 2011–2016 lava fountains were characterized by a marked explosivity feeding a gas thrust region of several hundreds of meters. This sustained a several kilometer-high eruptive column expanding well beyond the lava fountain portion and causing widespread ash fallout (e.g., Calvari et al., 2011; Bonaccorso et al., 2014; Bonaccorso and Calvari, 2017). The short lived activity of lava fountains, although spectacular, emitted limited volumes of magma (~ 2.5 × 10⁶ m3 per event) compared to the prolonged effusive flank eruptions, which usually emit from 1.0 × 10⁷ to 2.0 × 10⁸ m3. However, during 2011–2014, the high frequency of the NSEC lava fountain episodes erupted a total volume (pyroclastics products plus effusive flows) of ~150 × 106 m3 (De Beni et al., 2015). Over this 2011–2014 time interval, this total erupted volume gives an average magma eruption rate similar (even higher) to the long-term output rate in the last decades through the usual effusive eruptions that is 25 × 106 m3 per year (Harris et al., 2011; Bonaccorso Calvari and Calvari, 2013). In other words, the 2011–2014 NSEC activity was characterized by an unusually high frequency of explosive episodes compared to Etna's activity in past decades, although the average magma erupted rate in this interval is close to the long-term output rate of the volcano mainly emitted through major effusive eruptions.
Strain and Deformation Monitoring Networks
The first permanent GPS stations were installed on Mt. Etna during November 2000 and, since then, the network has been further developed (Palano et al., 2010). At present, the volcanic edifice is monitored by 39 permanent stations (Figure 1). In this paper, we consider the data recorded by the GPS network from June 2009, immediately after the end of the 2008 flank eruption, to November 2017. Daily raw observations were processed using the GAMIT/GLOBK software (Herring et al., 2010) adopting the methodology described in Gonzalez and Palano (2014). Using the GLRED module of GLOBK, precise baselines of the whole network have been computed on a daily based solution. To further investigate the dynamics of fast ground displacements during the strongest eruptions, we considered also GPS data solutions at high rate (1 Hz). In particular, the high-rate GPS data were collected from the network dual-frequency GPS receivers and processed through Geodetics® RTD software package by epoch-by-epoch algorithm (Bock et al., 2001; Nikolaidis et al., 2001) to obtain a solution of position every second for all the measured points. Then, the solutions were post-processed to improve their reliability, eliminating the outliers by using an inter-quartile range (IQR) filter and filtered for the multipath noise (due to multi-path ground reflections of GPS signal) following the technique by Nikolaidis et al. (2001) and implemented in Cannavò et al. (2015). The remaining solutions were used to estimate the baseline variation between pair stations in a time window of 3 min, as this is the minimum interval to obtain a satisfactory signal-to-noise ratio in the baseline time series.
In November 2011, two high precision borehole strain-meters, installed at a depth of 180 m in the western flank (DRUV and DEGI, Figure 1), began operating. Another two sensors were installed in November 2014 at a depth of 120 m in the upper heights of the volcano (DMSC and DPDN, in Figure 1). During 2015–2016, DPDN had several interruptions due to technical problems at the station. A description of the installations and implementation of the network is reported in Bonaccorso et al. (2016). The strain-meters are all Sacks-Evertson instruments, also called dilatometers, which measure the volumetric strain (change in volume/original volume) of the surrounding rock with a nominal precision up to 10−11 in a wide frequency range (10−7- 102 Hz). This type of strain-meter is considered the most sensitive instrument used for monitoring deformation in geophysics. A detailed description of the design and capabilities of these instruments is given in Roelloffs and Linde (2007). The high sensitivity of the instrument is also affected by strain changes induced by environmental effects; however, installation at depths greater than 100 m reduces the noise generated in near surface rocks (e.g., by thermo-elastic effects). GPS and borehole strain-meters measurements are complementary techniques. The GPS network has a lower precision of ~10−6 (resolution of millimeters over kilometer distances) but on Etna it has a denser coverage and is able to detect the cumulated medium-tem inflation /deflation phases. The borehole strain-meters have a better precision and can detect the effect of small and brief transient phenomena such as the lava fountains, whose associated strain are in the range of 10−7-10−8, difficult to be detected with GPS.
Results-Strain and Deformation Modeling
Co-eruptive Short-Term Deformation and Inferred Sources
Despite the long-term drift characterizing the instruments during the first years of setup, clear strain changes were revealed during the short duration of the lava fountain episodes at NSEC (Bonaccorso et al., 2013, 2014). Soon after their installation, the borehole dilatometers detected the short-term variations produced by the lava fountains with high accuracy (Figure 2). All the recorded lava fountains showed the common aspect that the duration of the strain change coincides with the duration (usually a few hours) of the lava fountain. The strain change starts when the lava fountain begins and stops when the lava fountain finishes (Figure 2). It is interesting to note that strain suddenly changes only during the lava fountain, which suddenly empties the feeding reservoir, implying that the strain is sensitive to the magma output and the source emptying (e.g., Bonaccorso et al., 2013, 2016). Similar conclusions were also obtained from strain changes recorded during the frequent Vulcanian eruptions at Sakurajima volcano, Japan (Iguchi et al., 2008). The strain changes recorded during the 2011–2013 lava fountains erupted from the NSEC allowed constraining the decompression source at a shallow level (shallow plumbing system). Bonaccorso et al. (2013) applied a numerical model by using the finite element method (FEM) to evaluate the elastic response of the volcano edifice to a deflating source. The Authors inverted the average strain changes at the two working strain-meters (DEGI and DRUV), together with the average tilts recorded at radial distances of 2.2, 4, and 6–8 km. The best model reproducing the recorded strain and tilt changes was an ellipsoidal source constrained at sea level, with an aspect ratio of 0.5 (i.e., more elongated vertically), that underwent a change in volume of ~2 × 10⁶ m3. Bonaccorso et al. (2013) also estimated ~0.5 × 10⁶ m3 as the additional volume of erupted magma due to the compressibility of residing magma within the source, therefore inferring a mean volume for each lava fountain episode coherent with the one deduced by surveys and aerophotogrammetry (De Beni et al., 2015).
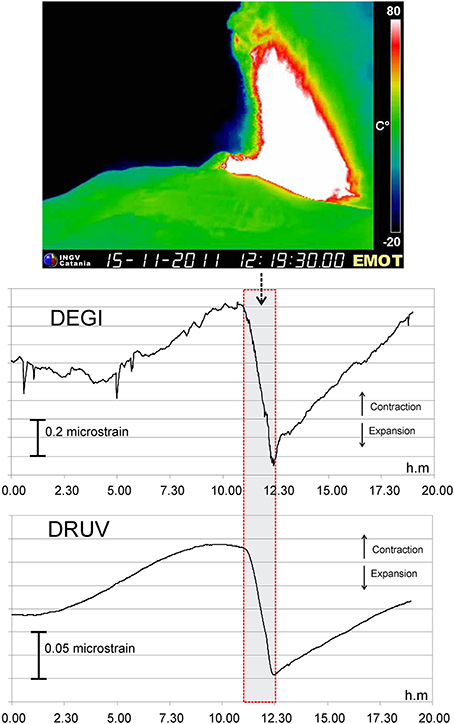
Figure 2. Strain signals recorded at DEGI and DRUV during the lava fountain on 15 November 2011, just 2 weeks after the strain-meters installation. A decreasing signal is recorded during expansion and an increasing signal during contraction of the medium surrounding the instrument. The negative variation at both occurs markedly from the beginning (11:06 UT) to the end (12:30 UT) of lava fountain activity. The gray box marks the duration of the lava fountain., In the upper part a frame from the thermal cam of Montagnola (southern flank, 2700 m a.s.l.) is shown.
Short-term strain changes were also recorded during the two powerful December 2015 and May 2016 sequences at VOR. Preliminary data analysis and modeling show that the strain changes at the three stations (DRUV, DEGI, and DMSC) are caused by the activation of a deeper portion of the magmatic plumbing system (Bonaccorso and Calvari, 2017). Figure 3 shows a comparison between the strain signals recorded during the lava fountains of 28 December 2014 at NSEC and 3 December 2015 at VOR, respectively. As mentioned, the source of the NSEC was inferred at 0 km (b.s.l.) in agreement with all the episodes from the NSEC (Bonaccorso et al., 2016). All the strain-meters recorded negative changes temporally coincident with the duration of the lava fountain event. On the contrary, a clear positive change during the VOR episode was recorded at DMSC. In the case of a deflating pressure source, the volumetric strain reverses its sign moving radially from the source, as it goes from compressional (positive) to extensional (negative) regime. This transition from positive to negative depends on the source depth. Therefore, the negative/positive pattern of the strain variations at the stations may enable to constrain the source depth. Generally, the deeper the source, the higher the radial distance at which the strain changes from positive to negative (Roelloffs and Linde, 2007). During the NSEC events, no positive strain changes were recorded at any of the stations, indicating a shallow source producing a narrow compressional pattern close to the summit area. Conversely, during the VOR episode the positive change recorded at DMSC is a clear indication of the activation of a deeper deflating source, whose associated strain pattern produces a compressional regime at higher radial distance from the source (Bonaccorso and Calvari, 2017).
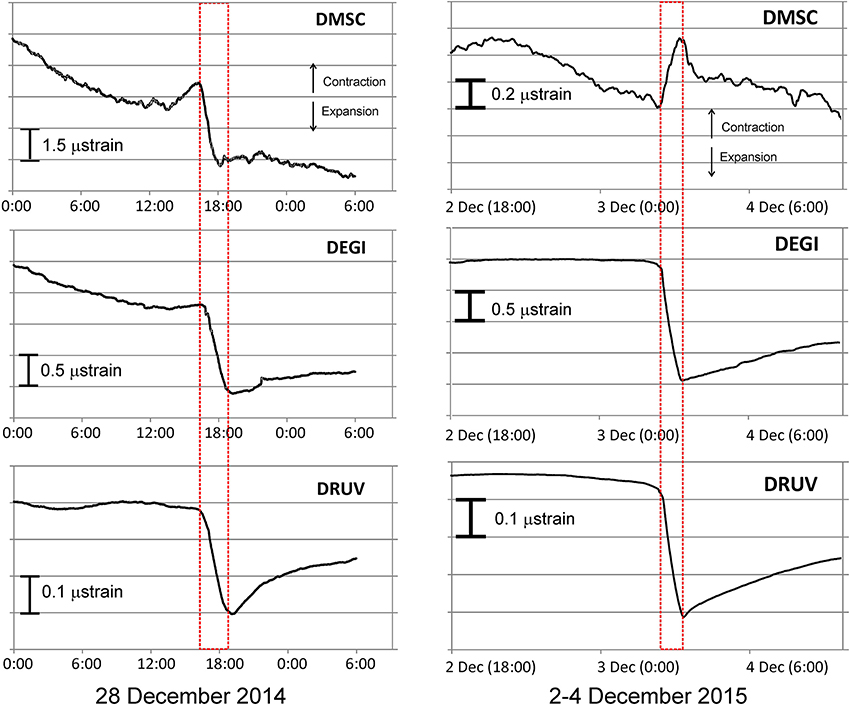
Figure 3. Comparison between the volumetric strain changes recorded by the strain-meter during the 28 December2014 (left) and the 3 December 2015 lava fountains. A clear reverse in sign at the near summit station DMSC is detected, implying a deeper source position for the 2015 case (right).
Very weak deformation was recorded in the GPS time series during the NSEC events; instead, concurrent changes in the baseline variations, computed from high frequency GPS data analysis, were observed during the VOR activity (Figure 4). Coherently with the high frequency solutions, for the first episode, the GPS daily-based solutions showed displacements, up to 5 mm, recorded at the entire network and showed a coherent radial pattern of deflation (Aloisi et al., 2017). The time series of high frequency solutions at the summit stations allowed us to follow the entire dynamic of the fountain in detail (Figure 4). In particular, the comparison between the mean baseline variation recorded by the GPS for the summit baselines crossing the crater area and the strain time series recorded by strain-meters shows a synchronous beginning of variation with the onset of the fountain event (Figure 4).
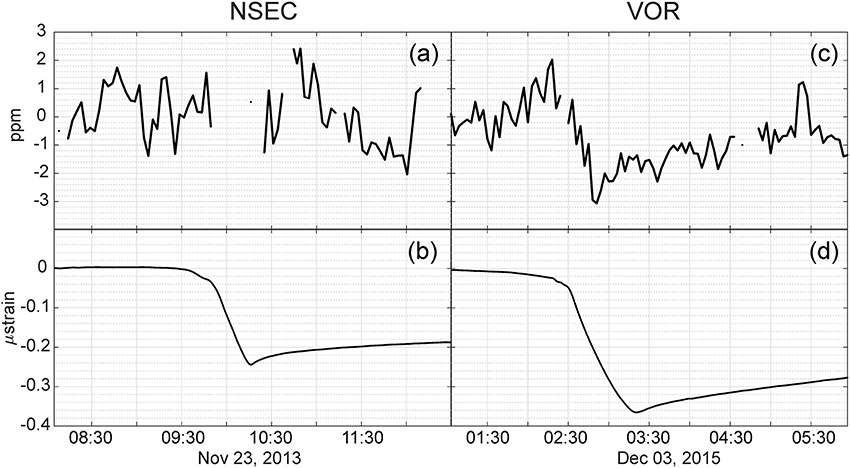
Figure 4. Recorded strain and GPS signals during the lava fountains at NSEC and VOR caters. The 23 November 2013 lava fountain was one of the most powerful events of the 44 recorded from NSEC in 2011–2013. (A) Mean baseline variation calculated in percentile for the summit baselines crossing the crater area and (B) strain detected at DRUV station during the lava fountain of 23 November 2013 at NSEC. (C) Mean baseline variation calculated in percentile for the summit baselines crossing the crater area and (D) strain detected at DRUV station during the lava fountain of 3 December 2015 at VOR crater. The GPS did not detect changes during the lava fountains at NSEC, while a clear negative change (i.e., line contraction) was detected during the VOR more powerful event. Instead the strain-meter recorded small negative changes, i.e., expansion of the medium surrounding the station, during the NSEC lava fountains but recorded a bigger change during the VOR event.
Medium-Term Recharging /Discharging Phases Inferred by GPS Data
We investigated the deflation-inflation cycles observed between June 2009 and November 2017, presenting an analytical solution to model the recorded GPS data. The variation of the area (Figure 5), recorded at an intermediate altitude triangle (EMEG-EMCN-ESLN), represents the average deformation of the volcano edifice well, clearly showing deflation-inflation cycles (e.g., Aloisi et al., 2011; Bruno et al., 2012; Patanè et al., 2013). The area of the triangle increases during periods of magma ascent, causing inflation. It decreases during and after eruptive periods, when magma outpours from the magmatic accumulation zones. As mentioned, the analyzed time interval has been studied in previous works. In particular, Aloisi et al. (2011) analyzed the 2009–2010 time period; Patanè et al. (2013) investigated the year 2011; Spampinato et al. (2015) and Bruno et al. (2016) analyzed some ground deformation phases observed during 2012–2013; Cannata et al. (2015) and Greco et al. (2016) analyzed some phases recorded during the 2013; Viccaro et al. (2016) and Gambino et al. (2016) investigated the 2014 event; finally, Aloisi et al. (2017); Bonaccorso and Calvari (2017) and Cannata et al. (2018) studied the 2015–2017 activity. Different approaches were used by the Authors to model the observed deformation patterns. With the aim of obtaining comparable solutions among the sources in terms of the involved volumes and their locations, we decided to re-analyze some significant phases in the considered time window, using a uniform approach, i.e., to apply the same methodology to the different phases. Different inflation and deflation phases were selected from the areal dilation time series (Figure 5). In particular, assuming that any change in the area dilatation at the surface means that the deformation source is changing in position, pressurization or volume, we selected time spans characterized by coherent crustal deformation patterns, during which a homogeneous volcanic source is reasonably acting inside the volcano. We chose to investigate the following intervals, representing a selection of some of the more significant observed variations (Tables 1, 2): (I) a first phase of lasting inflation from 14 June 2009 to 31 December 2010; (II) a second phase of short inflation observed from 20 May 2011 to 16 July 2011; (III) the following third phase showing a deflation from 16 July 2011 to 17 October 2011; (IV) a fourth phase showing a new inflation of the volcano edifice from 26 April 2012 to 15 February 2013; (V) the following fifth phase of deflation from 15 February 2013 to 30 April 2013; (VI) a sixth phase of inflation from 3 May 2013 to 23 October 2013; (VII) and (VIII) two following phases of deflation from 20 January 2014 to 1 April 2014 and from 09 July 2014 to 15 August 2014; (IX) a ninth phase representing the inflation recorded from 16 May 2015 to 27 November 2017. The last chosen phase is interrupted by short sub-periods of deflation related to the VOR explosive activity. As mentioned in the previous paragraph, we also detailed each lava fountain occurring at the VOR crater on Mount Etna, during the first days of December 2015. Moreover, to better understand this eruptive phase, it was useful to study the short cycles of inflation that preceded the December 2015 (from 18 May to 1 December 2015, phase IXa) and the May 2016 (from 7 December 2015 to 16 May 2016, phase IXb) VOR explosive sequences.
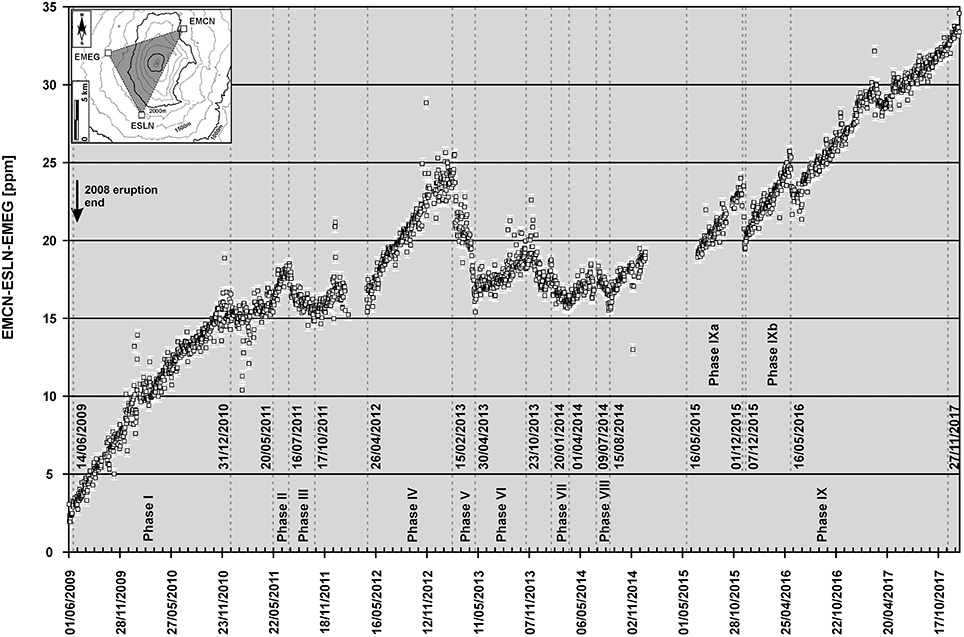
Figure 5. Variation of the area recorded at an intermediate altitude triangle (EMCN—ESLN—EMEG). The error bars are estimated as the standard deviation during stationary periods. In the inset, the triangle used to calculate the variation of the area is outlined.
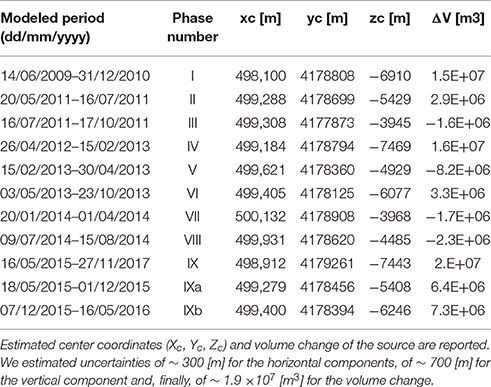
Table 2. Final optimal solutions for each modeled period.
For each different deformation phase, we computed the baseline variations recorded at the GPS network in the corresponding time interval. Baseline estimations are not affected by possible biases in the choice of a local reference frame, and moreover they show lower levels of noise than the single GPS components. Therefore, with large GPS networks and for weak deformation, directly inverting baseline variations can represent a robust method to constrain a model for the recorded data, avoiding added uncertainties into the source modeling. We used the entire GPS network except the stations located on the lower eastern flank of the volcano (ERIP, EBAG, ELEO, EPOZ, ELIN, ETEC, EBDA, ELAC; see Figure 1) because it is well known that the eastern flank of Mt. Etna is affected by an almost constant ESE-ward sliding motion (for a review see, e.g., Aloisi et al., 2011; Murray et al., 2018). This large displacement is most likely not directly linked to the magma recharging/discharging processes; therefore, it is appropriate to exclude this area of the GPS network when the volcano plumbing system is investigated. For all the phases, we performed an analytical inversion of GPS baselines, describing the pressure source with a finite spherical magma body using the analytical solution of McTigue (1987). We chose this source model among other analytical models available in the literature since it showed a good trade-off between the number of degrees of freedom and the obtained data fit. This deformation source is described by five parameters: the coordinates “x”, “y,” and “z” of the sphere center, the radius “r” and the overpressure “P” on the source wall. It can be used to infer the centroid of the pressurizing/depressurizing sources. Model parameters were estimated for each phase, performing an inversion by means of the Pattern Search technique (Lewis and Torczon, 1999) together with a local Genetic Algorithm Search (Goldberg, 1989), finally followed by a non-linear least squares to better refine the solution. The uncertainty of each model parameter was estimated adopting a Jackknife re-sampling method (Efron, 1982). We included the effects of the topography using the method of Williams and Wadge (2000). The medium was assumed to be homogeneous and isotropic with a Young modulus of 75 GPa and a Poisson ratio of 0.25 (e.g., Aloisi et al., 2011). The volume change ΔV was estimated by means of the formulation described in Tiampo et al. (2000), using a shear modulus of 30 GPa. It is noteworthy that this value is an overestimation for a hot volcanic region and that a more correct evaluation of the shear modulus needs more attention, for example using a non-elastic rheology that is beyond the scope of this work. The modeled and recorded deformation pattern for two typical phases of inflation and deflation are shown in Figure 6. Final optimal solutions for each phase are shown in Figure 7, Table 2.
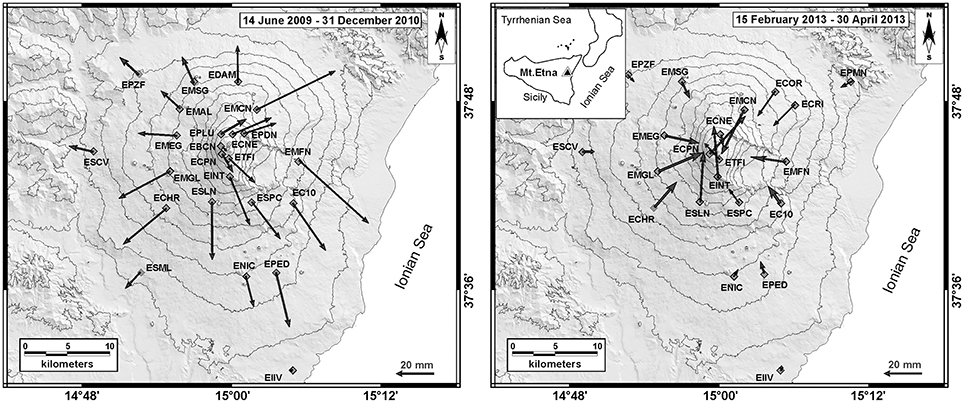
Figure 6. Typical deformation patterns recorded at Mount Etna: inflation during a recharge phase (left) and deflation during an eruptive phase discharging phase (right).
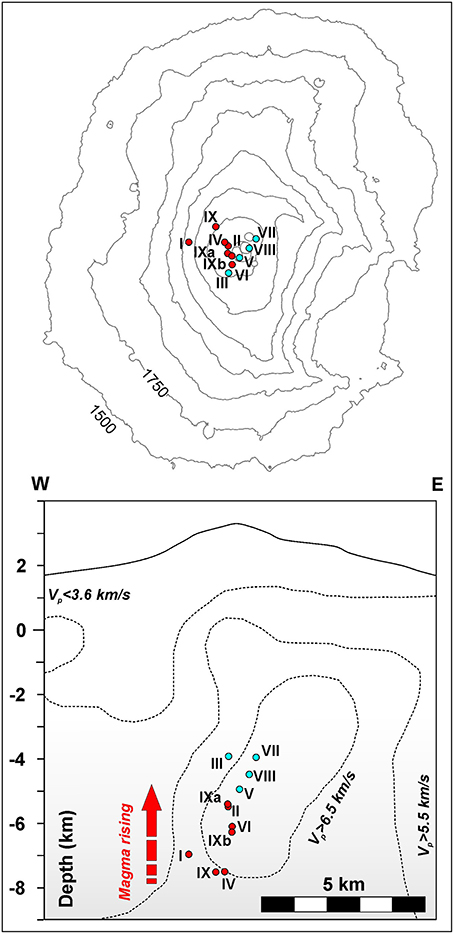
Figure 7. The upper panel shows the areal location of pressure sources modeled for each phase (inflation in red and deflation in blue). The lower panel shows a cross-section highlighting the calculated depth of each phase. For comparison, the trace of the high vp body estimated by Aloisi et al. (2002) is also shown.
By using a uniform approach for all the selected periods (i.e., same kind of representative source, inversion method, and rheology parameters) we provided highly comparable solutions avoiding the bias that may often affect the solutions of different approaches. Under these conditions, the result highlights a clear separation between the inflation and deflation source depths. This is a new insight into the reconstruction of the magma movement and storage within the plumbing system of Mt. Etna volcano, as discussed in depth below.
Discussion and Conclusion
Medium- and short- term deformation sources at Etna volcano have been investigated with the aid of GPS and strain-meter data. These two kinds of deformation measurements have proven complementary to each other. The high-resolution and accuracy of the strain data have enabled us to follow rapid transient deformation related to the short-term discharge of magma through each fountaining event. GPS daily time series have been used to detect medium-term deformation processes related to the recharging of the magmatic plumbing system. Medium-term processes are difficult to recognize in the strain data because of the instrumental drift, while short-term processes are hidden in the GPS data due to the lower signal-to-noise ratio. For the most powerful eruptive events however, the processing of high rate GPS data has shown a general agreement in the temporal variations with respect to strain changes. The comparison of both datasets enabled us to assess their intrinsic advantages and drawbacks.
At Etna basaltic magmas and bubbles/liquid mixture rise for their positive buoyancy in the 22–2 km b.s.l. and, mainly related to their amount of H2O, they can stall and form magmatic storage at different depths (Corsaro and Pompilio, 2004) that can cause the volcano deformation.
As previously found by many Authors (see Aloisi et al., 2011 for an overview), the pressure sources modeled here are located along the western border of the high velocity body (HVB), delineated using seismic tomographies (e.g., Patanè et al., 2006) (Figure 8). Furthermore, there is a general agreement that this border zone is coincident with the pathway that the magma takes toward the surface (e.g., Bonforte et al., 2008). Along this pathway, the magma can store and differentiate at various depths, forming a multilevel plumbing system characterized by several magmatic environments, where different types of olivines can form (e.g., Kahl et al., 2015; Cannata et al., 2018). Thanks to the uniform approach of modeling applied here, for the inflation/deflation phases modeled by GPS data in the investigated period, our results highlight a very clear separation in depth between the inflation and the deflation sources (Figure 7). The centroid of the inflation sources is located at ~ 6.5 km (b.s.l), the centroid of the deflation sources is located at ~ 4.5 km (b.s.l.).
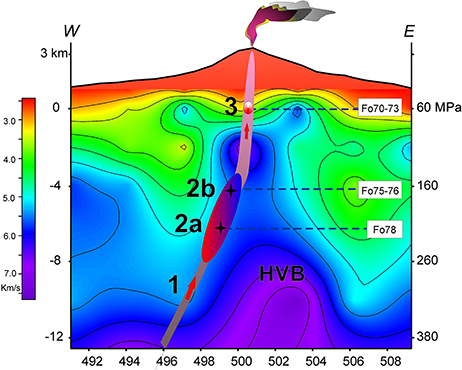
Figure 8. Sketch section of Etna's plumbing system. (1) deep magma supply. (2) intermediate storage zone inferred by the deformation sources modeled for the recharging-discharging phases investigated in this study; (2a) is the zone comprising the sources of the recharging phases (inflation) whose centroid is indicated with the lower star; (2b) is the zone comprising the sources of the eruptive discharging phases (deflation) whose centroid is indicated with the upper star. (3) Shallow storage feeding the lava fountain episodes of NSEC inferred by strain changes recorded by borehole strain-meters. The positions of the centroid of the modeled sources 2a, 2b and 3 are coincident with the different levels of the magmatic environments constrained by Cannata et al. (2018) by petrological data. In the section the seismic velocity estimated by Aloisi et al. (2002) is also shown.
With regards to the frequent short-term explosive lava fountains, for the NSEC events the strain changes constrained a shallower source located at a depth of 0 km b.s.l. (Bonaccorso et al., 2013). Regarding the four events that involved the VOR crater during the first days of December 2015, both Aloisi et al. (2017) and Cannata et al. (2018) found that the recorded deformation pattern is compatible with a deflation source located under the crater, at a depth of ~5 km b.s.l. Comparing with data recorded for the NSEC lava fountains, this result suggests that eruptions through VOR are sourced from a deeper portion of the magmatic plumbing system. This evidence agrees with petrological data that show the activation of magmatic environments deeper than those generally observed for other recent Etnean eruptions, involving deep basic magmas brought to shallow crustal levels in very short time scales (Cannata et al., 2018). Particularly, the olivine populations and the associated magmatic storage zones, although comparable with those recognized in the products emitted from the NSEC crater, show a different distribution. The most abundant olivine samples Fo70–73 (expressed in Fo%), attributable to the shallow portion of the plumbing system, decrease from 63% in the case of NSEC events (Giuffrida and Viccaro, 2017) to 37% in the case of the VOR events. Concurrently, the olivine populations associated with deeper zoning patterns increase significantly. Therefore, the NSEC events were predominantly supplied by the shallow magma storage with main cycles of near regular recharging /discharging of this source that fed the lava fountains. As anticipated, this accords with the previous source modeling obtained by the analysis of the strain changes (Bonaccorso et al., 2013). For the lava fountains of NSEC, several geochemical and geophysical studies (Aiuppa et al., 2010; Bonaccorso et al., 2011a,b; Calvari et al., 2011; Ganci et al., 2012; Corsaro et al., 2017) supported the interpretation that these events were violent releases of bubble-rich magma layers previously decoupled from the melt and trapped at shallow depths close to sea level. The observed behavior for the NSEC lava fountains is a cyclic process of charge/discharge. This interpretation supports the “foam collapse” model proposed by Jaupart and Vergniolle (1989), as derived from a combination of theoretical approaches and laboratory experiments. The strain data confirm the validity of this eruptive model indicating a depressurizing source located at about sea level that is incapable of accumulating larger magma volumes and triggers frequent events with a nearly similar amount of magma stored (Bonaccorso et al., 2013).
Instead, the VOR events were sustained by different storage zones of the magmatic plumbing system with a higher contribution from deeper zones, which implicate a more complex dynamics that is more difficult to be modeled with simple shaped sources. Therefore, we believe that VOR eruption needs further in-depth studies.
In a general framework, these zones of the plumbing system identified by different deformation sources perfectly agree with three of the magmatic environments found in Cannata et al. (2018), as inferred by petrological data (Figure 8). In particular, the Authors found a magmatic environment at 290–230 MPa (~ 7-10 km b.s.l.), where the composition of the olivine Fo78 (expressed in Fo%) forms. This environment corresponds to the depth level that we found for the medium-term inflation phases. Another level at 160–120 MPa (about 3–5 km b.s.l.) referred to crystals with Fo75–76 cores is related to the depth found for the medium-term deflation phases and the periods of lava fountains. And, finally, a shallower level close to the sea level with Fo70–73 is related to the NSEC activity. In Figure 8 it is reported the scheme with the comparison of the position of the three magmatic environments inferred by petrological data and the geodetic sources inferred for the inflation and deflation phases (by GPS data) and for the NSEC lava fountain events (by high precision strain-meters).
It is noteworthy that the depth levels found for the intermediate storage, where the inflation/deflation processes are observed, and the shallow one are approximately coincident with the levels of two main geological discontinuities separating different main units in the Etnean crust (Figure 8). These levels are (i) the separation between the Hyblean carbonate platform and the upper flyschoid units of the Apennine-Maghrebide chain, found at about 6 km b.s.l. (Lentini, 1982); (ii) the discontinuity between the Apennine-Maghrebide chain and the volcanic cover, located at about sea level (Monaco et al., 2011). Moreover, a persistent level of magma ponding at the depth of the deeper discontinuity (~ 6 km depth b.s.l.) is also supported by melt inclusion studied for previous eruptions (Métrich et al., 2004). Therefore, we believe that the depth of about 6 km (b.s.l.) represents a critical level for the magma ascending toward the surface. Along the western border of the HVB, where magma is believed to ascend, at this depth level, tomographic studies (e.g., Aloisi et al., 2002) estimated density values in the range 2,300–2,600 kg/m3. At about 10 km (b.s.l.), the estimated values are about 2,700–2,900 kg/m3. Therefore, in the depth range 5.5–7.5 km (b.s.l.), where inflation processes occur, basaltic magma (with a density of ~2,800 km/m3) should pond for negative buoyancy. Likely, the structural discontinuity between the Hyblean platform and Apennine — Maghrebide chain, facilitates magma ponding. In this intermediate storage, due to the almost continuous magma input from depth (Bonaccorso Calvari and Calvari, 2013), the magma can accumulate, producing the observed inflation phases. During ponding, differentiation processes are also observed (Cannata et al., 2018). When the value of the magma overpressure is enough to break the medium and to reach the surface, the apical portion of this intermediate storage (~ 4.5 km depth b.s.l., Figure 8) ascends, producing the observed deflation phases.
This interpretation on the vertical shift of the inflation and deflation sources would mainly characterize the phases preceding (inflation) and accompanying (deflation) the eruptions with a more explosive behavior. This aspect is also confirmed by the results of previous studies. During the 2009–2010 inflation period, Aloisi et al. (2011) observed a progressive deepening of the deformation source over time, ascribed by the Authors to the role of the volatiles in preparing a more explosive eruption. Confirmation of this hypothesis can be found in Palano et al. (2017) where the Authors found that the 2002–03 flank eruption, characterized by a strong explosive activity, show a shift between the inflation and deflation sources. In particular, the Authors found that for the 2002–2003 eruption the deflation source was about 2 km shallower than the inflation source. Instead, for the less explosive 2004–2005 and 2006 flank eruptions, they observed the separation between inflation/deflation sources was not so marked. This separation between the centroids of the inflation/deflations sources is particularly clear in our results because shown for more cases of eruptive phases modeled by using a uniform approach.
Author Contributions
AB conceived the study objectives. AB, GC, and MA coordinated and shared the writing of the paper and the research it is based on, static GPS data modeling was performed by MA. High frequency GPS data treatment was taken care of by FC. All authors contributed to the discussion of the results.
Conflict of Interest Statement
The authors declare that the research was conducted in the absence of any commercial or financial relationships that could be construed as a potential conflict of interest.
Acknowledgments
We would like to thank the two Reviewers and the Editor in Chief V. Acocella for their constructive comments, which helped us to substantially improve the manuscript. We are particularly indebted to the technical staff of Ground Deformation Group of INGV-OE who ensure the regular working of the permanent GPS and borehole strain-meter monitoring networks. We thank S. Conway for correcting and improving the English of the paper.
References
Aiuppa, A., Cannata, A., Cannovo, F., and Puglisi, G. (2010). Patterns in the recent 2007–2008 activity of Mount Etna volcano investigated by integrated geophysical and geochemical observations. Geochem. Geophys. Geosyst. 11:Q09008. doi: 10.1029/2010GC003168
Allard, P., Behncke, B., D'Amico, S., Neri, M., and Gambino, S. (2006). Mount Etna 1993–2005: anatomy of an evolving eruptive cycle. Earth Sci. Rev. 78, 85–114. doi: 10.1016/j.earscirev.2006.04.002
Aloisi, M., Cocina, O., Neri, G., Orecchio, B., and Privitera, E. (2002). Seismic tomography of the crust underneath the Etna volcano, Sicily, Phys. Earth Planet. Inter. 134, 139–155. doi: 10.1016/S0031-9201(02)00153-X
Aloisi, M., Jin, S., Pulvirenti, F., and Scaltrito, A. (2017). The december 2015 Mount Etna eruption: an analysis of inflation/deflation phases and faulting processes. J. Geodynamics 107, 34–45. doi: 10.1016/j.jog.2017.03.003
Aloisi, M., Mattia, M., Ferlito, C., Palano, M., Bruno, V., and Cannavò, F. (2011). Imaging the multi-level magma reservoir at Mt. Etna volcano (Italy). Geophys. Res. Lett. 38:L16306. doi: 10.1029/2011GL048488
Behncke, B., Branca, S., Corsaro, R. A., De Beni, E., Miraglia, L., and Proietti, C. (2014). The 2011–2012 summit activity of Mount Etna: birth, growth and products of the new SE crater. J. Volcanol. Geoth. Res. 270, 10–21. doi: 10.1016/j.jvolgeores.2013.11.012
Bock, Y., de Jonge, P. J., Honcik, D., and Wilson, S. (2001). “Epoch-By-Epoch™ Positioning applied to dam deformation monitoring At Diamond Valley Lake, Southern California,” in Proceedings of 10th FIG International Symposium on Deformation Measurements (Orange, CA), 78–87.
Bonaccorso, A. (2006). Esplosive activity at Mt. Etna summit craters and source modelling by using high precision continuous tilt. J. Volc. Geoth. Res. 158, 221–234. doi: 10.1016/j.jvolgeores.2006.05.007
Bonaccorso, A., Caltabinano, T., Currenti, G., Del Negro, C., Gambino, S., Ganci, G., et al. (2011a). Dynamics of a lava fountain revealed by geophysical, geochemical and thermal satellite measurements: the case of the 10 April 2011 Mt Etna eruption. Geophys. Res. Lett. 38:L24307. doi: 10.1029/2011GL049637
Bonaccorso, A., and Calvari, S. (2013). Major effusive eruptions and recent lava fountains: balance between expected and erupted magma volumes at Etna volcano. Geophys. Res. Lett. 40, 6069–6073. doi: 10.1002/2013GL058291
Bonaccorso, A., and Calvari, S. (2017). A new approach to investigate an eruptive paroxysmal sequence using camera and strainmeter networks: lessons from the 3–5 December 2015 activity at Etna volcano. Earth Planet. Sci. Lett. 475, 231–241. doi: 10.1016/j.epsl.2017.07.020
Bonaccorso, A., Calvari, S., Linde, A., and Sacks, S. (2014). Eruptive processes leading to the most explosive lava fountain at Etna volcano: the 23 November 2013 episode. Geophys. Res. Lett. 41, 4912–4919. doi: 10.1002/2014GL060623
Bonaccorso, A., Cannata, R. A., Corsaro, G., Di Grazia, S., Gambino, F., Pistorio, A., et al. (2011b). Multidisciplinary investigation on a lava fountain preceding a flank eruption: the 10 491 May 2008 Etna case. Geochem. Geophys. Geosyst. 12:Q07009. doi: 10.1029/2010GC003480
Bonaccorso, A., Currenti, G., Linde, A., and Sacks, S. (2013). New data from borehole strainmeters to infer lava fountain sources (Etna 2011–2012). Geophys. Res. Lett. 40, 3579–3584. doi: 10.1002/grl.50692, 2013
Bonaccorso, A., and Davis, P. M. (2004). Modeling of ground deformation associated with recent lateral eruptions: mechanics of magma ascent and intermediate storage at Mt. Etna. Geophys. Monograph. Ser. 143, 293–306. doi: 10.1029/143GM18
Bonaccorso, A., Linde, A., Currenti, G., Sacks, S., and Sicali, A. (2016). The borehole dilatometers network of Mt. Etna: a powerful tool to detect and infer volcano dynamics. J. Geophys. Res. Solid Earth 121. doi: 10.1002/2016JB012914
Bonforte, A., Bonaccorso, A., Guglielmino, F., Palano, M., and Puglisi, G. (2008). Feeding system and magma storage beneath Mt. Etna as revealed by recent inflation/deflation cycles. J. Geophys. Res. 113:B05406. doi: 10.1029/2007JB005334
Branca, S., and Del Carlo, P. (2004). “Eruptions if Mt. Etna during the past 3,200 years: a revised compilation integrating the historical and stratigraphic records,” in Geophysical Monograph Series, eds A. Bonaccorso, S.Calvari, M. Coltelli, C. Del Negro, and S. Falsaperla (Washington, DC: Etna volcano laboratory; AGU) 143, 1–27.
Bruno, V., Ferlito, C., Mattia, M., Monaco, C., Rossi, M., and Scandura, D. (2016). Evidence of a shallow magma intrusion beneath the NE Rift system of Mt. Etna during 2013. Terra Nova 28, 356–363. doi: 10.1111/ter.12228
Bruno, V., Mattia, M., Aloisi, M., Palano, M., Cannavò, F., and Holt, W. E. (2012). Ground deformations and volcanic processes as imaged by CGPS data at Mt. Etna (Italy) between 2003 and 2008. J. Geophys. Res. Solid Earth 117:B07208. doi: 10.1029/2011JB009114
Calvari, S., Neri, M., and Pinkerton, H. (2002). Effusion rate estimations during the 1999 summit eruption on Mount Etna, and growth of two distinct lava flow fields. J. Volcanol. Geotherm. Res. 119, 107–123. doi: 10.1016/S0377-0273(02)00308-6
Calvari, S., Salerno, G. G., Spampinato, L., Gouhier, M., La Spina, A., Pecora, E., et al. (2011). An unloading foam model to constrain Etna's 11-13 January 2011 lava fountaining episode. J. Geophys. Res. 116:B11207. doi: 10.1029/2011JB008407
Cannata, A., Di Grazia, G., Giuffrida, M., Gresta, S., Palano, M., Sciotto, M., et al. (2018). Space-time evolution of magma storage and transfer at Mt. Etna volcano (Italy): The 2015–2016 reawakening of Voragine crater.Geochem. Geophy. Geosys. 19, 471–495. doi: 10.1002/2017GC007296
Cannata, A., Spedalieri, G., Behncke, B., Cannavò, F., Di Grazia, G., Gambino, S., et al. (2015). Pressurization and depressurization phases inside the plumbing system of Mount Etna volcano: evidence from a multiparametric approach. J. Geophys. Res. Solid Earth 120, 5965–5982. doi: 10.1002/2015JB01222
Cannavò, F., Camacho, A. G., González, P. J., Mattia, M., Puglisi, G., and Fernández, J. (2015). Real time tracking of magmatic intrusions by means of ground deformation modeling during volcanic crises. Sci. Rep. 5:10970. doi: 10.1038/2Fsrep10970
Corsaro, R. A., Andronico, D., Behncke, B., Branca, S., Caltabiano, T., Ciancitto, F., et al. (2017). Monitoring the December 2015 summit eruptions of Mt. Etna (Italy): implications on eruptive dynamics. J. Volcanol. Geothermal. Res. 341, 53–69. doi: 10.1016/j.jvolgeores.2017.04.018
Corsaro, R. A., and Pompilio, M. (2004). Buoyancy-controlled eruption of magmas at Mt Etna. Terra Nova 16, 16–22. doi: 10.1046/j.1365-3121.2003.00520.x
De Beni, E., Behncke, B., Branca, S., Nicolosi, I., Carluccio, R., D'Ajello Caracciolo, F., et al. (2015). The continuing story of Etna's New Southeast Crater (2012–2014): evolution and volume calculations based on field surveys and aerophotogrammetry. J. Volcanol. Geotherm. Res. 303, 175–186. doi: 10.1016/j.jvolgeores.2015.07.021
Dzurisin, D. (2003). A comprehensive approach to monitoring volcano deformation as a window on the eruption cycle. Rev. Geophys. 41:29. doi: 10.1029/2001RG000107
Dzurisin, D. (2007). Volcano Deformation. Geodetic Monitoring Techniques, New York, NY: Springer-Verlag.
Efron, B. (1982). The Jackknife, Bootstrap and Other Resampling Plans. Philadelphia, PA: Society for Industrial and Applied Mathematics.
Gambino, S., Cannata, A., Cannavò, F., La Spina, A., Palano, M., Sciotto, M., et al. (2016). The unusual 28 December 2014 dike-fed paroxysm at Mount Etna: timing and mechanism from a multidisciplinary perspective. J. Geophys. Res. Solid Earth. 121, 2037–2053. doi: 10.1002/2015JB012379
Ganci, G., Harris, A. J. L., Del Negro, C., Guéhenneux, Y., Cappello, A., Labazuy, P., et al. (2012). A year of lava fountaining at Etna: volumes from SEVIRI. Geophys. Res. Lett. 39:L06305. doi: 10.1029/2012GL051026
Giuffrida, M., and Viccaro, M. (2017). Three years (2011–2013) of eruptive activity at Mt. Etna: working modes and timescales of the modern volcano plumbing system from micro-analytical studies of crystals. Earth Sci. Rev. 171, 289–322. doi: 10.1016/j.earscirev.2017.06.003
Goldberg, D. E. (1989). Genetic Algorithms in Search, Optimization and Machine Learning. Boston, MA: Kluwer Academic Publishers.
Gonzalez, P. J., and Palano, M. (2014). Mt. Etna 2001 eruption: new insights into themagmatic feeding system and the mechanical response of the western flankfrom a detailed geodetic dataset. J. Volcanol. Geotherm. Res. 274, 108–121. doi: 10.1016/j.jvolgeores.2014.02.001
Greco, F., Currenti, G., Palano, M., Pepe, A., and Pepe, S. (2016). Evidence of a shallow persistent magmatic reservoir from joint inversion of gravity and ground deformation data: the 25–26 October 2013 Etna lava fountaining event. Geophys. Res. Lett. 43, 3246–3253. doi: 10.1002/2016GL068426
Harris, A. J. L., and Neri, M. (2002). Volumetric observations during paroxysmal eruption sat Mount Etna: pressurized drainage of a shallow chamber or pulsed supply? J. Volcanol. Geotherm. Res. 116, 79–95. doi: 10.1016/S0377-0273(02)00212-3
Harris, A. J. L., Steffke, A., Calvari, S., and Spampinato, L. (2011). Thirty years of satellite-derived lava discharge rates at Etna: implications for steady volumetric output. J. Geophys. Res. 116:B08204. doi: 10.1029/2011JB008237
Head, J. W. I., and Wilson, L. (1987). Lava fountain heights at Pu'u 'O'o, Kilauea, Hawaii: indicators of amount and variations of exolved magma volatiles. J. Geophys. Res. 92, 13715–13719. doi: 10.1029/JB092iB13p13715
Herring, T. A., King, R. W., and McClusky, S. C. (2010). Introduction to GAMIT/GLOBK, Release 10.4. Cambridge, MA: Massachusetts Institute of Technology.
Iguchi, M., Yakiwara, H., Tameguri, T., Hendrasto, M., and Hirabayashi, J. (2008). Mechanism of explosive eruption revealed by geophysical observations at the Saku-rajima, Suwanosejima and Semeru volcanoes. J. Volcanol. Geotherm. Res. 178, 1–9. doi: 10.1016/j.jvolgeores.2007.10.010
Jaupart, C., and Vergniolle, S. (1989), The generation and collapse of foam layer at the roof of a basaltic magma chamber. J. Fluid Mech. 203, 347–380.
Kahl, M., Chakraborty, S., Pompilio, M., and Costa, F. (2015). Constraints on the nature and evolution of the magma plumbing system of Mt. Etna Volcano (1991–2008) from a combined thermodynamic and kinetic modelling of the compositional record of minerals. J. Petrol. 56, 1–43. doi: 10.1093/petrology/egv063
Lewis, R. M., and Torczon, V. (1999). Pattern search algorithms for bound constrained minimization. SIAM J. Optim. 9, 1082–1099. doi: 10.1137/S1052623496300507
McTigue, D. F. (1987). Elastic stress and deformation near a finite sphericalmagmabody: resolution of the point source paradox. J. Geophys. Res. 92, 12931–12940. doi: 10.1029/JB092iB12p12931
Métrich, N., Allard, P., Spilliaert, N., Andronico, D., and Burton, M. (2004). 2001 flank eruption of the alkali- and volatile-rich primitive basalt responsible for Mount Etna's evolution in the last three decades. Earth Planet. Sci. Lett. 228, 1–17. doi: 10.1016/j.epsl.2004.09.036
Monaco, C., De Guidi, G., and Ferlito, C. (2011). The morphotectonic map of Mt. Etna, It. J. Geosci. 129, 409–428. doi: 10.3301/IJG.2010.11
Murray, J. B., van Wyk de Vries, B., Pitty, A., Sargent, P., and Wooller, L. (2018). Gravitational sliding of the Mt. Etna massif along a sloping basement. Bull. Volcanol. 80:40. doi: 10.1007/s00445-018-1209-1
Nikolaidis, R. M., de Jonge, P. J., Shearer, P., Agnew, D. C., and Van Domselaar, M. (2001). Seismic wave observations with the global positioning system. J. Geophys. Res. 106, 21897–21916. doi: 10.1029/2001JB000329
Palano, M., Rossi, M., Cannavò, F., Bruno, V., Aloisi, M., Pellegrino, D., et al. (2010). Etn@ref: a geodetic reference frame for Mt. Etna GPS networks. Ann. Geophys. 53, 49–57. doi: 10.4401/ag-4879
Palano, M., Viccaro, M., Zuccarello, F., and Gresta, S. (2017). Magma transport and storage at Mt. Etna (Italy): a review of geodetic and petrological data for the 2002–03, 2004 and 2006 eruption. J. Volc. Geoth. Res. 347, 149–164. doi: 10.1016/j.jvolgeores.2017.09.009
Patanè, D., Aiuppa, A., Aloisi, M., Behncke, B., Cannata, A., Coltelli, M., et al. (2013). Insights into magma and fluid transfer at Mount Etna by a multi-parametric approach: a model of the events leading to the 2011 eruptive cycle. J. Geophys. Res Solid Earth 118, 3519–3539. doi: 10.1002/jgrb.50248
Patanè, D., Barberi, G., Cocina, O., De Gori, P., and Chiarabba, C. (2006). Time-resolved seismic tomography detects magma intrusions at Mount Etna Science 313, 821–823. doi: 10.1126/science.1127724
Roelloffs, E. A., and Linde, A. T. (2007). “Borehole observations and continuous strain and fluid pressure,” in Volcano Deformation Geodetic Measurements Tecniques, ed D. Dzurisin (New York, NY: Springer-Verlag), 305–322.
Spampinato, L., Sciotto, M., Cannata, A., Cannavò, F., La Spina, A., Palano, M., et al. (2015). Multiparametric study of the February–April 2013 paroxysmal phase of Mt. Etna New South-East crater. Geochem. Geophys. Geosyst. 16, 1932–1949. doi: 10.1002/2015GC005795
Tiampo, K. F., Rundle, J. B., Fernandez, J., and Langbein, J. O. (2000). Spherical andellipsoidal volcanic sources at Long Valley caldera, California, using a genetic algorithm inversion technique. J. Volcanol. Geotherm. Res. 102, 189–206. doi: 10.1016/S0377-0273(00)00185-2
Viccaro, M., Zuccarello, F., Cannata, A., Palano, M., and Gresta, S. (2016). How a complex basaltic volcanic system works: constraints from integrating seismic, geodetic, and petrological data at Mount Etna volcano during the July–August 2014 eruption. J. Geophys. Res. Solid Earth 121, 5659–5678, doi: 10.1002/2016JB013164
Williams, C. A., and Wadge, G. (2000). An accurate and efficient method for including theeffects of topography in three-dimensional elastic models of ground deformation with applications to radar interferometry. J. Geophys. Res. 105, 8103–8120. doi: 10.1029/1999JB900307
Wilson, L., and Head, J. W. III. (1981). Ascent and eruption of basaltic magma on the earth and moon. J. Geophys. Res. 86, 2971–3001. doi: 10.1029/JB086iB04p02971
Keywords: deformation and strain, volcano sources, inflation/deflation phases, eruptions, Etna volcano
Citation: Aloisi M, Bonaccorso A, Cannavò F and Currenti GM (2018) Coupled Short- and Medium-Term Geophysical Signals at Etna Volcano: Using Deformation and Strain to Infer Magmatic Processes From 2009 to 2017. Front. Earth Sci. 6:109. doi: 10.3389/feart.2018.00109
Received: 27 March 2018; Accepted: 20 July 2018;
Published: 10 August 2018.
Edited by:
Roberto Sulpizio, Università degli studi di Bari Aldo Moro, ItalyReviewed by:
Marco Viccaro, Università degli Studi di Catania, ItalyGeoff Kilgour, GNS Science, New Zealand
Copyright © 2018 Aloisi, Bonaccorso, Cannavò and Currenti. This is an open-access article distributed under the terms of the Creative Commons Attribution License (CC BY). The use, distribution or reproduction in other forums is permitted, provided the original author(s) and the copyright owner(s) are credited and that the original publication in this journal is cited, in accordance with accepted academic practice. No use, distribution or reproduction is permitted which does not comply with these terms.
*Correspondence: Alessandro Bonaccorso, alessandro.bonaccorso@ingv.it