Machine learning outperforms traditional logistic regression and offers new possibilities for cardiovascular risk prediction: A study involving 143,043 Chinese patients with hypertension
 Yang Xi
 Hongyi Wang
 Ningling Sun
- Department of Hypertension, Peking University People’s Hospital, Beijing, China
Introduction: Identifying people at risk of cardiovascular diseases (CVD) is a cornerstone of preventive cardiology. We developed machine learning (ML) algorithms and investigated their performance in predicting patients’ current CVD risk (coronary heart disease and stroke in this study).
Materials and methods: We compared traditional logistic regression (LR) with five ML algorithms LR with Elastic-Net, Random Forest (RF), XGBoost (XGB), Support Vector Machine, Deep Learning, and an Ensemble model averaging predictions from RF, XGB, and Deep Learning for CVD risk prediction using pre-existing patient-level data from a multi-center, cross-sectional study (the Microalbuminuria Screening in Hypertensive Patients Project initiated by the China International Exchange and Promotive Association for Medical and Healthcare) that enrolled 143,043 patients with hypertension from 600 tertiary, secondary, or community hospitals. Each of the five ML algorithms incorporated 18 variables, such as demographics, examinations, comorbidities, and treatment regimens, and were trained and evaluated using 5-fold cross-validation. Predictive accuracy was assessed by the area under the receiver operating curve (AUROC).
Results: Patients’ mean age was 62 ± 12 years and 57% were men. Advanced ML algorithms outperformed the traditional LR model. Particularly, the Ensemble model had superior discrimination with an AUROC of 0.760 than LR (AUC = 0.737) and other tested models.
Conclusion: We establishes an Ensemble model that shows better performance in predicting patients’ current CVD risk using routine information compared to the traditional LR model. ML can help physicians design follow-up plans with more accurate results, offering new possibilities for short-term risk prediction and early detection. Further, ML models can be trained with longitudinal data and used to predict long-term CVD risks, thereby informing CVD prevention.
Introduction
Cardiovascular disease (CVD) is the leading burden of disease in China, with a prevalence of approximately one in five adults and accounting for more than 40% of the total deaths (1, 2). According to the latest CVD report in 2018, there were 290 million CVD patients in China, including 1.3 million cases of stroke and 1.1 million cases of coronary heart disease (CHD) (1).
Cardiovascular disease (CVDs) is highly preventable—it was estimated that up to 90% of CVDs could be prevented (3, 4). Early prevention and screening for high-risk populations are key strategies for reducing the burden of CVDs (3, 5). At the individual level, some risk factors for CVDs have been well-established, such as smoking, blood pressure, diabetes and obesity, air pollution, and social determinants including health system and health policies (6). As early as 1996, the concept of matching the intensity of risk factor management to the hazard of CVDs was first proposed (7). Currently, there is an increasing emphasis on stratifying the risk of CVDs to guide the prevention and treatment schedules (8–10).
Several CVD risk assessment tools have been developed from different populations, such as the American College of Cardiology/American Heart Association atherosclerotic cardiovascular disease (ASCVD) pooled cohort equations, the Framingham Risk Score, the Systematic Coronary Risk Evaluation in Europe, the Global Registry of Acute Coronary Events acute coronary syndrome (ACS) risk and mortality calculator, the Thrombolysis In Myocardial Infarction Risk Score, and the QRISK in the United Kingdom and Scottish ASSIGN risk score (11–16). The applicability of these tools in China, however, is limited by the fact that they originated from Western countries, where the disease pattern of CVDs may substantially differ from that of China. Currently, Chinese guidelines recommend a simplified risk scoring table with common predictors including age groups, low-density lipoprotein cholesterol (LDL-C) or total cholesterol (TC), smoking, body mass index (BMI), blood pressure, hypertension, and diabetes mellitus (DM) to predict ASCVD risks (10). Some other CVD risk prediction tools are also available for the Chinese population, such as the in-hospital mortality risk prediction tool for ACS patients, the 10-year ASCVD risk prediction tool from the China-PAR Project, the CVD-death risk prediction tool, and the 5-year CVD risk prediction tool for patients with DM (17–20). To date, there is no prediction tool specific to Chinese patients with hypertension and the accuracy of CVD risk assessment remains an issue of concern (21, 22).
Machine learning (ML), a technique that allows computer systems to learn from data and effectively perform a specific task without explicit instructions, offers an alternative approach to predict an individual’s CVD risk (23). Previous studies have demonstrated that ML can significantly improve the model performance and the accuracy of the CVD risk prediction (24, 25). Given the present availability of individual-level data in China, ML is also expected to improve the CVD risk prediction for the Chinese hypertensive population.
On this basis, our study aimed to explore the potential of using ML to predict CVD risk for the Chinese hypertensive population based on the information routinely collected in clinical settings and to evaluate the performance of each ML model.
Materials and methods
Data source
The study dataset was based on the Microalbuminuria Screening in Hypertensive Patients Project, a multicenter, cross-sectional study initiated by the China International Exchange and Promotive Association for Medical and Healthcare. A total of 143,043 inpatients and outpatients with hypertension from 600 tertiary, secondary, or community hospitals in China from November 2016 to August 2017 were included in the analysis. The flowchart of patient selection is shown in Figure 1. The project was carried out in accordance with the Good Pharmacoepidemiology Practice. All patients signed informed consent before participation. The study was approved by the Ethical Committee of Peking University People’s Hospital [2013–17].
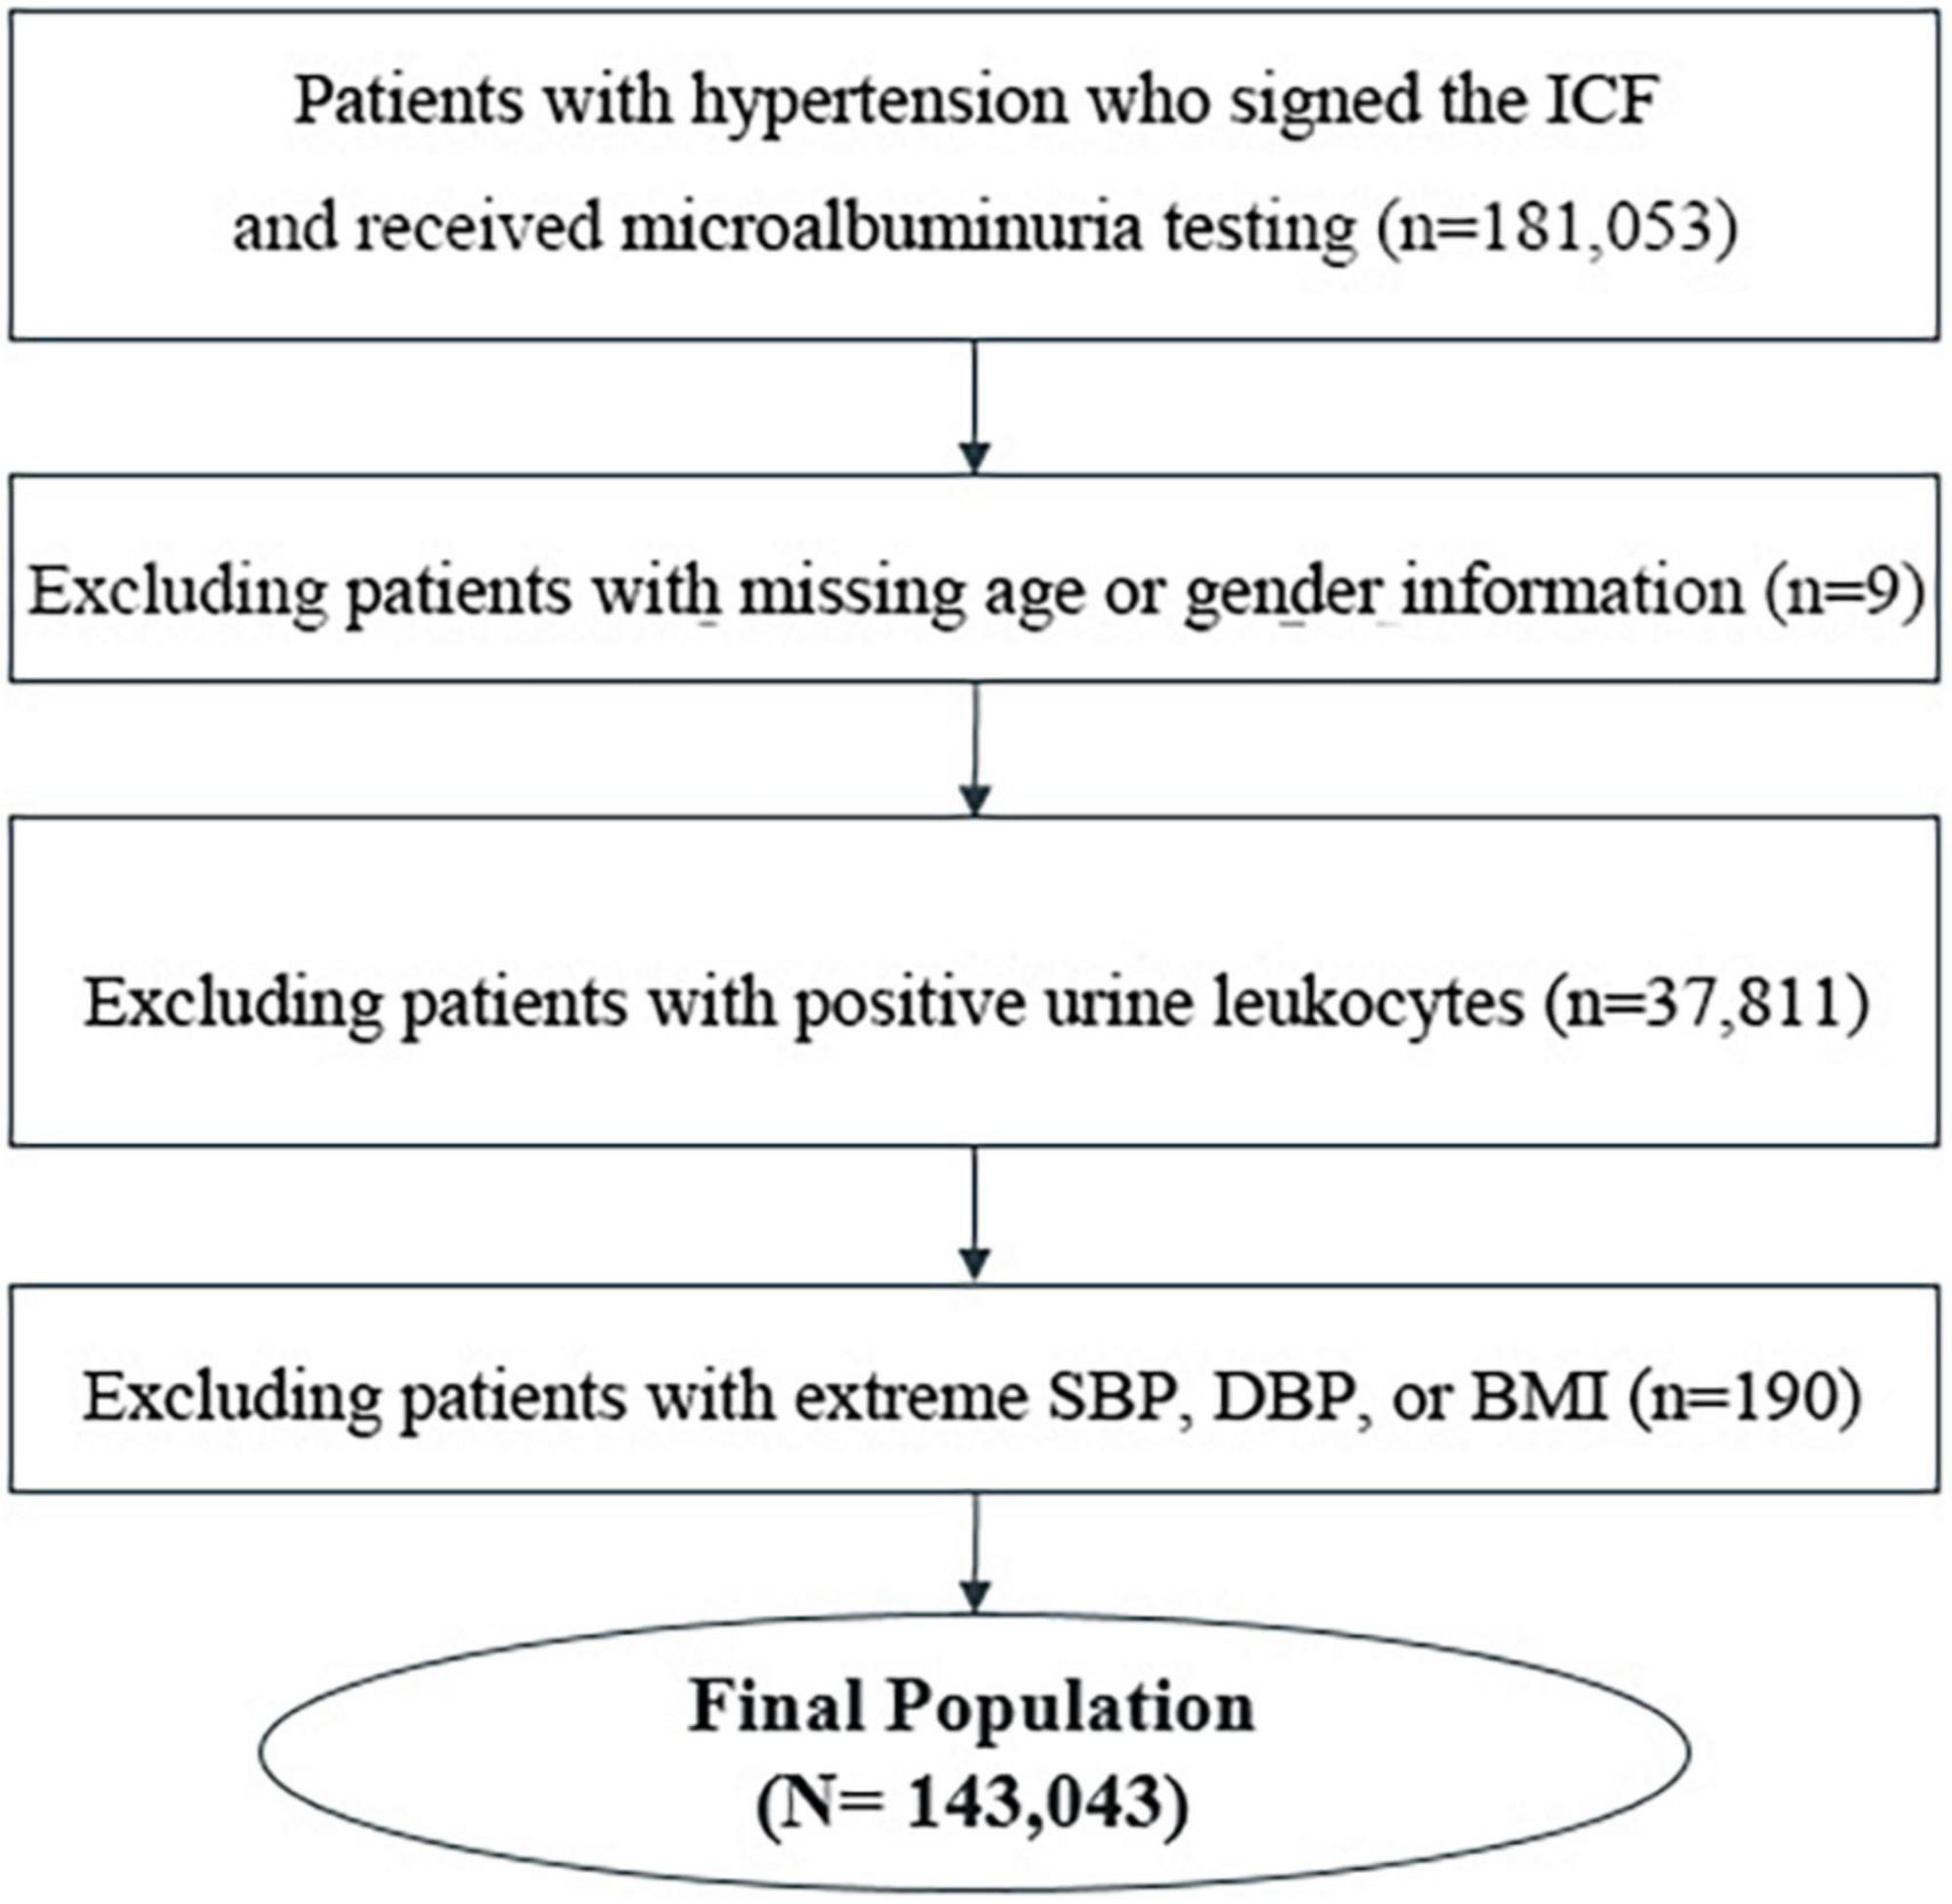
Figure 1. Flow diagram showing numbers of included and excluded patients.
Variables
Eighteen variables were included to develop the models, including demographics (gender, age, and geographic information), health indicators [body mass index (BMI), systolic blood pressure (SBP), diastolic blood pressure (DBP), carotid artery thickening, left ventricular hypertrophy, history of smoking, and family history of hypertension], results of laboratory tests [levels of low-density lipoprotein cholesterol (LDL-C) and urine albumin to creatinine ratio (UACR)], current treatment regimen, type of visit (outpatient or inpatient), whether hypertension was newly diagnosed, whether UACR was newly detected, presence of diabetes, and length of use of renin-angiotensin system inhibitor (RASI). Categorical variables were further converted into dummy variables. Microalbuminuria was defined as UACR between 30 and 300 mg/g.
Machine learning algorithms
The primary outcome was CVD events defined as the development of CHD and/or stroke. To identify the best model performance, a total of six machine learning methods were compared, including the Logistic Regression (LR) with Elastic-Net, Random Forest, XGBoost, Support Vector Machine, Deep Learning, and Ensemble models. The LR model was used as the benchmark reference. These algorithms were selected based on the ease of implementation into current datasets.
Each algorithm was trained and evaluated using 5-fold cross-validation. Specifically, the final data sample was randomly stratified and split into the modeling dataset (80%) and the hold-out dataset (20%). Then the modeling dataset was randomly stratified into five evaluation folds/samples of equal size: one evaluation fold as the test dataset and the other four evaluation folds as the training dataset. The area under receiver operating characteristic curves (AUROCs) and area under precision-recall curves (AUPRCs) were used to evaluate the performance of the algorithms.
The hold-out dataset was used to evaluate the optimal threshold for predicting short-term CVD events in patients with hypertension. Two strategies, respectively, from a clinical perspective and a data science perspective, were used to explore the effect of prediction threshold values on false positive/negative cases and rates. We chose three clinical thresholds, 0.05 (T1), 0.10 (T2), and 0.15 (T3), based on the high-risk rating for ASCVD within 10 years from the 2016 Chinese Adult Dyslipidemia Prevention and Treatment Guideline (26) and the extreme high-risk rating of ASCVD from the 2013 ACC/AHA Guideline on the Assessment of Cardiovascular Risk (27) and the European SCORE (28). Two additional thresholds were chosen from a data science perspective—the first was set to fix the sensitivity at 90% (T4); the second was ROC01, which was designed to minimize the distance between the ROC plot and the point (0,1) to balance sensitivity and specificity (T5).
All analyses were performed using Python 3.6. P values of less than 0.05 were considered statistically significant.
Results
Study population characteristics
Briefly, a total of 143,043 patients were included in the analysis, of whom 26.2% were newly diagnosed cases, 30.1% controlled their blood pressure by treatment, and 21.6% experienced at least one CVD event. The patient characteristics are shown in Table 1.
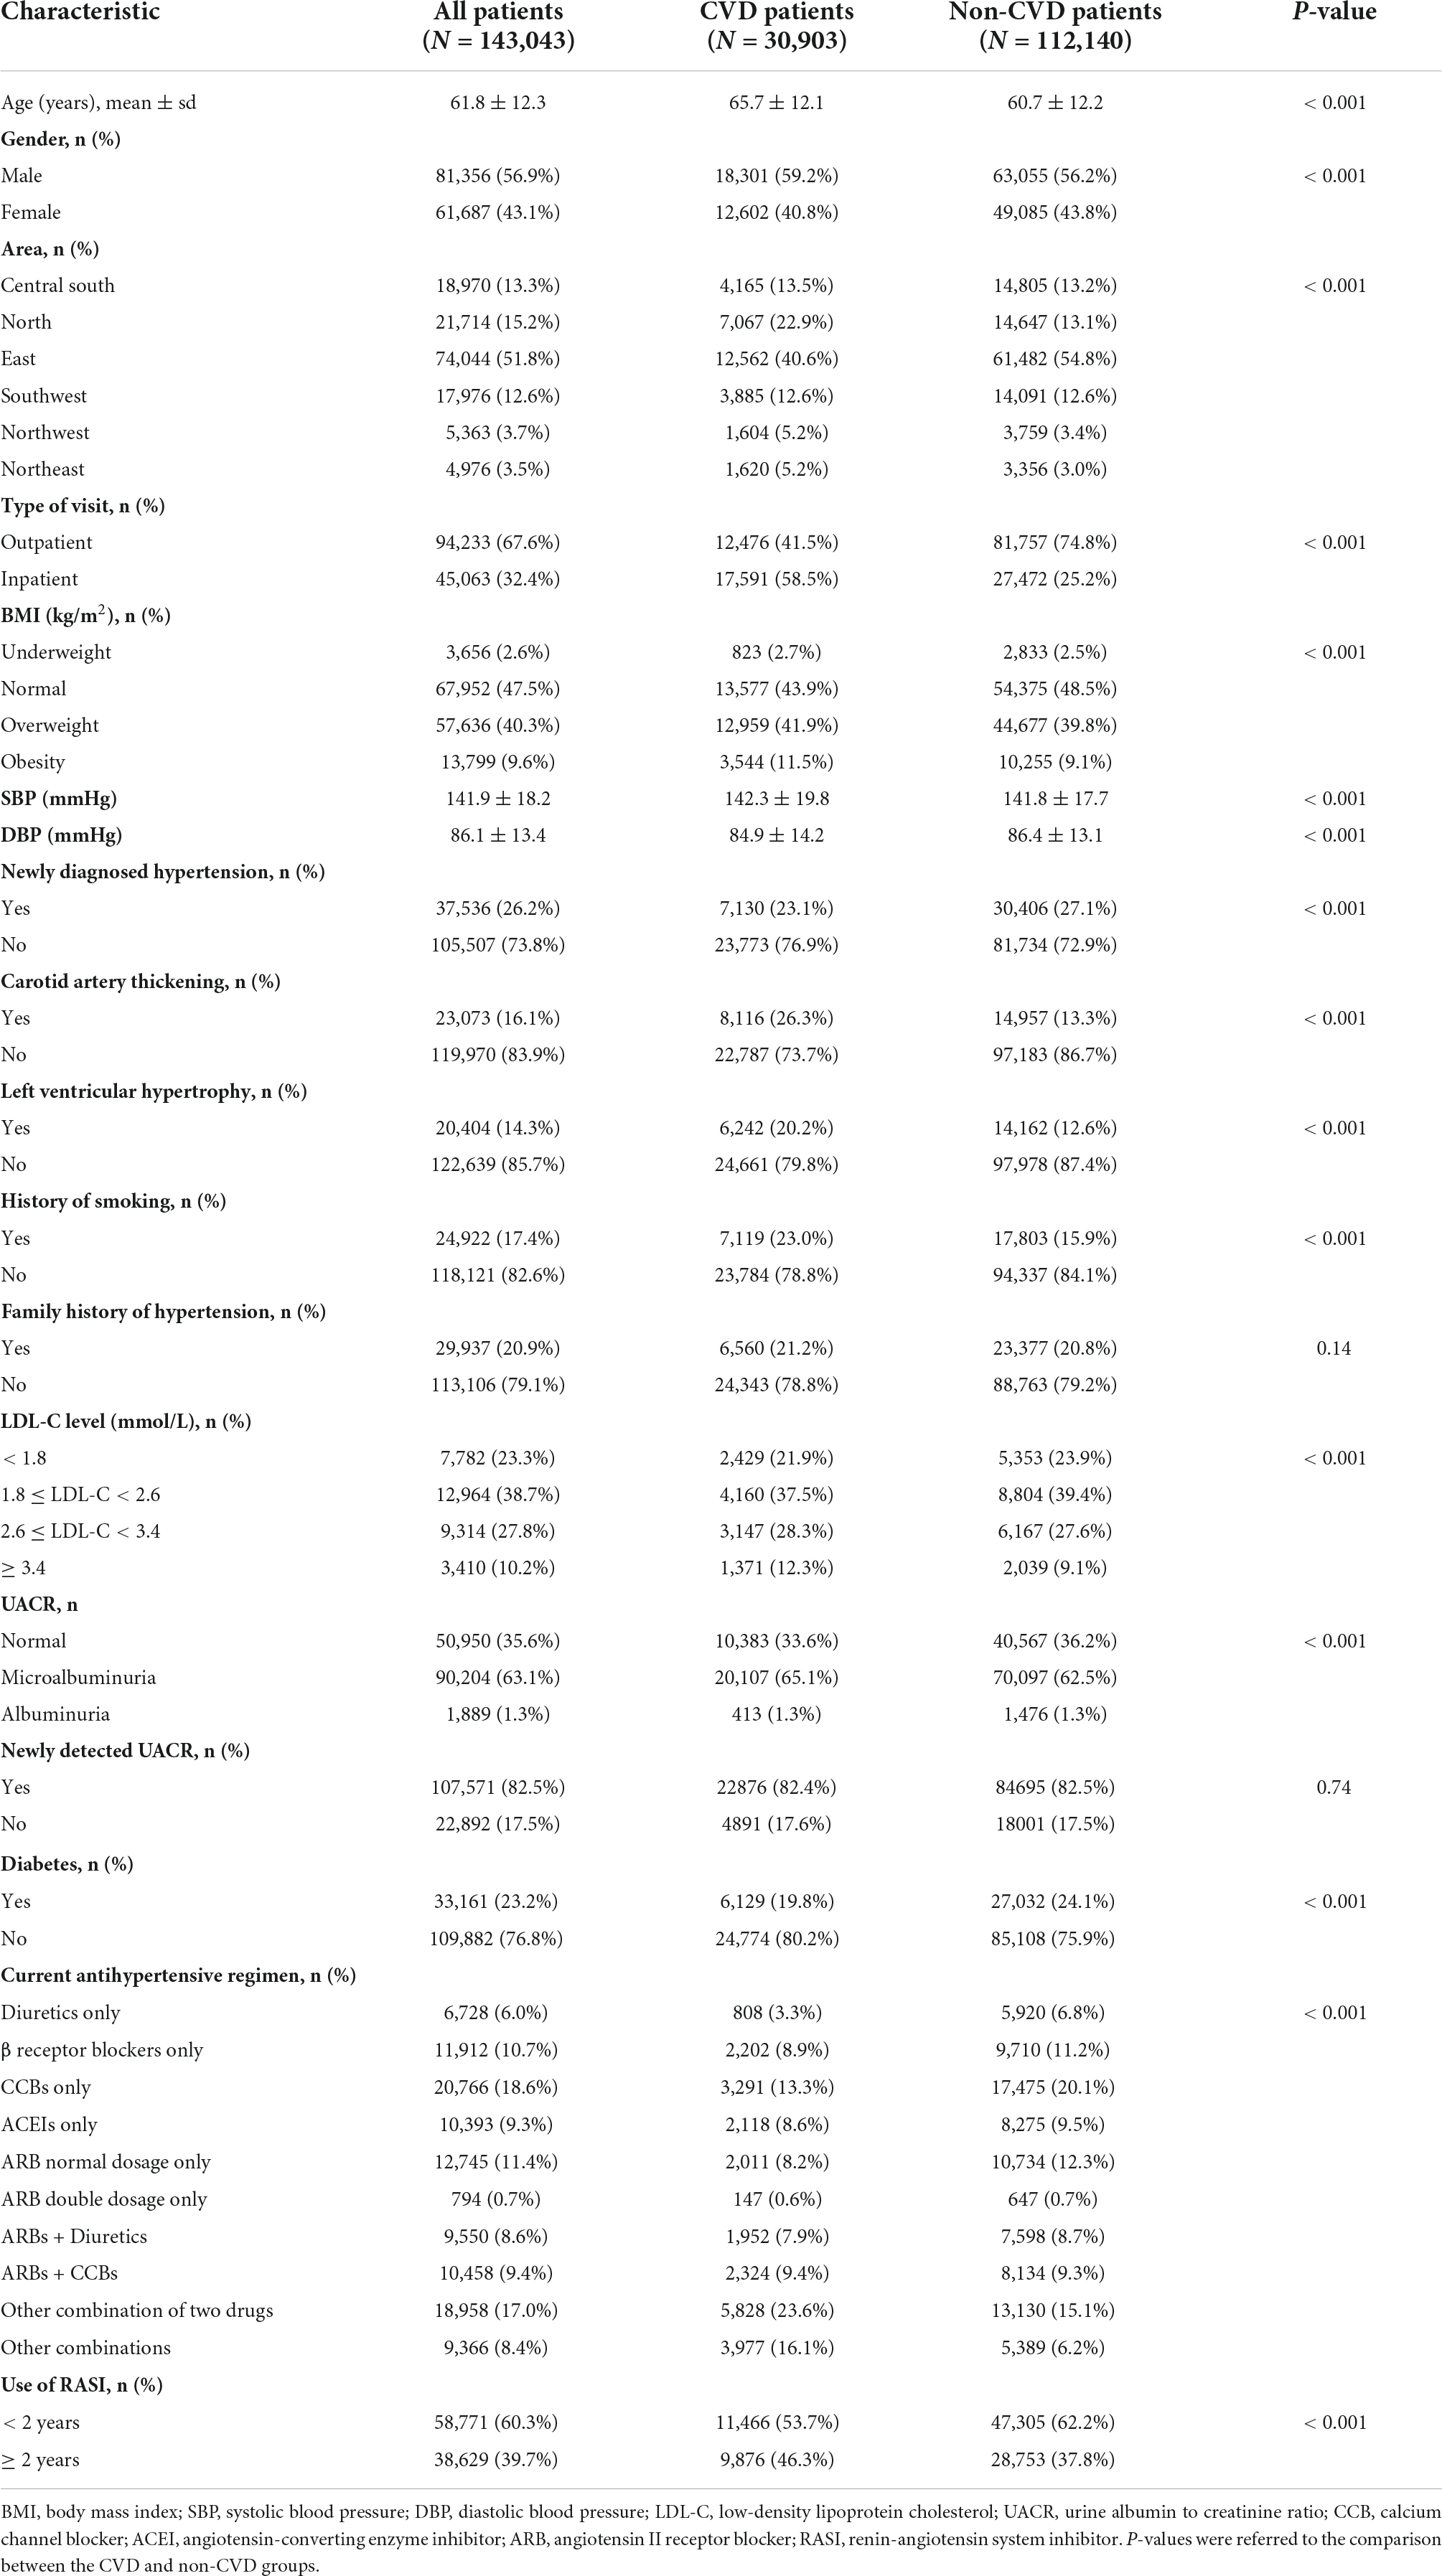
Table 1. Characteristics of included patients.
Model performance comparison
The performance of all algorithms was reasonably good (Figure 2 and Table 2), indicated by AUROCs between 0.7 and 0.8. The Ensemble model was the best performing model with the highest AUROC, compared with the LR model [Ensemble model: AUROC = 0.760, 95% confidence interval (CI): 0.754–0.766]. The machine learning models generally outperformed the LR model (Figure 2 and Table 2). However, the LR with Elastic-Net model showed poorer performance compared to the LR model (LR: AUROC = 0.737, 95% CI: 0.730–0.742; LR with Elastic-Net: AUROC = 0.728, 95% CI: 0.723–0.733). The Ensemble model was also the best performing model based on AUPRC (AUPRC = 0.465, 95% CI: 0.454–0.475, Figure 3 and Table 3).
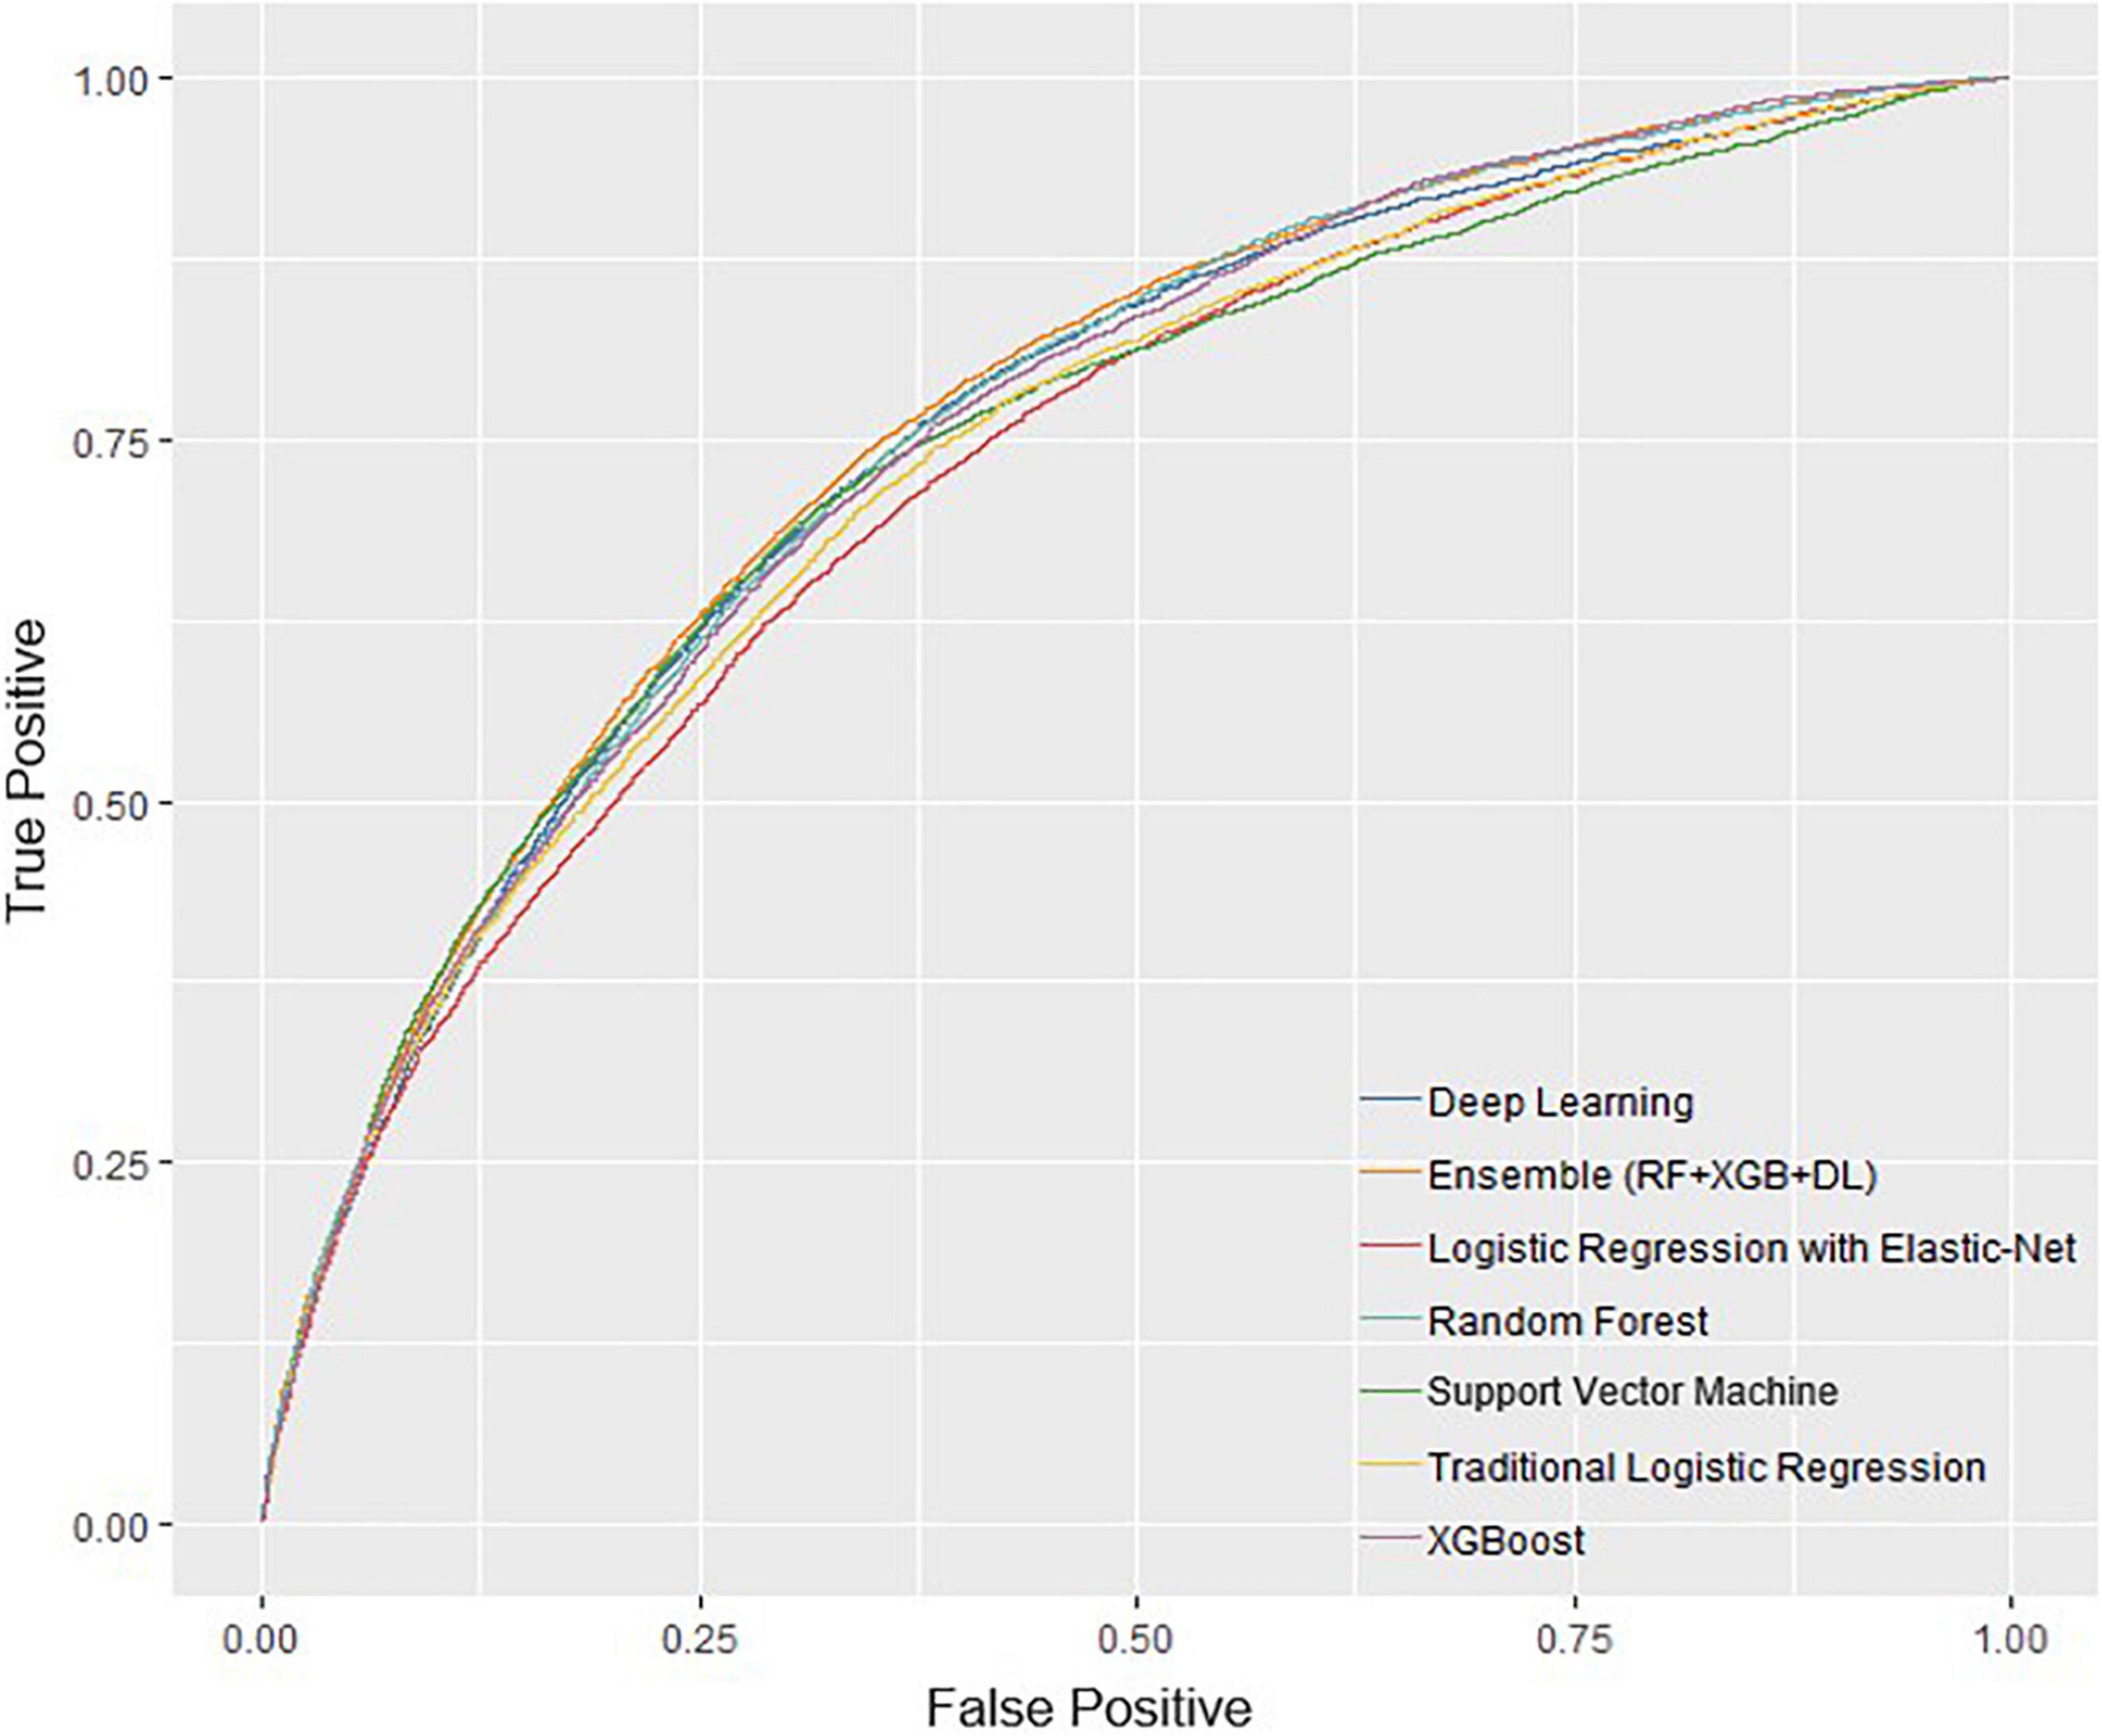
Figure 2. Receiver operating characteristic curves of all models.
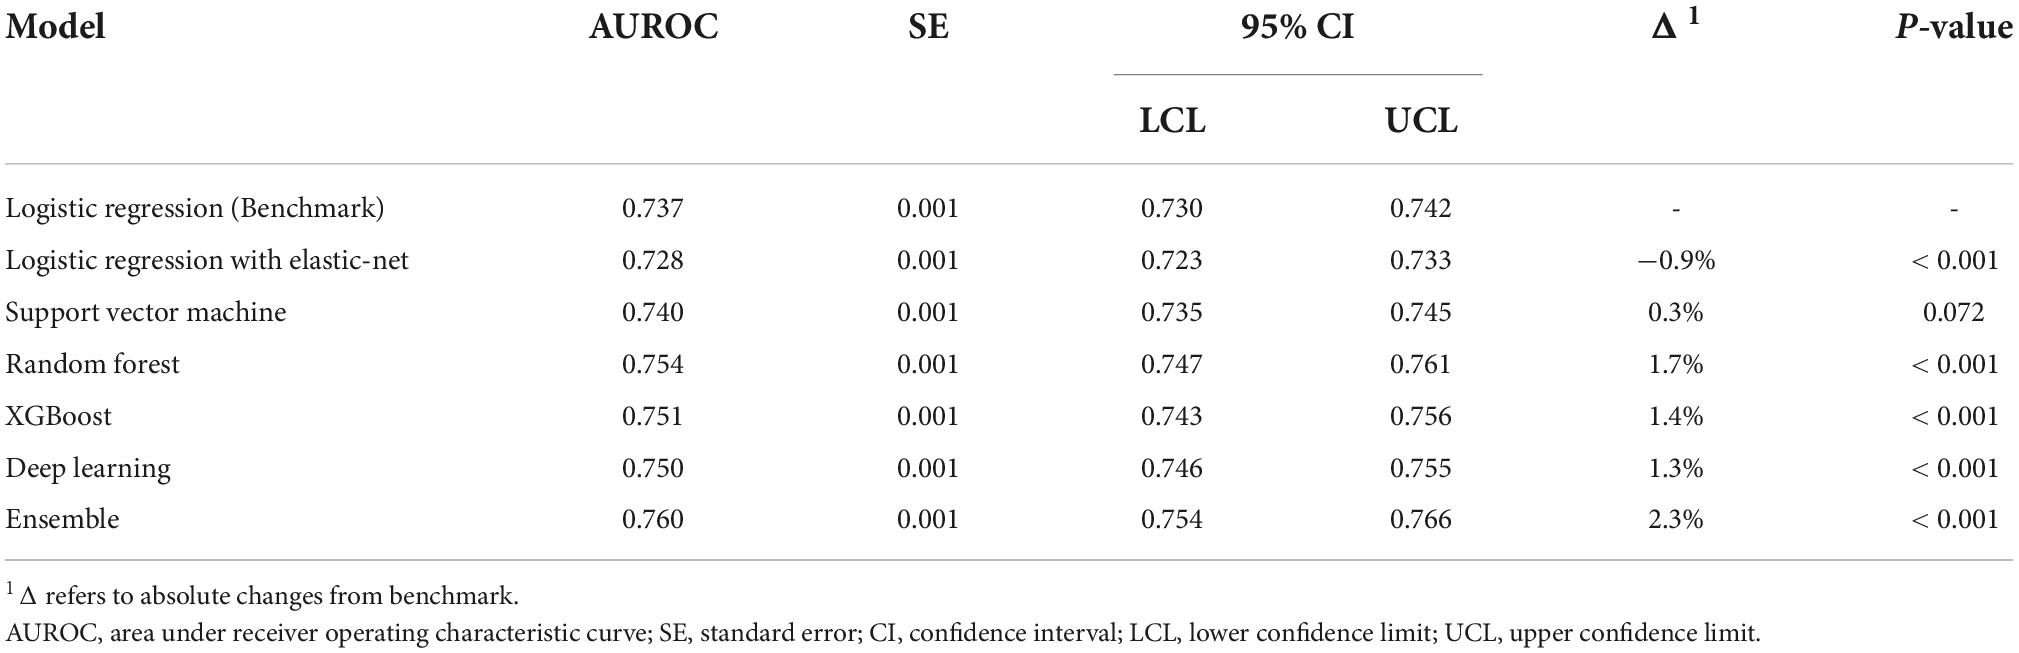
Table 2. Model performance measured by area under receiver operating characteristic curve.
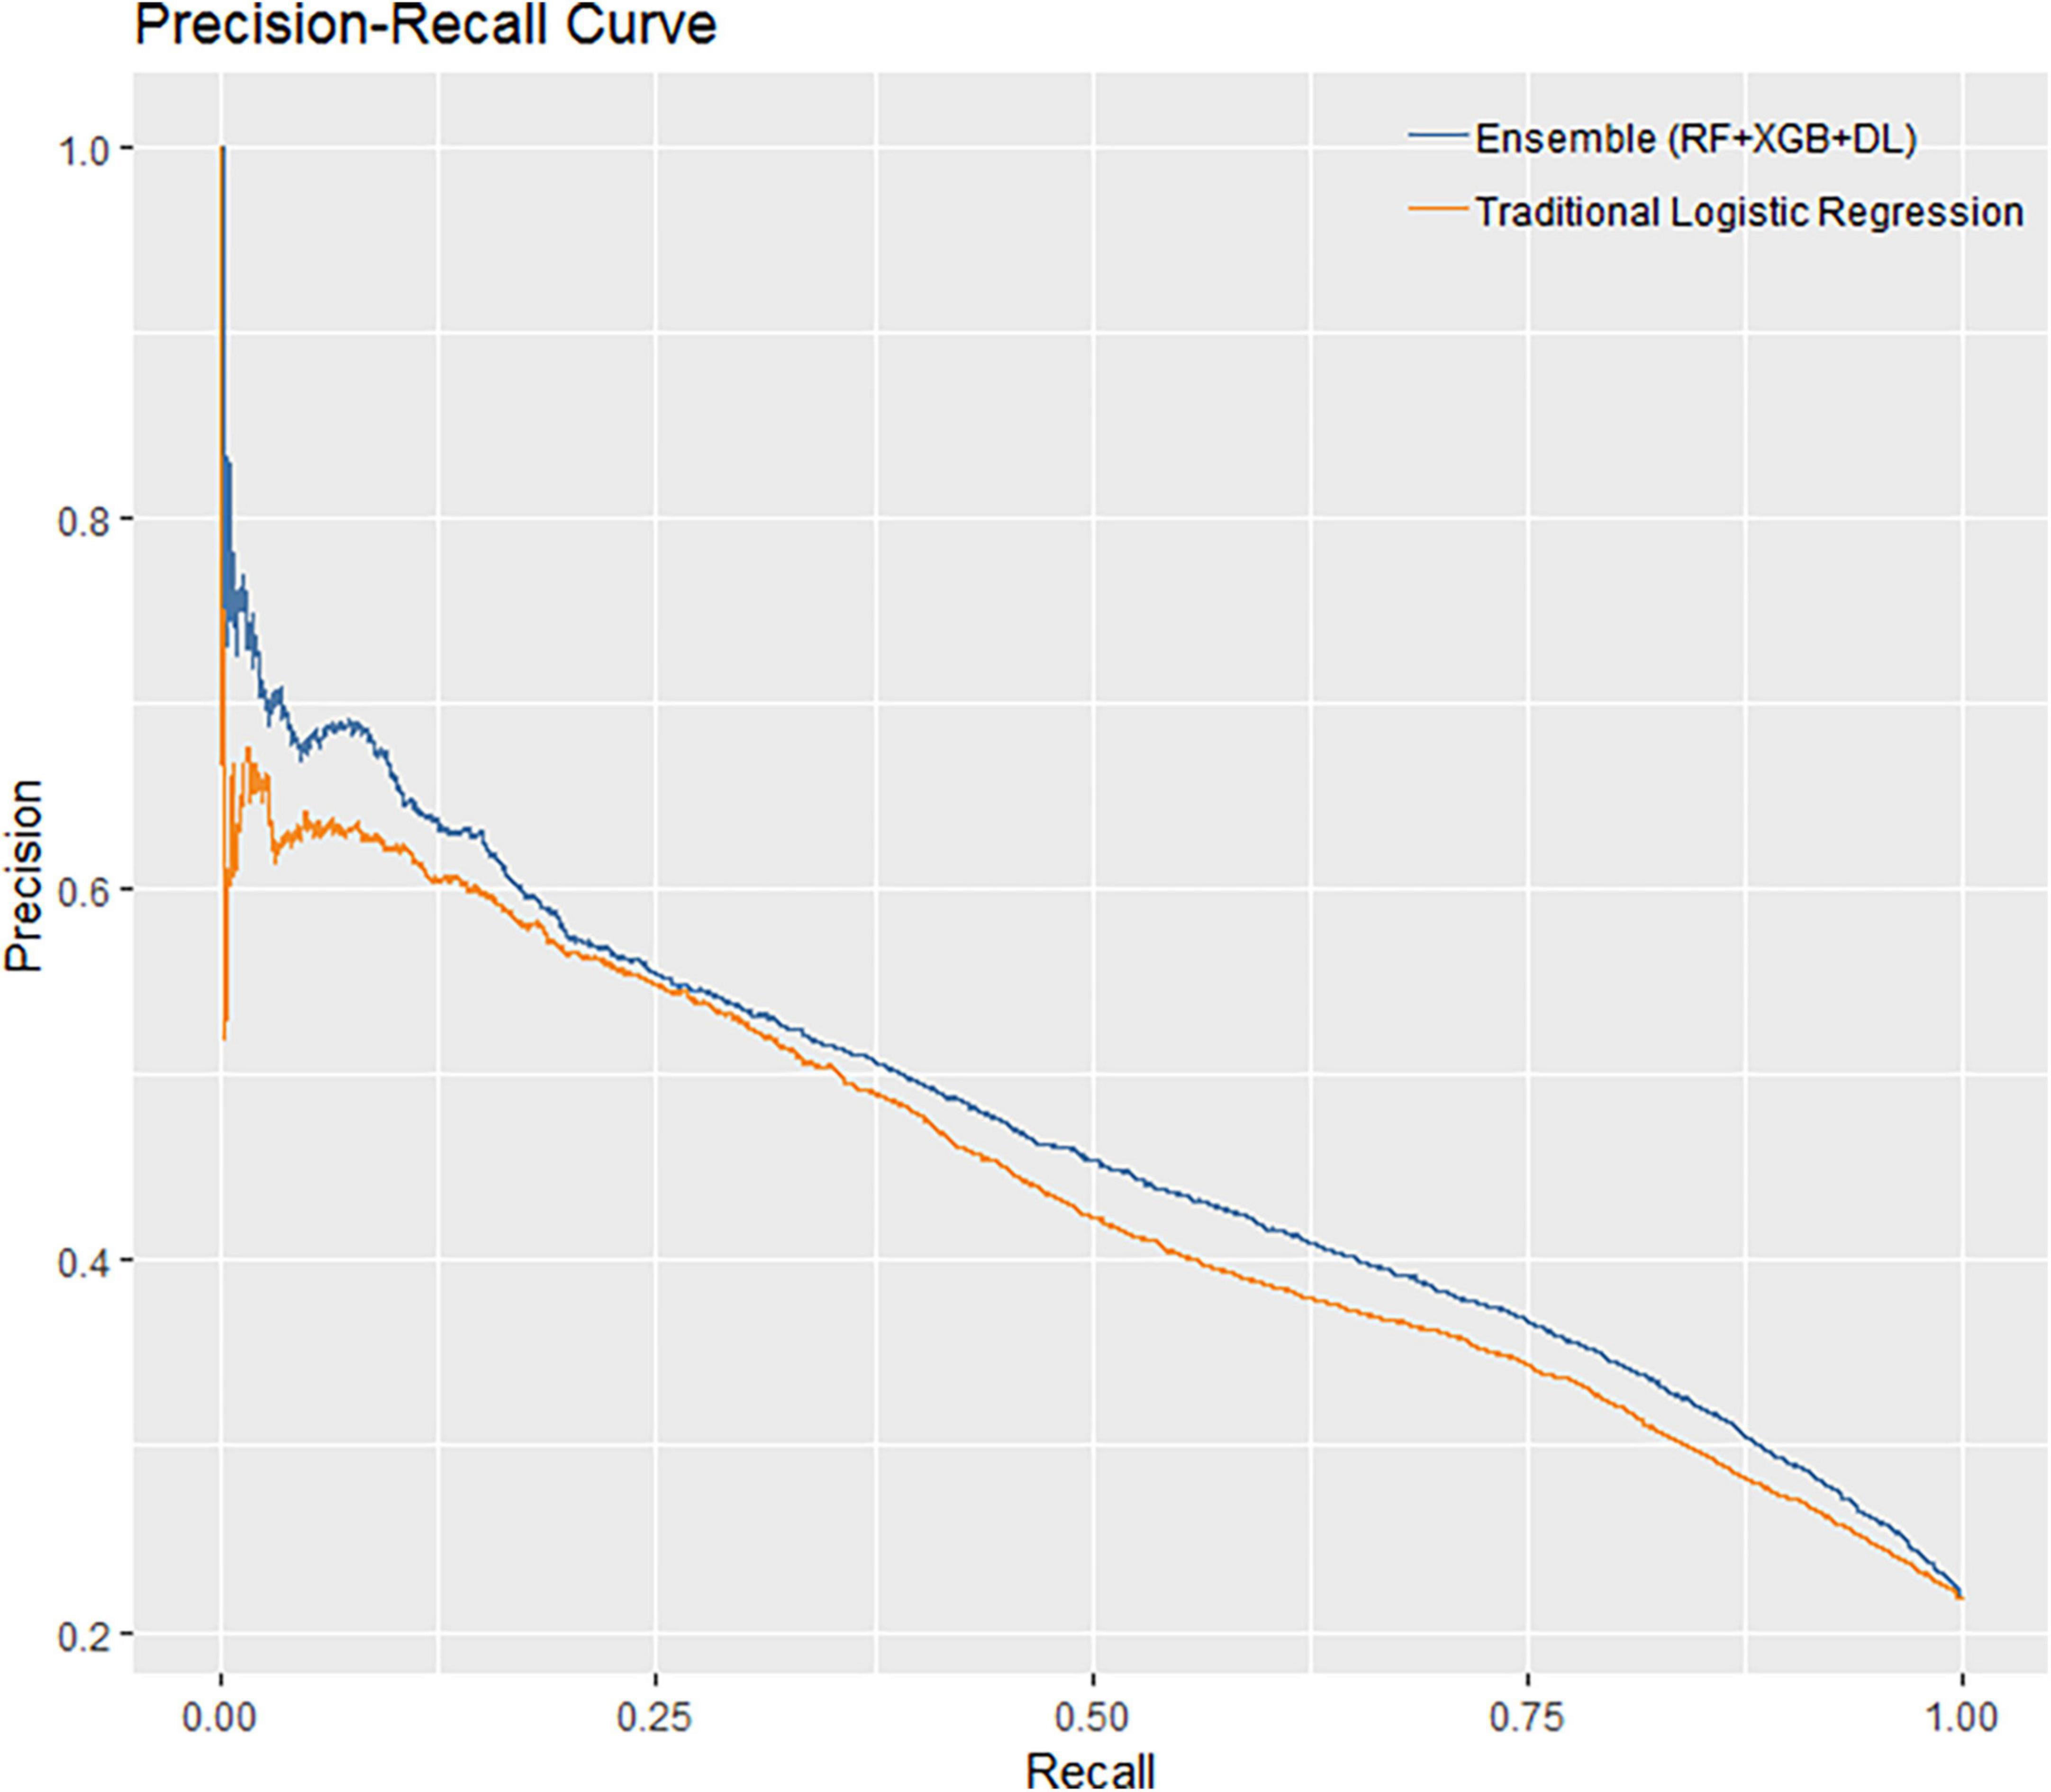
Figure 3. Precision-recall curves of ensemble model and traditional logistic regression model.
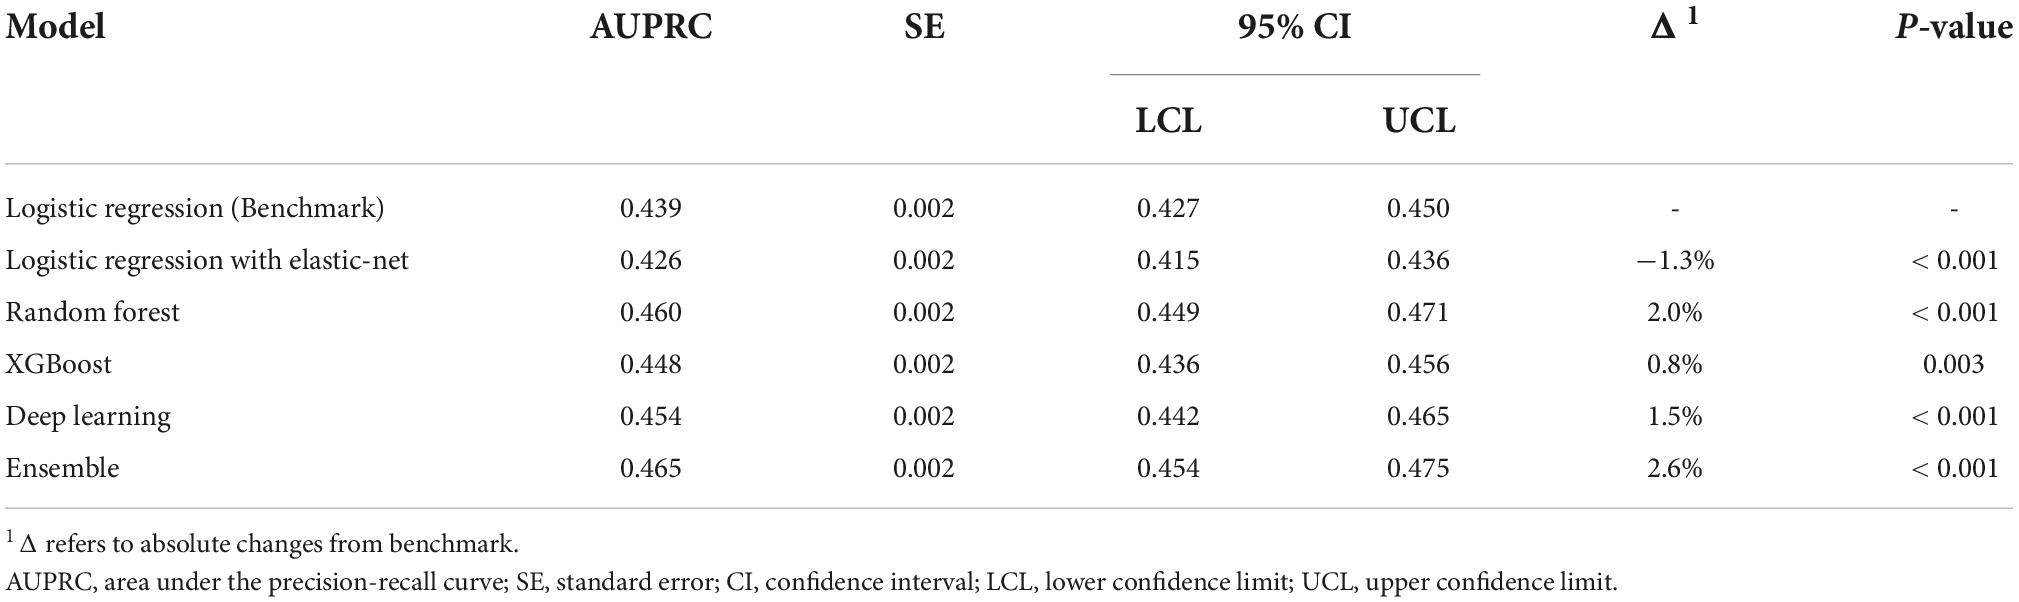
Table 3. Model performance measured by area under precision-recall curves.
Error and sensitivity analysis of the ensemble model
We compared the Ensemble model with the LR model to determine the optimal threshold for classifying patients as likely or unlikely to develop CVDs in a short term. Table 4 shows the results of altering the threshold on false positive rates and false negative rates. T1 was the most sensitive threshold where the Ensemble model incorrectly classified 32 patients as low risk of developing CVDs (LR = 99.03%; Ensemble = 99.48%). The most specific threshold was T5 where the Ensemble model misclassified 7,075 patients as high-risk (LR = 65.84%; Ensemble = 68.45%). Of all the thresholds tested, T5 showed the best performance because it misclassified the least number of patients (LR = 9,505; Ensemble = 8,995), compared with T1 which misclassified the greatest number of patients (LR = 21,259; Ensemble = 21,100). Overall, using T5 on the Ensemble model showed the best precision, with correct identification of 37.7% of patients (Figure 4). However, this 8.6% increase in precision of using T5 over T4 came at a 20% reduction in sensitivity.
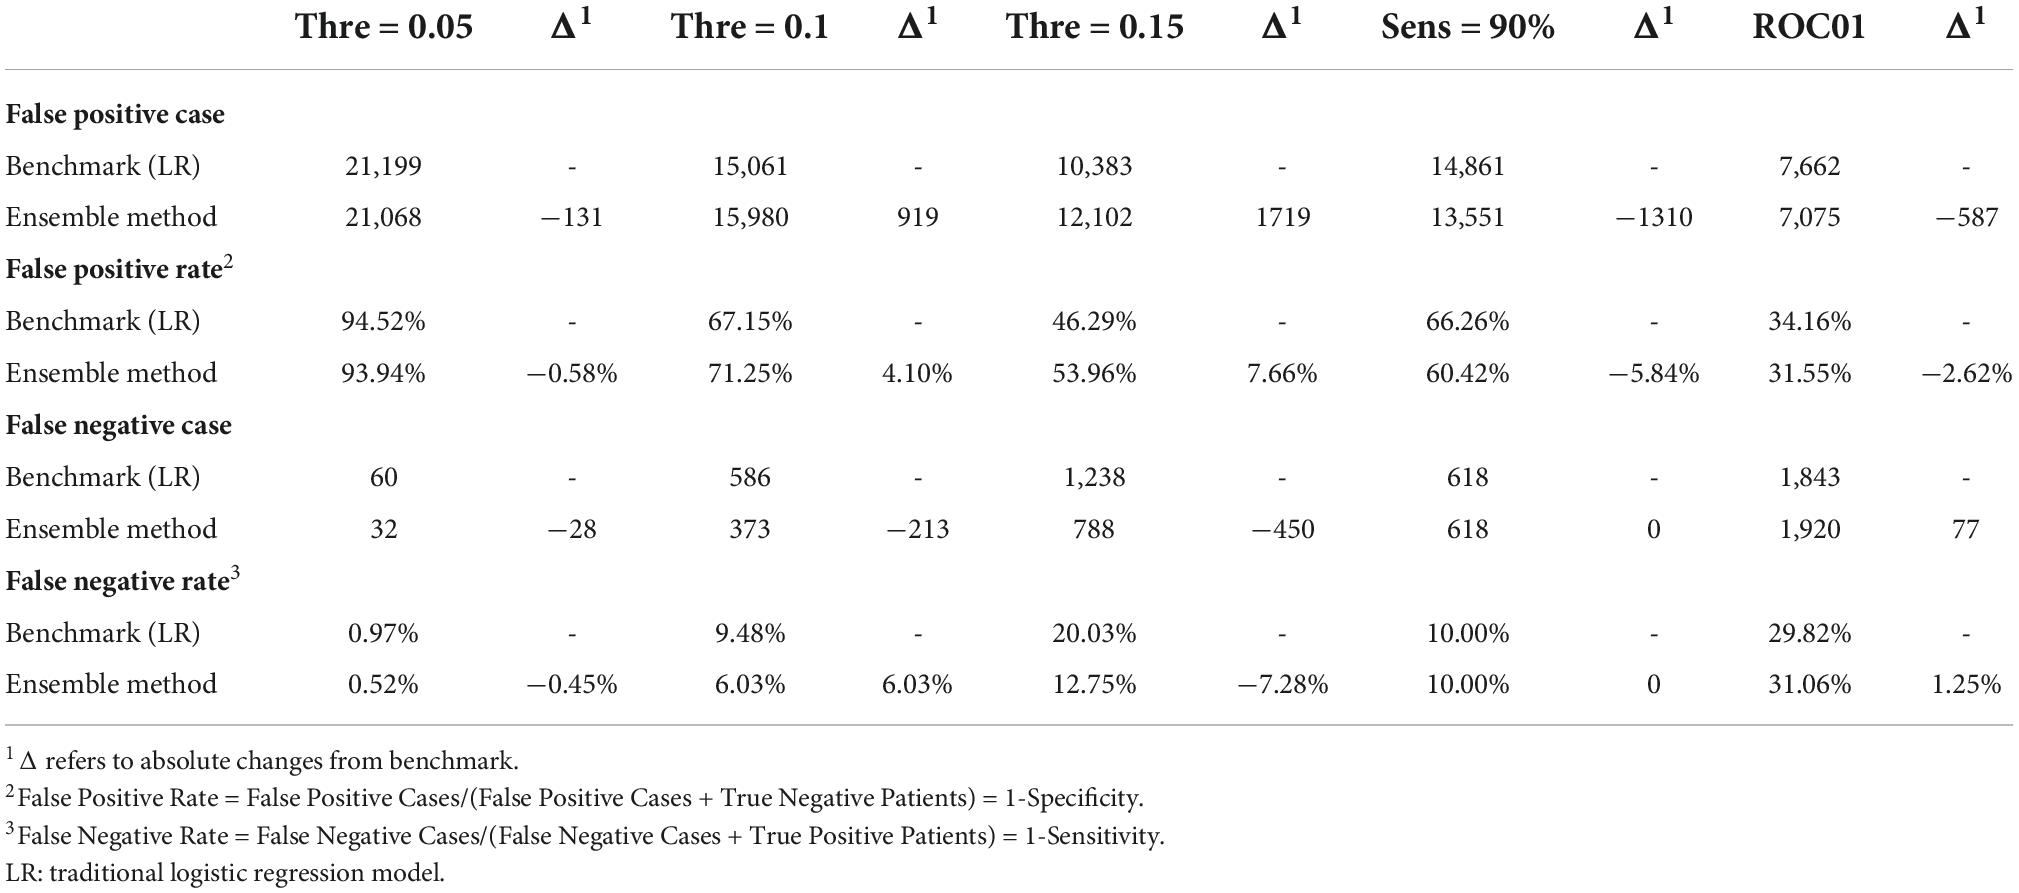
Table 4. Sensitivity analysis of Ensemble model and its comparison with benchmark.
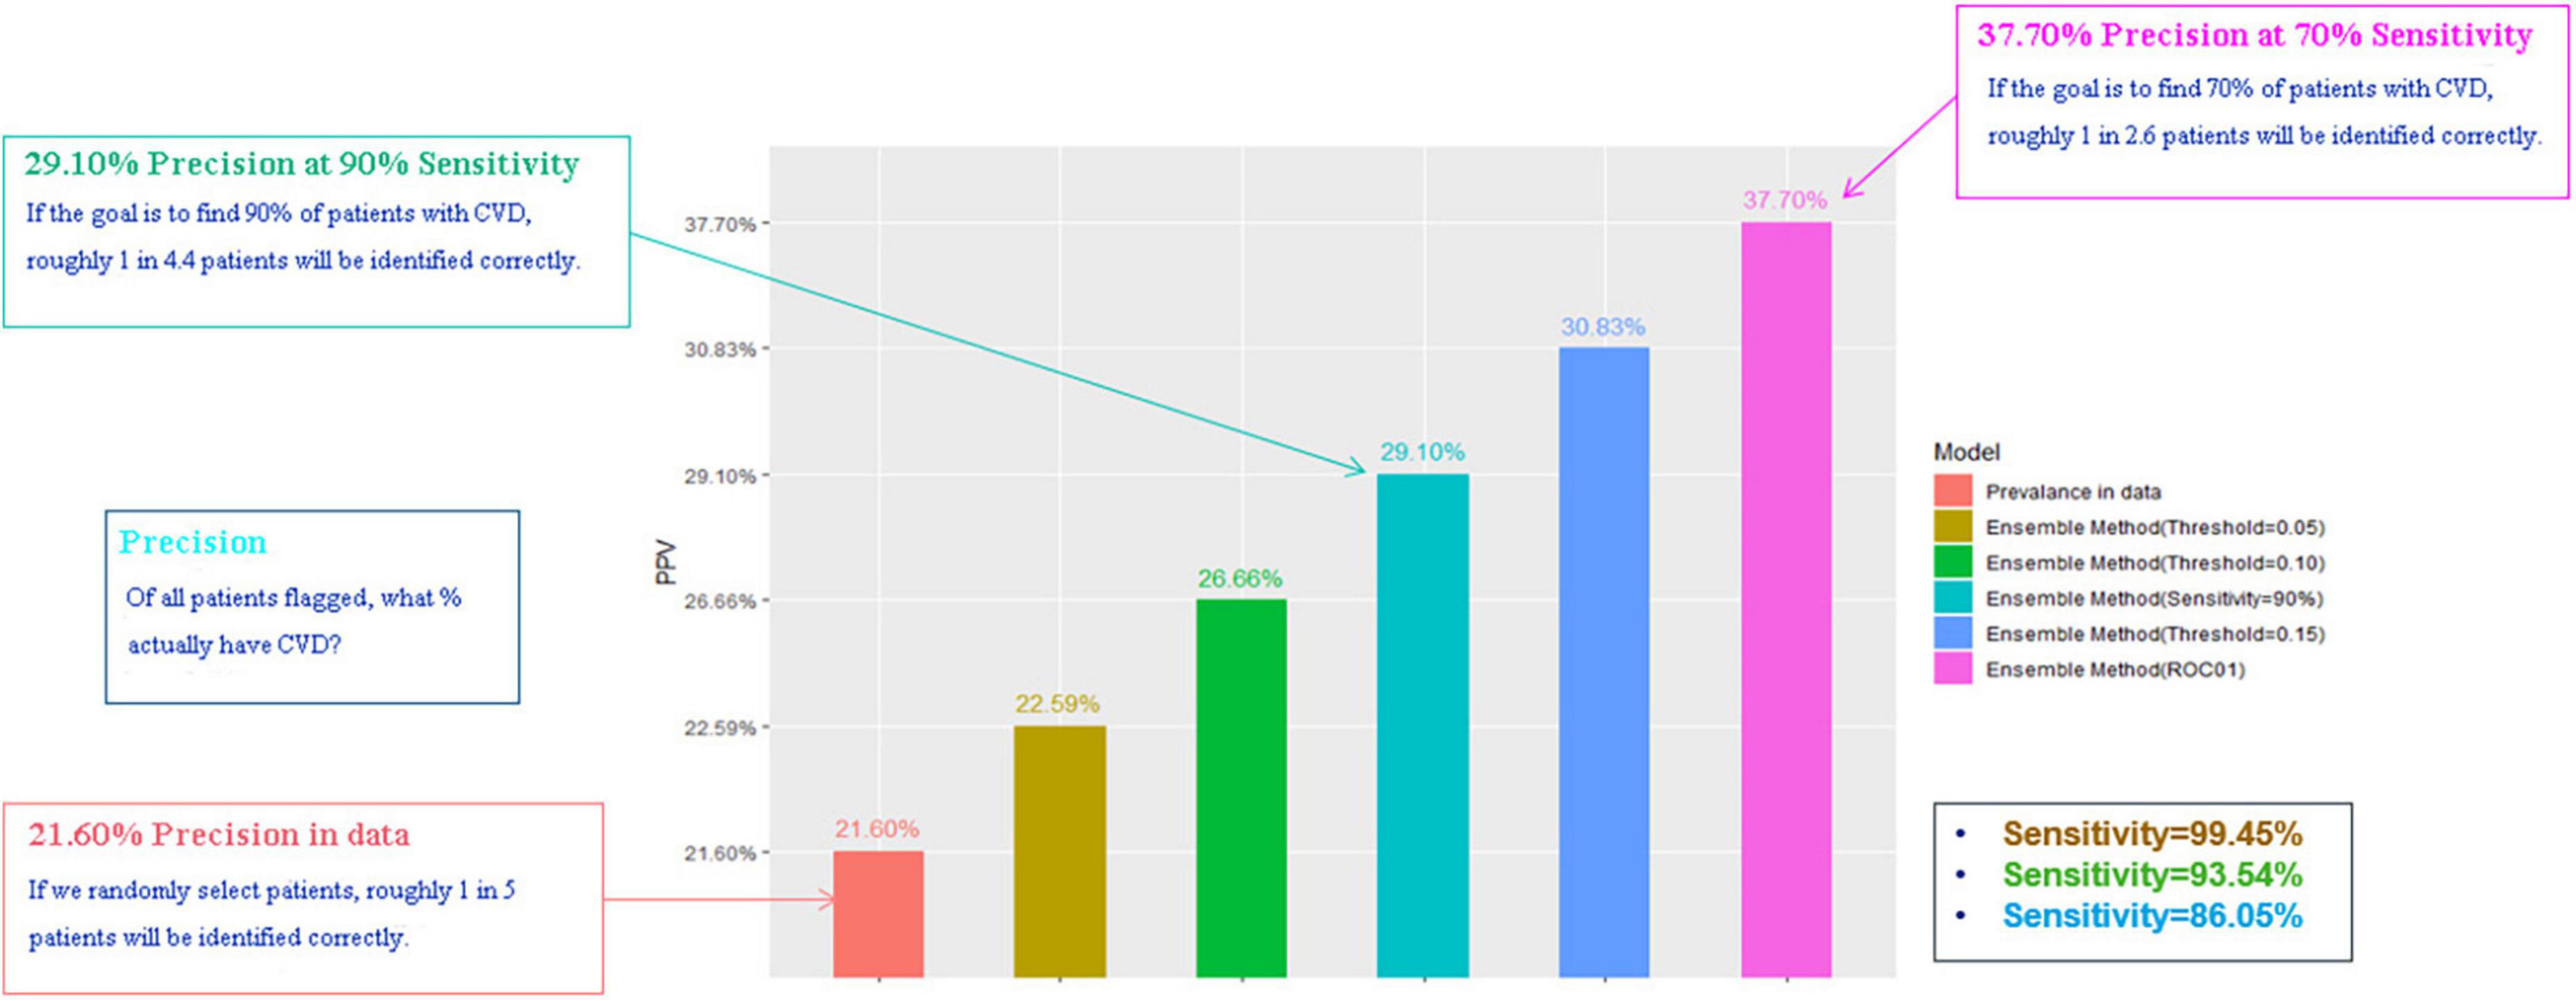
Figure 4. Precision based on different thresholds.
Discussion
Although CVDs is the leading burden of disease in China that affects 290 million people (1, 2), up to 90% of CVDs can be prevented (3–5). There is an increasing emphasis on risk stratification for CVDs to guide the prevention and treatment schedules (8–10).
This study is a cross-sectional survey of hypertensive patients with or without CVDs. In this study, we established ML models for predicting CVD risk based on a large-sample database with comprehensive clinical information. The ML models, except for LR with Elastic-Net model, all showed better performance than traditional LR, as measured by both AUROC and AUPRC. Since the AUROCs are between 0.7 and 0.8, the performance of all models can be considered reasonably good. In addition to AUROC, we also calculated AUPRC as the model performance measure. In our data, 112,140 (78.4%) patients were non-CVD as negative cases. AUPRC is, therefore, suitable to measure the model performance. Both AUROC and AUPRC showed that the Ensemble model was the best performing model.
A low threshold can help identify as many patients as possible who would develop CVDs in a short term. In contrast, the optimal T5 threshold will reduce misclassification and minimize patients’ overall anxiety about future risk. In practice, which threshold should be chosen also depends on physician preference.
Previous CVD risk assessment models were mainly based on the simplest parameters, such as blood pressure, age, lipids, BMI, and drug treatment. The atherosclerotic cardiovascular disease (ASCVD) cohort equation of ACC/AHA in the United States, the Framingham risk score, the European Systemic coronary risk assessment model (10–16), the 10-year ASCVD risk prediction tool of the PAR project in China, and the CVD death risk prediction tool (17–20) are all in this case. Compared with the previous models, our machine learning prediction model adds some new parameters commonly detected in patients with hypertension at present, including blood glucose, creatinine, microalbuminuria, and carotid intima-media thickening, so our model has good availability and can provide more accurate risk predictions of CVD. In addition, the present study was based on a large-sample cross-sectional investigation, which provided sufficient statistical power for the construction of the machine learning model.
There are several limitations in this study, mainly due to issues related to data quality. First, the number of variables collected at baseline was limited. Only eighteen variables were collected by the survey, which may not cover all risk factors associated with CVDs. Nevertheless, our models with these variables showed reasonably good performance indicated by AUROC over 0.7. Second, some variables were not clearly defined during data collection. For example, in terms of the blood pressure readings, we were unable to determine whether the measurements were before or after medication, which may cause heterogeneity and affect the accuracy of the effect estimates. Thirdly, several key variables were collected through open-ended questions. This resulted in a high rate of missing values. For example, nearly 90% of participants did not provide valid information on the duration of hypertension.
Our model can be adopted in healthcare settings where key clinical information is available. In future work, we will improve the model by collecting additional information related to cardiovascular risk and comparing it with other models being developed. We will validate the model with other datasets to evaluate its generalizability. We are also following up a part of patients and plan on adding microalbuminuria and other new parameters through a large external cohort to verify the accuracy of the machine learning model. In addition, disease prediction models trained by longitudinal data may predict long-term CVD risks, to guide CVD prevention.
Data availability statement
The original contributions presented in this study are included in the article/supplementary material, further inquiries can be directed to the corresponding author.
Ethics statement
The studies involving human participants were reviewed and approved by Ethical Committee of Peking University People’s Hospital. The patients/participants provided their written informed consent to participate in this study.
Author contributions
All authors listed have made a substantial, direct, and intellectual contribution to the work, and approved it for publication.
Funding
This project was sponsored by Sanofi, China. The funder has no role in study design, data collection and management, and statistical analysis. Funding was not contingent upon the publication of the manuscript. No patents have been applied for relating to the content of the manuscript. The authors are responsible for all content and editorial decisions and did not receive honoraria related to the development of this publication.
Acknowledgments
The authors gratefully acknowledge the participation of all patients and the contribution of the investigators. Medical writing support under the authors’ direction was provided by Zheng Yin, Ph.D. and Xinran Zhao, MHS (IQVIA), according to Good Publication Practice guidelines.
Conflict of interest
The authors declare that the research was conducted in the absence of any commercial or financial relationships that could be construed as a potential conflict of interest.
Publisher’s note
All claims expressed in this article are solely those of the authors and do not necessarily represent those of their affiliated organizations, or those of the publisher, the editors and the reviewers. Any product that may be evaluated in this article, or claim that may be made by its manufacturer, is not guaranteed or endorsed by the publisher.
References
1. Hu SS, Gao RL, Liu LS, Zhu ML, Wang W, Wang YJ. Summary of the 2018 report on cardiovascular diseases in China. Chin Circ J. (2018). 34:209–20.
2. National Center for Cardiovascular Diseases. Report on Cardiovascular Diseases in China 2019 [Chinese]. Beijing: Encyclopedia of China Publishing House (2019).
3. O’Flaherty M, Buchan I, Capewell S. Contributions of treatment and lifestyle to declining CVD mortality: why have CVD mortality rates declined so much since the 1960s? Heart. (2013) 99:159–62. doi: 10.1136/heartjnl-2012-302300
4. O’Donnell MJ, Chin SL, Rangarajan S, Xavier D, Liu L, Zhang H, et al. Global and regional effects of potentially modifiable risk factors associated with acute stroke in 32 countries (INTERSTROKE): a case-control study. Lancet. (2016) 388:761–75. doi: 10.1016/S0140-6736(16)30506-2
5. Leong DP, Joseph PG, McKee M, Anand SS, Teo KK, Schwalm JD, et al. Reducing the global burden of cardiovascular disease, part 2: prevention and treatment of cardiovascular disease. Circ Res. (2017) 121:695–710. doi: 10.1161/CIRCRESAHA.117.311849
6. Joseph P, Leong D, McKee M, Anand SS, Schwalm JD, Teo K, et al. Reducing the global burden of cardiovascular disease, part 1: the epidemiology and risk factors. Circ Res. (2017) 121:677–94. doi: 10.1161/CIRCRESAHA.117.308903
7. Califf R, Armstrong P, Carver J, D’agostino R, Strauss W. 27th Bethesda Conference: matching the intensity of risk factor management with the hazard for coronary disease events. Task Force 5. Stratification of patients into high, medium and low risk subgroups for purposes of risk factor management. J Am Coll Cardiol. (1996) 27:1007. doi: 10.1016/0735-1097(96)87733-3
8. Karmali KN, Lloyd-Jones DM. Global risk assessment to guide blood pressure management in cardiovascular disease prevention. Hypertension. (2017) 69:e2–9. doi: 10.1161/HYPERTENSIONAHA.116.08249
9. Meschia JF, Bushnell C, Boden-Albala B, Braun LT, Bravata DM, Chaturvedi S, et al. Guidelines for the primary prevention of stroke: a statement for healthcare professionals from the American heart association/American stroke association. Stroke. (2014) 45:3754–832. doi: 10.1161/STR.0000000000000046
10. Writing Group of Chinese Cardiovascular Disease Prevention Guidelines, Editorial Board of Chinese Journal of Cardiology. China cardiovascular disease prevention guidelines. Chin J Cardiol. (2018) 46:10–25.
11. Stone NJ, Robinson JG, Lichtenstein AH, Merz CB, Blum CB, Eckel RH, et al. 2013 ACC/AHA guideline on the treatment of blood cholesterol to reduce atherosclerotic cardiovascular risk in adults. Circulation. (2014) 129:S1–45. doi: 10.1161/01.cir.0000437738.63853.7a
12. Hippisley-Cox J, Coupland C, Vinogradova Y, Robson J, May M, Brindle P. Derivation and validation of QRISK, a new cardiovascular disease risk score for the United Kingdom: prospective open cohort study. BMJ. (2007) 335:136. doi: 10.1136/bmj.39261.471806.55
13. Conroy RM, Pyörälä K, Fitzgerald AP, Sans S, Menotti A, De Backer G, et al. Estimation of ten-year risk of fatal cardiovascular disease in Europe: the SCORE project. Eur Heart J. (2003) 24:987–1003. doi: 10.1016/S0195-668X(03)00114-3
14. Wilson PW, D’Agostino RB, Levy D, Belanger AM, Silbershatz H, Kannel WB. Prediction of coronary heart disease using risk factor categories. Circulation. (1998) 97:1837–47. doi: 10.1161/01.CIR.97.18.1837
15. Antman EM, Cohen M, Bernink PJ, McCabe CH, Horacek T, Papuchis G, et al. The TIMI risk score for unstable angina/non-ST elevation MI: a method for prognostication and therapeutic decision making. JAMA. (2000) 284:835–42. doi: 10.1001/jama.284.7.835
16. Eagle KA, Lim MJ, Dabbous OH, Pieper KS, Goldberg RJ, Van de Werf F, et al. A validated prediction model for all forms of acute coronary syndrome: estimating the risk of 6-month postdischarge death in an international registry. JAMA. (2004) 291:2727–33. doi: 10.1001/jama.291.22.2727
17. Peng Y, Du X, Rogers KD, Wu Y, Gao R, Patel A. Predicting in-hospital mortality in patients with acute coronary syndrome in china. Am J Cardiol. (2017) 120:1077–83. doi: 10.1016/j.amjcard.2017.06.044
18. Hu WS, Lee JH, Tsai MK, Wen CP. A novel cardiovascular death prediction model for Chinese individuals: a prospective cohort study of 381,963 study participants. Atherosclerosis. (2017) 264:19–28. doi: 10.1016/j.atherosclerosis.2017.07.016
19. Wan EYF, Fong DYT, Fung CSC, Yu EYT, Chin WY, Chan AKC, et al. Development of a cardiovascular diseases risk prediction model and tools for Chinese patients with type 2 diabetes mellitus: a population-based retrospective cohort study. Diabetes Obes Metab. (2018) 20:309–18. doi: 10.1111/dom.13066
20. Yang X, Li J, Hu D, Chen J, Li Y, Huang J, et al. Predicting the 10-year risks of atherosclerotic cardiovascular disease in chinese population: the china-PAR project (prediction for ASCVD risk in china). Circulation. (2016) 134:1430–40. doi: 10.1161/CIRCULATIONAHA.116.022367
21. Khanji MY, Bicalho VV, van Waardhuizen CN, Ferket BS, Petersen SE, Hunink MG. Cardiovascular risk assessment: a systematic review of guidelines. Ann Intern Med. (2016) 165:713–22. doi: 10.7326/M16-1110
22. Goldberger JJ, Subačius H, Patel T, Cunnane R, Kadish AH. Sudden cardiac death risk stratification in patients with nonischemic dilated cardiomyopathy. J Am Coll Cardiol. (2014) 63:1879–89. doi: 10.1016/j.jacc.2013.12.021
23. Deo RC. Machine learning in medicine. Circulation. (2015) 132:1920–30. doi: 10.1161/CIRCULATIONAHA.115.001593
24. Kakadiaris IA, Vrigkas M, Yen AA, Kuznetsova T, Budoff M, Naghavi M. Machine learning outperforms ACC/AHA CVD risk calculator in MESA. J Am Heart Assoc. (2018) 7:e009476. doi: 10.1161/JAHA.118.009476
25. Weng SF, Reps J, Kai J, Garibaldi JM, Qureshi N. Can machine-learning improve cardiovascular risk prediction using routine clinical data? PLoS One. (2017) 12:e0174944. doi: 10.1371/journal.pone.0174944
26. Joint committee issued Chinese guideline for the management of dyslipidemia in adults. 2016 Chinese guideline for the management of dyslipidemia in adults. Chin J Health Manage. (2017) 11:7–28.
27. Goff DC Jr, Lloyd-Jones DM, Bennett G, Coady S, D’Agostino RB, Gibbons R, et al. 2013 ACC/AHA guideline on the assessment of cardiovascular risk: a report of the American college of cardiology/American heart association task force on practice guidelines. Circulation. (2014) 129:S49–73. doi: 10.1161/01.cir.0000437741.48606.98
28. Piepoli MF, Hoes AW, Agewall S, Albus C, Brotons C, Catapano AL, et al. 2016 European Guidelines on cardiovascular disease prevention in clinical practice: The Sixth Joint Task Force of the European Society of Cardiology and Other Societies on Cardiovascular Disease Prevention in Clinical Practice (constituted by representatives of 10 societies and by invited experts) Developed with the special contribution of the European Association for Cardiovascular Prevention & Rehabilitation (EACPR). Eur Heart J. (2016) 37:2315–81. doi: 10.1093/eurheartj/ehw106
Keywords: machine learning, CVD, risk prediction, hypertension, traditional logistic regression
Citation: Xi Y, Wang HY and Sun NL (2022) Machine learning outperforms traditional logistic regression and offers new possibilities for cardiovascular risk prediction: A study involving 143,043 Chinese patients with hypertension. Front. Cardiovasc. Med. 9:1025705. doi: 10.3389/fcvm.2022.1025705
Received: 23 August 2022; Accepted: 23 September 2022;
Published: 14 November 2022.
Edited by:
Baohui Xu, Stanford University, United StatesReviewed by:
Tao Wang, University of Missouri–Kansas City, United StatesJia Guo, Shanxi Medical University First Hospital, China
Copyright © 2022 Xi, Wang and Sun. This is an open-access article distributed under the terms of the Creative Commons Attribution License (CC BY). The use, distribution or reproduction in other forums is permitted, provided the original author(s) and the copyright owner(s) are credited and that the original publication in this journal is cited, in accordance with accepted academic practice. No use, distribution or reproduction is permitted which does not comply with these terms.
*Correspondence: Ningling Sun, sunnl@263.net