Determination of polar bear (Ursus maritimus) individual genotype and sex based on DNA extracted from paw-prints in snow
 Andrew L. Von Duyke1*†
  Justin A. Crawford2†
  Lori Quakenbush2†
  Jennifer R. Adams3†
  Lisette P. Waits3†
- 1Department of Wildlife Management, North Slope Borough, Utqiaġvik, AK, United States
- 2Arctic Marine Mammal Program, Alaska Department of Fish and Game, Fairbanks, AK, United States
- 3Department of Fish and Wildlife Sciences, University of Idaho, Moscow, ID, United States
Polar bears rely upon sea ice to hunt, travel, and reproduce. Declining sea ice extent and duration has led polar bears to be designated as “threatened” (ESA). Population monitoring is vital to polar bear conservation; but recently, poor sea ice has made traditional aircraft-based methods less viable. These methods largely rely upon the capture and handling of polar bears, and have been criticized over animal welfare concerns. Monitoring polar bears via DNA sampling is a promising option. One common method utilizes biopsy darts delivered from a helicopter to collect DNA, a method that faces similar ice associated challenges to those described above. However, epidermal cells shed from the foot pads of a polar bear into its paw-prints in snow are a source of “environmental DNA” (e-DNA) that can be collected non-invasively on the sea ice or on land for potential use in population monitoring. Mitochondrial DNA (mt-DNA) is used to assess whether polar bear DNA is present within a snow sample, and nuclear DNA (n-DNA) can identify individuals and their sex. The goal of this investigation was to assess the viability of using e-DNA collected from paw-prints in the snow to identify individual polar bears and their sex. Snow was sampled from 13 polar bear trails (10 paw-prints per trail) on the sea ice in the Chukchi and Beaufort seas along the North Slope of Alaska. Species verification was based on a mt-DNA PCR fragment analysis test. Identification of individuals was accomplished by amplifying a multiplex of seven n-DNA microsatellite loci, and sex was determined by the amelogenin gene sex ID marker. Six of the 13 bear trails sampled (46%) yielded consensus genotypes for five unique males and one female. To our knowledge, this is the first time that polar bears have been individually identified by genotype and sex using e-DNA collected from snow. This method is non-invasive, could be integrated into genetic mark-recapture sampling designs, and addresses some of the current challenges arising from poor sea ice conditions. It also can involve, engage, and empower Indigenous communities in the Arctic, which are greatly affected by polar bear management decisions.
Introduction
The polar bear (Ursus maritimus) is an iconic Arctic predator that relies upon sea ice as a platform on which to hunt, travel, and reproduce (Wiig et al., 2015). The loss of sea ice due to climate change in the Arctic (Rantanen et al., 2022) led to the listing of polar bears as “threatened” under the US Endangered Species Act (ESA) (US Fish and Wildlife Service, 2008). As sea ice continues to decline, polar bears are expected to spend more time on land (Rode et al., 2022), thereby increasing the potential for human/bear conflicts and negative impacts on cub survival due to human disturbance (Woodruff et al., 2022). The US shares two polar bear subpopulations (Chukchi Sea (CS) and Southern Beaufort Sea (SBS)) with Russia and Canada respectively (Figure 1), and Indigenous people legally hunt polar bears for subsistence from both subpopulations. Given the obligations of the ESA, international management agreements, and the need to ensure that subsistence harvest is sustainable, polar bear populations need to be monitored and managed. Because polar bears occupy remote and environmentally extreme habitats, population monitoring for conservation and management is challenging, costly, and becoming more difficult with rapidly changing environmental conditions.
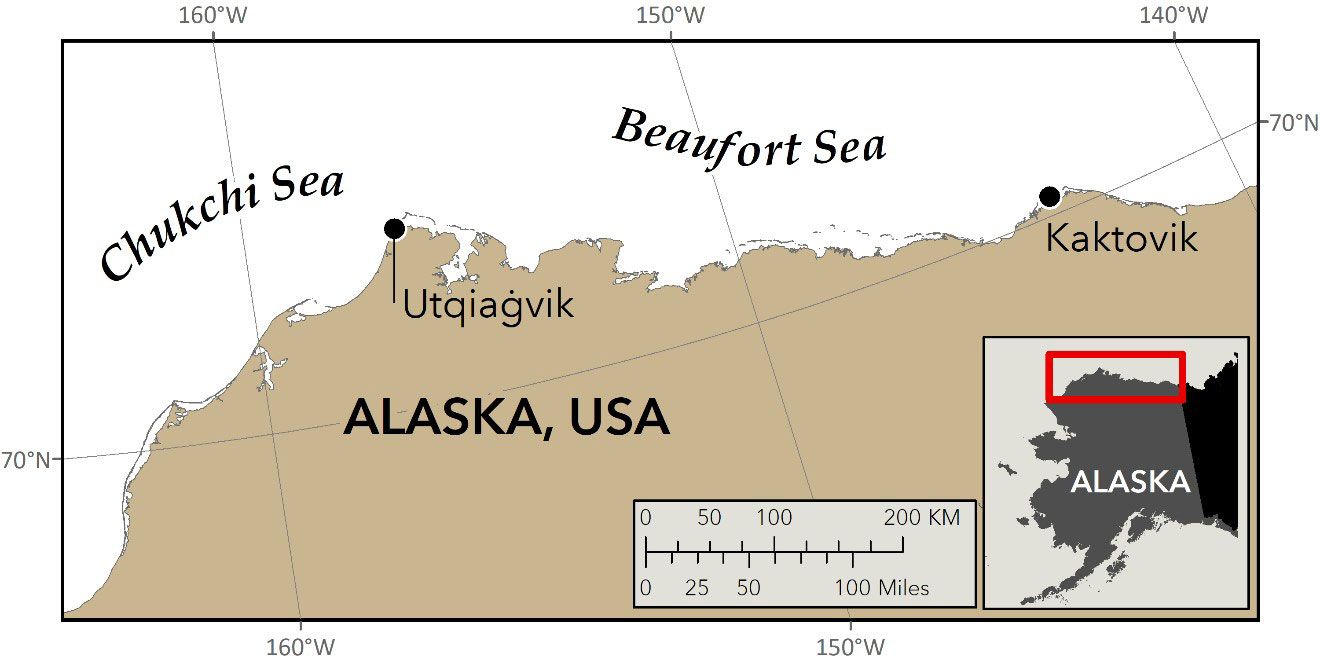
Figure 1 Locations of the two villages on Alaska’s North Slope where snow from polar bear paw-prints was collected in 2021 for DNA analysis (J. Crawford, ADFG).
Polar bear conservation and management efforts in the US have been informed by research related to their abundance and spatial ecology (Durner et al., 2009; Wilson et al., 2014; Regehr et al., 2018), which is reliant upon data from live-captured individuals. While live-capture studies provide a wealth of biological information (Rode et al., 2020), two factors have converged to negatively influence the viability of this approach for polar bear research. First, decreased sea ice cover (Stern and Laidre, 2016) has resulted in a less reliable and less stable platform over which to safely operate and land aircraft to handle captured bears. Such conditions can increase risks to bears and researchers (Ware, 2021), and lead to higher costs per capture (Woolston, 2021). Furthermore, having to cancel planned captures due to unanticipated decreases in sea ice cover with no viable alternatives has resulted in large and growing data gaps. Second, Indigenous groups and conservation organizations have expressed concerns over animal welfare issues, including the capture of bears, use of capture drugs, and the unreliability of satellite-collar release mechanisms (see Alaska Eskimo Whaling Commission (AEWC) Resolution 2019-03). Thus, there is a need to develop new approaches that complement existing methodologies, are non-invasive, can be implemented when other methods are limited, and are safe for polar bears and people.
One option that is a much less invasive approach to monitoring wildlife populations is to sample DNA from individuals and use it to identify them — the equivalent of “marking” them — so that genetic mark-recapture models can be used to estimate abundance (Lukacs and Burnham, 2005). Though genetic sampling methods, such as skin biopsy darting from helicopters, have been effective for polar bears (Jung et al., 2021), they also have logistical, economic, and safety considerations, are still reliant upon a stable sea ice platform, and require a helicopter to closely and rapidly approach bears; which is invasive and disturbing. Further, “no-fly zones” around subsistence communities on Alaska’s coasts have been established as part of conflict avoidance agreements to reduce noise disturbance in hunting areas. Such restrictions often exclude helicopters from accessing areas where animals — including polar bears — congregate (B. Adams, Pers. Comm.). Ground-based hair sampling (Herreman and Peacock, 2013) can partially offset lost aerial biopsy darting opportunities in productive zones near subsistence communities. However, hair sampling relies upon attracting polar bears to sampling sites, such as bone piles from subsistence harvested bowheads (Herreman and Peacock, 2013). Portable hair sampling stations have been used with some success, though operating and maintaining the stations is labor intensive, often does not yield enough hair to determine individual genotypes, and is difficult to sample opportunistically and to deploy across large areas (Quakenbush, 2019).
Methods for collecting and extracting environmental DNA (i.e., DNA that is shed into the environment; hereafter e-DNA), provide an option for genetic sampling that is non-invasive and poses no risk to the animal (Tréguier et al., 2014). Initial applications of e-DNA collection methods focused on detecting species from among mixed samples in aquatic systems (Skinner et al., 2020). The presence of aquatic mammals has also been identified (Padgett-Stewart et al., 2016; Székely et al., 2022). DNA has also been detected in paw-prints in snow (Dalén et al., 2007; Bellemain, 2017 unpublished report; Franklin et al., 2019; Hellström et al., 2019 unpublished report; Barber-Meyer et al., 2020; Barber-Meyer et al., 2022) and used to determine species presence. However, we are unaware of any published study that has gone beyond identifying species to identifying individuals and their sex. Given the availability of numerous polar bear trails (i.e., sets of paw-prints) on the shorefast ice and on land near coastal Arctic communities, there are many opportunities for genetic sampling at less expense and risk than other established methods (Evans et al., 2017). If individual identity and sex can be ascertained from these samples, then this method could offer wildlife managers an additional tool for collecting data to monitor polar bear populations that complements other existing methods and research programs, while also addressing many current challenges to Arctic research.
Until recently, the sampling and analysis of e-DNA obtained from snow has been based on mitochondrial DNA (mt-DNA) because it exists as hundreds to thousands of copies present within the many mitochondria in the cytoplasm of each eukaryotic cell sampled. Though valuable for identifying DNA to species (Dalén et al., 2007; Franklin et al., 2019; Kinoshita et al., 2019), mt-DNA cannot identify individuals or their sex. In contrast, nuclear DNA (n-DNA), if collected in sufficient concentrations, would allow for identification of individuals and their sex. Though conceptually simple, several factors complicate the efficient sampling and extraction of n-DNA from snow. Less genetic material is available within each sample because n-DNA exists as only two copies within the nucleus of a eukaryotic cell. The quantity of epidermal cells shed into the snow in a paw-print is likely a function of several factors relating to the physical characteristics of the snow and its ability to abrade cells from the foot pads on the bottom of the bear’s paw. Further, the effects of environmental factors, such as solar radiation, on the quality of e-DNA extracted from snow are poorly understood, but may have important effects on success.
Initial samples collected from wild polar bear trails by a team that included the North Slope Borough Department of Wildlife Management, World Wildlife Fund, SpyGen, and the US Fish and Wildlife Service did not contain sufficient concentrations of e-DNA to warrant n-DNA genotyping (Bellemain, 2017 unpublished report). An exception was one sample from a set of “artificial” paw-prints in snow, which were created using a paw from a legally harvested polar bear that was donated by an Alaska Native subsistence hunter. The e-DNA analyzed in this sample resulted in a consensus genotype based on 13 microsatellite loci, and, when compared to an associated hair sample, matched in genotype (Bellemain, 2017 unpublished report). Although the physical characteristics of the snow were more granular and abrasive than with the other samples, it is conceivable that more cells may have been sloughing from the dead bear’s paw in comparison to living polar bears. Nevertheless, the “artificial” paw-prints demonstrated, in concept, that polar bear DNA can be extracted from snow and genotyped. Numerous refinements to the field sampling and sample processing protocols were still needed to make this method more reliable.
Subsequent work with captive Eurasian lynx (Lynx lynx) documented the amplification of n-DNA from paw-prints—though this project did not pursue further analyses to generate individual genotypes, sex identification, or evaluate genotyping errors (Hellström et al., 2019 unpublished report). Concurrent work with wild polar bears in Alaska led to an assessment of several factors hypothesized to have an important influence upon DNA yield. This assessment suggested that paw-print quantity and quality were potentially important factors that influenced e-DNA concentration for use in determining individual genotype and sex (Von Duyke et al., 2019 unpublished report). Similar to the lynx work, no further analyses were pursued. A pilot study on wild wolf paw-prints in snow attempted individual identification using e-DNA but was unsuccessful (Barber-Meyer et al., 2020; Barber-Meyer et al., 2022).
Inspired by and building upon these findings, the objective of this investigation was to determine whether e-DNA, sampled from the snow in wild polar bear paw-prints along Alaska’s northern coast (Figure 1) could be used to identify individuals and their sex. If successful, and as greater numbers of individuals are genetically identified, these data, collected using a non-invasive method that is safe for polar bears and people, could be integrated with other data sources to address questions relating to population biology, spatial ecology, and other investigations relevant to the conservation and management of polar bears.
Materials and methods
Our field crew consisted of experienced wildlife-biologists and technicians who were trained in the sampling protocol to ensure consistent sample quality. A number of our team members reside in polar bear habitat, and we were also fortunate that several of our team members are Iñupiat hunters with a lifetime of experience around polar bears. As such, during our field activities, we were able to draw from both science and Indigenous Knowledge (IK) regarding polar bear movements and habitat-use within the sampling areas to maximize our chances of encountering active polar bear trails (B. Sarren, pers. comm.; Wong et al., 2011; Joint Secretariat, 2015).
All field work was conducted from snowmobiles, and snow was sampled opportunistically from polar bear trails encountered on land and shorefast sea ice near two coastal villages on the North Slope of Alaska (Figure 1). Upon locating a polar bear trail, the quality of the paw-prints was evaluated, again on the basis of IK, with “fresh” paw-prints – i.e., those with sharply delineated edges and showing little weathering (Figure 2A) – selected for sampling. Further assessments were made to ensure that the trail was from a single individual and that other bears (e.g., cubs) had not crossed over or walked upon the trail (Von Duyke et al., 2019 unpublished report).
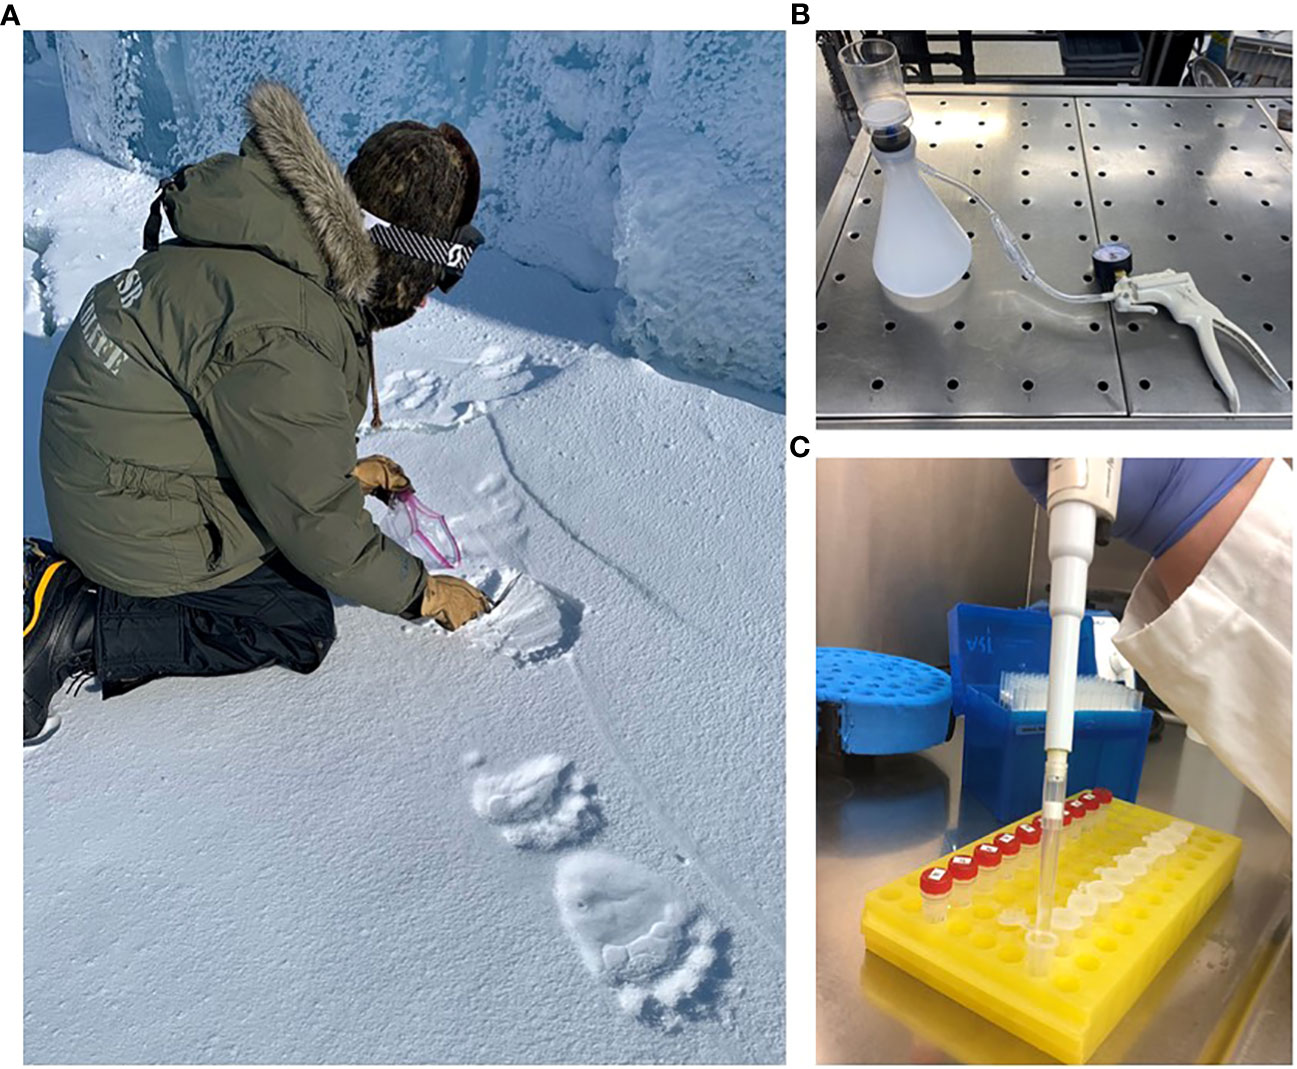
Figure 2 (A) Using a sterilized steel masonry trowel, snow is carefully scraped from the upper surfaces of wild polar bear paw-prints and deposited into plastic bags for eventual e-DNA analysis. Note the sharply delineated details in these prints, suggesting that they are relatively “fresh” and are likely to be high-quality candidates for sampling. (B) After allowing the snow samples to melt at room temperature, they are vacuum filtered to capture DNA contained within the epidermal cells shed from the polar bear’s foot pads. (C) Polar bear DNA presence in the filtrate is determined using mitochondrial DNA PCR amplification. Samples are screened for nuclear n-DNA via 2 PCR amplifications of a set of 7 microsatellite loci and sex locus. Those samples that amplified at ≥ 40% of the loci are further assessed by amplifying up to a total of 6 times in order to determine individual identity and sex.
Prior to sampling, all tools and containers were cleaned with a 25% bleach:water solution and rinsed in de-ionized water between sampling events to avoid genetic cross-contamination. Snow samples were collected using a modified steel masonry trowel, which was used to shave the uppermost 1-2 cm of snow from the surface of the paw-prints (Figure 2A). Individual samples consisted of the snow collected from a total of 10 polar bear paw-prints along a single trail. All snow samples were stored frozen at -20°C in plastic bags until they could be transported to the lab for processing and analysis.
Altogether, samples were collected from 13 separate polar bear trails. For simplicity, sample types are referred to as full, split, and control samples, where full samples (n = 2) consisted of snow from ten paw-prints combined into a single container, split samples (n = 11) consisted of two sub-samples, each with the snow from five paw-prints stored in two separate containers (see Table 1). Control samples (n = 2) consisted of an equivalent volume of snow as the other samples, and were collected using methods identical to those already described, except that the control samples came from a location with no evidence of polar bear presence. We used two field negative controls to establish that our sampling methods and sterilization of field sampling implements was sufficient to not cross contaminate samples. In addition, we used DNA extraction negatives and PCR negatives to establish that our laboratory methods did not result in the contamination of reagents. Finally, there should only ever be one or two alleles observed per individual at each microsatellite locus, which serves as another method for detecting contamination or mixed samples. For example, we detected one sample with more than two alleles at a locus, thereby indicating the presence of DNA from more than one bear; whereas only one or two alleles were confirmed at each locus for all of the other individuals, thus indicating the presence of one bear per sample (see Table 2). Throughout, the presence of negative controls was not disclosed to those responsible for sample processing and genetic analysis until after the results had been determined. Altogether, these control steps served as necessary checks to establish that contamination was not an issue in this study.
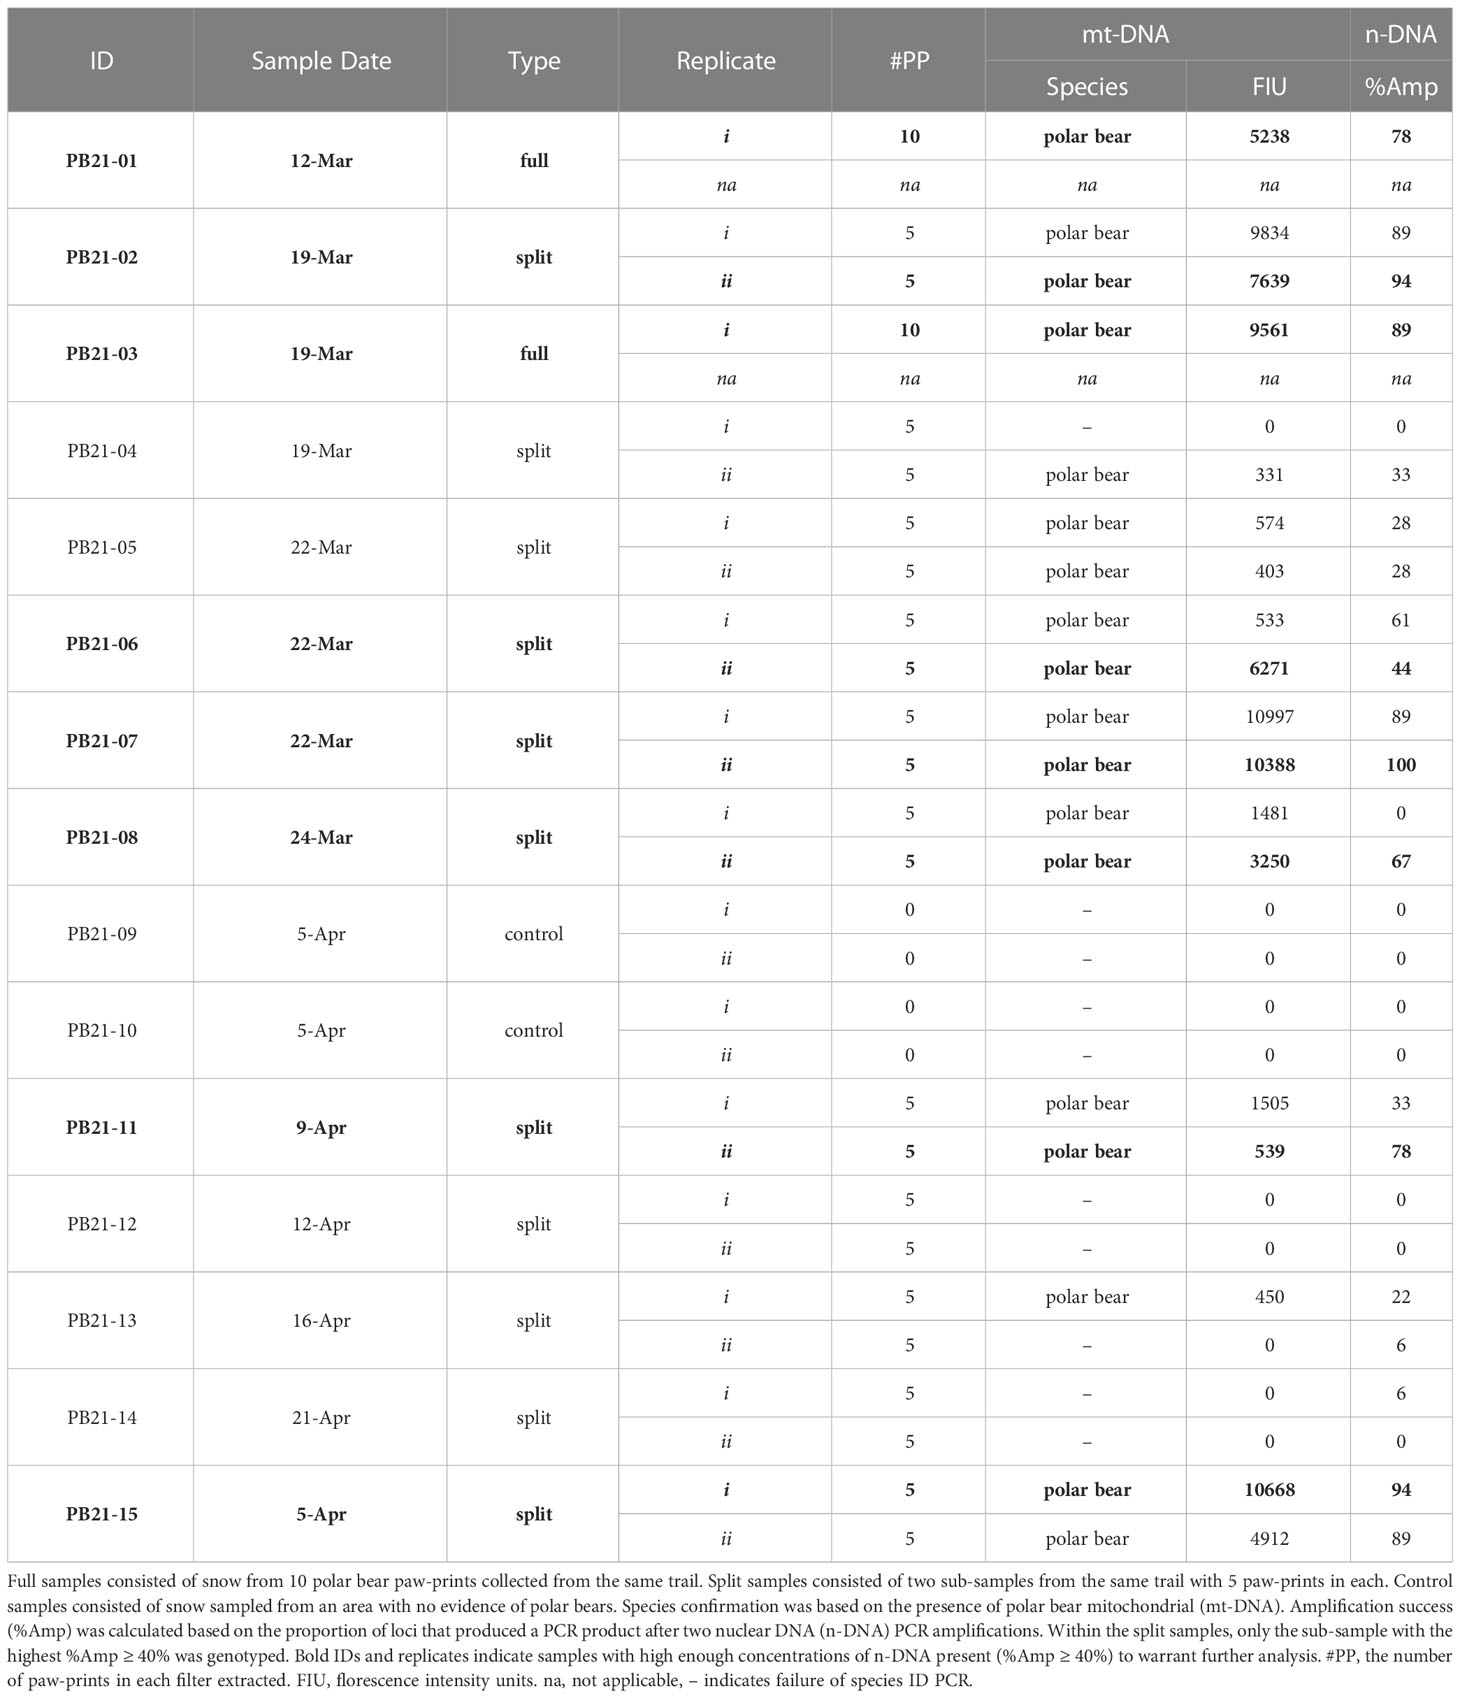
Table 1 Polar bear paw-print samples collected in 2021 and analyzed for species confirmation and n-DNA amplification success.
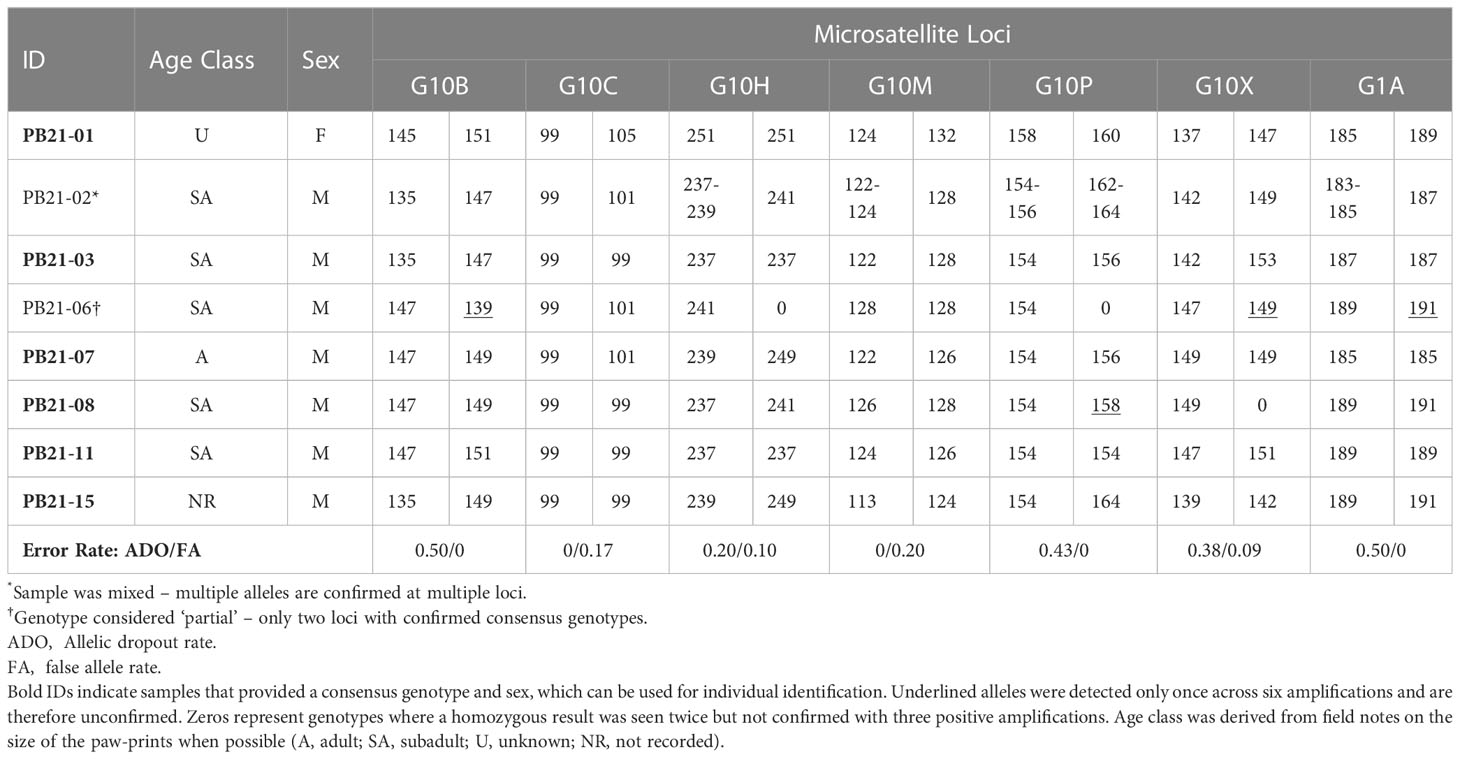
Table 2 Genotypes and sex identification based on 6 PCR amplifications of seven microsatellite loci and a sex marker.
Prior to sample processing, all work surfaces and tools were prepped by cleaning with a 10% bleach:water solution and rinsed with de-ionized water. Sample processing started by allowing a snow sample to thaw completely at room temperature (25°C). Next, the water from this sample was filtered through a vacuum filtration apparatus (Figure 2B) to collect skin cells shed from the polar bear’s foot pads. Vacuum pressure was kept ≤ 41 kPa (6 psi) to avoid damaging the filter membrane. We used a filter funnel (Sterlitech AF045W50 filters, Auburn, WA, USA) with a pore size of 0.45 µm. The inside surfaces of the plastic storage containers/bags and vacuum funnel were rinsed with de-ionized water into the vacuum filter to ensure that all remaining genetic materials were filtered. Filters were stored in a vial containing 95% molecular grade ethyl alcohol (EtOH) to preserve any genetic materials in the filtrate. All equipment and surfaces were cleaned between samples, or in the case of split samples, between each sub-sample. Full samples (see Table 1; PB21-01 and PB21-03) resulted in a single filter stored in a single vial. Split samples resulted in two filters, each stored in separate vials (i.e., each vial containing one of the two sub-samples). All vials with filters in EtOH were stored frozen at -20°C until DNA extraction — an interval of about seven months.
All genetic extractions (Figure 2C) were performed in a laboratory space specifically dedicated to the extraction of low quantity DNA samples. This particular lab space had never been used to process high quality DNA samples (i.e., from blood or tissue) or PCR products of any wildlife species. All DNA extractions were done using a Qiagen DNeasy Blood and Tissue Kit, which included an additional step that used a Qiagen Qiashredder and increased extraction buffer volumes to accommodate an increase in starting material (Goldberg et al., 2011). A negative extraction control was included in each extraction, and the DNA was eluted in 100 µL of AE buffer.
DNA was extracted from whole filters. No subsampling was done because our aim was to maximize the potential amount of DNA in each extraction and because we were only looking for polar bear DNA. However, species verification based on mt-DNA was conducted to confirm the presence of polar bear epidermal cells within a sample. This was determined by using a polymerase chain reaction (PCR) fragment analysis mitochondrial DNA test that distinguishes among most North American carnivores (Davidson et al., 2014; De Barba et al., 2014). A negative and positive control were included in each PCR to test for positive amplification and to monitor for possible contamination of reagents. PCR products were separated by size and visualized using a 3130xl DNA Sequencer (Applied Biosystems) and allele sizes were scored using Genemapper 5.0 (Applied Biosystems). Successful detection of polar bear mt-DNA required that a peak be observed in the lower polar bear bin at 145 base pairs and that it be ≥ 100 fluorescent intensity units (FIU; De Barba et al., 2014).
Upon verification that polar bear epidermal cells were present within a sample, we amplified a multiplex of seven n-DNA microsatellite loci (Taberlet et al., 1997; Paetkau et al., 1998; Paetkau et al., 1999; De Barba and Waits, 2010) and the amelogenin gene sex ID marker (Ennis and Gallagher, 1994) using the Qiagen Multiplex PCR Kit. The multiplexed reaction contained the following: 0.04 μM of G10B, G10C and SEY; 0.07 μM of G10X; 0.13 μM of G10P; 0.16 μM of G10M; 0.21 μM of G1A and G10H; 1X Qiagen Multiplex Kit Master Mix; 0.5X Q solution; and 2 μL of DNA extract in a 7 μL reaction volume. The thermal profile consisted of the following sequence of steps: initial denaturation at 94 °C for 15 minutes, 14 cycles at 94 °C for 30 seconds, 57 °C touchdown to 50 °C for 1.5 minutes, 72 °C for 1 minute, 30 cycles at 94 °C for 30 seconds, 50 °C for 1.5 minutes, 72 °C for 1 minute, followed by a final elongation at 60 °C for 30 minutes. PCR product was run on an Applied Biosystems 3130xl Genetic Analyzer and allele sizes were scored using GeneMapper v5 software.
For each sample or sub-sample, the percentage of amplification success was used to assess whether n-DNA was present at high enough concentrations to warrant further analyses. This assessment occurred after the first two PCR amplifications (%Amp, see Table 1), which was quantified as the sum of different loci that were successfully amplified divided by twice the total number of possible amplifications for all loci (2n = 16). Samples with ≥ 40% amplification of n-DNA were genotyped to obtain consensus genotypes by conducting 4 additional n-DNA PCRs per sample.
Genotyping required six PCR amplifications to obtain a consensus genotype at each locus. Consensus heterozygous results were accepted for each allele that was observed two or more times across the PCR amplifications; whereas consensus homozygous results were accepted for alleles observed across three positive PCR amplifications. For sex identification, we required observation of the Y chromosome PCR fragment in a minimum of 2 PCR amplifications to identify males and the X chromosome PCR product in a minimum of 3 PCR amplifications to identify females. Genotyping error rates, allelic dropout (ADO), and false alleles (FA), were calculated from the first two PCR amplifications of each sample with a completed individual ID by comparing the consensus genotype (Table 2). The ADO rate was calculated from heterozygous results only as the number of ADOs observed, divided by the total number of amplifications at which ADOs could be observed. The FA rate was calculated as the number of FAs observed, divided by the total number of positive amplifications at each locus (Broquet and Petit, 2004). To determine the number of individuals sampled, consensus genotypes were matched using GENALEX (Peakall and Smouse, 2006, Peakall and Smouse, 2012).
Results
In total, 15 snow samples were collected for genetic analysis. Screening for polar bear mt-DNA indicated that the two negative control samples (PB21-09 and PB21-10) contained no polar bear DNA (Table 1). Of the remaining 13 samples, 11 were positive for polar bear mt-DNA. Both full samples, each with 10 polar bear prints, were successfully genotyped to individual and sex. The nine split samples, consisting of two sub-samples of five polar bear prints each, had variable genotyping success. Specifically, seven were positive in both sub-samples and two were positive in only one of the two sub-samples. The average peak height for full samples was 7400 FIU (range: 5238 – 9561), and the average for split samples was 4595 FIU (range: 331 – 10997) (Table 1).
The n-DNA amplification success (%Amp) of those samples that tested positive for polar bear mt-DNA (n = 11) was assessed and, after two PCR amplifications, eight samples had %Amp ≥ 40% and were therefore considered to be sufficiently concentrated to warrant genotyping. The eight samples that reached this threshold consisted of the two full samples and six split samples (Table 1). For the split samples, there were instances where both sub-samples had %Amp ≥ 40% (Table 1). When this occurred, only the sub-sample with the highest %Amp was genotyped. One of the two sub-samples for PB21-06 failed the screening for mt-DNA (Table 1), but the second passed and had %Amp ≥ 40%, and was therefore genotyped.
Six of the eight candidate samples yielded consensus genotypes and sex (Table 2). Of the six genotypes generated, one was a female and five were unique males — i.e., no bears were re-sampled. One of the two samples that could not be confirmed (PB21-02; Table 2) was considered to be “mixed”, because it consistently amplified three and four alleles at four loci, which could indicate the presence of DNA from more than one bear. The other unconfirmed sample (PB21-06; Table 2) was considered to be “partial” because only two loci were confirmed as consensus genotypes. Allelic dropout rates per locus ranged from 0 – 0.50 and false allele error rates were lower ranging from 0 – 0.20 per locus (Table 2). The average multi-locus error rates were 0.29 (29%) for allelic dropout and 0.08 (8%) for false alleles.
Discussion
Our objective was to determine whether individual identity and sex could be identified in free-ranging wild polar bears using e-DNA collected from their paw-prints in the snow. To our knowledge, the results of this study are the first to demonstrate that this is possible and can be achieved for a reasonably high percentage of samples (~50%).
Most of the polar bear trails sampled yielded DNA with sufficient concentrations to amplify some n-DNA loci, but individual identity and sex were determined in roughly half of the samples. Our amplification success and genotyping error rates are comparable to other bear studies that have analyzed low quality sample types; e.g., hair, feces, or saliva from carcasses (Murphy et al., 2007; Wheat et al., 2016; Ruprecht et al., 2021). Meanwhile, the absence of polar bear DNA from the field negative control samples and limited evidence of mixed samples suggested that the sampling and storage protocols we employed were sufficient for avoiding genetic cross-contamination.
Most e-DNA surveys only identify species based on mt-DNA, which makes contamination much more likely, and has therefore led to the extensive collection of field negatives as part of the sampling protocol. In our study, we are identifying individuals of only one species based on n-DNA, and any sporadic contamination that may result in a complete individual ID genotype is much less likely because much more DNA is required for a positive result. More commonly referred to as “non-invasive genetic sampling”, our approach is similar to those in which researchers generate individual ID and sex from n-DNA in samples of saliva, hair, feces, urine, feathers, or (in our case) epidermal cells left behind in focused, observable locations in the environment (e.g., paw-prints in the snow). While field negatives are not a standard part of these field collection protocols, we chose to implement them in our study because our methods are a hybrid of e-DNA studies and more traditional non-invasive genetic sampling studies. Regardless, control samples collected in the field are an important way to monitor the integrity of our field sampling design, and so we will continue to collect them during sampling sessions (Goldberg et al., 2016).
Our overall sample size was too small to draw firm conclusions about factors that may be important to sample quality and amplification success. Still, the large number of trails available for sampling by snowmobile during a field season and the low cost per sample (relative to collecting samples by helicopter) mean that this method has strong potential for identifying enough individuals and their sex to meaningfully contribute to questions regarding polar bear population biology. Given the remote study location, there are logistical challenges associated with collecting, storing, processing, and shipping samples. As such, there is value in continuing to refine protocols to maximize the DNA amplification success.
If sampled in sufficient numbers, this method has the potential to greatly inform polar bear conservation and management. For example, e-DNA results can be incorporated into genetic mark-recapture abundance estimates (Lebreton and Pradel, 2002; McKelvey and Schwartz, 2004; Citta et al., 2018) using multiple sources to obtain an individual genotype (i.e., biopsy dart, hair, feces, paw-prints) thereby increasing sample-size. Repeated identification and location of individual polar bears over time would allow them to be assigned to a subpopulation (Chukchi or Southern Beaufort Sea in Alaska), which has only been possible for collared females in the past. Other important information includes movement patterns, habitat-use, site-fidelity, age class (determined by track size at sampling), survival, population structure, and female reproductive history. Combining e-DNA data with data from biopsied, captured, and subsistence harvested bears will lead to a longer time-series of movements and reproductive success. For example, long-term collection of biological information with e-DNA could assess reproductive success by re-sampling and identifying adult females in subsequent years and using the information of whether and how many cubs were present. Integrated population modeling methods (Regehr et al., 2018) can also be expanded to include e-DNA and information from other studies and methods (e.g., physical capture, subsistence harvest); with results that would be applicable to a variety of management questions including: sustainable harvest, habitat protection, and mitigation of potential disturbance from oil and gas exploration and development.
This method also addresses the challenge of monitoring bears that are traditionally difficult to study. Adult males are not radio-collared because the diameter of their neck is larger than their head, making it easy for the collar to be lost (Amstrup et al., 2001). Subadults and cubs also are not radio-collared due to their rapid growth and the risk of injury should a collar release mechanism fail. While alternatives to radio-collars exist (e.g., glue-on transmitters, ear tags), their reliability and longevity are not yet optimal. Thus, much of the current understanding of polar bear spatial ecology is based on radio-collared females (Amstrup et al., 2001). Though e-DNA methods cannot provide the same detail of movements provided by tracking radio-collars, this method can provide needed information over time safely and relatively inexpensively.
Several Alaska Native organizations — e.g., Alaska Nannut Co-management Council (ANCC), the Inuvialuit-Iñupiat Polar Bear Commission, and the AEWC — have called for the development and implementation of non-invasive polar bear monitoring methods (2021 Draft Strategic Plan; AEWC Resolution 2019-03). The Polar Bear Conservation Management Plan (US Fish and Wildlife, 2016) also includes a recommendation on the use of less invasive research methods for monitoring polar bear population status. Because e-DNA sampling is entirely non-invasive, this effort represents direct progress toward these recommendations.
With the help of community members from villages in polar bear habitat, it would be possible to broaden the spatial scale of polar bear e-DNA sampling. Residents of remote Native communities, which tend to have high unemployment, would benefit from such job opportunities (Goldsmith, 2007); and by hiring local community members, research and management efforts would benefit through the application of local and Indigenous knowledge (Gordon (Iñupiaq) et al., 2023). Such engagement would also facilitate direct and meaningful participation by local Native people in monitoring an important subsistence species; and conservation efforts could benefit when managers work with communities to collect needed wildlife management data. By working directly with co-management partners (e.g., ANCC) and local communities to monitor polar bears, more effective approaches and improved trust among stakeholders are possible. Evidence for this includes the successes of management proposals that use data collected by hunters and community members, because there is a better understanding of how and what data are being collected, along with how it is being used (Stern and Humphries, 2022).
This study analyzed microsatellite loci to identify individuals by genotype. However, other genetic analyses can also be applied using DNA collected from snow, such as microsatellite genotyping via high throughput sequencing (HTS, De Barba et al., 2016; Pimentel et al., 2018) and GT-seq (Campbell et al., 2015), which uses single nucleotide polymorphisms (SNPs) identified for polar bears (Malenfant et al., 2015; Viengkone et al., 2016; Hayward et al., 2020; Jensen et al., 2020). Genotypes from these methods, unlike those from traditional microsatellite loci genotyping, are directly comparable between labs without calibration, thereby facilitating data analysis across populations that can be more cost-effective and faster when analyzing large numbers of samples.
At a time when well established polar bear research methods have proven to be less viable due to deteriorating sea ice conditions, the need to develop complementary research methods has become more pressing. And while the collection and analysis of e-DNA is unlikely to completely replace the use of live-capture methods for polar bear research, it can augment sample sizes for certain investigations, and be particularly useful for application during times and in locations not available to aircraft-based methods due to poor sea ice conditions or subsistence hunting restrictions. Our results hold promise for noninvasive mark-recapture studies on polar bears and other species that occupy snow-covered habitats (Franklin et al., 2019). We recognize that this method will become more valuable as sea ice further declines, and may be a valuable tool for engaging with the numerous Inuit communities that are affected by polar bear management decisions. As such, we see this method as a major advance in polar bear conservation and management.
Data availability statement
The original contributions presented in the study are included in the article/supplementary material. Further inquiries can be directed to the corresponding author.
Author contributions
AV, JC, and LQ contributed to the conception and design of the study. AV and JC organized the field database. JA and LW performed the genetic analyses and interpretation. JA organized the genetic database. AV wrote the first draft of the manuscript. JC, LQ, JA, and LW wrote sections of the manuscript. All authors contributed to manuscript revision, and read and approved the submitted version.
Funding
Funding for this project was provided by National Petroleum Reserve – Alaska Grant (# 22-NPRA-05), The Animal Welfare Institute – Christine Stephens Wildlife Award, two Alaska Department of Fish and Game – Endangered Species Grants (# F21AP02216-00 and F22AP01305-00), and the North Slope Borough – Shell Baseline Studies Program.
Acknowledgments
This work would not have been possible without the cooperation and assistance of the residents and hunters of the North Slope of Alaska, who generously shared their Indigenous Knowledge. We would like to acknowledge Micaela Hellström for her contribution to collection protocols and molecular analyses of initial samples that showed proof of concept, and the contributions of Elisabeth Kruger, Melanie Lancaster and Micaela Hellström toward co-conceptualization of the project. We would also like to acknowledge several key staff at the North Slope Borough Department of Wildlife Management who were instrumental in developing the collection protocols used in this study. Snow samples were collected by: Peter Detwiler, Bobby Sarren, Billy Adams, Carla SimsKayotuk, Lee Kayotuk, Thomas Tazruk, Rose Panik, and Justin Olnes. Alex Sletten assisted with sample filtering. We acknowledge Caren Goldberg for helpful insights into e-DNA sample collection and laboratory methodology, and Victoria Vinecke and David Navarro for completing the lab work. We are grateful to the reviewers whose input improved this manuscript. Finally, we are grateful for the support of the Barrow and Kaktovik whaling captains. All work was conducted under USFWS permit # MA80164B-0.
Conflict of interest
The authors declare that this research was conducted in the absence of any commercial or financial relationships that could be construed as a potential conflict of interest.
Publisher’s note
All claims expressed in this article are solely those of the authors and do not necessarily represent those of their affiliated organizations, or those of the publisher, the editors and the reviewers. Any product that may be evaluated in this article, or claim that may be made by its manufacturer, is not guaranteed or endorsed by the publisher.
References
Amstrup S. C., Durner G. M., McDonald T. L., Mulcahy D. M., Garner G. W. (2001). Comparing movement patterns of satellite-tagged male and female polar bears. Can. J. Zool. 79 (12), 2147–2158. doi: 10.1139/z01-174
Barber-Meyer S. M., Dysthe J. C., Pilgrim K. L. (2020). Testing environmental DNA from wolf snow tracks for species, sex, and individual identification. Can. Wildlife Biol. Manage. 9 (1), 12–20.
Barber-Meyer S. M., Zeller V., Pilgrim K. L. (2022). Testing environmental DNA from wolf snow track for species, sex, and individual identification – An addendum. Can. Wildlife Biol. Manage. 11 (1), 14–16.
Broquet T., Petit E. (2004). Quantifying genotyping errors in noninvasive population genetics. Mol. Ecol. 13, 3601–3608. doi: 10.1111/j.1365-294X.2004.02352.x
Campbell N. R., Harmon S. A., Narum S. R. (2015). Genotyping-in-thousands by sequencing (GT-seq): a cost effective SNP genotyping method based on custom amplicon sequencing. Mol. Ecol. Resour. 15 (4), 855–867. doi: 10.1111/1755-0998.12357
Citta J. J., O’Corry-Crowe G., Quakenbush L. T., Bryan A. L., Ferrer T., Olson M. J., et al. (2018). Assessing the abundance of Bristol Bay belugas with genetic mark-recapture methods. Mar. Mamm. Sci. 34 (3), 666–686. doi: 10.1111/mms.1247
Dalén L., Götherström A., Meijer T., Shapiro B. (2007). Recovery of DNA from paw-prints in the snow. Can. Field-Nat. 121 (3), 321–324. doi: 10.22621/cfn.v121i3.482
Davidson G. A., Clark D. A., Johnson B. K., Waits L. P., Adams J. R. (2014). Estimating cougar densities in northeast Oregon using conservation detection dogs. J. Wildl. Manage. 78 (6), 1104–1114. doi: 10.1002/jwmg.758
De Barba M., Adams J. R., Goldberg C. S., Stansbury C. R., Arias D., Cisneros R., et al. (2014). Molecular species identification for multiple carnivores. Conserv. Genet. Resour. 6 (4), 821–824. doi: 10.1007/s12686-014-0257-x
De Barba M., Miquel C., Lobréaux S., Quenette P. Y., Swensen J. E., Taberlet P. (2016). High-throughput microsatellite genotyping in ecology: improved accuracy, efficiency, standardization and success with low-quantity and degraded DNA. Mol. Ecol. Resour. 17 (3), 492–507. doi: 10.1111/1755-0998.12594
De Barba M., Waits L. P. (2010). Multiplex pre-amplification for noninvasive genetic sampling: is the extra effort worth it? Mol. Ecol. Resour. 10 (4), 659–665. doi: 10.1111/j.1755-0998.2009.02818.x
Durner G. M., Douglas D. C., Nielson R. M., Amstrup S. C., McDonald T. L., Stirling I., et al. (2009). Predicting 21st-century polar bear habitat distribution from global climate models. Ecol. Monogr. 79 (1), 25–58. doi: 10.1890/07-2089.1
Ennis S., Gallagher T. F. (1994). A PCR-based sex-determination assay in cattle based on the bovine amelogenin locus. Anim. Genet. 25, 425–427. doi: 10.1111/j.1365-2052.1994.tb00533.x
Evans N. T., Shirey P. D., Wieringa J. G., Mahon A. R., Lamberti G. A. (2017). Comparative cost and effort of fish distribution detection via environmental DNA analysis and electrofishing. Fisheries 42, 90–99. doi: 10.1080/03632415.2017.1276329
Franklin T. W., McKelvey K. S., Golding J. D., Mason D. H., Dysthe J. C., Pilgrim K. L., et al. (2019). Using environmental DNA methods to improve winter surveys for rare carnivores: DNA from snow and improved noninvasive techniques. Biol. Conserv. 229, 50–58. doi: 10.1016/j.biocon.2018.11.006
Goldberg C. S., Pilliod D. S., Arkle R. S., Waits L. P. (2011). Molecular detection of vertebrates in stream water: A demonstration using rocky mountain tailed frogs and Idaho giant salamanders. PloS One 6 (7), e22746. doi: 10.1371/journal.pone.0022746
Goldberg C. S., Turner C. R., Deiner K., Klymus K. E., Thomsen P. F., Murphy M. A., et al. (2016). Critical considerations for the application of environmental DNA methods to detect aquatic species. Methods Ecol. Evol. 7 (11), 1299–1307. doi: 10.1111/2041-210X.12595
Goldsmith S. (2007). The remote rural economy of Alaska (Anchorage: Institute of Social and Economic Research. University of Alaska), p 55. Available at: https://iseralaska.org/static/legacy_publication_links/u_ak/uak_remoteruraleconomyak.pdf.
Gordon (Iñupiaq) H. S. J., Ross J. A., Bauer-Armstrong C., Moreno M., Byington (Choctaw) R., Bowman (Lunaape/Mohican) N. (2023). Integrating Indigenous Traditional Ecological Knowledge of land into land management through Indigenous-academic partnerships. Land Use Policy 125, 106469. doi: 10.1016/j.landusepol.2022.106469
Hayward K. M., Harwood M. P., Lougheed S. C., Sun Z., Van Coeverden De Groot P., Jensen E. L. (2020). A real-time PCR assay to accurately quantify polar bear DNA in fecal extracts. PeerJ 2020, 1–11. doi: 10.7717/peerj.8884
Herreman J., Peacock E. (2013). Polar bear use of a persistent food subsidy: Insights from non-invasive genetic sampling in Alaska. Ursus 24 (2), 148–163. doi: 10.2192/URSUS-D-12-00030.1
Jensen E. L., Tschritter C., de Groot P. V. C., Hayward K. M., Branigan M., Dyck M., et al. (2020). Canadian polar bear population structure using genome-wide markers. Ecol. Evol. 10, 3706–3714. doi: 10.1002/ece3.6159
Joint Secretariat (2015). Inuvialuit and Nanuq: A Polar Bear Traditional Knowledge Study (Inuvik, NWT, Canada: Joint Secretariat, Inuvialuit Settlement Region), 304 p. Available at: https://wmacns.ca/resources/inuvialuit-and-nanuq-polar-bear-traditional-knowledge-study/.
Jung T. S., Suitor M. J., Baryluk S. (2021). Performance of helicopter-based biopsy darting of polar bears (Ursus maritimus) on the spring sea ice. Eur. J. Wildl. Res. 67 (6), 106. doi: 10.1007/s10344-021-01550-x
Kinoshita G., Yonezawa S., Murakami S., Isagi Y. (2019). Environmental DNA collected from snow tracks is useful for identification of mamMalian species. Zool. Sci. 36 (3), 198–207. doi: 10.2108/zs180172
Lebreton J. D., Pradel R. (2002). Multistate recapture models: Modelling incomplete individual histories. J. Appl. Stat. 29, 353–369. doi: 10.1080/02664760120108638
Lukacs P. M., Burnham K. P. (2005). Review of capture–recapture methods applicable to noninvasive genetic sampling. Mol. Ecol. 14, 3909–3919. doi: 10.1111/j.1365-294X.2005.02717.x
Malenfant R. M., Coltman D. W., Davis C. S. (2015). Design of a 9K illumina BeadChip for polar bears (Ursus maritimus) from RAD and transcriptome sequencing. Mol. Ecol. Resour. 15, 587–600. doi: 10.1111/1755-0998.12327
McKelvey K. S., Schwartz M. K. (2004). Providing reliable and accurate genetic capture-mark-recapture estimates in a cost-effective way. J. Wildl. Manage. 68 (3), 453–456. doi: 10.2193/0022-541X(2004)068[0453:PRAAGC]2.0.CO;2
Murphy M. A., Kendall K. C., Robinson A., Perugini C., Waits L. P. (2007). The impact of time and field conditions on brown bear fecal DNA amplification. Conserv. Genet. 8, 1219–1224. doi: 10.1007/s10592-006-9264-0
Padgett-Stewart T. M., Wilcox T. M., Carim K. J., McKelvey K. S., Young M. K., Schwartz M. K. (2016). An eDNA assay for river otter detection: A tool for surveying a semi-aquatic mammal. Conserv. Genet. Resour. 8, 5–7. doi: 10.1007/s12686-015-0511-x
Paetkau D., Amstrup S. C., Born E. W., Calvert W., Derocher A. E., Garner G. W., et al. (1999). Genetic structure of the world's polar bear populations. Mol. Ecol. 8 (10), 1571–1584. doi: 10.1046/j.1365-294x.1999.00733.x
Paetkau D., Shields G. F., Strobeck C. (1998). Gene Flow between insular, coastal and interior populations of brown bears in Alaska. Mol. Ecol. 7 (10), 1283–1292. doi: 10.1046/j.1365-294x.1998.00440.x
Peakall R., Smouse P. E. (2006). GENALEX 6: genetic analysis in Excel. Population genetic software for teaching and research. Mol. Ecol. Notes 6, 288–295. doi: 10.1111/j.1471-8286.2005.01155.x
Peakall R., Smouse P. E. (2012). GenAlEx 6.5: Genetic analysis in Excel. Population genetic software for teaching and research — an update. Bioinformatics 28, 2537–2539. doi: 10.1093/bioinformatics/bts460
Pimentel J. S. M., Carmo A. O., Rosse I. C., Martins A. P. V., Ludwig S., Facchin S., et al. (2018). High-throughput sequencing strategy for microsatellite genotyping using neotropical fish as a model. Front. Genet. 9. doi: 10.3389/fgene.2018.00073
Quakenbush L. (2019). Genetic mark-recapture of chukchi sea polar bears (final report AKW-ESA E-23-1; endangered species grant, 115 p). Alaska Department of Fish and Game. Available at: https://www.adfg.alaska.gov/static/home/library/pdfs/wildlife/research_pdfs/quakenbush2019_akw_esa_e_23_1chukchipbearfinalrep2019wapp.pdf.
Rantanen M., Karpechko A., Lipponen A., Nordling K., Hyvärinen O., Ruosteenoja K., et al. (2022). The Arctic has warmed nearly four times faster than the globe since 1979. Commun. Earth Environ. 3 (1), 168. doi: 10.1038/s43247-022-00498-3
Regehr E. V., Hostetter N. J., Wilson R. R., Rode K. D., St. Martin M., Converse S. J. (2018). Integrated population modeling provides the first empirical estimates of vital rates and abundance for polar bears in the Chukchi Sea. Sci. Rep. 8, 16780. doi: 10.1038/s41598-018-34824-7
Rode K. D., Atwood T. C., Thiemann G. W., St. Martin M., Wilson R. R., Durner G. M., et al. (2020). Identifying reliable indicators of fitness in polar bears. PloS One 15 (8), e0237444. doi: 10.1371/journal.pone.0237444
Rode K. D., Douglas D. C., Atwood T. C., Durner G. M., Wilson R. R., Pagano A. M. (2022). Observed and forecasted changes in land use by polar bears in the Beaufort and Chukchi Seas 1985–2040. Glob. Ecol. Conserv. 40, e02319. doi: 10.1016/j.gecco.2022.e02319
Ruprecht J. S., Eriksson C. E., Forrester T. D., Clark D. A., Wisdom M. J., Rowland M. M., et al. (2021). Evaluating and integrating spatial capture–recapture models with data of variable individual identifiability. Ecol. Appl. 31 (7), 1–21. doi: 10.1002/eap.2405
Skinner M., Murdoch M., Loeza-Quintana T., Crookes S. (2020). A mesocosm comparison of laboratory-based and on-site eDNA solutions for detection and quantification of striped bass (Morone saxatilis) in marine ecosystems. Environ. DNA 2 (3), 298–308. doi: 10.1002/edn3.61
Stern E. R., Humphries M. M. (2022). Interweaving local, expert, and Indigenous Knowledge into quantitative wildlife analyses: A Systematic Review. Biol. Conserv. 266, 109444. doi: 10.1016/j.biocon.2021.109444
Stern H. L., Laidre K. L. (2016). Sea-ice indicators of polar bear habitat. Cryosphere 10 (5), 2027–2041. doi: 10.5194/tc-10-2027-2016
Székely D., Cammen K. M., Olsen M. T. (2022). Needles in an ocean haystack: Using environmental DNA to study marine mammals in the North Atlantic. NAMMCO Sci. publ. 12, 1–12. doi: 10.7557/3.6482
Taberlet P., Camarra J. J., Griffin S., Uhrès E., Hanotte O., Waits L. P., et al. (1997). Non-invasive genetic tracking of the endangered Pyrenean brown bear population. Mol. Ecol. 6, 869–876. doi: 10.1046/j.1365-294X.1997.00251.x
Tréguier A., Paillisson J. M., Dejean T., Valentini A., Schlaepfer M. A., Roussel J. M. (2014). Environmental DNA surveillance for invertebrate species: Advantages and technical limitations to detect invasive crayfish Procambarus clarkii in freshwater ponds. J. Appl. Ecol. 51, 871–879. doi: 10.1111/1365-2664.12262
US Fish and Wildlife (2016). Polar Bear (Ursus maritimus) Conservation Management Plan, Final (Region 7, Anchorage, Alaska: U.S. Fish and Wildlife), 106 p. Available at: https://polarbearagreement.org/resources/individual-range-state-action-plans/united-states/polar-bear-conservation-management-plan.
US Fish and Wildlife Service (2008). Determination of threatened status for the polar bear (Ursus maritimus) throughout its range; Final rule. Federal Register 73, 28212–28303.
Viengkone M., Derocher A. E., Richardson E. S., Malenfant R. M., Miller J. M., Obbard M. E., et al. (2016). Assessing polar bear (Ursus maritimus) population structure in the Hudson Bay region using SNPs. Ecol. Evol. 6, 8474–8484. doi: 10.1002/ece3.2563
Ware J. (2021). Obituary – markus G. Dyck, (1966–2021). 2021. Arctic 74 (3), 402–404. doi: 10.14430/arctic73677
Wheat R. E., Allen J. M., Miller S. D. L., Wilmers C. C., Levi T. (2016). Environmental DNA from residual saliva for efficient noninvasive genetic monitoring of brown bears (Ursus arctos). PLoS One 11 (11), e0165259. doi: 10.1371/journal.pone.0165259
Wiig Ø., Amstrup S., Atwood T., Laidre K., Lunn N., Obbard M., et al. (2015). Ursus maritimus. The IUCN red list of threatened species 2015. doi: 10.2305/IUCN.UK.2015-4.RLTS.T22823A14871490.en
Wilson R. R., Horne J. S., Rode K. D., Regehr E. V., Durner G. M. (2014). Identifying polar bear resource selection patterns to inform offshore development in a dynamic and changing Arctic. Ecosphere 5 (10), 136. doi: 10.1890/ES14-00193.1
Wong P. B. Y., Van Coeverden de Groot P., Fekken C., Smith H., Pagès M., Boag P. T. (2011). Interpretations of polar bear (Ursus maritimus) tracks by Inuit hunters: Inter-rater reliability and inferences concerning accuracy. Can. Field-Nat. 125 (2), 140–153. doi: 10.22621/cfn.v125i2.1197
Woodruff S. P., Andersen E. M., Wilson R. R., Mangipane L. S., Miller S. B., Klein K. J., et al. (2022). Classifying the effects of human disturbance on denning polar bears. Endanger. Species Res. 49, 43–56. doi: 10.3354/esr01203
Keywords: environmental DNA, population biology, genetic sampling, microsatellites, wildlife management, arctic research, Alaska (USA)
Citation: Von Duyke AL, Crawford JA, Quakenbush L, Adams JR and Waits LP (2023) Determination of polar bear (Ursus maritimus) individual genotype and sex based on DNA extracted from paw-prints in snow. Front. Conserv. Sci. 4:1166279. doi: 10.3389/fcosc.2023.1166279
Received: 15 February 2023; Accepted: 25 July 2023;
Published: 15 August 2023.
Edited by:
William J. McShea, Smithsonian Conservation Biology Institute (SI), United StatesReviewed by:
Micheline Manseau, Environment and Climate Change Canada (ECCC), CanadaJoseph Northrup, Ontario Ministry of Natural Resources and Forestry, Canada
Copyright © 2023 Von Duyke, Crawford, Quakenbush, Adams and Waits. This is an open-access article distributed under the terms of the Creative Commons Attribution License (CC BY). The use, distribution or reproduction in other forums is permitted, provided the original author(s) and the copyright owner(s) are credited and that the original publication in this journal is cited, in accordance with accepted academic practice. No use, distribution or reproduction is permitted which does not comply with these terms.
*Correspondence: Andrew L. Von Duyke, andrew.vonduyke@north-slope.org
†These authors have contributed equally to this work and share first authorship