Long-term trends in elephant mortality and their causes in Kenya
 Joseph M. Mukeka
 Joseph O. Ogutu
 Erustus Kanga
 Hans-Peter Piepho
 Eivin Røskaft
- 1Department of Biology, NTNU Gløshaugen, Trondheim, Norway
- 2Wildlife Resource Centre and Information Management, Wildlife Research and Training Institute, Naivasha, Kenya
- 3University of Hohenheim, Institute of Crop Science, Biostatistics Unit, Stuttgart, Germany
- 4State Department for Wildlife, Ministry of Tourism and Wildlife, Nairobi, Kenya
High mortality poses a serious threat to sustainable conservation of the African elephant (Loxodonta africana). Using detected carcass data collected by the Kenya Wildlife Service (KWS) during 1992-2017, we analyze temporal and spatial variation in elephant mortality in Kenya. We investigate the major mortality causes and means used to kill elephants, carcass category, tusk recovery status, variation in mortality with elephant age and sex classes, differences between inside and outside protected areas (PAs), the Proportion of Illegally Killed Elephants (PIKE) and the overall mortality rate (MR — the number of dead/number of live elephants in a given year). In total 9,182 elephant deaths were recorded during the 26 years. Elephant mortality increased over time and was attributed primarily to natural (33.1%) and human-related causes, particularly ivory poaching (31.5%) and human-elephant conflicts (19.9%). Elephant mortality varied across Kenya’s 47 counties in correspondence with variation in elephant population size and was the highest in the leading elephant range counties of Taita Taveta, Laikipia, Samburu and Meru. Mortality was higher for males and adults and outside the protected areas. Most elephant carcasses had tusks (75.1%) but a few did not (12.5%). Yearly PIKE values peaked in 2012, the year with the highest poaching levels in Kenya during 1992-2017. MR increased throughout 1992-2017. Temporal variation in elephant mortality probability was significantly influenced by human and livestock population densities, average annual maximum temperature and total annual rainfall and the strength of these influences varied across the seven leading elephant range counties of Kenya. Natural processes are increasingly contributing to elephant mortality likely due to climate change and the associated food and water stress, exacerbated by contracting range. Enhancing anti-poaching and strategies for mitigating climate change impacts and human-elephant conflict and reducing range contraction while sustaining habitat connectivity can help reduce mortality and promote elephant conservation. Strengthening enforcement of international wildlife laws can further reduce illegal trade in tusks and killing of elephants.
Introduction
The African elephant (Loxodonta africana) occurs in 37 African countries (Thouless et al., 2016). It is the largest living terrestrial mammal, social, intelligent, an ecosystem engineer, a species of great conservation concern, and has thus been studied extensively. Even so, continental African elephant populations are declining rapidly due to poaching, habitat fragmentation and loss, conflict with humans, food and water scarcity linked to frequent severe droughts (Douglas-Hamilton, 1987; Chase et al., 2016) or civil war. Africa hosted about 1 million elephants in the 1970s but their number had reduced to about 400,000 - 630,000 individuals by 2010 (Douglas-Hamilton, 1987; Chase et al., 2016). The dramatic population decline is attributed primarily to poaching, habitat degradation, fragmentation and loss caused by human and livestock population growth and associated land use developments (Ihwagi et al., 2015; Chase et al., 2016; Thouless et al., 2016; Schlossberg et al., 2020).
As a result, elephants are highly unevenly distributed across Africa and are concentrated in Southern (70%) and Eastern (20%) Africa, with small populations remaining in Central (6%) and Western (~3%) Africa (Thouless et al., 2016). But within each region, elephant populations are concentrated in a few countries within each of which they are experiencing mounting poaching, habitat loss and other anthropogenic pressures. Thus, in Southern Africa, Botswana hosts a third of the entire African elephant population (130,451 ± 6,378; Chase et al., 2016) whereas Zimbabwe has the second largest African elephant population (ca 80,00) (https://conservationaction.co.za/resources/reports/zimbabwe-national-elephant-management-plan-2015-2020/; Dunham, 2008). Angola’s elephant population, severely reduced during the Country’s 27-year civil war, has been on the rebound. However, it continues to face serious threats from poaching and increasing human population, resulting in a population decline from 1,827± 598 animals in 2005 to 1437 ± 600 individuals in 2015 (Chase & Griffin, 2011; Schlossberg et al., 2018). Though numerically small, the Angolan population is important because its range links with the other elephant ranges in Botswana, Zimbabwe and Namibia. In East Africa, Tanzania hosts the largest elephant population (42,871 ± 3,102) but poaching has reduced it, resulting in a 60% regional decline in elephant numbers (Thouless et al., 2016).
Similar to other African elephant range states, Kenya’s elephant population, declined precipitously by 90.4% from 167,000 animals in the 1970s to 16,000 by 1989, mainly because of poaching, excessive control shooting, habitat destruction and the interaction between recurrent droughts and range contraction (Douglas-Hamilton, 1987; Parker, 2004). However, Kenya’s elephant population has been increasing since the 1990s and numbered about 30,000 in 2017 (KWS, 2015-17, unpublished report) and 36,169 by 2021 (Waweru et al., 2021) because poaching has been significantly reduced.
Elephants are treasured for their tusks that have a high global demand and market price, especially in Asian markets (Nellemann et al., 2013). As a result, elephants are often persecuted to sustain this global demand for ivory. Male elephants carry relatively larger and heavier tusks than females (Perry, 1954; Poole, 1994). Older elephants also tend to have relatively larger tusks than younger ones (Laws, 1966; Pilgram & Western, 1986). Thus, poachers often kill or injure more males than females and older than younger elephants (Mijele et al., 2013). Furthermore, whether the tusks of a dead elephant are recovered is a potentially important indicator of its cause of death. The Monitoring of Illegal Killing of Elephants (MIKE) under the United Nations – Convention on International Trade in Endangered Species of Wild Fauna and Flora (CITES) was established to provide information on elephant mortality for informed decision making in elephant range states in Africa in 2001 and later in Asia in 2017. In Kenya, the MIKE programme focuses on four sites that host most of the savanna elephant population, namely Samburu, Laikipia, Mara and Tsavo (https://citesmike.org/). The impact of mortality on elephant population dynamics is monitored by mortality rate (MR) — the number of elephants dying each year divided by the number of all elephants alive in that year. A widely monitored component of elephant mortality is that attributed to illegal killing, called the Proportion of Illegally Killed Elephants (PIKE), and calculated as 100 × the number of elephants killed by poachers/the number of all dead elephants (Douglas-Hamilton & Burrill, 1991; Jachmann, 2012; Ihwagi et al., 2018). A high value of, or an increase in PIKE, therefore suggests the need for greater protection. For instance, PIKE increased between 2002 and 2012 and was higher for the less protected communal lands outside than inside protected areas in Kenya’s Laikipia region (Ihwagi et al., 2015).
The tools or means used to kill elephants have evolved over time from traditional (spears or poisoned arrows) to include more powerful modern automatic weapons and poisons (Thouless, 1994; Muboko et al., 2014; Ogada, 2014). Most poachers use rifles to maximize the number of elephants killed in the shortest possible time (Kassam & Bashuna, 2004) and avoid detection by wildlife security personnel. Moreover, poaching intensity can vary seasonally, and tends to be higher in the dry than the wet season, for example in the Tsavo Ecosystem of Kenya, when elephants congregate around fewer watering holes in the dry season and therefore become more vulnerable to poachers (Maingi et al., 2012). However, poaching can also be higher during the wet than the dry season because there is more vegetation cover for poachers to hide and enough water to sustain themselves for longer periods inside PAs. But, elephants often tend to be sparsely distributed in the wet season, reducing the likelihood of mass killings (Kyale et al., 2011; Maingi et al., 2012).
Despite considerable inter-annual and spatial variation in their severity, the relative contributions of various mortality sources to elephant population dynamics in Kenya have attracted relatively little attention. However, it is crucial to quantify the impact on elephant population dynamics of various mortality sources and how their impacts vary in space and time. For Kenya, most studies have analyzed variation in elephant numbers and their putative causes only for particular regions. For example, in the Tsavo Ecosystem, elephant numbers dropped from 40,000 in the 1960s to about 6,000 in 1988 mainly due to poaching, droughts and range contraction (Olindo et al., 1988). However, despite the pressures from poaching, conflicts, droughts, and habitat destruction, the Tsavo elephant population has since recovered to about 13,000 in 2007 (Ngene et al., 2017) and 14,879 in 2021 (Waweru et al., 2021). Other regional studies in Kenya have focused on Laikipia – Samburu (Ihwagi et al., 2015), Amboseli (Moss, 2001) and Maasai Mara (Mijele et al., 2013; Ogutu et al., 2016) ecosystems. Analysis of long-term mortality monitoring data is thus critical to comprehensively evaluating the relative contributions of various mortality sources to elephant population dynamics but is seldom undertaken because of paucity of such data.
The understanding gained from analyzing long-term data can inform elephant conservation and management strategies. Thus far, poaching has been the major focus of elephant mortality studies and has been highlighted as the major threat to elephant conservation (Douglas-Hamilton, 1987; Wittemyer et al., 2014). Other causes of elephant mortality, such as human-elephant conflicts (e.g., poisoning), and accidents (Muboko et al., 2014; Thouless, 1994; Ogada, 2014) and natural processes (Moss, 2001) have received comparatively less attention. Few studies have endeavored to evaluate the relative contributions of these other causes of mortality, how their impacts compare with those of poaching and the level of threat they pose to elephants in Kenya and other African range states. Even so, long-term monitoring data have been used to study elephant mortality and population changes in Addo National Park, South Africa (Whitehouse & Hall-Martin, 2000; Whitehouse & Kerley, 2002).
Here, we analyze elephant mortality monitoring data collected by the Kenya Wildlife Service (KWS) over a 26-year period spanning 1992 - 2017 to answer the following 10 questions and test predictions of 13 hypotheses (Table 1). 1) What are the major causes of elephant mortality and how have they varied through time in Kenya? 2) How does elephant mortality vary with maximum temperature, annual rainfall, human and livestock population densities across Kenya’s 47 administrative counties? 3) How does the carcass category (i.e. fresh, recent, old or unknown) vary with the cause of mortality? 4) How does the recovery status of the ivory vary with the cause of death of an elephant? 5) What is the distribution of elephant carcasses by carcass age class and cause of death? 6) What is the weapon of choice for killing elephants and how has it varied over time? 7) How does the cause of mortality vary with the age class and sex class of an elephant? 8) How does elephant mortality differ between inside and outside protected areas? 9) How does the PIKE and elephant mortality rate vary over time and space (across the 47 counties)? 10) How do the various factors interact in influencing elephant mortality inside and outside protected areas?
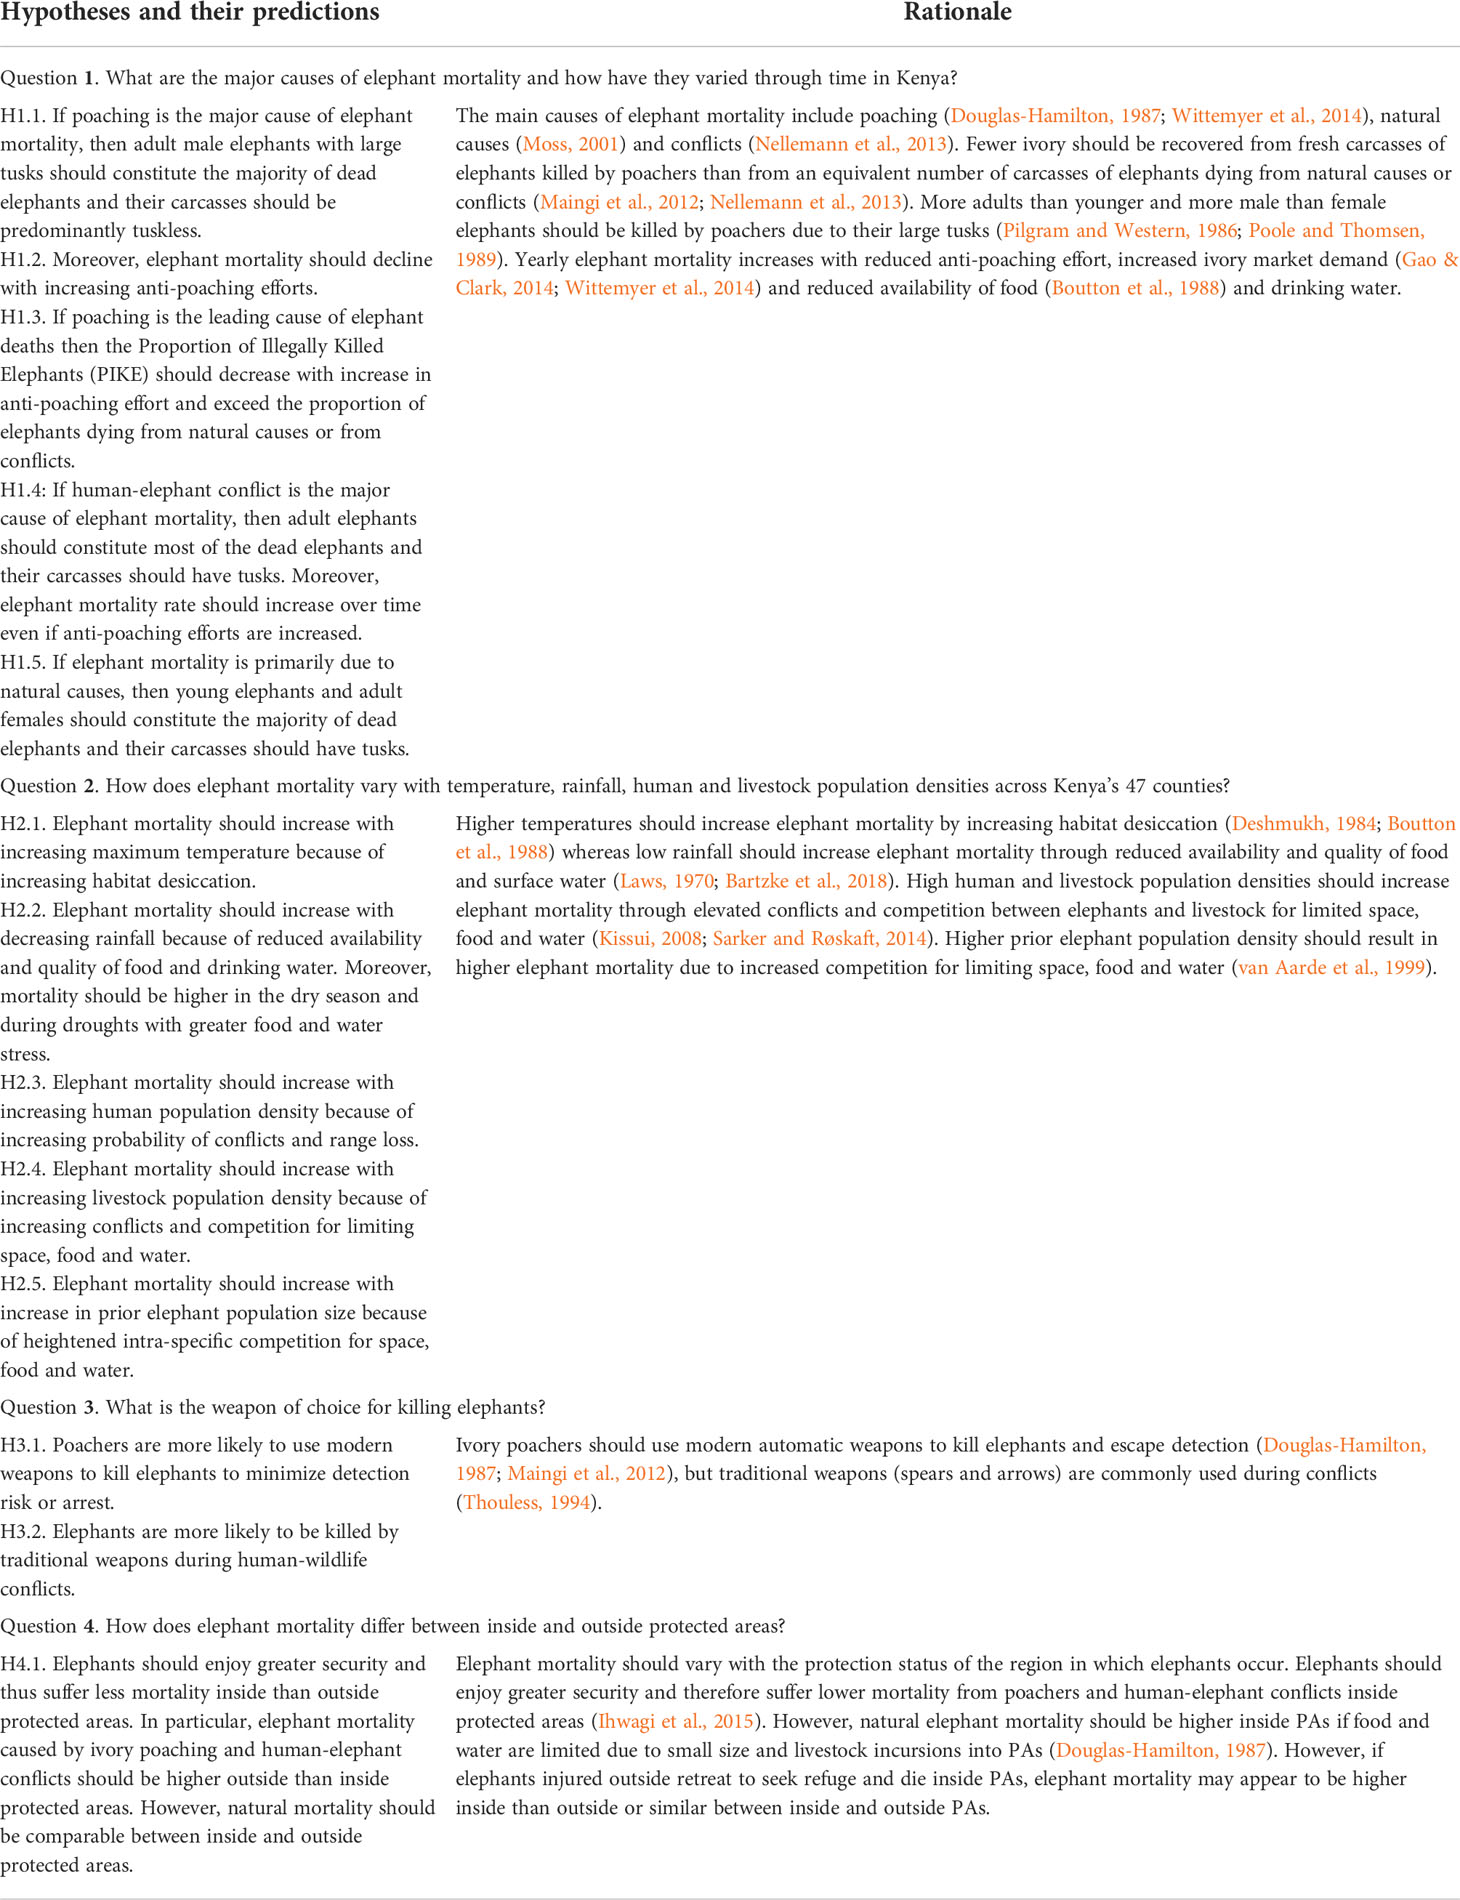
Table 1 Hypotheses on long-term elephant mortality in Kenya (1992-2017), their predictions and rationale.
Materials and methods
Study area
Kenya lies between latitudes 5°2’ N - 4°45’ S and longitudes 33°50’ E - 41°58’ E and covers an area of 582,646 km2 (Figure 1). Kenya’s population increased 8.8-fold from 5.4 million people in 1948 (Wasao et al., 2012) to 47.6 million people in 2019 (https://www.knbs.or.ke/2019) distributed across 47 administrative counties. The Kenya human population doubles approximately every 20 years and is projected to reach 85 million by 2050 and 125 million by 2100 (Fengler, 2010). Most parts of Kenya experience bimodal rainfall with the short rains falling during November-December and the long rains during March-May (Ogutu et al., 2008b). Also, Kenya is mostly (88%) arid and semi-arid rangeland with low agricultural potential, harbours a wide variety of wildlife species and is inhabited predominantly by pastoral communities (Pratt and Gwynne, 1977). Kenya has 63 PAs, covering 8.2% of its total surface area (Kanga et al., 2013). However, only about 35% of Kenya’s wildlife are found inside the PAs. The remaining 65%, including elephants, occur on private or communal lands outside the PAs (Western et al., 2009) (Figure 1). The PAs are typically too small to support their wildlife species all year so that many animals disperse seasonally from the PAs to their unprotected surroundings in search of food, water, breeding or calving grounds (Bhola et al., 2012; Ogutu et al., 2013; Ogutu et al., 2017).
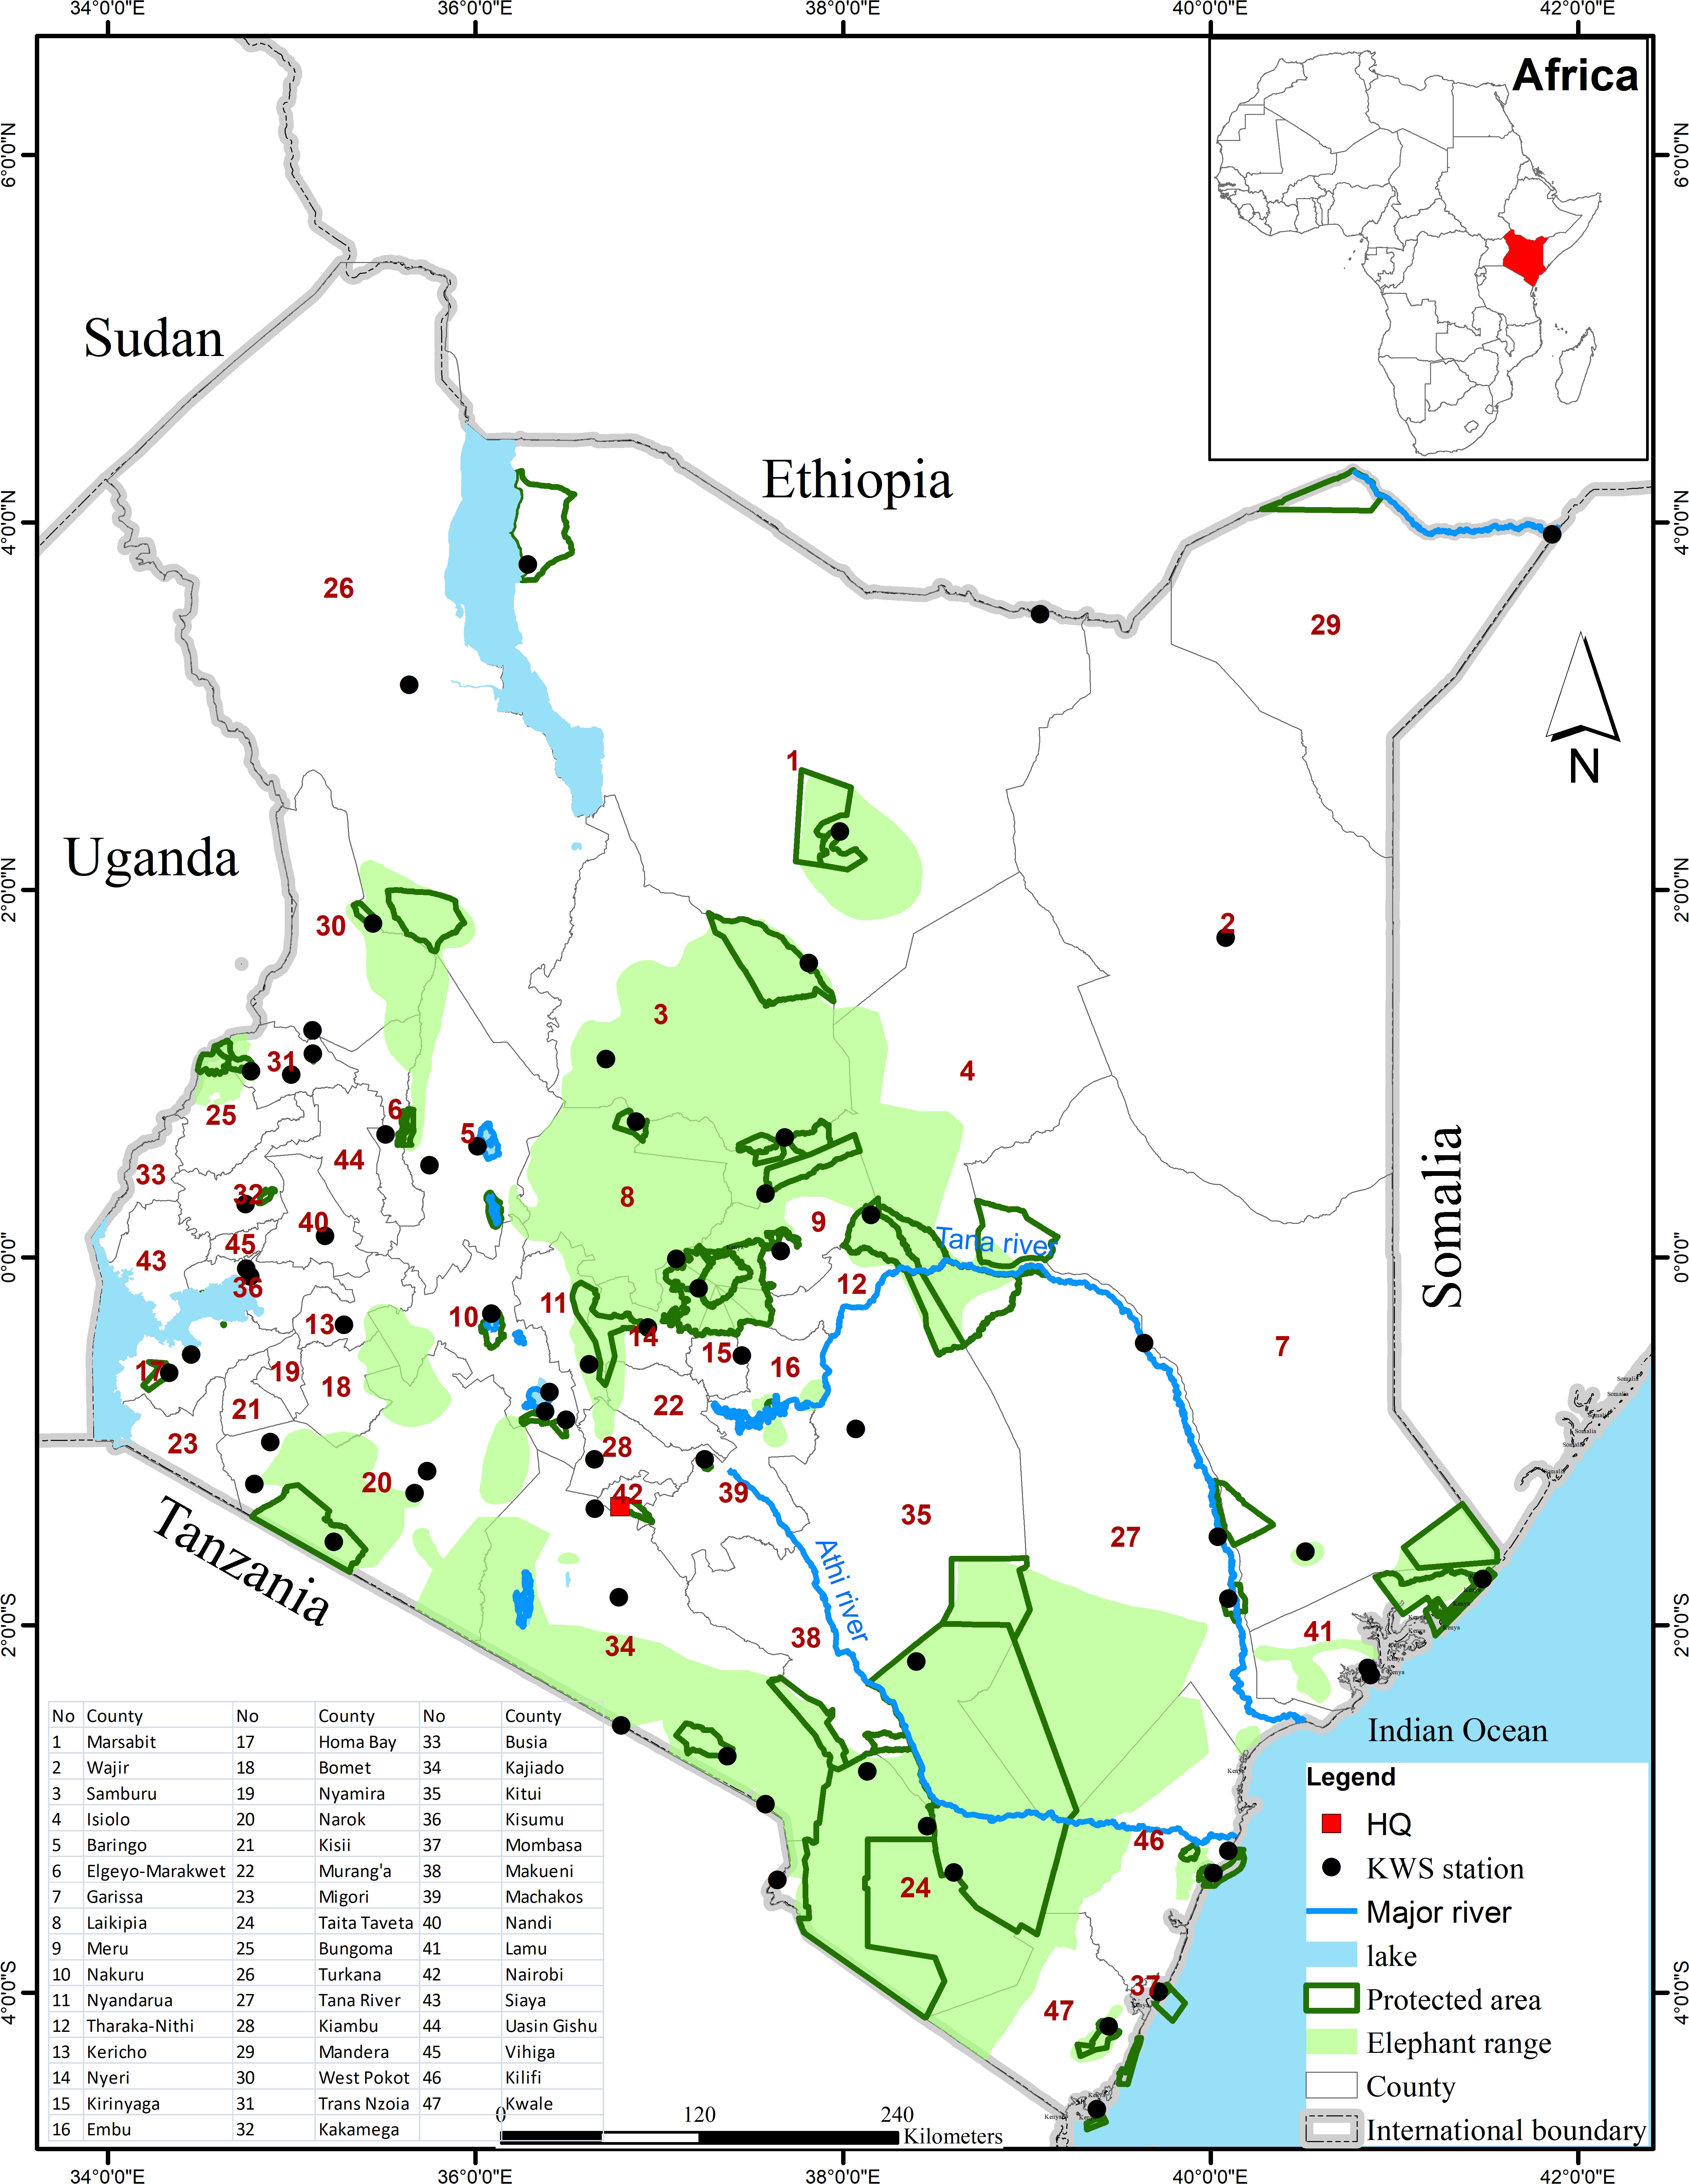
Figure 1 Map of Kenya showing protected areas and the elephant range superimposed on the 47 administrative counties. A national network of the KWS stations collects and transmits elephant mortality data to the KWS Command Center at the Nairobi Headquarters (HQ in the map).
Methods
Processing elephant mortality data
The KWS maintains a database on all wildlife security-related incidents at the Security Division at its headquarters in Nairobi. This started after the formation of the KWS as a parastatal in 1989 (Wildlife (Conservation and Management) Act, 1989) to deal with heightened poaching in the 1980s that threatened to decimate Kenya’s wildlife populations. These data include human-wildlife conflicts and wildlife mortality incidents, specifically mortalities of the critically endangered black rhinoceros (Diceros bicornis) and the African elephant populations in Kenya. The data are collected by the KWS stations (Figure 1) on a daily basis and transmitted to the Security Division through an elaborate radio network (Mukeka et al., 2018). Overall, the KWS operates over 265 security patrol bases in 38 of the 47 counties, outposts and park gates (not shown in Figure 1), for an average of seven bases per county, that feed wildlife-related data and information to the KWS headquarters. Thus, the highest number (n= 28) of KWS patrol bases is found in Taita Taveta County with the largest protected area and elephant population, while the lowest number (n= 1) is found in seven counties, with some of the lowest elephant populations, namely Bungoma, Kericho, Kirinyaga, Migori, Murang’a, Nandi and Wajir Counties. The monitoring data guide the KWS in making management, conservation and other decisions, ranging from timely deployment of security personnel for immediate security responses to supporting international decisions, e.g., at the CITES meetings. We sourced elephant mortality data from the KWS for 1992 - 2017. These data include daily records of all elephant deaths encountered throughout Kenya. The attributes of elephant carcasses recorded are the date of death (day, month and year), county (region), whether the elephant died inside or outside a PA, cause of death (ivory poaching, conflict, natural, euthanasia, accident, or unknown), means used to kill the elephant (rifle, spear, arrow, accident - vehicle, poison, natural, or unknown), estimated carcass age category (days, weeks, months or years), estimated age class of the elephant at the time of death (days, weeks, months or years), sex class of the elephant (male, female or unknown), tusk recovery status (recovered, tuskless, missing, or unknown), number of elephants that died in one incident, institution of the person writing the report (KWS officer, MIKE Site Officer, police officer or local community member), and, sometimes, the geographical coordinates of the carcass location. Even so, likewise to all long-term monitoring data with extensive geographic coverage, we expect the data a priori to have some potential biases because of a) variability in patrol intensity and its potential influence on carcass encounter rates and hence on the total number of reported dead elephants. Moreover, patrols can, in turn, be impacted by the availability of resources, target area to be covered, infrastructure and prevailing weather conditions. b) Landscape heterogeneity, e.g., woody vegetation cover through its influence on sightability, can affect carcass encounter rate (Burn et al., 2011). c) The carcasses of larger animals may persist longer than those of calves if carnivores, scavengers or other processes remove carcasses of calves at a faster rate. However, provided any potential bias remains relatively constant through time and the monitoring network is sufficiently comprehensive so that most of the carcasses can be detected, the monitoring data should reliably represent long-term trends in elephant mortality. Thus, even though the national elephant mortality estimates derived from the KWS’ extensive national monitoring network may not be as representative or indicative as those obtainable from detailed site-specific studies, such as MIKE sites, the mortality trends should be adequate for most practical purposes.
The time elapsed from the day an elephant died was used to group carcasses into four broad carcass age categories, namely fresh (1 to 3 weeks), recent (more than 3 weeks but less than 1 year), old (1 year or older) or unknown, when age class was not recorded (Douglas-Hamilton & Hillman, 1981). These categories can reveal the frequency and intensity of threats facing elephants and provide useful information (fresh and recent carcasses) on within-year elephant mortality. The carcasses are assigned to broad age classes and not actual ages. The latter is much more challenging and requires knowledge of tooth age techniques. Thus, we further grouped elephant carcasses as either juveniles, adults or unknown, when age class was not indicated (Western et al., 1983; Moss, 2001; Jones et al., 2018; Bender, 2019). Elephant carcasses were identified to sex class by observing the anatomy for fresh carcasses or the size of the skull, tusks and bones for recent and old carcasses, or to an “unknown” class, when they could not be sexed (Corfield, 1973; Pilgram & Western, 1986). Further, carcasses were classified using the weapons (means) used to kill elephants, including poison, rifles, snares, spears and arrows, or using other sources of elephant deaths not involving the use of weapons, including accidents, injuries, natural deaths or death from unknown causes. The use of rifles is determined by examining elephant carcasses for bullets using metal detectors to search for rifle cartridges at the scene of the incident. Arrows and spears typically remain in the carcass, while snares are typically entangled on the feet, trunk or around the carcass. Poisoning is determined through lack of physical injuries on the carcass plus through clinical examination by the KWS Veterinary Department. The most common poisons used to kill elephants include pesticides (e.g., aldicard and carbofurans) and poisons such as cyanide that poachers use to contaminate water holes and salt pans (Muboko et al., 2014; Ogada, 2014). This often also leads to the death of other non-target species that drink the contaminated water or that feed on poisoned carcasses. Accidents often occur while elephants are crossing roads or railway lines. For instance, Tsavo Ecosystem, Kenya’s largest elephant range is traversed by a national highway and a standard gauge railway with high traffic volumes, resulting in high accident mortality (Lala et al., 2021). Physical injuries are visually noticeable but are often hard to attribute to a specific cause, whereas natural deaths arise from old age, conspecific fights, or sickness.
We obtained data on human population size for Kenya for 1989, 1999, 2009 and 2019 from the Kenya National Bureau of Statistics (KNBS) and interpolated the counts to cover years without censuses using a semiparametric generalized linear mixed regression model with a negative binomial error distribution and a log link function as detailed in Mukeka et al. (2019a). The average annual maximum temperature and total annual rainfall were obtained from the Climate Hazards Group InfraRed Precipitation with Station data (CHIRPS) for 1992 – 2017 (CHIRPS: Rainfall Estimates from Rain Gauge and Satellite Observations, n.d). The CHIRPS rainfall data blends satellite with station data and is available at https://www.chc.ucsb.edu/data/chirps. We obtained absolute population size estimates for elephant, shoats (sheep (Ovis aries) plus goats (Capra hircus)), and cattle for Kenya’s 21 rangeland counties for the period 1977-2017 from 278 aerial monitoring surveys conducted by the Directorate of Resource Surveys and Remote Sensing (DRSRS) of Kenya (Ogutu et al., 2016). We interpolated the population size estimates for each country to cover all the years using a semiparametric generalized linear mixed regression model with a negative binomial error distribution and a log link function as explained in detail in Ogutu et al. (2016). Even though it provides the best available estimates of the elephant population size for each of the 21 rangeland counties during 1977-2017, the DRSRS data cover only 88% of the terrestrial land surface and excludes elephant populations found in small pockets within the 12% of the high potential, forested and densely settled parts of Kenya.
Statistical analyses
We used a multinomial logistic regression model with a multinomial error distribution and a generalized logit link function to relate the probability of elephant mortality to 12 putative predictors and their interactions. We separately analyzed the data for each of seven counties with the largest sample sizes (Taita Taveta, Laikipia, Narok, Samburu, Isiolo, Kajiado, and Marsabit) as well as the full data set for Kenya. We used automatic variable (forward) selection in the SAS HPGENSELECT procedure (SAS Institute Inc, 2021) to automatically select the factors and their interactions that best explain variation in the probability of elephant mortality (ESM Tables 1 & 2). We considered 12 main effects comprising cause of death, means used to kill elephants, carcass category, age class and sex class of elephant carcasses, month in which mortality occurred, mortality date representing time trend, human, shoats, and cattle population densities (number/km2), total annual rainfall and annual average maximum temperature and all their possible interactions, allowing for up to 3-way interactions. Rainfall and temperature were each divided by their long-term means over 1960-2017. The main effect of the running time of observations was also included in the model to capture temporal trends. We imposed the strong hierarchy (marginality) constraint such that an interaction term was retained in the model only if all its constituent main effects were already retained in the model (Nelder, 1994). We used the total population size of elephants for each year derived from the DRSRS data to represent the total live elephant population size (Ogutu et al., 2016). The logarithm of the sum of live and dead elephants in each year was used as an offset in the multinomial model to account for varying elephant population size among counties. We used ivory poaching as the base category and calculated the odds of each of the other five mortality causes relative to it. The model then predicts the mortality probability for each mortality source relative to the base category. Model selection was based on the corrected Akaike Information Criterion (AICc), Schwarz Bayesian Information Criterion (BIC) and Likelihood Ratio Chi-squared test. We next refitted the selected full model with the SAS GLIMMIX procedure (SAS Institute Inc, 2021) using a multinomial error distribution and a generalized logit link function. The same multinomial error distribution and a generalized logit link function were also used in the HPGENSELECT procedure. We simplified the model by sequentially dropping insignificant effects, starting with insignificant higher-order interactions. Satterthwaite-type denominator degrees of freedom for all F tests were computed based on the Kenward-Roger adjustment of the estimated variance-covariance matrix of the fixed effects for the mixed model accounting for serial autocorrelation (Kenward & Roger, 2009).
Serial autocorrelation in mortality probability was accounted for using the spatial generalization of the first-order autoregressive model. However, the model allowing for serial autocorrelation was too large to fit in reasonable time (for the full data set: 12 covariance parameters, 460 fixed effects and 1,872 random effects), so SAS PROC GLIMMIX stopped fitting the model because of insufficient memory. The error structure is especially complex because a separate correlated-error covariance structure must be specified for each response category represented in the multinomial response variable. Solving the mixed model equations consisting of the very large matrices associated with the complex spatial covariance structure for serial autocorrelation required too heavy computational resources, including a great deal of memory, and too long execution time, to fit. Because it was otherwise not feasible to fit the model, we dropped the specification for the serial autocorrelation before fitting the final model. Because our models did not include nor allow testing for the need to include it, serial autocorrelation may affect the patterns revealed by the estimated mortality probabilities. As well, we used descriptive statistics to summarize elephant mortality during 1992-2017. We also compared mortality inside versus outside protected areas using chi-squared tests.
Significance was assessed at the 5% level unless stated otherwise. Statistical analyses were carried out using SPSS Version 25.0 (51) and SAS Version 9.4, SAS/STAT version 15.1 (SAS Institute Inc, 2021). The SAS codes used for the statistical analyses and to produce the statistical graphics are provided in S1 Text in the Supplementary Materials.
Results
Temporal variation in elephant mortality and its causes in Kenya during 1992 - 2017
Overall, 9,182 elephant carcasses and therefore 353 ± 245 elephant deaths per year were reported in 8,571 elephant mortality incidents across Kenya during the 26 years spanning 1992 - 2017. The number of dead elephants per incident averaged 1.07 ± 0.62 (range 1 - 30). Elephant mortality rate in Kenya increased persistently during 1992 - 2017 primarily due to a surge in ivory poaching from 2008 to 2014, elevated natural mortality in 2009 and 2013 - 2017 and conflict mortality in 2009 and 2017. Elephant mortality was the lowest in 1998 (n = 117), and the highest in 2009 (n = 1,239). Further, the total annual elephant mortality increased exponentially during 1992 - 2017 (r2 = 0.42, P< 0.001; Figure 2; Figure ESM 1 Online Resources).
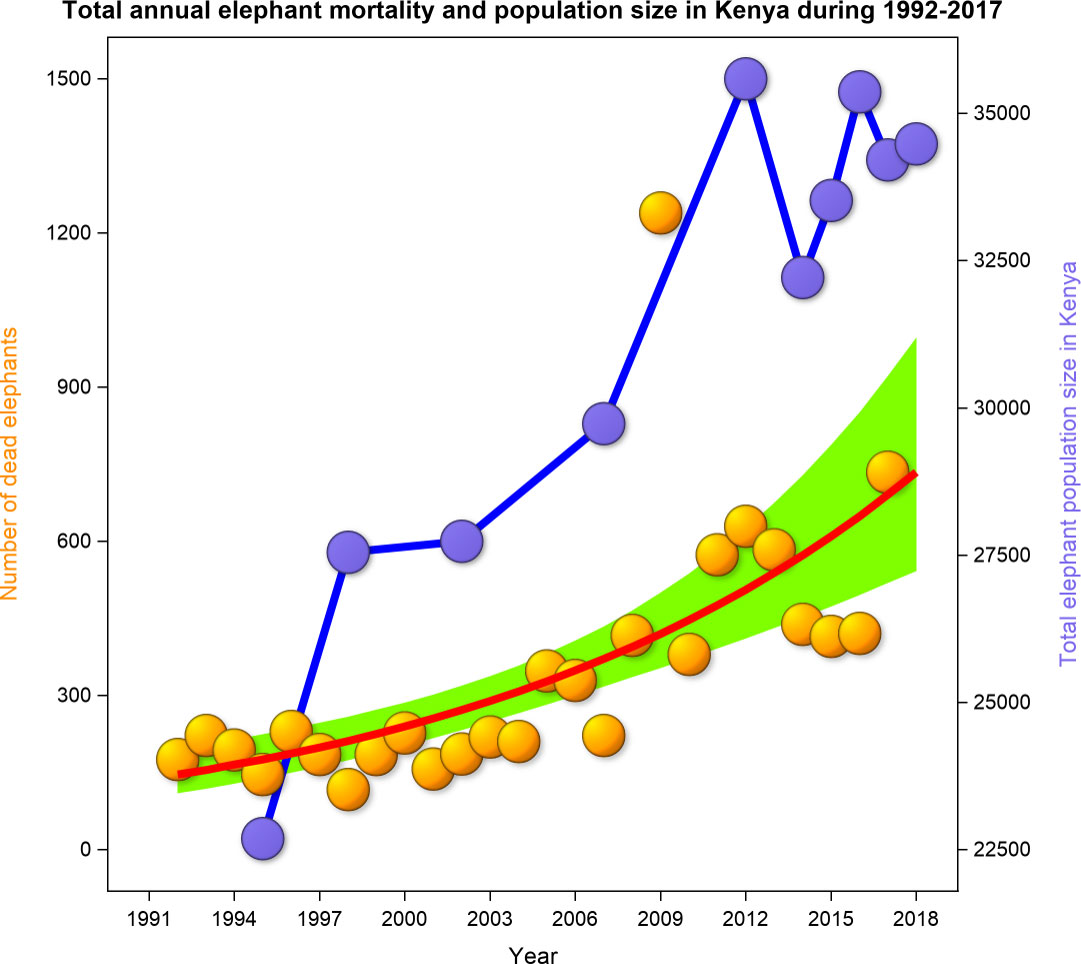
Figure 2 The total annual elephant mortality and population size of live elephants in Kenya during 1992-2017.
Elephant mortality in Kenya was attributed primarily to three causes (84.5%, n = 9,182), namely natural mortality, ivory poaching and conflicts with humans. Accidents, euthanasia and unknown causes made a relatively minor combined contribution (15.5%) to overall mortality. During the 26-year period, most elephants died from either natural causes (33.1%, mean ± 1sd = 117 ± 148, range 5 - 679), ivory poaching (31.5%, 111 ± 96, range 35-390), conflicts (19.9%, 70 ± 29, range 23 – 130) or unknown causes (11.1%, 39 ± 23, range 12 – 113) and a few from accidents (2.7%) or euthanasia (1.7%). The highest recorded mortality of 30 elephants in a single incident occurred from starvation during the 2009 drought. Moreover, 12 elephants died per incident from ivory poaching in 1994 and human-elephant conflict in 1995. The total annual mortality was the highest for 2009, 2011-2013 and 2017 and the lowest for 1998. Natural mortality peaked in 2009 and declined thereafter. Samburu region experienced high natural elephant mortalities in 2010, the year preceded by the 2009 drought in Kenya (Wittemyer et al., 2013). In contrast, mortality from ivory poaching peaked in 2012 and declined persistently thereafter (Figure 3). Because poaching and natural mortality each contributed one third to the total elephant mortality, these results only partially support the prediction (H1.1, Table 1) that poaching was the major cause of elephant mortality in Kenya during 1992-2017. The results also support the prediction (H2.2, Table 1) that mortality should be minimal during wet years but peak during droughts because of heightened food scarcity and water stress.
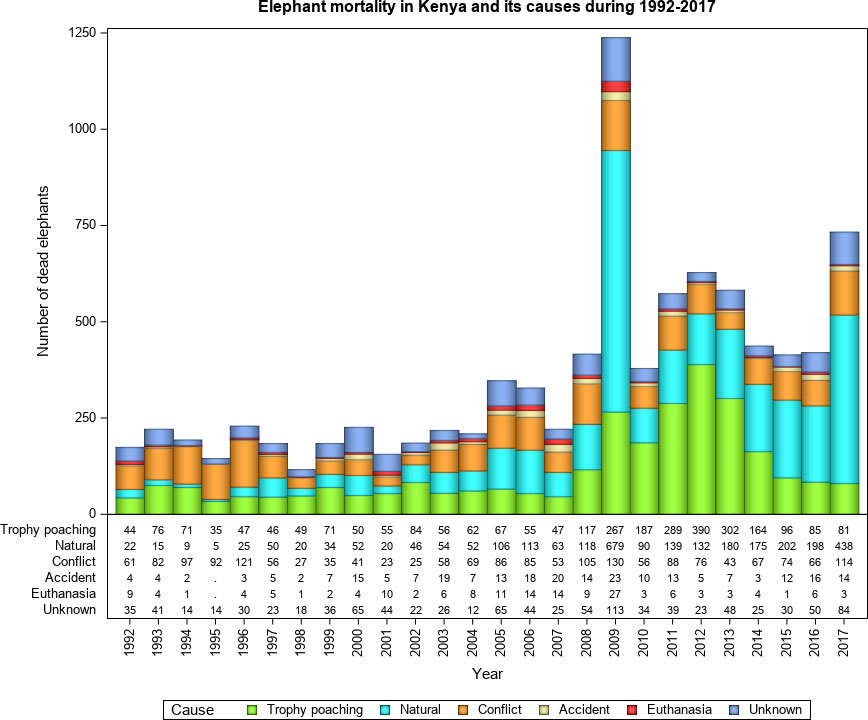
Figure 3 Elephant mortality and its causes in Kenya during 1992 - 2017.
Elephant mortality in Kenya was also seasonal and had a secondary peak in March following the short dry season (January-February) and primary peak in October, the end of the long dry season (July-October). This pattern conforms to the prediction (H2.2, Table 1) that mortality should peak during the dry season or droughts when food and water stress is high. Furthermore, natural elephant mortality was 1.75 times higher inside than outside PAs during October, the driest month in the year (Figure ESM 2, ESM 3 and ESM 4 Online Resources). This seasonal pattern is consistent with the prediction (H2.2, Table 1) but contradicts the prediction (H4.1, Table 1) that natural mortality should be comparable between outside and inside PAs. This implies that food scarcity and water stress and confinement in small areas can markedly elevate elephant mortality despite greater security inside protected areas.
Elephant mortality by county in Kenya
Elephant mortality incidents were widely distributed and were reported for 34 of the 47 Kenyan elephant range counties (Table 2). Even so, total mortality increased with elephant population size in each county such that 87.7% (n = 9,182) of all the mortality cases occurred in only seven leading elephant range counties of Kenya. Specifically, elephant mortality was the highest in Taita Taveta followed by Laikipia, Samburu, Narok, Meru, Isiolo and Nyeri counties (Figure 4A, Figure ESM 5 & 6 Online Resources). This accords with the expectation (H2.5, Table 1) that elephant mortality should increase with increasing population size. Moreover, the principal causes of elephant mortality varied regionally but were most influential in the same seven leading range counties. In particular, most elephants died from natural causes (80.2%, n = 3,037) in five counties, comprising Taita Taveta, Laikipia, Samburu, Isiolo, and Kajiado (Figure 4B, Figure ESM 7 Online Resources).
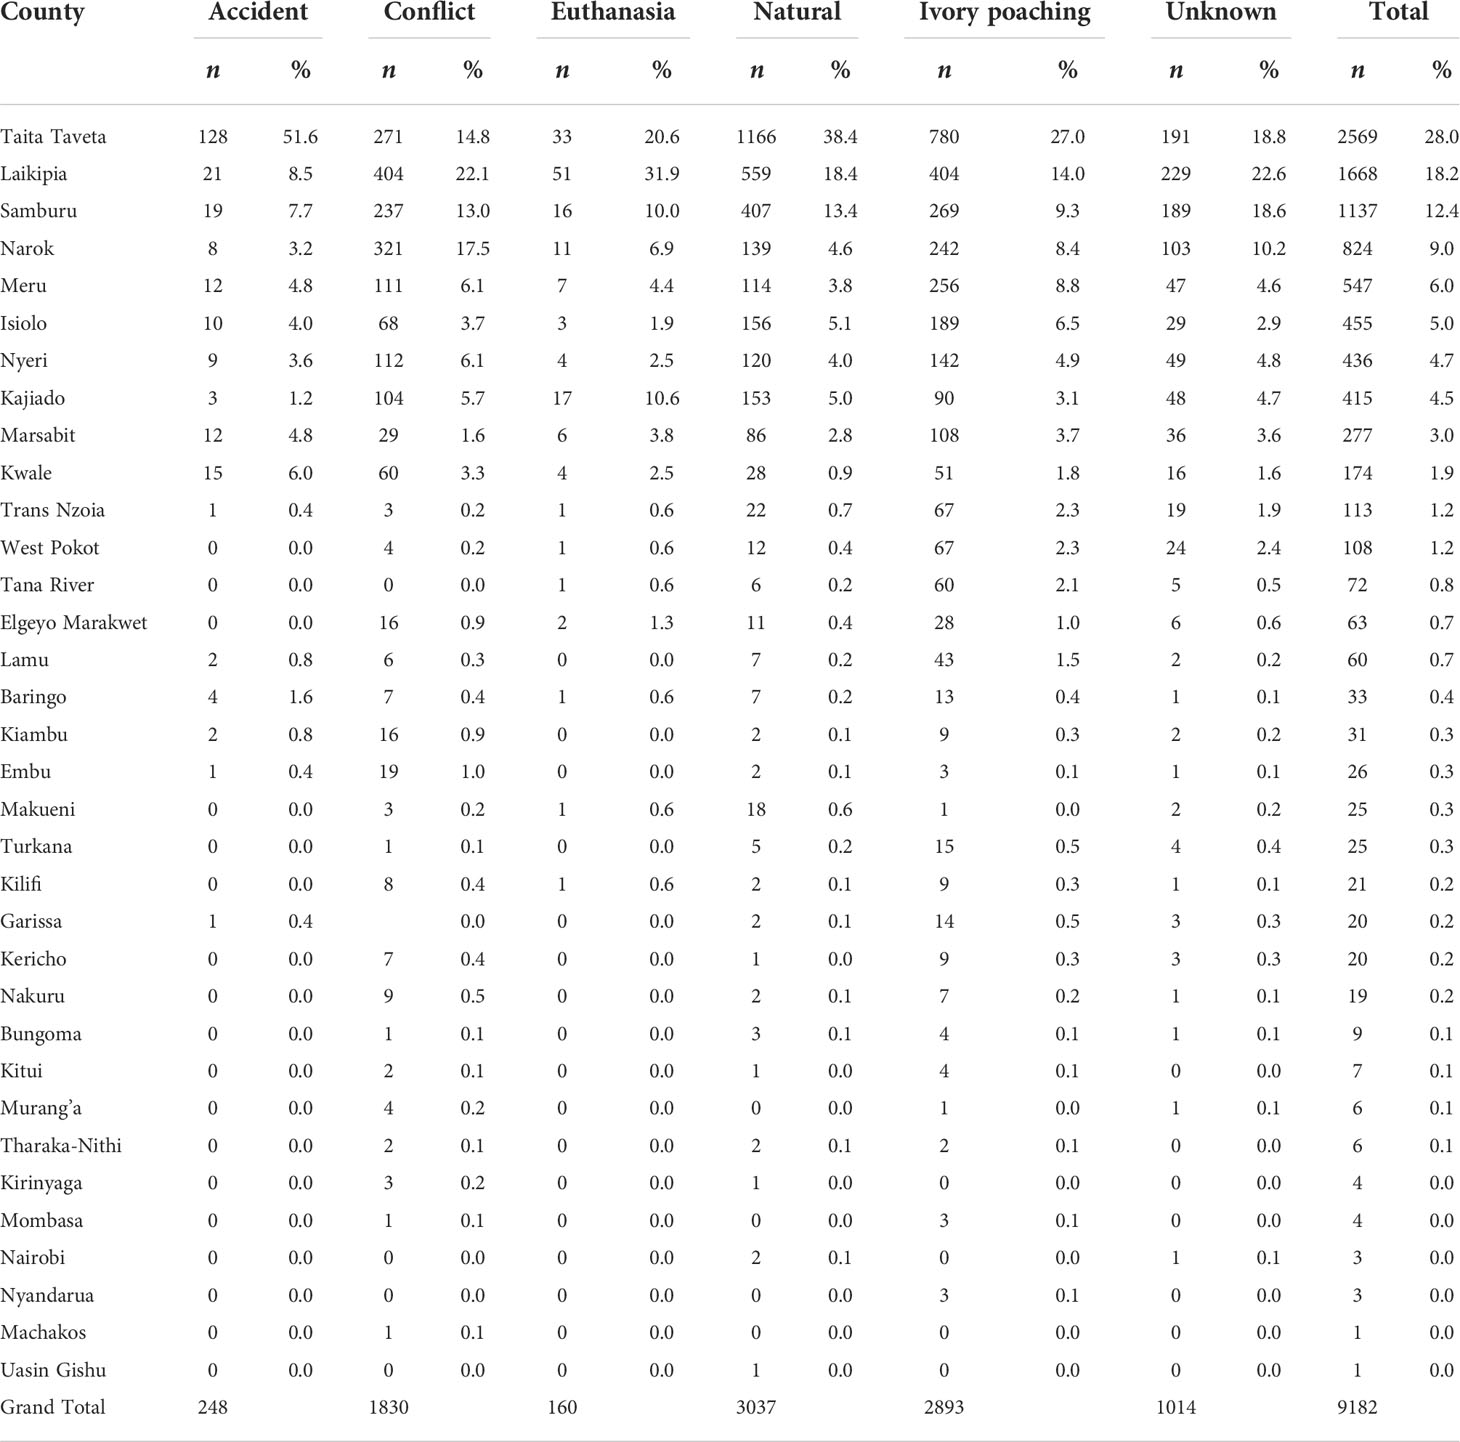
Table 2 Total elephant mortality by county and cause in Kenya during 1992 – 2017.
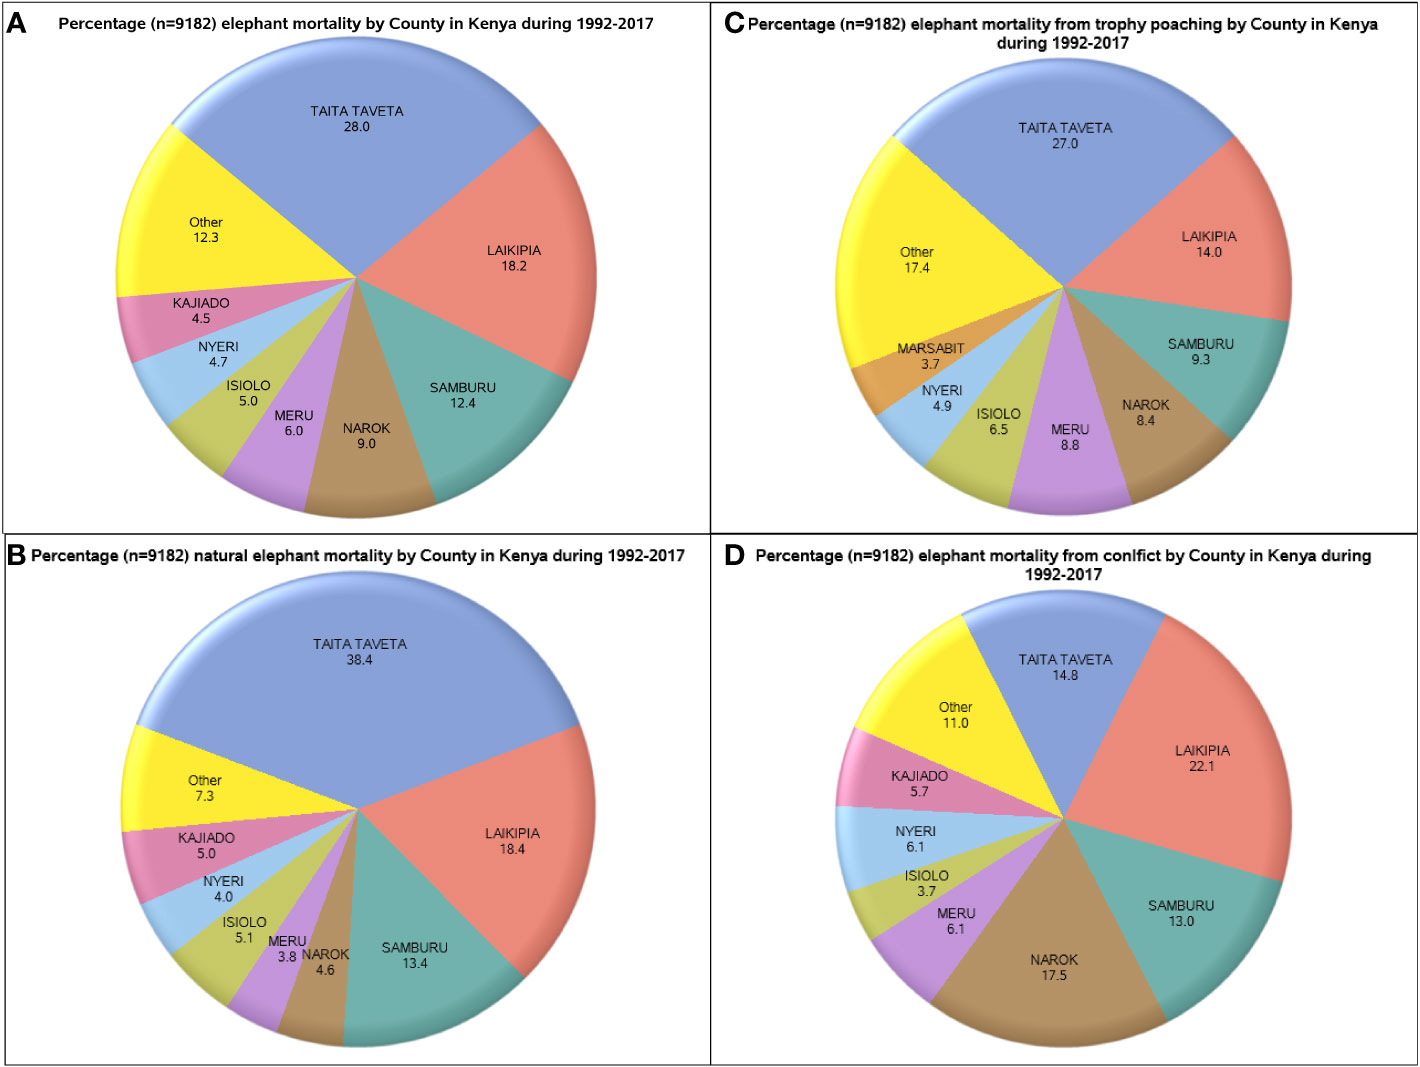
Figure 4 Distribution of elephant mortality, expressed as percentages, across Kenya’s 47 counties (A), mortality due to ivory poaching (B), natural processes (C) and conflicts (D) during 1992-2017.
Similarly, elephant mortality from ivory poaching was most severe in six of the seven leading elephant range counties, i.e., Taita Taveta, Laikipia, Samburu, Meru, Narok, and Isiolo (Figure 4C). Elephant mortality due to conflicts (80.0%, n = 1,830) also occurred in the seven leading range counties of Laikipia, Narok, Taita Taveta, Samburu, Narok, Meru and Nyeri (Figure 4D). Four counties had 70.2% (n=1,014) of all the mortalities from unknown causes, namely Laikipia (22.6%), Taita Taveta (18.8%), Samburu (18.6%), and Narok (10.2%). Of all the elephants that died from accidents, 51.6% (n=248) were in Taita Taveta whereas of all the elephants that died from euthanasia, 31.9% (n=160) were in Laikipia and 20.6% in Taita Taveta (Figure ESM 8 Online Resources).
Variation in elephant mortality with age class, sex class, causes of mortality and protection status
Far more adult than juvenile and adult male than adult female elephants died in Kenya during 1992-2017. Most adult and juvenile elephant carcasses were found while still fresh (Table 3). More adults and juveniles died outside than inside protected areas, implying that protection reduced elephant mortality (Table 3) as predicted (H4.1, Table 1). Where the weapon used to kill elephants was ascertained, the rifle was the most frequently used both inside and outside protected areas, consistent with expectation (H3.1, Table 1). Although far less commonly used than rifles, traditional weapons, including spears and arrows, were the second most commonly used weapons for killing elephants (Table 3). This reflects the fewer mortalities attributed to traditional weapons than to ivory poaching, and indirectly supports the prediction (H3.2, Table 1) that traditional weapons are more commonly used to kill elephants during human-elephant conflicts. Ivory poaching and human-elephant conflicts caused deaths of far more adult and juvenile elephants outside than inside protected areas as expected by greater security enjoyed by elephants inside than outside protected areas (H4.1, Table 1). Natural deaths were comparable between inside and outside protected areas but deaths from unknown causes were more prevalent outside than inside protected areas (Table 3).
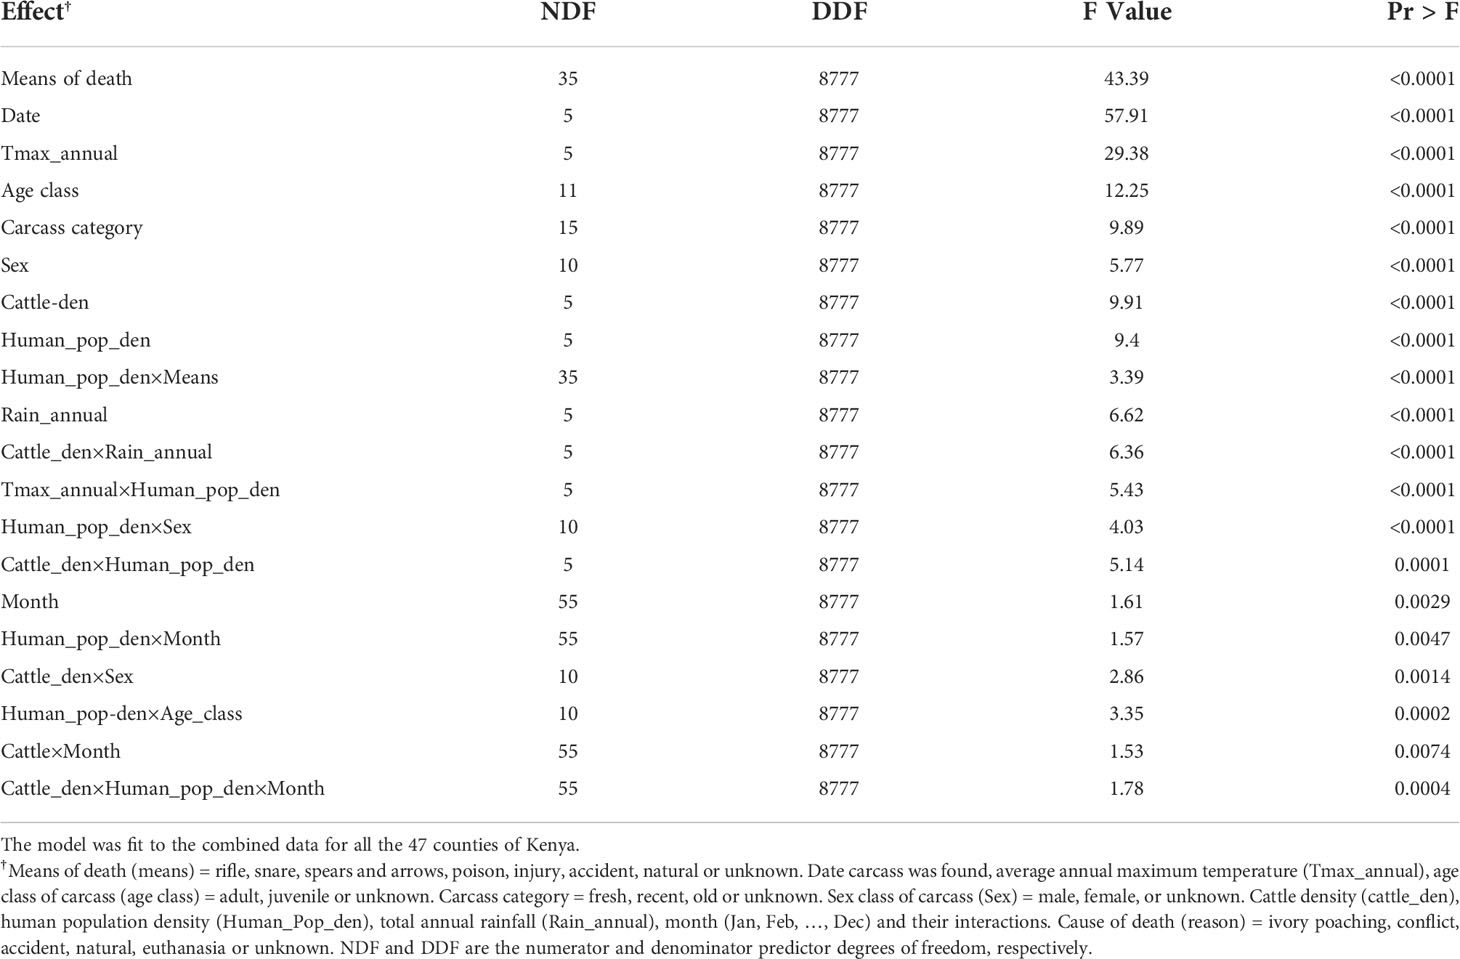
Table 3 F tests of significance of effects retained in the final model relating elephant mortality probability (cause of death=ivory hunting set as the baseline category) to predictor variables and their interactions.
Temporal and spatial variation in elephant mortality and its correlates
The probability of elephant mortality evidently varied across counties, between years and seasonally. The variation in elephant mortality was correlated with multiple covariates but the significant covariates also varied across counties. As a result, the full model using the data for all the 47 counties identified many significant covariates with complex interactions (ESM Table 1, 2). For simplicity of interpretation, we therefore focus only on interpreting the effects of the covariates correlated with mortality probability for the seven leading elephant range counties (Table 4).
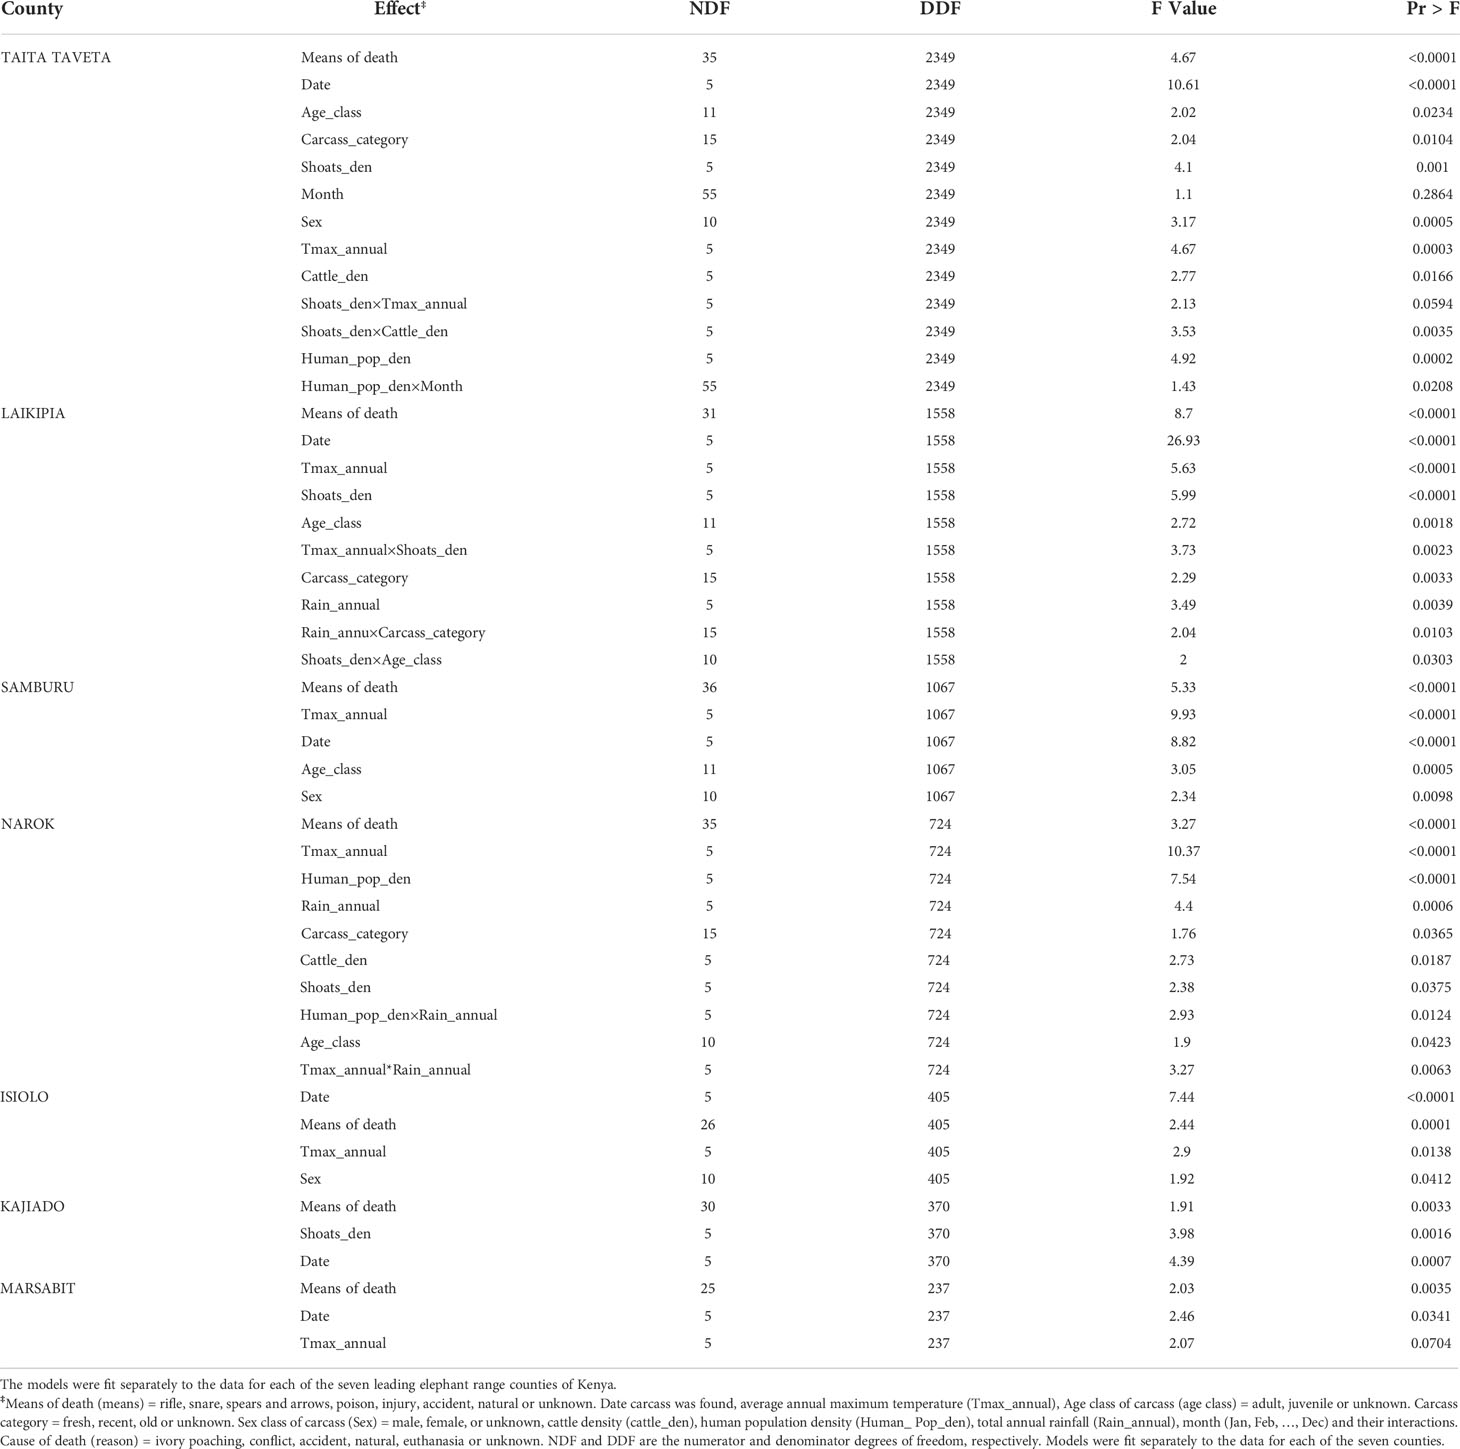
Table 4 F tests of the significance of the effects retained in the final model relating elephant mortality probability (cause of death=ivory poaching set as the baseline category) to predictor variables and their interactions.
Temporal variation in elephant mortality was influenced by human population density, average annual maximum temperature and total annual rainfall and the strength of the effects of these factors varied significantly across the seven counties of Kenya (Table 4). Elephant mortality probability was significantly influenced by human population density in Taita Taveta and Narok Counties, maximum temperature in all the seven range counties except Kajiado and by annual rainfall in Laikipia and Narok counties. The effect of human population density varied with month in Taita Taveta and with annual rainfall in Narok (Table 4).
In Taita Taveta, the probability of mortality due to conflicts increased whereas that due to unknown causes decreased over time. Mortality probability was seasonal and tended to be higher during the dry than the wet season especially that due to natural causes and conflict, as contemplated (H2.2, Table 1). The probability of mortality due to conflict and euthanasia increased with increasing maximum temperature (H2.1, Table 1) and density of shoats (interaction, H2.4, Table 1). But the probability of mortality due to conflict, euthanasia and unknown causes increased with both increasing densities of cattle and shoats (interaction, H2.4, Table 1). The probability of mortality due to conflict or natural causes also increased with increasing human population density (H2.3, Table 1) but the effect of human population density was interactive with that of season and tended to be stronger during the dry season (H2.2, Table 1). Juveniles were more likely than adults to die from accident, conflict, euthanasia, natural or unknown causes. Carcasses were more likely to be discovered while still fresh if the elephant had died from conflict but much later if death was due to natural causes.
In Laikipia, the probability of mortality due to accident, conflict, euthanasia and natural causes all decreased over time. The probability of mortality due to accidents, natural and unknown causes all declined with increasing interactive effects of maximum temperature (H2.1, Table 1) and density of shoats (H2.4, Table 1). The probability of adults dying from natural causes and juveniles from conflict and natural causes increased with increasing density of shoats (H2.4, Table 1). Adults are more likely than juveniles to die from conflicts (H1.4, Table 1). In Samburu, mortality probability due to accident, conflict, euthanasia and natural causes all declined over time. Mortality probability due to accident, conflict, euthanasia and natural causes all decreased with increasing average annual maximum temperature. This is surprising and contradicts the prediction (H2.1, Table 1) that mortality should increase with increasing maximum temperature. This pattern suggests that improved protection in Samburu was associated with a declining temporal trend in mortality and that this pattern was contemporaneous with an increasing trend in maximum temperature. This temporal coincidence does not therefore necessarily imply or demonstrate a causal relationship between mortality and maximum temperature and probably reflects temporal covariation. More juveniles than adults died of conflict and unknown causes, contrary to expectation (H1.4, Table 1).
In Narok, the probability of mortality due to conflict, natural and unknown causes all declined with increasing maximum temperature and increasing rainfall. This contradicts the contemplated patterns (H2.1 and H2.2, Table 1) and, likewise to Samburu, suggests temporal covariation. Mortality due to conflict increased with increasing human population density as predicted (H2.3, Table 1). The probability of mortality due to conflict and euthanasia increased whereas that due to natural causes decreased with increasing cattle density as anticipated (H2.4, Table 1). However, the probability of mortality due to conflict decreased with increasing density of shoats, contrary to prediction (H2.4, Table 1). The effects of human population density and rainfall apparently interacted such that elephant mortality probability due to conflicts decreased with increasing human population density at high levels of rainfall. This interaction implies that greater food and water availability and quality associated with high rainfall reduce human-elephant conflicts and conflict-related elephant mortality even at high human population density. Similarly, rainfall and temperature effects evidently interacted such that elephant mortality probability increased even at high rainfall levels if maximum temperature was also high. More juveniles than adults were likely to die from accidents, conflict or natural causes. The carcass of elephants that died from conflicts were more likely to be found when still fresh.
In Isiolo, mortality probability due to conflicts and unknown causes increased with increasing annual maximum temperature as contemplated (H2.1, Table 1). Females were more likely than males to die of natural and unknown causes in accord with prediction (H1.5, Table 1). Of the elephants that died of conflicts, more were killed using rifles than spears and arrows. This is at variance with the prediction that traditional weapons would more likely be used to kill elephants during conflicts (H3.2, Table 1). Moreover, more elephants died of natural causes than were killed with rifles.
For Kajiado, the probability of mortality due to natural causes decreased whereas that due to euthanasia increased over time. But the probability of mortality due to euthanasia decreased with increasing density of shoats. In Marsabit, the probability of mortality due to accidents and natural causes decreased over time. But the probability of natural mortality increased with increasing annual maximum temperature, suggesting the influence of aggravated food and water stress linked to progressive habitat desiccation (H2.1, Table 1).
Carcass age classes
Most elephant carcasses (62.7%, n = 5,760) were discovered while still fresh. Only 10.2% (n = 935) of the carcasses were classified as recent and 1.2% (n = 109) as old. However, the age classes for 25% of the elephant carcasses could not be reliably established and were therefore designated as unknown. The highest percentage of fresh carcasses (85%) were from mortality caused by accidents and euthanasia, followed by natural causes (65.4%), conflict (64.2%), and ivory poaching (63.8%). Un-aged elephant carcasses were the highest for unknown causes (37.6%) and conflict-caused mortality (33.8%) but the lowest for accident-caused mortality (9.3%).
Tusk recovery status and differences between causes of mortality
Of the total of 8,571 mortality incidents, tusks were recovered in 75.1% (n = 6,434), missing in 12.5% (n = 1,081) and not reported (unknown) in 9.2% (n = 789) whereas 3.2% (n = 277) had tuskless carcasses. Ivory poaching resulted in most of the missing tusks (83.6%, n = 895) in contrast to either natural causes or conflict (Table 5) in agreement with prediction (H1.1, Table 1). Over half of tuskless carcasses were for elephants that died from natural causes, implying that having no tusks increases the risk of death from natural causes. Moreover, most of the carcasses for which the tusk recovery status was unknown (58.9%,n = 465) were from ivory poached elephants. Overall, the recovery status of elephant tusks differed across conflict causes ( = 2314.9, P< 0.001).
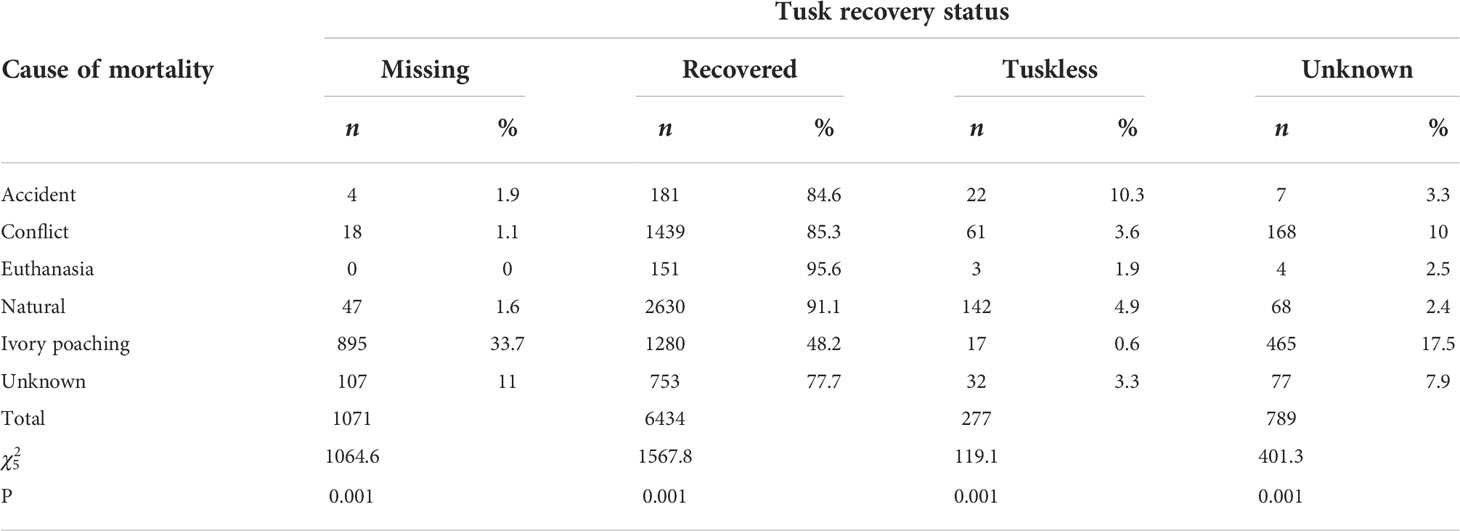
Table 5 Elephant tusk recovery status by cause of mortality in Kenya during 1992-2017.
Elephant mortality by age class, sex class, and cause of mortality
Elephant carcasses consisted of 4.5 times more adults than juveniles. Few elephant carcasses were not aged (4.8%) and were therefore assigned to the unknown class (Figure 5). Even though most juveniles died from natural causes (57.5%, n = 832), many died from accidents (35.5%) and a few from ivory poaching (7.1%). This is consonant with the prediction that most juveniles should die from natural causes or of accidents (H1.4 and H1.5, Table 1). Mortality causes differed significantly between the three age classes ( = 825.2, P = 0.001). Substantially more male (44.3%, n = 3,801) than female (25.1%, n = 2,149) carcasses were recorded (Figure 5). However, many carcasses could not be reliably sexed (30.6%, n = 2,621). Ivory hunters killed more than twice as many males (n = 1,264) as females (n = 591), agreeing with the prediction that poachers should mainly target males with larger tusks (H1.1, Table 1). Moreover, more male than female carcasses were also recorded for all the other mortality causes, including natural causes, conflict, euthanasia, and accidents. Thus, overall, 1.8 times more males than females died over the course of the 26-year period ( = 364.2, P = 0.001). This suggests that mortality is biased towards males.
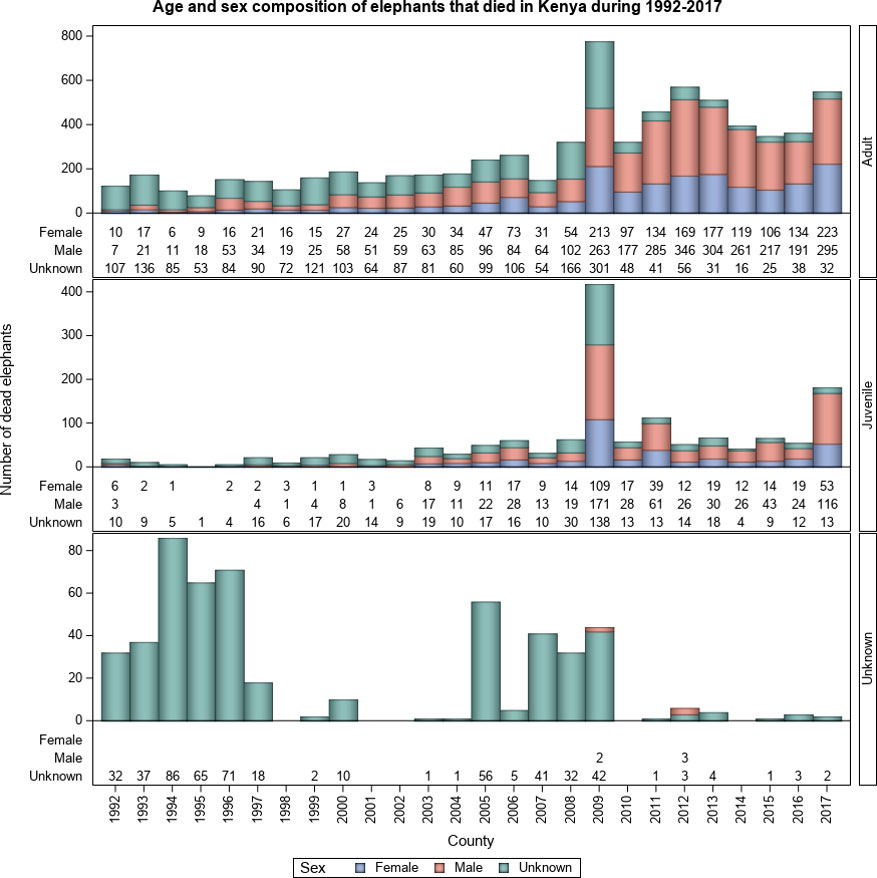
Figure 5 Distribution of elephant mortality by age class and sex class in Kenya during 1992-2017.
Elephant mortality inside and outside protected areas
Elephants range beyond protected area boundaries into unprotected private or community lands. This typically happens because most protected areas are too small to meet the requirements of elephants all year-round. As a result, mortality occurred both inside and outside protected areas (Figure 6). But mortality was 2.7 times more likely to occur outside than inside protected areas (Figure 6) in agreement with the prediction that greater security should lead to lower mortality inside protected areas (H4.1, Table 1). Even though overall mortality rate was higher outside than inside protected areas ( = 722.4, P = 0.001), natural death was almost equally distributed between inside (n = 1222) and outside (n = 1665) the protected areas as predicted (H4.1, Table 1).
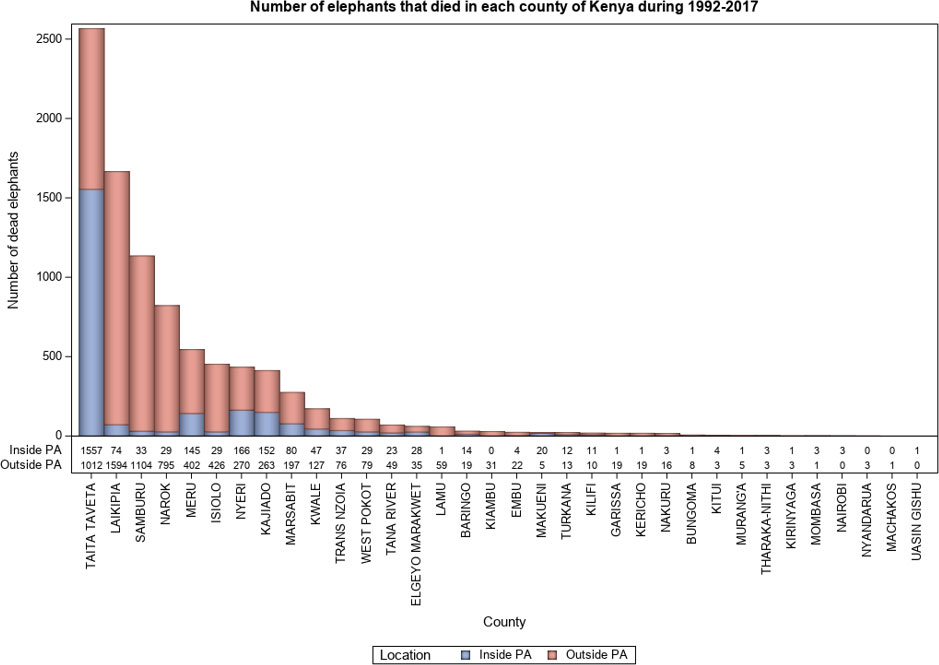
Figure 6 Elephant mortality inside and outside PAs by County in Kenya during 1992-2017.
Weapons used to kill elephants
Elephants were killed by using a variety of weapons, ranging from modern rifles to traditional weapons (spears and arrows). The number of elephants killed by rifles (31.2%, n = 2,672) was substantial but comparable with the number dying from natural causes (32.0%, n = 2,740). Spears and arrows were used to kill 13.6% (n = 1,167) of the elephants. Other means, including poison (1.4%), accidents (1.3%), snares (0.9%) and injuries (0.5%) also killed elephants. However, a sizeable number of elephant mortalities (19.2%, n = 1,647) could not be attributed to specific weapons or means. Most of the ivory poaching mortalities involved the use of rifles (52.7%, n = 1401), spears and arrows (22.9%, n = 609), poison (2.8%, n = 74) or snares (2.1%, n = 56). Similarly, most of the conflict-related mortality incidents were attributed to rifles (61.0%, n = 1,028), spears and arrows (32.4%, n = 547). Elephant mortality caused by accidents were mostly due to vehicles (50.5%,n = 108) or natural accidents (49.5%, n = 106). All the euthanasia mortalities involved the use of a rifle. In consequence, there were stark differences in the number of elephants killed using different weapons ( = 15898.9, P = 0.001). These results support the prediction that most ivory poachers should kill elephants using modern weapons (H3.1, Table 1) but contradict the prediction that traditional weapons are used to kill most elephants during conflicts (H3.2, Table 1).
PIKE and MR trends during 1992 - 2017
PIKE averaged 31.3 ± 12.7% during the 26-year period and was the lowest (11%) in 2017 and the highest (62.0%) in 2012 (Figure 7). PIKE did not, however, vary significantly during 1992-2017. Notably, however, PIKE decreased consistently during 2012-2017, coincident with intensification of anti-poaching efforts and therefore consistent with expectation (H1.3, Table 1). We expected PIKE to be high for counties with high elephant populations, however, six leading elephant range counties, including Taita Taveta (30.4%), Narok (29.4%), Laikipia (24.2%), Samburu (23.7%) and Kajiado (21.7) had low average PIKE levels (Figure 8). Even though mortality rates were relatively low, they increased over time. MR was the highest for 2017 (2.1%) and 2012 (1.7%) which were either severe drought years or were preceded by severe drought years but the lowest for 1998 (0.4%) (Figure 7), with exceptional ENSO-floods.
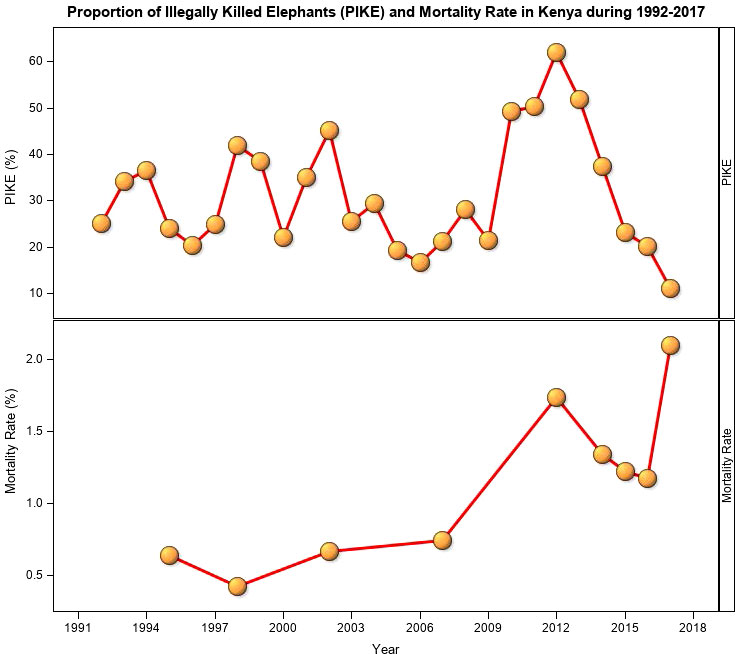
Figure 7 The proportion of illegally killed elephants (PIKE) and elephant mortality rate in Kenya during 1992 -2017.
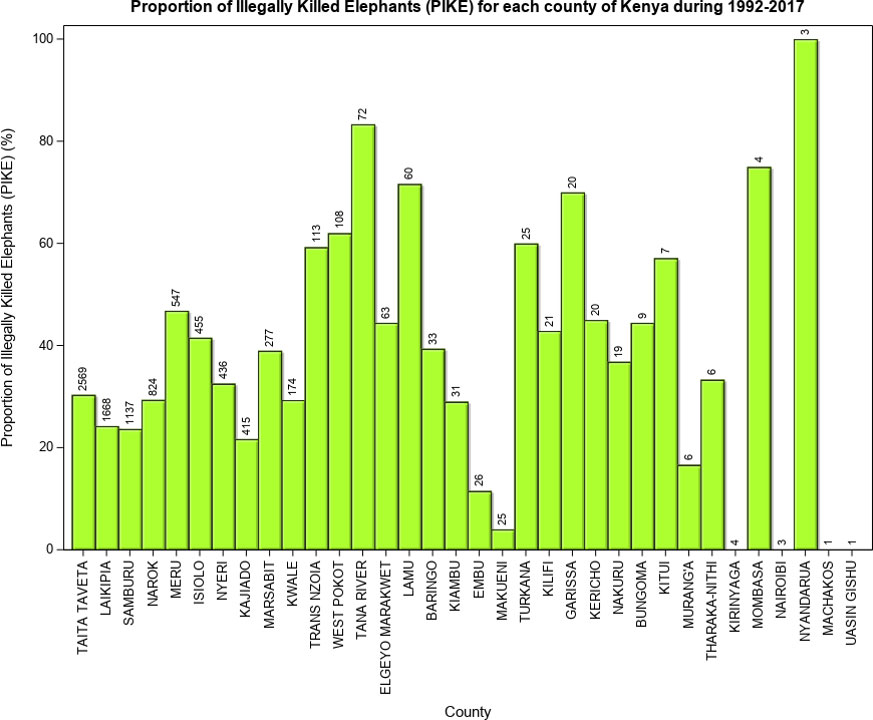
Figure 8 Proportion of Illegally Killed Elephants (PIKE) in 34 counties of Kenya during 1992-2017. The bar data labels are the total mortalities recorded for each county during 1992-2017.
Discussion
We analysed indicative temporal and spatial trends in elephant mortality in Kenya using data on carcasses detected and recorded by the Kenya Wildlife Service. While these data may substantially underestimate the true underlying mortality rates because of carcass detection biases, they allowed us to calculate mortality probabilities, distinguish between various mortality sources and test predictions of several hypotheses.
Temporal and spatial trends in elephant mortality in Kenya during 1992-2017
Elephant mortality in Kenya had three major causes, namely natural causes, ivory poaching, and human-elephant conflicts. Elephant mortality from natural causes can be attributed to two key factors, recurrent severe droughts linked to widening rainfall variability, progressive habitat desiccation associated with surface temperature warming and habitat fragmentation and loss due to intensifying land use developments, which amplify the effects of droughts on elephants. Kenya is experiencing drastic reductions in rainfall and elevated temperatures (Ogutu et al., 2016). Specifically, the three leading counties in natural elephant mortalities (Taita Taveta, Laikipia and Samburu) experienced a severe drought in 2009 when the highest elephant mortality was recorded in Kenya (see also e.g., Wittemyer et al., 2014). Kenya also experienced notably low rainfall in 2017 when a significant number (n = 438) of elephants died of starvation and water stress. Such widespread drought-related elephant mortality has also been reported elsewhere in continental Africa in Hwange National Park and Sebungwe region of Zimbabwe (Dudley et al., 2001; Dunham, 2008). Poor rainfall reduces food and surface water availability for wild herbivores. The impacts of droughts on elephants are exacerbated by elephant population density and high temperatures, which increase vegetation desiccation, food scarcity and evaporative surface water loss. Because rainfall governs vegetation biomass production and quality and availability of surface water in African savannas (Deshmukh, 1984; Boutton et al., 1988), high rainfall is necessary to ensure sufficient food and water supply and quality for megaherbivores, such as elephants, that require huge amounts of food and water (Laws, 1970). Accordingly, the lowest elephant mortality was recorded in 1998 when Kenya experienced exceptionally high El Niño rains (Ogutu et al., 2008a; Ogutu et al., 2016; Bartzke et al., 2018).
The highest number of elephants found dead in a single incident was 30 and resulted from starvation in October 2009 in the Satao region inside the Tsavo East National Park. Similar results have been reported for Tsavo for the same period based on earlier analyses of the KWS monitoring dataset (Wato et al., 2016). The large family groups of elephants (McComb et al., 2001) predispose them to mass family deaths when food and water become scarce. Studies in the major elephant ranges in Kenya, including Tsavo (Ottichilo, 1987), Laikipia (Ihwagi et al., 2015) and Amboseli (Moss, 2001; Owen-Smith & Ogutu, 2012; Okello et al., 2015; Lee et al., 2022) have attributed elephant mortality to starvation due to severe droughts. Our results show that more elephants died from natural causes (due to food and water scarcity) inside than outside PAs. This reflects the fact that PAs in Kenya are often too small to accommodate the year-round needs of their wildlife species; forcing animals to roam beyond their confines to areas outside the PAs in search of food, water and even calving grounds. It may also imply that elephants feel safer inside PAs and more old, sick or injured individuals retreat to die there. Climatic perturbations caused by warm El Niño and cold La Niña episodes, Indian Ocean Dipole oscillations and global warming are causing reduced and erratic rainfall, decreasing resource availability and quality and accentuating elephant deaths as food and water become more variable and limiting (Agenbag, 1997; Rouault et al., 2010).
Ivory poaching contributed to elephant mortality almost equally to natural causes but has been decreasing since 2014. In consequence, elephant numbers have been increasing in Tsavo but have remained relatively stable in Laikipia since 2012 (Ngene et al., 2013; Ngene et al., 2017; Waweru et al., 2021). Ivory poaching in Kenya peaked in 2009 and 2012 and was the highest in four counties with high elephant populations (Taita Taveta, Laikipia, Samburu and Meru) and relatively close to Somalia, the main origin of elephant poachers in Kenya (Parker, 2004). Poachers target regions with large elephant numbers to maximize kills without betraying their presence (Kyale et al., 2011; Maingi et al., 2012). The National Elephant Action Plan for Kenya 2022-2031 (Omondi et al., 2022) reaffirms that poaching is still in decline in Kenya with 38 poached animals recorded in 2018, 38 in 2019, 11 in 2020 and 25 in 2021.
High demand for illegal ivory, high prices for ivory in the black market, relatively high elephant populations, and poverty drive elephant poaching in Kenya (Wittemyer et al., 2014). The decisions to allow one-off ivory sales by the CITES in 2008-2009 may have triggered the steady increase in elephant poaching in Kenya (Wasser et al., 2007; Santiapillai, 2009). Furthermore, increasing demand, price, and illegal market for ivory in such countries as China have significantly contributed to illegal poaching in African countries. Ivory prices peaked in 2012 - 2013 but have since been on the decline (Zhou et al., 2018), engendering a decline in poaching rates (Hauenstein et al., 2019). Kenya experienced the highest elephant mortality rate from ivory poaching during 2012 but this trend has been on the decline, demonstrating that ivory price and demand drive ivory poaching. Thus, even though poaching was significant, once ivory sales were controlled, it declined and elephants died mainly due to climate change and range restriction. However, if not controlled, ivory poaching can significantly contribute to increased elephant mortality.
Conflict mortality is interactive with climate change and spikes during severe droughts when food and water are scarcest (Boutton et al., 1988; Ogutu et al., 2014) and competition between people, livestock and wildlife peaks. Human population growth and land use developments also aggravate conflict mortality such that it is the highest on human-dominated landscapes outside PAs (Ihwagi et al., 2015; Ngene et al., 2017; Mukeka et al., 2019a; Mukeka et al., 2020; Waweru et al., 2021). Thus, conflict mortality will likely continue increasing as rapid human population growth and the associated uncontrolled and unplanned land use developments in Kenya increasingly encroach onto and contract elephant range. The elephant will likely remain the leading cause and victim (Mukeka et al., 2019a; Mukeka et al., 2019b) of these conflicts as communities incur greater losses (including loss of lives, crop damage, livestock depredation and property destruction) and retaliate by killing more elephants and other wildlife species (Kissui, 2008; Sarker & Røskaft, 2014).
Carcass and tusk recovery status and causes of elephant mortality
Monitoring elephant security in Kenya was fairly effective because over 60% of carcasses were discovered and reported within three weeks of death (i.e., as fresh carcasses). Kenya has had a long history of closely monitoring elephant populations and mortality (Maingi et al., 2012) and enhanced the monitoring from 2002 after becoming a signatory to the CITES and implementing the MIKE programme (Wittemyer et al., 2014; Ihwagi et al., 2018). Since the elephant is a species of high conservation concern, prompt reporting is essential to guide timely response to threats. Even so, nearly one quarter of the carcasses were not assigned to age classes. Assigning elephant carcasses to age classes can be difficult and depends upon the state of decomposition of a carcass and the experience of the person doing the aging (Douglas-Hamilton & Burrill, 1991). Early carcass discovery is crucial to recovery of highly prized tusks of most (75%) of the dead elephants. Nevertheless, a third of the elephants killed by poachers had no tusks. Similarly, in Laikipia-Samburu, about 60% of all carcasses had intact tusks, while 50% of poached elephants had missing tusks (Kahindi et al., 2010). This indicates that poaching gangs are organized and efficient in killing elephants and removing their tusks (Maingi et al., 2012; Nellemann et al., 2013). Moreover, opportunistic ivory collectors probably also removed tusks from some carcasses of elephants that had died from other causes than ivory poaching, such as conflicts and natural deaths.
Elephant mortality by demography and protection status
The age class and sex class of an elephant influence mortality risk, resulting in greater adult than juvenile and male than female mortality. Ivory poachers target adult male elephants because they have larger tusks than adult females or juveniles (Poole & Thomsen, 1989: Pilgram & Western, 1986). Indeed, poachers’ preference for larger tusks carried by adult elephants has been demonstrated for six protected areas in Tanzania (Jones et al., 2018). As a result, adult sex ratio is skewed toward females in Laikipia in Kenya because of persistent poaching, leading to suppression of population recovery (Wittemyer, 2001). Male elephant poaching can be expected to eventually result in female elephant poaching as the male population becomes depleted. Further, in Amboseli, Kenya, male mortality from natural causes is higher than that of females (Moss, 2001). Also, adult elephants get killed during conflicts because they are bolder and pose greater threats to humans than juveniles. Also, carcasses of juvenile elephants decay or are removed faster by carnivores, scavengers or other processes than the large carcasses of adult elephants, resulting in potentially lower encounter rates for juveniles (Douglas-Hamilton & Burrill, 1991). Adult male elephants can break fences and raid farms while adult females lead families during conflicts (Thouless & Sakwa, 1995; Moss, 2001). Killing adult females can seriously threaten elephant social organization and population growth, which are sensitive to female mortality (Thouless, 1994). Overall, targeting adult elephants has serious implications for elephant population social and genetic structure and can reduce their survival prospects and fitness (Gobush et al., 2008; Archie and Chiyo, 2012), thus threatening their conservation. The high juvenile mortality due to natural causes is mainly attributed to high calf mortality during droughts (Moss, 2001). Furthermore, juveniles become more susceptible when separated from family groups, for example during and after conflict and poaching incidents.
More elephants died outside than inside PAs where they receive greater protection. Effective elephant conservation strategies should extend beyond PA boundaries and involve communities living with elephants. Elephant mortality from natural causes was almost equally distributed between inside and outside PAs, reflecting the influence of a large-scale mortality factor on food and water availability and quality, such as climate change and range contraction. During droughts herders illegally drive livestock into many PAs in Kenya in search of food and water (Ogutu et al., 2011; Waweru & Oleleboo, 2013). At high densities, livestock rapidly diminish food and water and displace elephants both inside and outside the PAs, leading to starvation of elephants and other wild herbivores.
Weapons and means of killing elephants in Kenya
The use of the sophisticated and automatic rifle to kill one third of the elephants in Kenya during 1992-2017 threatens their population and can be attributed to two factors. First, proliferation of small arms in Kenya due to the collapse of the Government of Somalia in 1992 has contributed, in large part, to the increase in poaching using firearms (Maingi et al., 2012). Firearms afford fast kills such that poachers can get away before security personnel arrive at the scene of the incident. Second, most elephants outside PAs live amongst pastoral communities that use light automatic rifles to protect their families and livestock from rustlers from other neighboring communities. These firearms sometimes find their way into the hands of poachers.
Few elephants were killed by using traditional weapons, especially arrows and spears. Arrows and spears, even though less effective than the modern rifle, are sometimes preferred for killing elephants because they do not make loud sounds. Concealment is an important factor especially for poachers to avoid detection by security forces and local communities. Poachers use poisoned arrows to puncture the skin of elephants and closely monitor them as they die slowly from the poison or infected wounds, and eventually remove the tusks. Killing of elephants by the use of spears has also been reported in Laikipia in Central Kenya (Thouless, 1994).
Trends in the proportion of illegally killed elephants (PIKE) and mortality rates (MR) during 1992-2017
Even though PIKE increased steadily during 1992 - 2012 indicating that poaching posed a serious threat to the elephant population in Kenya, this threat dropped significantly from 2012 to 2017. Thus, illegal killing of elephants has not been the only crucial factor contributing to the decreased elephant population numbers in Kenya contrary to findings of some previous site-specific studies (e.g., Ihwagi et al., 2018). However, it is noteworthy that in the counties that registered high PIKE levels, elephant populations have either been completely wiped out or their numbers have been greatly reduced. But, many counties with high elephant numbers recorded low PIKE levels. Three important factors contributed to this drop in PIKE levels in Kenya. First, increasing mortality from natural causes through starvation and human-elephant conflicts. If coupled with a more intense search effort, this can lead to a significant drop in PIKE and has indeed been pointed out as a potential source of bias in PIKE (Burn et al., 2011). Second, notably high PIKE levels have led to intensifying security operations and the Government of Kenya, through the KWS, increasing the ranger force, enhancing training skills, and adopting multi-agency security approaches. Third, the adoption of the new Wildlife Conservation and Management Act 2013 (The Wildlife Conservation and Management Act 2013, 2013), is likely discouraging poachers due to the greatly enhanced penalties. For instance, a fine of Kenya shillings (KES) 20,000,000 (about 200,000 USD at the current (2022) KES : USD exchange rate (Foreign Exchange Rates CBK, 2019) or life imprisonment is the recommended penalty for ivory dealing in Kenya (The Wildlife Conservation and Management Act 2013, 2013). This is an effective deterrent for many potential poachers.
The national elephant population was little affected by the low elephant mortality and increased, generally even when MR was correlated with elephant population size. The observed spikes in elephant mortality in Kenya were episodic, short-lived, and unlikely to substantially impact the national elephant population, unless sustained for long periods.
Conclusions and recommendations for elephant conservation
Our key findings can be summarized as follows. (1) A total of 9,182 elephants died in 8,571 encounter incidents in Kenya during 26 years spanning from 1992 to 2017. (2) Elephant mortality increased during 1992 -2017 but the elephant population in Kenya was little affected overall and increased steadily in this period. (3) Natural causes, ivory poaching, and conflicts are the leading causes of elephant mortality in Kenya. (4) Elephant mortality from natural causes, notably due to reduced food and water resources associated with more frequent severe droughts, is increasingly surpassing mortality due to ivory poaching, previously the leading cause of mortality. But the threat posed by ivory poaching to elephants still persists and strongly depends upon the control of ivory sales and anti-poaching efforts. (5) Elephant mortality peaks during droughts because of food scarcity and water stress and heightened human-elephant conflicts. The effects of the latter mortality sources are amplified by range contraction and fragmentation. (6) Elephant mortality is seasonal and peaks at the end of the long and short dry seasons, when food and water scarcity peak. (7) Temporal variation in elephant mortality is driven by increasing human population density and associated expansion of unplanned and uncontrolled land use developments as well as by rising maximum temperatures linked to global warming. (8) The principal causes of elephant mortality and the strength of their effects vary temporally and regionally, emphasizing the importance of accounting for temporal and regional heterogeneities and implying limited generalizability of findings of short-term or site-specific studies. (9) Most accident mortality was concentrated in only one County (Taita Taveta) crossed by a major highway and railway line with high traffic volumes and limited allowance for safe wildlife crossings. (10) More adults than juveniles and males than females are killed primarily because of their larger tusks. More precisely, more than twice as many males as females die from the various mortality causes, including being killed by poachers likely because of their larger tusks, natural causes, conflict, accidents and euthanasia. As well, more male than females die from all the other mortality causes, including natural causes, conflict, accidents and euthanasia. (11) More elephants die outside than inside protected areas, implying that protection reduces elephant mortality. Most notably, more elephants are killed by poachers outside protected areas. (12) The rifle is the most frequently used by poachers to kill elephants regardless of the level of protection. Traditional weapons, particularly spears and arrows, are the second most commonly used to kill elephants, especially during human-elephant conflicts.
Based on these findings, the following measures may enhance sustainable elephant conservation. Encouraging reforestation and reducing habitat fragmentation, uncontrolled and unplanned land use developments to enhance land cover and habitat connectivity and ameliorate food and water scarcity for elephants. This would allow elephants to move through the landscape, efficiently utilize various habitat patches, and be less sensitive to weather fluctuations and associated food and water shortages. Expanding elephant range, especially by encouraging community-based conservation on private and communal wildlife conservancies and providing safe road and rail crossings, would help reduce elephant mortality. Limiting domestic and international ivory demand can reduce poaching of elephants and promote their population recovery (Lemieux & Clarke, 2009). As well, boosting wildlife law enforcement and vigorously implementing punitive laws, for example the Wildlife Conservation and Management Act 2013 of Kenya (The Wildlife Conservation and Management Act 2013, 2013), can deter potential elephant poachers. Elephant range countries and the international community should thus develop and robustly and collaboratively implement more effective strategies to minimize ivory poaching. Enhancing security patrols, intelligence gathering and community engagement can promote safety and reporting of dead elephants. Mitigating human-elephant conflicts by enhancing habitat connectivity and functional heterogeneity, augmenting water availability in PAs in dry seasons based on sound ecological guidelines and principles and maintaining buffers around PAs in human-dominated landscapes can help reduce negative human-wildlife interactions that fuel conflicts. This can help retain elephants within PAs for longer periods, reduce their movements to areas outside PAs, frequency of conflicts and retaliatory killings. Although managing elephant populations that live in human-dominated lands outside protected parks and reserves is exceedingly challenging, increasing conservation benefits to, and active involvement of, communities in conservation efforts plus landscape zonation can enhance tolerance toward and reduce retributive killings of elephants. Promoting harmonious community co-existence, providing adequate security, and continued community disarmament can help reduce the number of weapons held illegally, especially in northern Kenya. Inter-agency security coordination can also help reduce the number of weapons being smuggled into Kenya, such as across the Kenya-Somalia border. Encouraging more productive livestock breeds and providing incentives to reduce livestock numbers can reduce the negative impacts of large numbers of livestock grazed illegally in protected areas. Elephant mortality monitoring should be continued and the data used to regularly assess elephant population status and guide elephant conservation strategies. Note, however, that the reported number of dead elephants can vary with vegetation cover through its influence on the detection probability. Intensifying ranger patrols can help enhance carcass detection. Further, stratifying elephant populations, such as by protection status (inside versus outside PAs), and calculating PIKE and MR statistics separately for each distinct population is desirable because both indicators can vary substantially across different elephant populations. Elephant mortality should be monitored at a variety of spatial scales and the geo-locations of carcasses recorded to inform spatially focused elephant conservation interventions and strategies. Lastly, rangers and community scouts should be regularly trained to sharpen their skills in aging carcasses, including the use of the more accurate teeth method (Sikes, 1966; Laws, 1966; Rasmussen et al., 2005) and assigning elephant carcasses to sex classes.
Data availability statement
The datasets presented in this article are not readily available because the data belongs to the Kenya Wildlife Service with restricted use. Requests to access the datasets should be directed to director@kws.go.ke
Ethics statement
Ethical review and approval was not required for the animal study because the data is collected of already deceased animals.
Author contributions
JM conceptualized the study, carried out data processing and prepared the initial draft. JO and JM conducted the statistical analyses. H-PP contributed to the choice of statistical models and tests. ER and EK oversaw the study. All the authors read and edited the manuscript for critical intellectual content and approved the manuscript for publication.
Funding
This project has received funding from the European Union’s Horizon 2020 research and innovation programmeunder Grant Agreement No. 641918 through the AfricanBioServices Project. JOO was additionally supported by a grant from the German Research Foundation (DFG, GrantQ19 ”# 257734638).
Acknowledgments
We thank the KWS for permission to use the elephant mortality data. We also thank the editor and two reviewers for comments that helped improve an earlier draft of this paper.
Conflict of interest
The authors declare that the research was conducted in the absence of any commercial or financial relationships that could be construed as a potential conflict of interest.
Publisher’s note
All claims expressed in this article are solely those of the authors and do not necessarily represent those of their affiliated organizations, or those of the publisher, the editors and the reviewers. Any product that may be evaluated in this article, or claim that may be made by its manufacturer, is not guaranteed or endorsed by the publisher.
Supplementary material
The Supplementary Material for this article can be found online at: https://www.frontiersin.org/articles/10.3389/fcosc.2022.975682/full#supplementary-material
References
Agenbag J. J. (1997). Pacific ENSO events reflected in meteorological and oceanographic perturbations in the southern benguela system. Oceanographic Literature Rev. 1 (44), 23.
Archie E. A., Chiyo P. I. (2012). Elephant behaviour and conservation: social relationships, the effects of poaching, and genetic tools for management. Mol. Ecol. 21 (3), 765–778. doi: 10.1111/j.1365-294X.2011.05237.x
(2016) Current rules on commercial international trade in elephant ivory under CITES and proposals to CITES CoP17. Available at: https://www.cites.org/eng/news/Current_rules_commercial_international_trade_elephant_ivory_under_CITES_Proposals_CITES_CoP17_200716.
Bartzke G. S., Ogutu J. O., Mukhopadhyay S., Mtui D., Dublin H. T., Piepho H.-P. (2018). Rainfall trends and variation in the maasai Mara ecosystem and their implications for animal population and biodiversity dynamics. PloS One 13 (9), e0202814. doi: 10.1371/journal.pone.0202814
Bender L. C. (2019). Age structure and population dynamics☆. in b. fath (Ed.). Encyclopedia Ecol. (Second Ed) 1, 135–143. doi: 10.1016/B978-0-12-409548-9.10925-X
Bhola N., Ogutu J. O., Said M. Y., Piepho H.-P., Olff H. (2012). The distribution of large herbivore hotspots in relation to environmental and anthropogenic correlates in the Mara region of Kenya. J. Anim. Ecol. 81 (6), 1268–1287. doi: 10.1111/j.1365-2656.2012.02000.x
Boutton T. W., Tieszen L. L., Imbamba S. K. (1988). Seasonal changes in the nutrient content of East African grassland vegetation. Afr. J. Ecol. 26 (2), 103–115. doi: 10.1111/j.1365-2028.1988.tb00961.x
Burn R. W., Underwood F. M., Blanc J. (2011). Global trends and factors associated with the illegal killing of elephants: a hierarchical Bayesian analysis of carcass encounter data. PloS One 6 (9), e24165. doi: 10.1371/journal.pone.0024165
Chase M. J., Griffin C. R. (2011). Elephants of south-east Angola in war and peace: their decline, re-colonization and recent status. Afr. J. Ecol. 49 (3), 353–361. doi: 10.1111/j.1365-2028.2011.01272.x
Chase M. J., Schlossberg S., Griffin C. R., Bouché P. J., Djene S. W., Elkan P. W., et al. (2016). Continent-wide survey reveals massive decline in African savannah elephants. PeerJ 4, e2354. doi: 10.7717/peerj.2354
CHIRPS: Rainfall Estimates from Rain Gauge and Satellite Observations. Available at: https://www.chc.ucsb.edu/data/chirps/.
Corfield T. F. (1973). Elephant mortality in tsavo national park, Kenya. Afr. J. Ecol. 11 (3–4), 339–368. doi: 10.1111/j.1365-2028.1973.tb00098.x
Deshmukh I. K. (1984). A common relationship between precipitation and grassland peak biomass for east and southern Africa. Afr. J. Ecol. 22 (3), 181–186. doi: 10.1111/j.1365-2028.1984.tb00693.x
Douglas-Hamilton I. (1987). African Elephants: Population trends and their causes. Oryx 21 (1), 11–24. doi: 10.1017/S0030605300020433
Douglas-Hamilton I., Burrill A. (1991). Using elephant carcass ratios to determine population trends. Afr. Wildlife: Res. Manage., 98–105.
Douglas-Hamilton I., Hillman A. K. K. (1981). Elephant carcasses and skeletons as indicators of population trends. Low-Level Aerial Survey Tech. Rep. Int. Workshop, 4:6–11.
Dudley J. P., Gibson D. S. C., Haynes G., Klimowicz J. (2001). Drought mortality of bush elephants in hwange national park, Zimbabwe. Afr. J. Ecol. 39 (2), 187–194. doi: 10.1046/j.0141-6707.2000.00297.x
Dunham K. M. (2008). Detection of anthropogenic mortality in elephant loxodonta africana populations: A long-term case study from the sebungwe region of Zimbabwe. Oryx 42 (1), 36–48. doi: 10.1017/S0030605308000471
Fengler W. (2010). Demographic Transition and Growth in Kenya. https://www.worldbank.org/en/news/opinion/2010/04/28/demographic-transition-growth-kenya
Foreign Exchange Rates CBK (2019) Retrieved November 7, 2019. Available at: https://www.centralbank.go.ke/rates/forex-exchange-rates/.
Gao Y., Clark S. G. (2014). Elephant ivory trade in China: Trends and drivers. Biol. Conserv. 180, 23–30. doi: 10.1016/j.biocon.2014.09.020
Gobush K. S., Mutayoba B. M., Wasser S. K. (2008). Long-term impacts of poaching on relatedness, stress physiology, and reproductive output of adult female African elephants. Conserv. Biol. 22 (6), 1590–1599. doi: 10.1111/j.1523-1739.2008.01035.x
Hauenstein S., Kshatriya M., Blanc J., Dormann C. F., Beale C. M. (2019). African Elephant poaching rates correlate with local poverty, national corruption and global ivory price. Nat. Commun. 10 (1), 1–9. doi: 10.1038/s41467-019-09993-2
Ihwagi F. W., Thouless C., Wang T., Skidmore A. K., Omondi P., Douglas-Hamilton I. (2018). Night-day speed ratio of elephants as indicator of poaching levels. Ecol. Indic. 84, 38–44. doi: 10.1016/j.ecolind.2017.08.039
Ihwagi F. W., Wang T., Wittemyer G., Skidmore A. K., Toxopeus A. G., Ngene S., et al. (2015). Using poaching levels and elephant distribution to assess the conservation efficacy of private, communal and government land in northern Kenya. PloS One 10 (9), e0139079. doi: 10.1371/journal.pone.0139079
Jachmann H. (2012). Pilot study to validate PIKE-based inferences at site level. Pachyderm 52), 72–87.
Jones T., Cusack J. J., Pozo R. A., Smit J., Mkuburo L., Baran P., et al. (2018). Age structure as an indicator of poaching pressure: Insights from rapid assessments of elephant populations across space and time. Ecol. Indic. 88, 115–125. doi: 10.1016/j.ecolind.2018.01.030
Kahindi O., Wittemyer G., King J., Ihwagi F., Omondi P., Douglas-Hamilton I. (2010). Employing participatory surveys to monitor the illegal killing of elephants across diverse land uses in laikipia–samburu, Kenya. Afr. J. Ecol. 48 (4), 972–983. doi: 10.1111/j.1365-2028.2009.01200.x
Kanga E. M., Ogutu J. O., Piepho H.-P., Olff H. (2013). Hippopotamus and livestock grazing: Influences on riparian vegetation and facilitation of other herbivores in the Mara region of Kenya. Landscape Ecol. Eng. 9 (1), 47–58. doi: 10.1007/s11355-011-0175-y
Kassam A., Bashuna A. B. (2004). Marginalisation of the waata oromo hunter-gatherers of Kenya: Insider and outsider perspectives. Africa 74 (2), 194–216. doi: 10.3366/afr.2004.74.2.194
Kenward M. G., Roger J. H. (2009). An improved approximation to the precision of fixed effects from restricted maximum likelihood. Comput. Stat Data Anal. 53 (7), 2583–2595. doi: 10.1016/j.csda.2008.12.013
Kenya National Bureau of Statistics (2019) 2019 Kenya population and housing census. Available at: https://www.knbs.or.ke/?wpdmpro=2019-kenya-population-and-housing-census-volume-i-population-by-county-and-sub-county (Accessed July 2020).
Kissui B. M. (2008). Livestock predation by lions, leopards, spotted hyenas, and their vulnerability to retaliatory killing in the maasai steppe, Tanzania. Anim. Conserv. 11 (5), 422–432. doi: 10.1111/j.1469-1795.2008.00199.x
Kyale D. M., Ngene S. M., Maingi J. (2011). Biophysical and human factors determine the distribution of poached elephants in tsavo East national park, Kenya. Pachyderm 49 (1), 48–60.
Lala F., Chiyo P. I., Kanga E., Omondi P., Ngene S., Severud W. J., et al. (2021). Wildlife roadkill in the tsavo ecosystem, Kenya: identifying hotspots, potential drivers, and affected species. Heliyon 7 (3), e06364. doi: 10.1016/j.heliyon.2021.e06364
Laws R. M. (1966). Age criteria for the African elephant: Loxodonta africana. Afr. J. Ecol. 4 (1), 1–37. doi: 10.1111/j.1365-2028.1966.tb00878.x
Laws R. M. (1970). Elephants as agents of habitat and landscape change in East Africa. Oikos 11 21(1), 1–15. doi: 10.2307/3543832
Lee P. C., Moss C. J., Njiraini N., Poole J. H., Sayialel K., Fishlock V. L. (2022). Cohort consequences of drought and family disruption for male and female African elephants. Behav. Ecol. 33 (2), 408–418. doi: 10.1093/beheco/arab148
Lemieux A. M., Clarke R. V. (2009). The international ban on ivory sales and its effects on elephant poaching in Africa. Br. J. Criminol. 49 (4), 451–471. doi: 10.1093/bjc/azp030
Maingi J. K., Mukeka J. M., Kyale D. M., Muasya R. M. (2012). Spatiotemporal patterns of elephant poaching in south-eastern Kenya. Wildlife Res. 39 (3), 234–249. doi: 10.1071/WR11017
McComb K., Moss C., Durant S. M., Baker L., Sayialel S. (2001). Matriarchs as repositories of social knowledge in African elephants. Science 292 (5516), 491–494. doi: 10.1126/science.1057895
Mijele D., Obanda V., Omondi P., Soriguer R. C., Gakuya F., Otiende M., et al. (2013). Spatio-temporal distribution of injured elephants in Masai Mara and the putative negative and positive roles of the local community. PloS One 8 (7), e71179. doi: 10.1371/journal.pone.0071179
Moss C. J. (2001). The demography of an African elephant (Loxodonta africana) population in amboseli, Kenya. J. Zool. 255 (2), 145–156. doi: 10.1017/S0952836901001212
Muboko N., Muposhi V., Tarakini T., Gandiwa E., Vengesayi S., Makuwe E. (2014). Cyanide poisoning and African elephant mortality in hwange national park, Zimbabwe: a preliminary assessment. Pachyderm 55, 92–94.
Mukeka J. M., Ogutu J. O., Kanga E., Røskaft E. (2018). Characteristics of human-wildlife conflicts in Kenya: Examples of tsavo and maasai Mara regions. Environ. Natural Resour. Res. 8 (3), 148–165. doi: 10.5539/enrr.v8n3p148
Mukeka J. M., Ogutu J. O., Kanga E., Røskaft E. (2019a). Human-wildlife conflicts and their correlates in narok county, Kenya. Global Ecol. Conserv. 18, e00620. doi: 10.1016/j.gecco.2019.e00620
Mukeka J. M., Ogutu J. O., Kanga E., Røskaft E. (2019b). Trends in compensation for human-wildlife conflict losses in Kenya. Int. J. Biodiversity Conserv. 11 (3), 90–113. doi: 10.5897/IJBC2019.1278
Mukeka J. M., Ogutu J. O., Kanga E., Røskaft E. (2020). Spatial and temporal dynamics of human–wildlife conflicts in the Kenya greater tsavo ecosystem. Human–Wildlife Interact. 14 (2), 14. doi: 10.26077/bf21-497e
Nelder J. A. (1994). The statistics of linear models: back to basics. Stat Computing 4 (4), 221–234. doi: 10.1007/BF00156745
Nellemann C., Formo R. K., Blanc J., Skinner D., Milliken T., De Meulenaer T. (2013). “Elephants in the dust-the African elephant crisis,” in UNEP, CITES, IUCN, TRAFFIC. Birkeland Trykkeri AS, Norway
Ngene S., Lala F., Nzisa M., Kimitei K., Mukeka J., Kiambi S., et al. (2017). Aerial total count of elephants, buffalo and giraffe in the tsavo-mkomazi ecosystem (February 2017) (Nairobi: Kenya Wildlife Service).
Ngene S., Mukeka J., Ihwagi F., Mathenge J., Wandera A., Anyona G., et al. (2013). Total aerial count of elephants, grevy’s zebra and other large mammals in laikipia-Samburu-Marsabit ecosystem in (November 2012) (Nairobi: Kenya Wildlife Service).
Ogada D. L. (2014). The power of poison: Pesticide poisoning of africa’s wildlife. Ann. New Y. Acad. Sci. 1322 (1), 1–20. doi: 10.1111/nyas.12405
Ogutu J. O., Kuloba B., Piepho H.-P., Kanga E. (2017). Wildlife population dynamics in human-dominated landscapes under community-based conservation: The example of nakuru wildlife conservancy, Kenya. PloS One 12 (1), e0169730. doi: 10.1371/journal.pone.0169730
Ogutu J. O., Owen-Smith N., Piepho H.-P., Said M. Y. (2011). Continuing wildlife population declines and range contraction in the Mara region of Kenya during 1977–2009. J. Zool. 285 (2), 99–109. doi: 10.1111/j.1469-7998.2011.00818.x
Ogutu J. O., Owen-Smith N., Piepho H.-P., Said M. Y., Kifugo S., Reid R. S., et al. (2013). Changing wildlife populations in Nairobi national park and adjoining athi-kaputiei plains: Collapse of the migratory wildebeest. Open Conserv. Biol. J. 7 (1), 11–26. doi: 10.2174/1874839201307010011
Ogutu J. O., Piepho H.-P., Dublin H. T., Bhola N., Reid R. S. (2008a). El Niño-southern oscillation, rainfall, temperature and normalized difference vegetation index fluctuations in the Mara-Serengeti ecosystem. Afr. J. Ecol. 46 (2), 132–143. doi: 10.1111/j.1365-2028.2007.00821.x
Ogutu J. O., Piepho H.-P., Dublin H. T., Bhola N., Reid R. S. (2008b). Rainfall influences on ungulate population abundance in the Mara-Serengeti ecosystem. J. Anim. Ecol. 77 (4), 814–829. doi: 10.1111/j.1365-2656.2008.01392.x
Ogutu J. O., Piepho H.-P., Said M. Y., Ojwang G. O., Njino L. W., Kifugo S. C., et al. (2016). Extreme wildlife declines and concurrent increase in livestock numbers in Kenya: What are the causes? PloS One 11 (9), e0163249. doi: 10.1371/journal.pone.0163249
Ogutu J. O., Reid R. S., Piepho H.-P., Hobbs N. T., Rainy M. E., Kruska R. L., et al. (2014). Large Herbivore responses to surface water and land use in an East African savanna: Implications for conservation and human-wildlife conflicts. Biodiversity Conserv. 23 (3), 573–596. doi: 10.1007/s10531-013-0617-y
Okello M. O., Lekishon K., Muteti D. M., Warinwa F., Kiringe J. W., Sitati W. S., et al. (2015). The status of key large mammals in the Kenya-Tanzania borderland: A comparative analysis and conservation implications. Int. J. Biodiversity Conserv. 7 (4), 270–279. doi: 10.5897/WBC2015.0818
Olindo P., Douglas-Hamilton I., Hamilton P. (1988). Tsavo elephant count 1988 (Ministry of Tourism, Kenya: Wildlife Conservation and Management Department). Available at: https://savetheelephants.org/wp-content/uploads/2016/11/1988Tsavocount.pdf.
Omondi P. O., Kanga E., Ngene S., Kyalo S., Kaka A., Muruthi P., et al. (2022). National Elephant Action Planfor Kenva 2022-2031. Published by theWildlife Research and Traumng Institute(WRTI) and Kenya Wildlife ServiceIS). ISBX 973-9914-742-29-9
Ottichilo W. K. (1987). The causes of the recent heavy elephant mortality in the tsavo ecosystem, Kenya 1975–1980. Biol. Conserv. 41 (4), 279–289. doi: 10.1016/0006-3207(87)90091-7
Owen-Smith N., Ogutu J. (2012). Changing rainfall and obstructed movements: Impact on African ungulates. Wildlife Conserv. Changing Climate 153, 153–178. doi: 10.7208/9780226074641-008
Parker I. S. (2004). What I tell you three times is true: conservation, ivory, history & politics. doi: 10.10'17/S00306053052101B9
Perry J. S. (1954). Some observations on growth and tusk weight in male and female African elephants. Proc. Zool. Soc. London 124, 97–104. doi: 10.1111/j.1096-3642.1954.tb01481.x
Pilgram T., Western D. (1986). Inferring the sex and age of African elephants from tusk measurements. Biol. Conserv. 36 (1), 39–52. doi: 10.1016/0006-3207(86)90100-X
Poole J. H., Thomsen J. B. (1989). Elephant are not beetles: implications of the ivory trade for the survival of the African elephant. Oryx 23 (4), 188–198. doi: 10.1017/S0030605300023012
Pratt D. J., Gwynne M. D. (1977). Rangeland management and ecology in East Africa (UK:Hodder and Stoughton). others.
Rasmussen H. B., Wittemyer G., Douglas-Hamilton I. (2005). Estimating age of immobilized elephants from teeth impressions using dental silicon. Afr. J. Ecol. 43 (3), 215–219. doi: 10.1111/j.1365-2028.2005.00571.x
Rouault M., Pohl B., Penven P. (2010). Coastal oceanic climate change and variability from 1982 to 2009 around south Africa. Afr. J. Mar. Sci. 32 (2), 237–246. doi: 10.2989/1814232X.2010.501563
Santiapillai C. (2009). African Elephants: Surviving by the skin of their teeth. Curr. Sci. 97 (7), 996–997.
Sarker A. R., Røskaft E. (2014). Perceptions of farmers in Bangladesh to Asian elephants (Elephas maximus) as an agricultural pest in. Environ. Natural Resour. Res. 4 (3), 23. doi: 10.5539/enrr.v4n3p23
SAS Institute Inc (2021). “Computer software,” in SAS system for windows (Version 9.4, SAS/STAT version 15.1) (Version 9.4) (Carey, NC, USA: SAS Institute Inc).
Schlossberg S., Chase M. J., Griffin C. R. (2018). Poaching and human encroachment reverse recovery of African savannah elephants in south-east Angola despite 14 years of peace. PloS One 13 (3), e0193469. doi: 10.1371/journal.pone.0193469
Schlossberg S., Gobush K. S., Chase M. J., Elkan P. W., Grossmann F., Kohi E. M. (2020). Understanding the drivers of mortality in African savannah elephants. Ecol. Appl. 30 (6), e02131. doi: 10.1002/eap.2131
Sikes S. K. (1966). "The African elephant, loxodonta africana: A field method for the estimation of age.". J. Zool. 150 (3), 279–295. doi: 10.1111/11469-79981966tb03009.x
The Wildlife Conservation and Management Act 2013 (2013) (Republic of Kenya). Available at: http://extwprlegs1.fao.org/docs/pdf/ken134375.pdf.
Thouless C. R. (1994). Conflict between humans and elephants on private land in northern Kenya. Oryx 28 (02), 119–127. doi: 10.1017/S0030605300028428
Thouless C. R., Dublin H. T., Blanc J. J., Skinner D. P., Daniel T. E., Taylor R. D., et al. (2016). African Elephant status report 2016. Update Afr. Elephant Database.
Thouless C. R., Sakwa J. (1995). Shocking elephants: Fences and crop raiders in laikipia district, Kenya. Biol. Conserv. 72 (1), 99–107. doi: 10.1016/0006-3207(94)00071-W
van Aarde R., Whyte I., Pimm S. (1999). “Culling and the dynamics of the Kruger national park African elephant population,” in Animal conservation forum, vol. 2. (UK:Cambridge University Press), 287–294.
Wasao S., El. Z., Ciera J., Nyokabi M. (2012). “Population dynamics, climate change, and sustainable development in Kenya,” in African Institute for development policy. Available at: https://www.afidep.org/download/AFIDEP-PAI-Kenya-Report.pdf. (Kenya:African institute of Development)
Wasser S. K., Mailand C., Booth R., Mutayoba B., Kisamo E., Clark B., et al. (2007). Using DNA to track the origin of the largest ivory seizure since the 1989 trade ban. Proc. Natl. Acad. Sci. 104 (10), 4228–4233. doi: 10.1073/pnas.0609714104
Wato Y. A., Heitkönig I. M., van Wieren S. E., Wahungu G., Prins H. H., van Langevelde F. (2016). Prolonged drought results in starvation of African elephant (Loxodonta africana). Biol. Conserv. 203, 89–96. doi: 10.1016/j.biocon.2016.09.007
Waweru F. K., Oleleboo W. L. (2013). Human-wildlife conflicts: The case of livestock grazing inside tsavo West national park, Kenya. Res. Humanities Soc. Sci. 19 (3), 60–67.
Waweru J., Omondi P., Ngene S., Mukeka J., Wanyonyi E., Ngoru B., et al. (2021). National wildlife census report. WRTI and KWS (Kenya: Naivasha and Nairobi).
Western D., Moss C., Georgiadis N. (1983). Age estimation and population age structure of elephants from footprint dimensions [Loxodonta africana]. J. Wildlife Manage. (USA) 47(4), 1192–1197. doi: 10.2307/3808191
Western D., Russell S., Cuthill I. (2009). The status of wildlife in protected areas compared to non-protected areas of Kenya. PloS One 4 (7), e6140. doi: 10.1371/journal.pone.0006140
Whitehouse A. M., Hall-Martin A. J. (2000). Elephants in addo elephant national park, south Africa: reconstruction of the population's history. Oryx 34 (1), 46–55. doi: 10.1046/j.1365-3008.2000.00093.x
Whitehouse A. M., Kerley G. I. (2002). Retrospective assessment of long-term conservation management of elephants in addo elephant national park, south Africa. Oryx 36 (3), 243–248. doi: 10.1017/S0030605302000455
Wildlife (Conservation and Management) Act (1989) (Republic of Kenya). Available at: http://extwprlegs1.fao.org/docs/pdf/ken7750.pdf.
Wittemyer G. (2001). The elephant population of samburu and buffalo springs national reserves, Kenya. Afr. J. Ecol. 39 (4), 357–365. doi: 10.1046/j.1365-2028.2001.00324.x
Wittemyer G., Daballen D., Douglas-Hamilton I. (2013). Comparative demography of an at-risk African elephant population. PloS One 8 (1), e53726. doi: 10.1371/journal.pone.0053726
Wittemyer G., Northrup J. M., Blanc J., Douglas-Hamilton I., Omondi P., Burnham K. P. (2014). Illegal killing for ivory drives global decline in African elephants. Proc. Natl. Acad. Sci. 111 (36), 13117–13121. doi: 10.1073/pnas.1403984111
Wolfgang F. (2010) Demographic transition and growth in Kenya. Available at: https://www.worldbank.org/en/news/opinion/2010/04/28/demographic-transition-growth-kenya.
World Population Review. Available at: http://worldpopulationreview.com/countries/kenya-population/.
Zhou X., Wang Q., Zhang W., Jin Y., Wang Z., Chai Z., et al. (2018). Elephant poaching and the ivory trade: The impact of demand reduction and enforcement efforts by China from 2005–2017. Global Ecol. Conserv. 16, e00486. doi: 10.1016/j.gecco.2018.e00486
Zimbabwe Parks and Wildlife Management Authority (2015a) Zimbabwe National elephant management plan, (2015-2020). Available at: https://conservationaction.co.za/resources/reports/zimbabwe-national-elephant-management-plan-2015-2020/.
Zimbabwe Parks and Wildlife Management Authority (2015b) Zimbabwe National elephant management plan, (2015-2020). Available at: https://conservationaction.co.za/resources/reports/zimbabwe-national-elephant-management-plan-2015-2020/.
Keywords: elephant ivory poaching, human-elephant conflict, mortality probability, mortality rate, Proportion of Illegally Killed Elephants (PIKE), climate change, human and livestock population growth, elephant range contraction
Citation: Mukeka JM, Ogutu JO, Kanga E, Piepho H-P and Røskaft E (2022) Long-term trends in elephant mortality and their causes in Kenya. Front. Conserv. Sci. 3:975682. doi: 10.3389/fcosc.2022.975682
Received: 22 June 2022; Accepted: 11 August 2022;
Published: 09 September 2022.
Edited by:
Christian Kiffner, Leibniz Center for Agricultural Landscape Research (ZALF), GermanyReviewed by:
Phyllis Lee, University of Stirling, United KingdomFrancesca Parrini, University of the Witwatersrand, South Africa
Copyright © 2022 Mukeka, Ogutu, Kanga, Piepho and Røskaft. This is an open-access article distributed under the terms of the Creative Commons Attribution License (CC BY). The use, distribution or reproduction in other forums is permitted, provided the original author(s) and the copyright owner(s) are credited and that the original publication in this journal is cited, in accordance with accepted academic practice. No use, distribution or reproduction is permitted which does not comply with these terms.
*Correspondence: Eivin Røskaft, eivin.roskaft@ntnu.no