Designing understandable, action-oriented, and well-perceived earthquake risk maps—The Swiss case study
 Irina Dallo1*
  Laura N. Schnegg2
  Michèle Marti1 Donat Fulda3 Athanasios N. Papadopoulos1 Philippe Roth1
  Laurentiu Danciu1 Nadja Valenzuela1 Simon R. Wenk1
  Paolo Bergamo1 Florian Haslinger1 Donat Fäh1 Philipp Kästli1 Stefan Wiemer1
- 1Department of Earth Sciences, Swiss Seismological Service, Eidgenössische Technische Hochschule Zurich, Zürich, Switzerland
- 2Transdisciplinarity Lab, Department of Environmental System Sciences, Eidgenössische Technische Hochschule Zurich, Zürich, Switzerland
- 3Department of Earth Sciences, Georesources Switzerland Group, Eidgenössische Technische Hochschule Zurich, Zürich, Switzerland
With seismic risk assessments becoming more available and reliable over the last years, the need to communicate seismic risk emerged. Seismic risk allows people to understand what impacts earthquakes can have and how they could affect their lives. In Switzerland, a nation-wide seismic risk model (ERM-CH23) was published in 2023 demanding sophisticated communication products to inform about its results. Since only limited research has been conducted on how to best communicate earthquake risk information to societies including the general public, key elements of the outreach activities were tested before the model release. To this end, we, an interdisciplinary group, conducted a nationwide survey in Switzerland in December 2022 to test different earthquake risk map designs by varying the color scale and the legend type. We analyzed the effects of the map and legend design on people's correct interpretation of the risk information, perceived usefulness, risk perception, and motivation to take action. Our survey revealed that (i) a legend with the combination of qualitative and quantitative labels leads to more accurate interpretations of the information presented on the map and is preferred by the public; (ii) the color scale determines how people perceive the spatial risk; and (iii) personal factors influence people's interpretation skills, risk perception, and intention to take action. Our study thus provides insights and recommendations on how to best design user-centered earthquake risk maps as a key outreach product to ensure their effective use by the public, consequently enhancing society's resilience to earthquakes in the long term.
1 Introduction
Earthquakes pose a serious threat to many countries around the world (Crowley et al., 2021), as the devastating Türkiye-Syria earthquake sequence on February 6th, 2023, reminded us. How well societies can cope with earthquakes depends on the vulnerability, accumulation, and distribution of assets as well as on individual and communal preparedness (Poljansek et al., 2019). Therefore, seismic risk assessments are critical to evaluate the potential impact of earthquakes on buildings and the associated financial and human losses in a region. They enable societies to strengthen their risk management and to establish mitigation measures such as updated building codes or emergency plans.
Seismic risk is calculated based on four factors: (1) earthquake hazard; (2) local subsoil; (3) building vulnerability; and (4) affected people and assets. Earthquake hazard is the expected strength of ground shaking and indicates where an earthquake is most likely to occur (Danciu et al., 2021). The factor local subsoil considers the local amplification effects due to different subsoils, e.g., shaking at soft-sediment sites can be up to 10 times stronger than on solid-rock outcrops (Bergamo et al., 2023). Building vulnerability describes the estimated damage to buildings and their contents and the resulting economic losses due to earthquakes of different sizes. And last, the factor affected people and assets encompasses the spatial distribution and extent of the residential, commercial, and industrial building stock including the people occupying these buildings (e.g., densely populated areas have a greater earthquake risk). The United Nations Office for Disaster Risk Reduction (UNDRR) further considers capacity as an integral part of risk, thus societies' preparedness and ability to respond to risk. Although this factor is important, it is currently not included in the calculation of seismic risk.
To bring the scientific results of earthquake risk assessments to societal stakeholders, well-designed risk communication is needed (Musacchio and Solarino, 2019). Risk communication is the exchange and interaction of individuals, societal groups, and institutions in the process of determining, analyzing, and managing risk (Cho et al., 2014; Piangiamore et al., 2021) on a local, regional, national, and international level (Höppner et al., 2010). Risk communication thereby has various aims, among others, to increase people's knowledge about the risks in their region (Dransch et al., 2010), raise awareness (Bodoque et al., 2019), and encourage people to take protective actions (Höppner et al., 2010). An effective risk communication strategy thus can improve societies' resilience (Bodoque et al., 2019). Especially in regions with moderate earthquake risk, risk communication is key since people's preparedness is lower than in high-risk regions where people frequently experience earthquakes (Sechi et al., 2022).
Not only professional societal stakeholders but also the general public should be the target of risk communication (Dransch et al., 2010). Such communication is most effective if it considers the target audiences' attitudes, needs, preferences, and abilities (Dallo et al., 2022b). For example, people's numeracy skills (Bodemer and Gaissmaier, 2012), their levels of trust in different information sources (Goldman et al., 2023), and their risk perception (Lechowska, 2018) influence how they understand and process information. Moreover, due to the fact that people have different preferences and abilities to understand certain formats (Kreuzmair et al., 2017; Becker et al., 2019), a palette of different communication products is recommended (e.g., maps, textual information, explainer video, or interactive tools). And since preferences and needs change over time, the communications should be periodically re-assessed (van der Bijl-Brouwer and Dorst, 2017).
Past studies addressing communication about earthquakes have mainly focused on hazard maps (e.g., Marti et al., 2019), earthquake early warning (e.g., Becker et al., 2020; Dallo et al., 2022a), post-alert messaging (McBride et al., 2020), information campaigns (Marti et al., 2020), or evacuation behaviors (Vinnell et al., 2022). In comparison, research on earthquake risk communication is rare (e.g., Ickert and Stewart, 2016; Karjack et al., 2022), especially when designing earthquake risk maps. With our case study in Switzerland, we aim to contribute to ongoing research efforts on seismic risk communication (Musacchio et al., 2023), with a special focus on the product design of the first publicly available earthquake risk model of Switzerland (Papadopoulos et al., 2023; Wiemer et al., 2023).
In Switzerland, earthquakes are the natural hazard with the highest damage potential (FOCP, 2020): Over a period of 100 years, an earthquake can be expected to cause on average economic damage of CHF 11 to 44 billion to buildings and their content, leading to up to 1,600 people losing their lives and 40,000 to 175,000 people becoming homeless on a short- or long-term basis (Wiemer et al., 2023). The rapid impact assessments and scenarios that we developed in collaboration with federal and cantonal authorities and tested with the public (Marti et al., 2023), have shown that seismic risk information plays a crucial role in raising public awareness and preparedness for earthquakes, as the risk information products strongly motivated participants to take protective measures. Additionally, this study has shown that prior user testing and evaluation are necessary, as there is no guarantee that common practices from other countries are properly understood by the public and professionals. An online tool allowing to assess approximately the individual risk further helps to raise people's awareness and to answer questions about individual consequences.
Another key product for public outreach are risk maps. Our past studies where we tested the Swiss hazard map (Marti et al., 2019) and the European seismic risk map (Dallo et al., 2023) revealed that the map design, such as the choice of the color scale, influences how people perceive the hazard and risk, if they feel personally affected and are triggered to take protective actions. For instance, specific color scales enable individuals to more effectively differentiate between hazardous from less hazardous areas (Marti et al., 2019). We thus tested the first publicly available Swiss earthquake risk map which was the key product for the media release as the about ~15 reports on TV or radio, ~20 articles in print media and ~25 online articles on the release day showed. In several of these articles, the earthquake risk map was an essential element (e.g., Laukenmann et al., 2023) as well as in the main news broadcast covering what is beyond the headlines (10 vor 10, 2023), which confirmed its relevance.
To this end, an interdisciplinary team of communication specialists, map designers, seismologists, and social scientists developed different versions of the earthquake risk map, varying the color scale and the legend type, based on best practices and previous evaluations of hazard (Marti et al., 2019) and risk maps (Dallo et al., 2023) and earthquake risk scenarios (Marti et al., 2023). The designs were tested in an online survey applying a between-subjects experiment with a representative sample of the German and French speaking population of Switzerland (N = 593). We assessed which map version performs best in terms of people's correct interpretation, perceived usefulness, risk perception, and motivation to take protective action. Further, we analyzed whether certain social groups (e.g., house owners) have specific preferences, tailoring the outreach materials to their needs. The survey thus allowed us to choose the map version, which is not only visually appealing to the public, but also communicates the earthquake risk of Switzerland in an understandable and action-oriented way. Our insights and derived recommendations shall support other institutions responsible for public risk communication to design effective user-centered products. We argue that our approach and the resulting insights are transferable to any other natural and human-made hazard.
2 Materials and methods
We followed a transdisciplinary approach when designing and testing the earthquake risk map (Lang et al., 2012) to ensure that it can effectively contribute to disaster risk reduction (Ismail-Zadeh et al., 2017). To this end, the map versions for the testing were co-designed by an interdisciplinary team (Section 2.1) and then tested with the general public (Section 2.2). This with the goal in mind that the earthquake risk map as a central communication product fulfills people's preferences, is correctly interpreted, and triggers them to take protective actions.
2.1 Materials
2.1.1 Background
Carefully designed maps can be an effective (Thompson Clive et al., 2021), accepted (Becker et al., 2019), and approved (Marti et al., 2019) way to display natural hazards and risks. Risk maps can support the development of emergency plannings (Fuchs et al., 2009), improve trust in the given information (Henstra et al., 2019), and increase risk awareness (Dransch et al., 2010). Some studies further showed that maps are better understood than text-based communication (Bostrom et al., 2008; Cao et al., 2016). In comparison, cartographic elements, such as the color scale, data classes or legends, are often poorly used and consequently confuse or mislead the interpretation (Kunz and Hurni, 2011; Marti et al., 2019).
An evaluation of the Swiss seismic hazard map published in 2015 showed that applying best practices in map design successfully supports people in distinguishing hazardous from less hazardous areas (Marti et al., 2019). The testing of the European earthquake risk map released in 2022 further revealed that key elements of how the risk is perceived and is interpreted are the color scale and the information in the legend (e.g., quantitative vs. qualitative labels) (Dallo et al., 2023). We thus decided to focus the testing on the coloring of the earthquake risk map and the legend.
Regarding the choice of a color scale, if poorly chosen, it can impede understanding (Peterson, 2020), lead to data manipulation, neglect color vision deficiencies, and may not communicate the same information when printed in black and white (Crameri et al., 2020). Therefore, we considered the following issues when choosing the color scales for the testing (Brewer, 2006; Bostrom et al., 2008; Crameri et al., 2020; Peterson, 2020; Schneider et al., 2022): (i) people are not able to distinguish between more than five shades of the same color hue; (ii) low-to-high values should be visualized using light-to-dark color with hue variation; (iii) color perception has cultural variability; (iv) color contrast helps users to distinguish between different features and the background; (v) the amount of used colors for the other elements of a map layout (e.g., north arrow) should be minimized as much as possible; and (vi) color vision deficiency must be considered (e.g., accompany color-coded information with other cues such as symbols, test the color scales with a color blindness simulator).
The second crucial map element is the legend (Golebiowska, 2015; Edler et al., 2020), since it allows users to decode the visual information of the map (Dransch et al., 2010; Golebiowska, 2015; Edler et al., 2020). Especially when presenting statistical data (on maps), explanatory text information is essential for interpreting the data and for effective decision-making (Peters et al., 2009). The legend, for example, shows the boundary values of the displayed categories and therefore helps to understand the map (Herrmann and Pickle, 1996). In general, a legend should include the color and symbol details of the map elements (Peterson, 2020). Further must the interval categories be distinguishable (Herrmann and Pickle, 1996). A good legend should only contain the most important information to not overwhelm users (Cao et al., 2016). With regards to their placement, legends should also be positioned close to the map element they are associated with (Peterson, 2020). Fuchs et al. (2009) concluded in their study that the legend should be placed at the right side of the main map. Gaspar-Escribano and Iturrioz (2011) recommend qualitative legends for the public as they are easy to understand and quantitative labels for professional users to add detailed information.
2.1.2 Map designs testing
For the testing, preliminary values of the earthquake risk map of Switzerland were depicted in three color-blind friendly scales variants: a blue-violet-red scale, used and tested for the European earthquake risk map (Crowley et al., 2021), a blue-yellow-red scale (remark: black-white version not satisfactory), and a blue-brown-red scale; see Figures 1A–C. Further, we designed six legend types, combining qualitative labels, index values, and quantitative values; see Figures 2A–F and Supplementary material S1. In total, we tested 18 earthquake risk map-legend combinations (3 color scales x 6 legend types); see Supplementary material S2. All map variants depicted hill shades, as preferred by the end-users in the European context (Crowley et al., 2021; Dallo et al., 2023) as well as relevant city names, rivers, and lakes to facilitate geographical orientation (Marti et al., 2019). Thereby, we made sure that the hill shades did not intensify the colors at certain places where it should not.
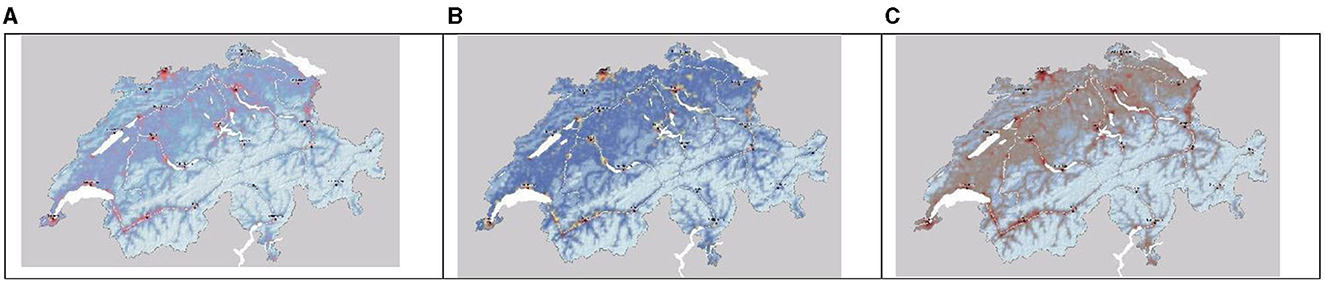
Figure 1. (A) Blue-violet-red color scale [Versions 1–6]. (B) Blue-yellow-red color scale [Versions 1–6]. (C) Blue-brown-red color scale [Versions 1–6].
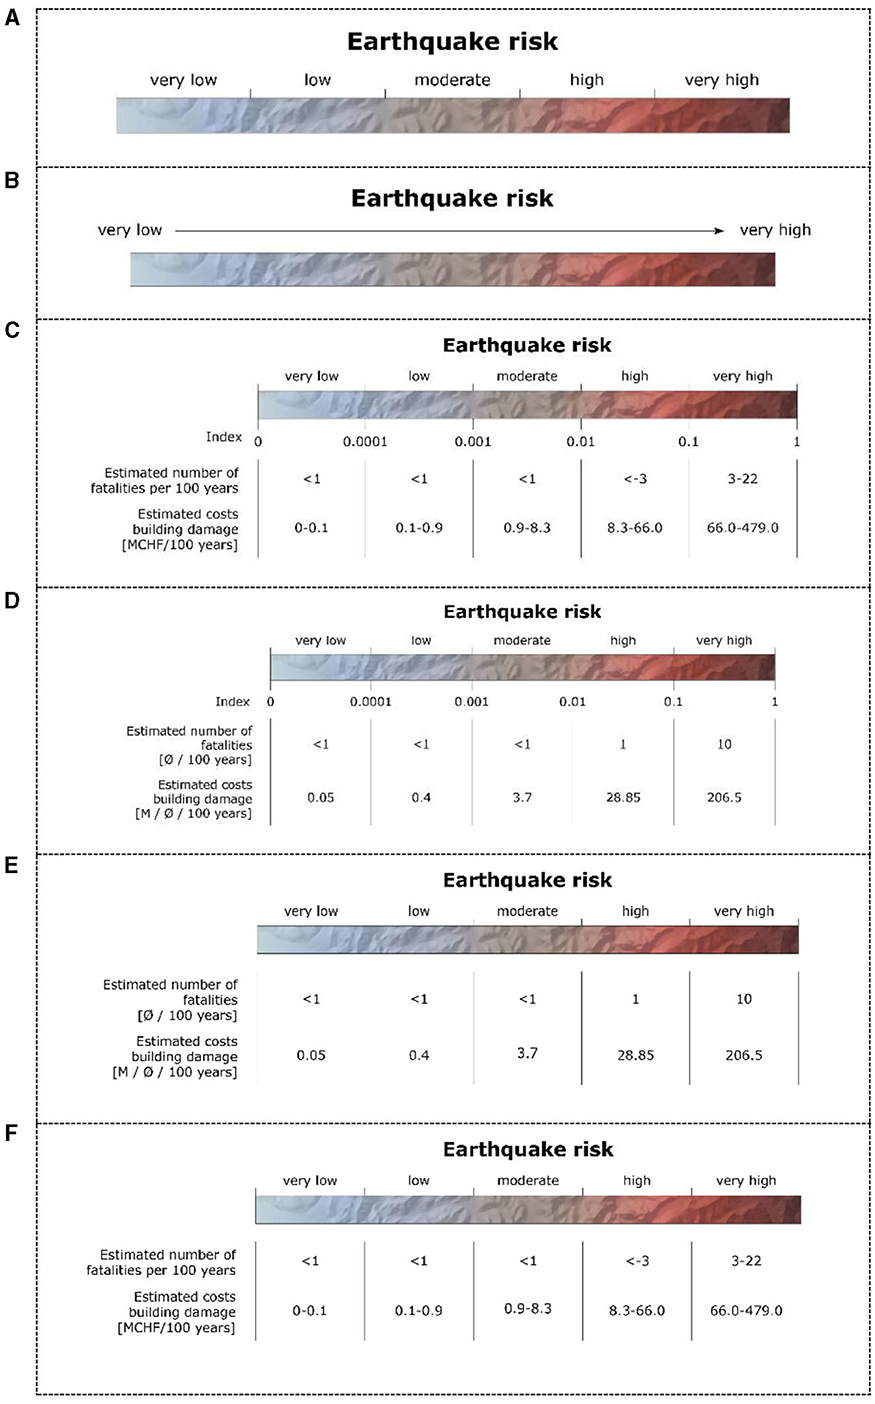
Figure 2. (A) Legend Version 1 [qualitative with categories]. (B) Legend Version 2 [qualitative with arrow]. (C) Legend Version 3 [quantitative with index and value ranges]. (D) Legend Version 4 [quantitative with index and mean values]. (E) Legend Version 5 [quantitative with mean values]. (F) Legend Version 6 [quantitative with value ranges].
2.2 Methods—online survey
We conducted an online survey with a between-subjects experiment in Switzerland's German- and French-speaking regions from December 29th 2022 to January 9th 2023. The survey was programmed in Unipark and pre-tested in order to improve the clarity of the questions and the technical functionalities. The participants were recruited through the ISO-accredited polling company Bilendi. We used quota sampling with quotas based on language, age, and gender, representing the population of Switzerland. In total, 1,099 people were recruited with an answer rate of 54.8% (602 answers). Due to short answer durations and the failure of the quality check, we had to exclude nine participants (Leiner, 2019). The survey was approved by the Ethics Committee of ETH Zurich (EK 2022-N-235).
2.2.1 Survey design and analysis
The survey consisted of six question blocks (QB), where we consistently used 5-point Likert scales where appropriate (Likert, 1932). The German, French, and English survey versions are listed in Supplementary material S3 and the overview of the independent and dependent variables in Supplementary material S4–S6. In the following, the content of the questions blocks is presented: QB1 started with the consent form and the quota questions (age, gender, language), followed by questions with regards to participants' earthquake experiences (adapted from Dallo et al., 2022a) and general earthquake knowledge. In QB2, we assessed participants' understanding of earthquake risk, their risk awareness, and risk perception. By risk awareness we mean the objective understanding and recognition of the existence of risks, while by risk perception we mean the opinions and subjective evaluation or assessment of risks by people, which are influenced by their emotions, beliefs and experiences (Slovic, 1987). To this end, we first let participants describe in their own words what earthquake risk means. To measure risk awareness, we asked participants how high they perceive the earthquake risk in the entire country, at their place of living and for them personally (adapted from Marti et al., 2019). The variable showed sufficient internal consistency (Cronbach's alpha = 0.62, N = 3). Risk perception was measured with the following question: “Earthquakes…” (a) endanger my personal safety; (b) endanger the safety of my family; (c) limit my quality of life; (d) are difficult for me to control; (e) cause financial losses for me; and (f) cause a general fear in me (Ho et al., 2008); showing good internal consistency (Cronbach's alpha = 0.87, N = 6).
In QB3, we conducted the between-subjects experiment, whereby participants were randomly assigned to one of the 18 earthquake risk map/legend versions. First, with an open question we asked participants to describe what they see on the map (Marti et al., 2019). Using three question sets, we then explored their correct interpretation of the information provided on the map and the legend, their general design perception, and their perceived usefulness of the map elements. The design perception variable—how useful, trustworthy, understandable, clearly arranged, informative, and appealing the map is—showed excellent internal consistency (Cronbach's alpha = 0.90, N = 6).
In QB4, we again measured participants' risk awareness with the same question as previously used in QB2 to identify any changes. Further, we assessed their intention to take protective actions (Cronbach's alpha = 0.92, N = 10), their perceived usefulness of the risk map for different societal stakeholders (Cronbach's alpha = 0.84, N = 4), and their preferences with regards to further information related to earthquake risk. In QB5, the participants saw all three map versions as well as the six legend types and were asked to select, for both, which version they prefer. In QB6, we inquired participants' gender, age, place of living, highest educational degree, work situation, housing condition (owner or not), earthquake insurance, and their self-perceived numeracy skills (Cronbach's alpha = 0.91, N = 4; Fagerlin et al., 2007). In the middle of the survey, we also had an attention question to make sure that participants are carefully reading the questions.
We used SPSS for the descriptive analyses (M = mean and SD = standard deviation) and the significance tests of the quantitative data. Several one-way analyses of variances (ANOVAs) also known as F-tests, t-tests and linear regressions were conducted to determine the effect of the independent variables map design (map and legend versions) and the personal factors on the dependent variables, namely participants' design and information preferences, correct interpretation, intention to take action, risk awareness, and perceived usefulness of the earthquake risk map. We used Bonferroni post-hoc tests to compare pairwise whether these differences were significant. A p-value of 0.05 or lower was considered statistically significant and to determine the internal consistency of scales we used Cronbach's alpha (Bland and Altman, 1997). The free-response answers were categorized and analyzed following an inductive research procedure (Corbin and Strauss, 2008).
2.2.2 Sample
The 593 participants ranged in age from 19 to 86 years (M = 47.7, SD = 16.4). 49.8% were female and 50.2% male. Further, 27.0% spoke French and 73.0% German. Most participants worked full-time (43.7%) or part time (17.9%), or were retired (19.9%). Most participants lived in the canton of Zurich (16.2%) followed by the canton of Bern (12.1%), canton of Vaud (9.4%), and canton of St. Gallen (6.6%). The majority indicated to live in the countryside (37.3%) followed by the city (33.2%), and agglomeration (29.0%). Concerning the housing conditions, most participants lived in a rented apartment/house (61.1%) or in their own apartment/house (37.3%). 11.1% of the participants have an earthquake insurance, 41.8% have none, and 47.1% do not know. Participants who own their home had significantly more often an earthquake insurance compared to those renting. The detailed characteristics of the participants are listed in Supplementary material S4.
3 Results
The results are divided into three sections: (i) general attitudes, knowledge, and preferences regarding earthquake risk (maps); (ii) the influence of the map design on the correct interpretation of the information presented, intention to take actions, and design perception; and (iii) the role of the personal factors. The underlying data and results are listed in Supplementary material S4–S15.
3.1 General attitudes, knowledge, and preferences regarding the earthquake risk (maps)
3.1.1 Attitudes
Participants thought that the earthquake risk map is helpful for various stakeholders, in particular for emergency services (M = 3.9, SD = 1.1), authorities (M = 3.8, SD = 1.0), and companies (M = 3.4, SD = 1.1). The lowest benefit was seen for them personally (M = 3.1, SD = 1.1). Moreover, the design of the map was well perceived (M = 3.8, SD = 0.8); see Supplementary material S13. Participants especially assessed the earthquake risk map as understandable (M = 4.0, SD = 1.0), informative (M = 3.9, SD = 1.0), and clear (M = 3.9, SD = 1.0). However, the map could be more appealing (M = 3.5, SD = 1.0). In comparison, participants' intention to take the proposed protective measures was rather low (M = 2.5, SD = 0.9); see Figure 3 and Supplementary material S14. Further, their risk awareness did not significantly change before and after the participants saw the risk map (Supplementary material S6).
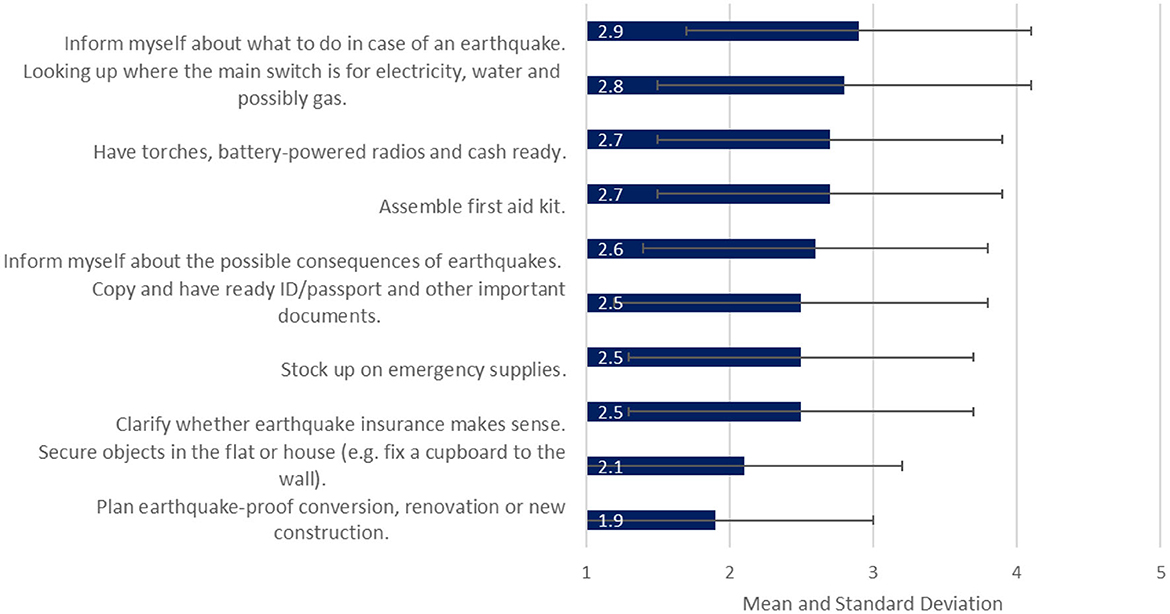
Figure 3. Participants' intention to take actions after seeing the earthquake risk information, ranging from 1 = very unlikely to 5 = very likely.
3.1.2 Knowledge
In the survey we had three question sets to assess participants' knowledge about earthquakes in general and what earthquake risk is, as well as their correct interpretation of the information provided on the risk map and the legend.
Regarding the knowledge about earthquakes in general, participants answered around three out of eight questions correctly (M = 2.6, SD = 1.1; Supplementary material S7). The majority of the participants knew that damaging earthquakes can occur in Switzerland (n = 496). However, only 16.0% identified that the statement “Strong earthquakes are only to be expected in the Valais and the Basel region” is incorrect. Strong earthquakes can occur anywhere in Switzerland. Explanatory material must therefore clearly state that earthquakes can occur anywhere, including strong events. Further, they struggled with the question about the frequencies of damaging earthquakes in Switzerland and its immediate neighboring regions; only 21.2% of the participants correctly stated that within 50 to 150 years such an event could occur.
Although 51.4% of the participants indicated that they think they know what earthquake risk is, the qualitative analysis of their descriptions of earthquake risk revealed the opposite (Supplementary material S9). The majority wrongly interpreted that it describes the chance/possibility of an earthquake to occur (n = 312), as the following statement represents: “[Earthquake risk is the] probability that a strong earthquake occurs”. About a fifth indicated that the risk represents the expected damages (n = 75) and that the risk locally differs (n = 74). Only three participants correctly stated that earthquake risk is the combination of earthquake hazard, exposure, local subsoil, and vulnerability.
Regarding the correct interpretation of the earthquake risk map, we had a question block with correct and wrong statements and an open question where participants were asked to describe in their own words what they saw. Regarding the interpretation questions, participants on average answered 5 out of 9 questions correctly (see Supplementary material S12). They misinterpreted the red areas as being most at risk for future earthquakes to occur, which would be hazard, and not as having high levels of seismic risk due to exposure, vulnerability, local subsoil, and hazard (29.5% correct answers). Further, participants wrongly interpreted that cities or villages which are in blue areas do not have to expect severe damages (25.6% correct answers), which cannot be excluded. A similar misinterpretation was that there were regions in Switzerland without any earthquake risk (41.8% correct answers). What participants did well was the evaluation of the risk level of selected cities, indicating the correct interpretation of the legend (see Supplementary material S6).
Regarding participants' descriptions of what they saw on the earthquake risk map (Supplementary material S8), the majority correctly mentioned that areas colored in red have a high risk (n = 139) and cities with high population density seemed to have the highest earthquake risk (n = 123). Further, many people explained that the map showed the earthquake risk for all locations in Switzerland (n = 111) and that the risk was a combination of the estimated number of fatalities and estimated costs of building damage (n = 94). Participants who saw a legend type including the quantitative information mentioned more often that the map showed the “number of fatalities and financial losses based on building damages” than those who only saw one of the qualitative legends. The regions and cities most mentioned to have high risk levels were the city of Basel (n = 71), the canton of Valais (n = 51), the city of Zurich (n = 32), and the city of Geneva (n = 28). Furthermore, the map with the color scale “blue-brown-red” (n = 32) led, compared to the other color scales, more often to the true interpretation that the Central Plateau has a moderate earthquake risk.
3.1.3 Preferences
The participants ranked the map elements (Supplementary material S10) according to their perceived importance as follows: map of Switzerland (M = 4.2, SD = 0.9), coloring and the labeling of localities (both: M = 4.1, SD = 0.9), the legend (M = 4.0, SD = 1.0), the caption of the legend (M = 3.9, SD = 1.0), and the title (M = 3.8, SD = 1.0). The further information participants would find useful is listed in Figure 4.
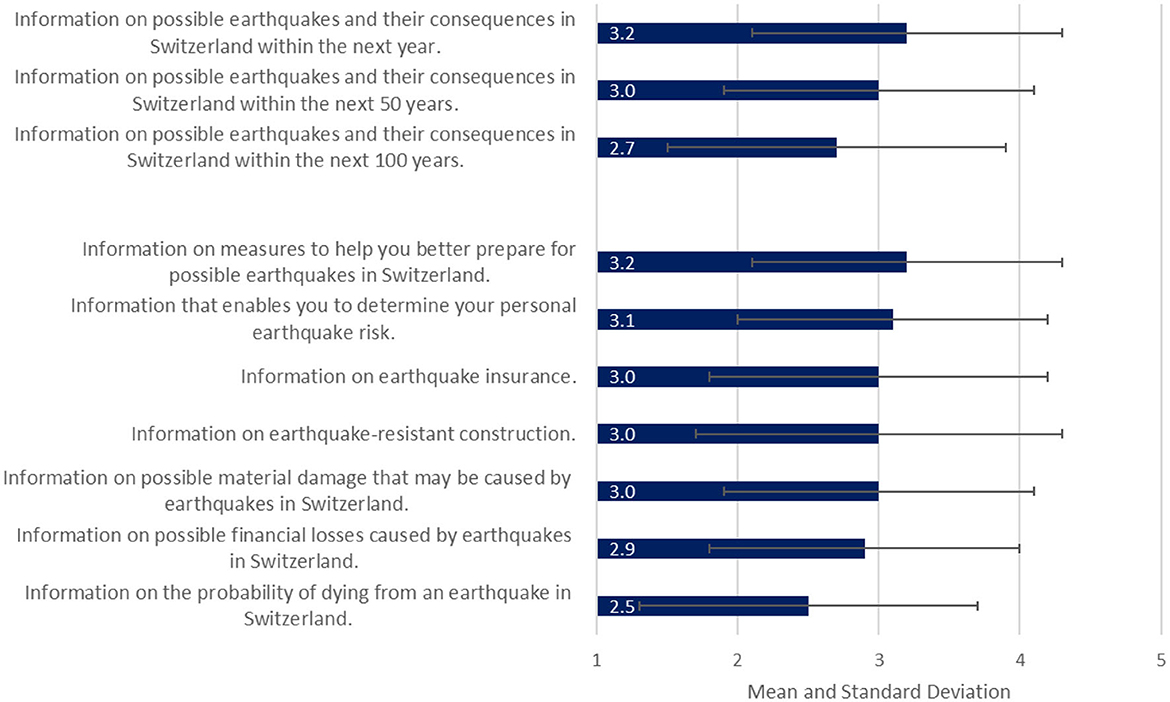
Figure 4. Participants' perceived usefulness of further information elements, from 1 = not useful at all to 5 = very useful.
3.2 The role of the map design
3.2.1 The influence of the color scale
The color scale versions did not influence participants' correct interpretation of the information provided on the risk map [F(2, 580) = 0.071, p = 0.931] nor their general design perception (Table 1). In comparison, the blue-brown-red color scale map triggered people most to take actions [F(2, 580) = 5.07, p =0.007], and, when displayed next to each other, was preferred by the majority (42.7%). Further, the qualitative analysis of participants' descriptions on what they saw on the risk map showed that the blue-brown-red map version supported participants more often to correctly understand that all of the Central Plateau has elevated levels of risk and not only the cities.
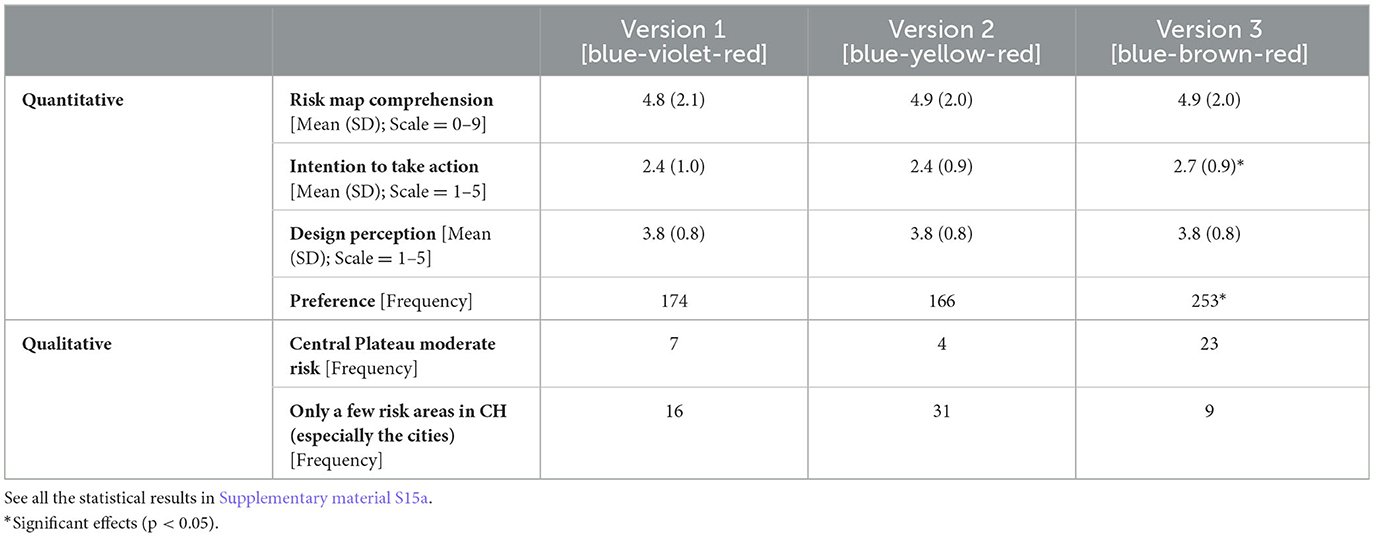
Table 1. Differences between the color scale versions divided into the quantitative (risk map comprehension, intention to take action, design perception, and preference) and qualitative (written description of what they see on the map) evaluations.
3.2.2 The influence of the legend type
The legend type had no influence on participants' correct interpretation of the map and the legend content nor on the intention to take actions or the general design perception (Table 2). However, the legend versions with the 5-point qualitative labels and mean values or range values (with and without the index) increased participants' understanding of the meaning of the risk categories (low to high). When presented next to each other, participants preferred the legend versions with a combination of the qualitative and quantitative values over the versions with only qualitative information. Additionally, the qualitative analysis of the open question further showed that by indicating quantitative values people could better describe in their own words what was shown on the risk map: “This is a map of Switzerland showing the earthquake risk by location on a scale from 0 (low) to 1 (high) and the human and material damage it can cause....”.
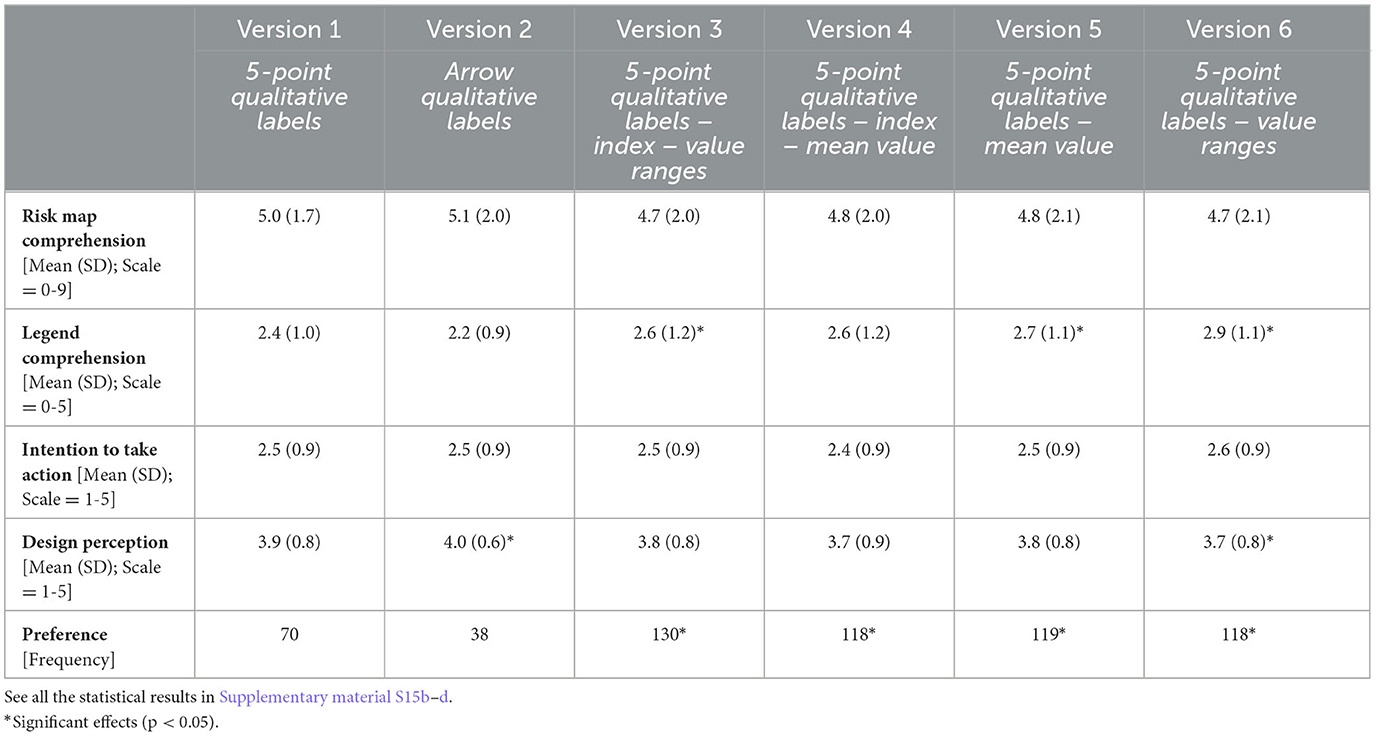
Table 2. Differences between the legend type regarding comprehension of the information on the map, legend comprehension, intention to take action, and design perception.
3.3 The role of personal factors
In Sections 3.3.1 to 3.3.5, we discuss the significant effects of participants' personal factors on the perceived usefulness of the risk map for different stakeholders, correct information of the map, intentions to take actions, risk awareness, and general design perception (Supplementary material S11a–d).
3.3.1 Perceived usefulness for different stakeholders
Several one-way ANOVAs showed significant effects for the factors earthquake insurance [F(2, 586) = 3.09, p = 0.046] and past earthquake experience [F(5, 583) = 3.54, p = 0.004]. The Bonferroni post-hoc tests showed that participants who stated to have an earthquake insurance significantly found the earthquake risk map more useful for various stakeholders than participants without an earthquake insurance. Further, participants who mentioned having already felt a moderate earthquake found it more useful than participants who never felt an earthquake. Further, linear regressions showed that, both, participants' numeracy skills [F(1, 587) = 5.78, p = 0.017] and age [F(1, 587) = 9.19, p = 0.003], had an influence on their perceived usability for different stakeholders. The higher participants' numeracy skills (B = 0.09, p ≤ 0.001, R2 = 0.10) and the older a participant, the higher was his/her perceived usability (B = 0.01, p = 0.003, R2 = 0.12).
3.3.2 Correct interpretation of the earthquake risk map
Several significant effects were identified. First, men answered significantly more questions correctly than women [t(581) = −2.04, p = 0.042, d = −0.17]. Second, participants with a university degree answered significantly more questions correctly than those with a compulsory education or a federal diploma of vocational education and training [F(9, 573) = 5.51, p = < 0.001]. Third, the higher participants' numeracy skills, the more questions they answered correctly (B = 0.41, p < 0.001, R2 = 0.20). Fourth, older participants answered significantly more questions correctly than younger ones (B = 0.002, p < 0.001, R2 = 0.03). The other personal factors showed no significant effects.
3.3.3 Intention to take protective actions
T-test results showed a significance with a medium effect size for profession [t(581) = 2.45, p = 0.015, d = 0.64]; namely participants who are confronted professionally with earthquakes take significantly more protective actions than those who have no touching points. Further, participants who had already at least moderately felt an earthquake had significantly higher intentions to implement the proposed measures than those who had never experienced an earthquake [F(5, 58) = 2.40, p = 0.036]. The other personal factors showed no significant effects.
3.3.4 Risk awareness
The only significant effect was found for participants' place of residence [F(2, 583) = 5.14, p = 0.006]. The Bonferroni post-hoc test showed that participants living in the agglomeration (M = 3.4, SD = 1.3) perceived the seismic risk for the different areas of Switzerland significantly higher than those living in the city (M = 3.0, SD = 1.2) or countryside (M = 3.0, SD = 1.3). The other personal factors showed no significant effects.
3.3.5 Design perception
The one-way ANOVA showed significant values within the age categories [F(4, 581) = 4.10, p = 0.003]. The Bonferroni post-hoc test revealed that the age groups “55-66” and “67-100” (55–66 years: M = 3.9, SD = 0.9, p = 0.044; 67–100 years: M = 4.0, SD = 0.8, p = 0.002) perceived the earthquake risk map better than participants between 31 and 42 years (M = 3.6, SD = 0.8). The other personal factors showed no significant effects.
4 Discussion
In Section 4, we provide the best practice for the earthquake risk map of Switzerland (Section 4.1) and relevant insights for information campaigns (Section 4.2). Further, we discuss the limitations of our study and future research directions (Section 4.3).
4.1 The earthquake risk map—Swiss best practice
Choosing an appropriate color scale is not a trivial task (Schneider et al., 2022) and requires end-user testing (Marti et al., 2019). Our results show that, although the color scale of the European Seismic Risk Map worked well for university students (Dallo et al., 2023), the Swiss public preferred another color scale (see Figure 5). This color scale was not only preferred by the participants, but also motivated them most to take actions and led to the correct interpretation that all of the Swiss Plateau has an elevated earthquake risk and not only the cities and places close to rivers and lakes.
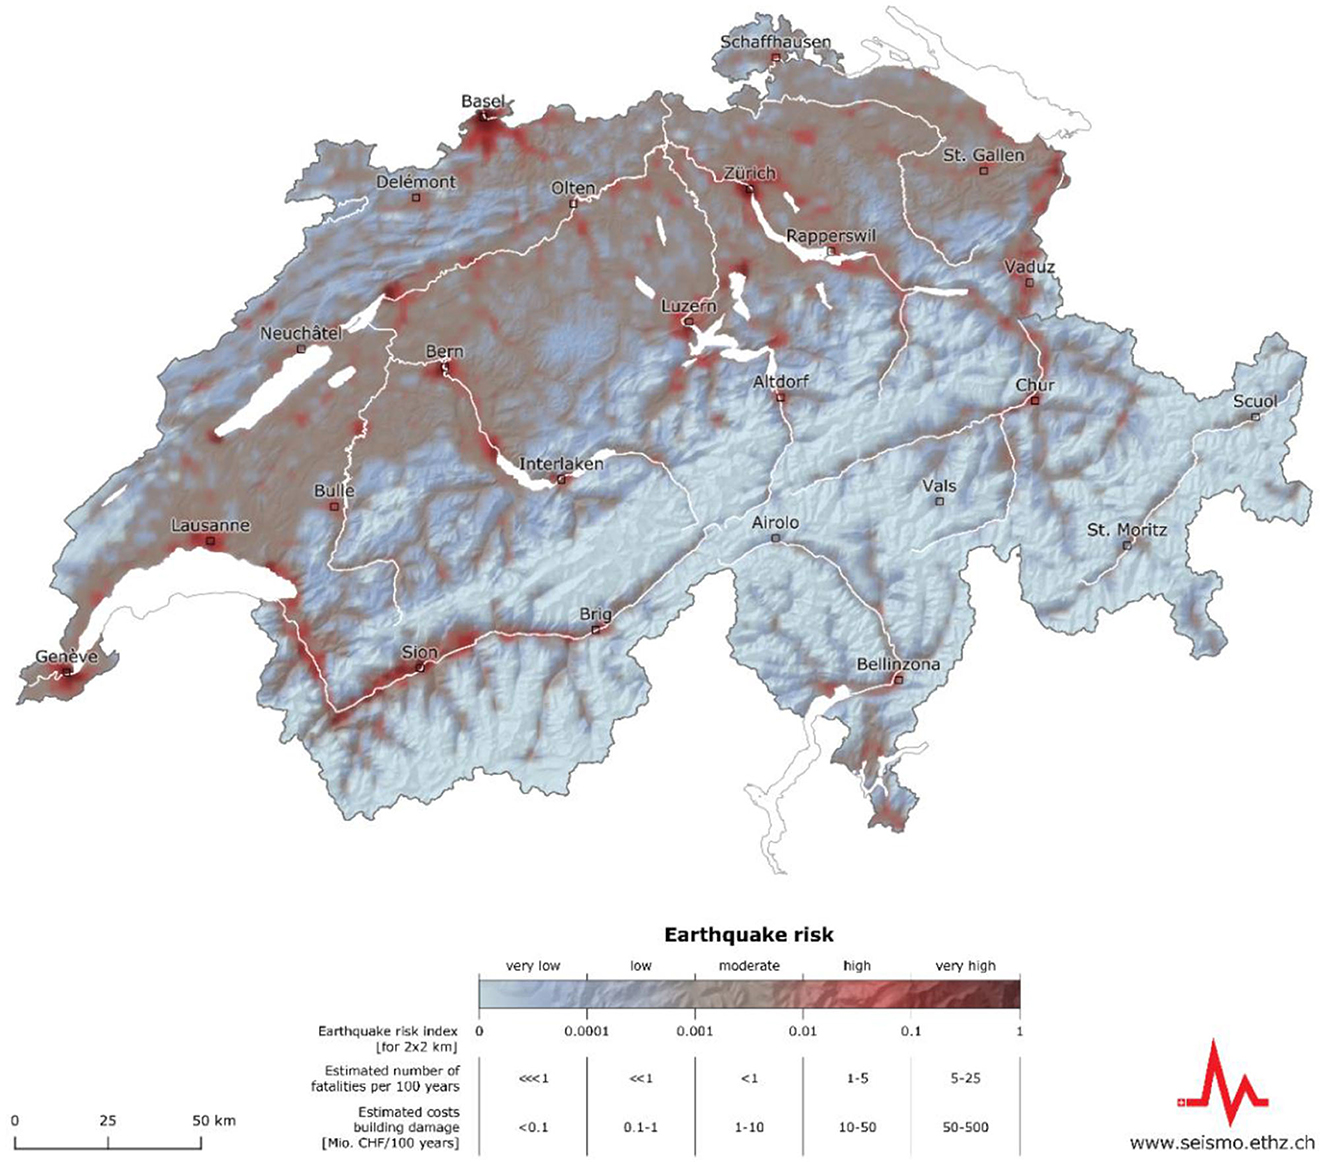
Figure 5. The earthquake risk map of Switzerland, depicting an index that combines the number of fatalities and the financial losses due to building damage that can be expected over a period of 100 years (Swiss Seismological Service at ETH Zurich, 2023).
Based on the survey findings, we decided to include the legend which shows the absolute fatalities and costs values combined with the index values due to four reasons: first, this was the most popular combination. Second, it indicates the use of an index to illustrate the earthquake risk because the estimated number of fatalities and the estimated cost of building damage do not have the same units. Third, the legend with the absolute index improved the understanding of the legend. And fourth, the chosen version increases the public's ability to describe what the earthquake risk map of Switzerland actually shows. The combination of the most popular and best understood color scale and legend type is depicted in Figure 5. It is also the version that was used for the public release of the earthquake risk model of Switzerland.
In addition, we derived some general map design recommendations from our results: (i) indicate the capital cities of the regions to facilitate geographical orientation; (ii) indicate the same cities on the different, risk related maps (e.g., hazard and vulnerability map) to facilitate comparisons; (iii) use empty circles to mark the cities on the map so that the color behind it is visible; (iv) use the color red to indicate high levels of risk because red attracts people's attention and is what they grasp at first; (v) do not overestimate the importance of the title of a map, it is often overlooked; and (vi) use light to dark colors to ensure that the risk distribution is represented even if the map is printed in gray/black and white. Regarding the fourth point concerning the use of the color red, it is known that there are cultural differences, however, there are many countries where red has a long history of being interpreted as dangerous (Pravossoudovitch et al., 2014).
4.2 Insights for information campaigns
The evaluation of newly developed communication products is often neglected (Marti et al., 2020). The process documented in this paper shows the importance and the usefulness of co-designing and evaluating essential earthquake risk communication products. The interdisciplinary discussions throughout the design process already led to sophisticated versions, which is reflected by the comparable high levels of the design perception. They were then refined after receiving feedback from the public survey. The amendments included the choice of a color scale, which was not initially preferred by the developers and a complex instead of a purely qualitative legend as recommended in other studies (Gaspar-Escribano and Iturrioz, 2011). The evaluation further resulted in numerous small adjustments such as using empty circles to mark the cities.
Our survey confirmed that the Swiss public's earthquake risk perception is rather low (Marti et al., 2019; Dallo et al., 2022a). The release of the Swiss earthquake risk model therefore offers an important opportunity to increase public's risk perception and, consequently, to enhance their intention to take protective actions in the long-term (Becker et al., 2012; Wachinger et al., 2013). Especially in countries with moderate seismic hazard, regular information campaigns are important because people probably have never experienced a (severe) earthquake and believe that earthquakes will never occur in their lifetime (Sechi et al., 2022). This is also supported by our findings that people who have never experienced an earthquake or only a weak one perceive the risk map as less useful than people who have experienced a moderate to strong earthquake. In the following, we summarize some issues information campaigns should consider to increase people's perceived usefulness of earthquake risk maps.
First, self-responsibility should be triggered. A question that often arises is who is responsible to take preparedness actions. People who do not experience disasters often tend to believe that (regional) authorities and civil protection are responsible to ensure that communities are resilient to earthquakes (Nikkanen et al., 2023). This is supported by our findings that people indicated that the risk map is especially useful for emergency services/authorities and not for themselves. Information campaigns should thus sensitize and empower people to take self-responsibility and contribute with their individual preparedness to the communal and societal preparedness.
Second, when releasing risk communication products or talking about earthquakes, it is indispensable to explain what risk is and how it differs from hazard. Studies have shown that, with the transition from hazard to risk communication, the challenge emerges that people are not aware of the difference between hazard and risk (Wachinger and Renn, 2010). In daily life, these two terms are used as synonyms and even across different scientific fields the definition of risk differs. This is also true for Switzerland, as we saw in our survey where respondents were asked to describe the risk in their own words but actually described earthquake hazard. Empirical studies have shown that the distinction between hazard and risk depends on the perspectives, beliefs, worldviews and roles of the stakeholders in the field, e.g., modelers, decision makers, or communication experts (Scheer et al., 2014).
Third, the preferences and attitudes of different societal groups must be taken into account. House and apartment owners, for example, perceive the risk products as more useful. This target audience needs to be made aware of building codes and insurance for earthquakes by also clarifying that earthquakes are not covered by the mandatory fire and natural hazards insurance. We also saw that the older the people are the more they value the risk products. This might be explained by the fact that they may own more property or have children or parents for whom they feel responsible (Asgarizadeh Lamjiry and Gifford, 2022). Thus, information material about risk should link to behavioral recommendations, allowing them to take actions to protect themselves and their loved ones.
Fourth, one should emphasize that there are no “no-risk” areas. An earthquake can occur everywhere and, although in some regions the probability might be smaller, unknown unknowns can never be excluded. Already small elements on the communication products can thereby make a difference. One should for example avoid starting with a color that is interpreted as “no risk”, like white or green. Further, the lowest label of the legend should not be “no risk” but rather “very low risk”. Communicating that zero risk is impossible does not diminish the trust in risk management agencies, so there is no need to fear losing people's confidence in the information provided (Nakayachi, 1998).
Fifth, information materials should address that the high seismic risk along rivers and lakes is not due to the danger of floods and tsunamis but due to the sediments in these areas. Further, in the earthquake risk model of Switzerland secondary hazards are not included yet, which should be transparently communicated to avoid wrong conclusions. However, there are already planned research activities to include secondary hazards since they are an essential threat in Switzerland (Fäh et al., 2012; Fritsche et al., 2012; Kremer et al., 2020).
Sixth, one must consider that people with lower numeracy skills have difficulties in understanding numbers and need explanations to interpret them correctly and, consequently, make informed decisions (Peters et al., 2009). Peters et al. (2007) provide several recommendations in their review on how to support people with low numeracy skills: (i) present absolute and not relative numbers; (ii) do not use decimals; and (iii) provide a combination of graphical and numeric information.
4.3 Limitations and future research
Our recommendations for the design of earthquake risk maps are based on evidence gained in Switzerland. Even though best practices in map design have shown to be transferable to other geographical regions and contexts, certain differences may arise. Consequently, it would be useful to conduct cross-cultural comparisons to evaluate, which design elements are universally effective and which factors lead to differences in the perception and understanding, by also considering theoretical concepts and theories of risk communication (Musacchio et al., 2023). Moreover, other design elements could also be varied, such as the depiction of political borders or more cities.
Further, our results confirm the finding from a prior study, looking at earthquake early warning messages and information preferences afterwards (Becker et al., 2020): People want to receive information with regards to secondary hazards triggered by an earthquake (e.g., tsunamis, landslides). However, secondary hazards are not yet included by default in earthquake risk models but shall be incorporated in the future (Wiemer et al., 2023).
The earthquake risk map is one of the most visible and influential output of the risk model. However, it is not the only communication product used, and whereas rapid impact assessments and scenarios were evaluated too (Marti et al., 2023), the website featuring all information with regards to the model has not been tested in advance. It would be valuable to analyze how the combination of different risk products can increase people's understanding of earthquake risk and their intention to take protective actions.
Artificial Intelligence (AI) is already applied in many scientific fields and science communication may also benefit from it. Generative AI, for example, aids in visually presenting complex data and delivering personalized content based on individual skills and preferences. AI also facilitates the creation of virtual environments for realistic simulations, benefiting training for emergency responders (Ogie et al., 2018). Additionally, it enhances inclusiveness by automatically generating alt text for images (Jeong et al., 2023), aiding those with visual impairments in understanding online content. However, AI tools generate content based on existing material. In risk communication, where tested products may be lacking, not tested or ineffective practices from other fields might be employed to create information products. Additionally, in hazard and risk communication, the accuracy and details of visualizations are crucial, requiring thorough review and adjustments by model developers and communication specialists (Johnson and Shen, 2023). Future research is thus needed to get a better understanding of how generative AI can effectively enhance risk communication.
5 Conclusion
Earthquake risk assessments illustrate the consequences future earthquakes can have. Therewith, they offer valuable information for societies to individually assess the threat and derive protective measures based on informed decisions. The earthquake risk map of Switzerland is a key outreach product, frequently replicated by the media, to inform about the results of the risk assessment. It requires a sophisticated translation from scientific results into an accessible, understandable, and attractive communication product. Our study demonstrates how such a transdisciplinary process can be structured. We confirm the importance of pre-testing key outreach material since we revealed that single map elements, such as the color scale or the legend type, influence how people perceive and understand the risk in certain regions. Further, we show that the interest in risk products varies among different societal groups (e.g., homeowners, retired persons), which must be considered when designing effective communication campaigns. To keep the momentum of ongoing research on seismic risk communication (Musacchio et al., 2023), we motivate other research groups to share their expertise and experience in designing user- and action-oriented and understandable risk communication products.
6 Lay summary
Earthquakes pose a serious threat to society, as devastating events keep reminding us. To increase public awareness and preparedness, there is a constant shift from hazard to risk assessment and communication. Risk assessments consider earthquake hazard, local subsurface, building vulnerability, and affected people and assets (exposure). A key product for public outreach is the earthquake risk map, as it allows the public to understand which regions are at high risk and whether they will be personally affected. Since there have been few studies on how to best design them, we conducted a case study in Switzerland and tested different versions of the earthquake risk map, varying the color scale and the content of the legend. The survey results show that the Swiss population prefers a blue-brown-red color scale and a legend with a combination of qualitative and quantitative information. In addition, different social groups perceive the usefulness and relevance of the earthquake risk map differently (e.g., homeowners find it more useful). In summary, our study provides recommendations for the design of understandable earthquake risk maps taking into account public preferences.
Data availability statement
The original contributions presented in the study are included in the article/Supplementary material, further inquiries can be directed to the corresponding author.
Ethics statement
The survey was approved by the Ethics Committee of ETH Zurich (EK 2022-N-235). The studies were conducted in accordance with the local legislation and institutional requirements. The participants provided their written informed consent to participate in this study.
Author contributions
ID: Conceptualization, Formal analysis, Investigation, Methodology, Writing – original draft. LS: Conceptualization, Formal analysis, Investigation, Methodology, Writing – review & editing. MM: Conceptualization, Investigation, Project administration, Resources, Writing – review & editing. DFu: Resources, Writing – review & editing. AP: Resources, Writing – review & editing. PR: Project administration, Writing – review & editing. LD: Project administration, Resources, Writing – review & editing. NV: Writing – review & editing. SRW: Resources, Writing – review & editing. PB: Resources, Writing – review & editing. FH: Writing – review & editing. DFä: Writing – review & editing. PK: Writing – review & editing. SW: Project administration, Writing – review & editing.
Funding
The author(s) declare financial support was received for the research, authorship, and/or publication of this article. This project has received funding from the Federal Office for the Environment (FOEN), the Federal Office for Civil Protection (FOCP), and the Swiss Federal Institute of Technology Zurich (ETH Zurich) as well as the European Union's Horizon 2020 research and innovation programme under grant agreement no 821115 (Real-time Earthquake Risk Reduction for a Resilient Europe “RISE” project). Open access funding by ETH Zurich.
Acknowledgments
The authors would like to thank the participants for taking part in the survey and the colleagues at the Swiss Seismological Service at ETH Zurich who provided feedback during the design and testing process. The authors also thank the three reviewers for their valuable comments, which strongly improved the clarity of our article.
Conflict of interest
The authors declare that the research was conducted in the absence of any commercial or financial relationships that could be construed as a potential conflict of interest.
Publisher's note
All claims expressed in this article are solely those of the authors and do not necessarily represent those of their affiliated organizations, or those of the publisher, the editors and the reviewers. Any product that may be evaluated in this article, or claim that may be made by its manufacturer, is not guaranteed or endorsed by the publisher.
Supplementary material
The Supplementary Material for this article can be found online at: https://www.frontiersin.org/articles/10.3389/fcomm.2023.1306104/full#supplementary-material
References
Asgarizadeh Lamjiry, Z., and Gifford, R. (2022). Earthquake threat! Understanding the intention to prepare for the Big One. Risk Analy. 42, 487–505. doi: 10.1111/risa.13775
Becker, J. S., Paton, D., Johnston, D. M., and Ronan, K. R. (2012). A model of household preparedness for earthquakes: how individuals make meaning of earthquake information and how this influences preparedness. Nat. Hazards 64, 107–137. doi: 10.1007/s11069-012-0238-x
Becker, J. S., Potter, S. H., McBride, S. K., Wein, A., Doyle, E. E. H., and Paton, D. (2019). When the earth doesn't stop shaking: how experiences over time influenced information needs, communication, and interpretation of aftershock information during the Canterbury Earthquake Sequence, New Zealand. Int. J. Disaster Risk Reduct. 34, 397–411. doi: 10.1016/j.ijdrr.2018.12.009
Becker, J. S., Potter, S. H., Vinnell, L. J., Nakayachi, K., McBride, S. K., and Johnston, D. M. (2020). Earthquake early warning in Aotearoa New Zealand: a survey of public perspectives to guide warning system development. Humanit. Soc. Sci. Commun. 7, 138. doi: 10.1057/s41599-020-00613-9
Bergamo, P., Fäh, D., Panzera, F., Cauzzi, C., Glueer, F., Perron, V., et al. (2023). A site amplification model for Switzerland based on site-condition indicators and incorporating local response as measured at seismic stations. Bull. Earthquake Eng. 1766, 1–35. doi: 10.1007/s10518-023-01766-z
Bland, J. M., and Altman, D. G. (1997). Statistics notes: Cronbach's alpha. BMJ 314, 572. doi: 10.1136/bmj.314.7080.572
Bodemer, N., and Gaissmaier, W. (2012). “Risk Communication in Health,” in Handbook of Risk Theory, eds. S. Roeser, R. Hillerbrand, P. Sandin, and M. Peterson. (Dordrecht: Springer Netherlands), 621–660.
Bodoque, J. M., Díez-Herrero, A., Amerigo, M., García, J. A., and Olcina, J. (2019). Enhancing flash flood risk perception and awareness of mitigation actions through risk communication: a pre-post survey design. J. Hydrol. 568, 769–779. doi: 10.1016/j.jhydrol.2018.11.007
Bostrom, A., Anselin, L., and Farris, J. (2008). Visualizing seismic risk and uncertainty: a review of related research. Ann. N. Y. Acad. Sci. 1128, 29–40. doi: 10.1196/annals.1399.005
Brewer, C. A. (2006). Basic mapping principles for visualizing cancer data using geographic information systems (GIS). Am. J. Prev. Med. 30, S25–S36. doi: 10.1016/j.amepre.2005.09.007
Cao, Y., Boruff, B. J., and McNeill, I. M. (2016). Is a picture worth a thousand words? Evaluating the effectiveness of maps for delivering wildfire warning information. Int. J. Disaster Risk Reduct. 19, 179–196. doi: 10.1016/j.ijdrr.2016.08.012
Cho, H., Reimer, T., and McComas, K. A. (2014). The SAGE Handbook of Risk Communication. Thousand Oaks: SAGE Publications.
Corbin, J., and Strauss, A. (2008). Basics of qualitative research: Techniques and procedures for developing grounded theory. 3rd edition. Thousand Oaks: CA: Sage. Available online at: https://journals.library.ualberta.ca/cjuce-rcepu/index.php/cjuce-rcepu/article/view/9688 (accessed February 8, 2021).
Crameri, F., Shephard, G. E., and Heron, P. J. (2020). The misuse of colour in science communication. Nat. Commun. 11, 5444. doi: 10.1038/s41467-020-19160-7
Crowley, H., Dabbeek, J., Despotaki, V., Rodrigues, D., Martins, A., Silva, V., et al. (2021). European Seismic Risk Model (ESRM20). Eucentre.
Dallo, I., Marti, M., Clinton, J., Böse, M., Massin, F., and Zaugg, S. (2022a). Earthquake early warning in countries where damaging earthquakes only occur every 50 to 150 years – The societal perspective. Int. J. Disaster Risk Reduct. 83, 103441. doi: 10.1016/j.ijdrr.2022.103441
Dallo, I., Marti, M., Valenzuela, N., Crowley, H., Dabbeek, J., Danciu, L., et al. (2023). The communication strategy for the release of the first European Seismic Risk Model and the updated European Seismic Hazard Model. Nat. Hazards Earth Syst. Sci. 107, 1–24. doi: 10.5194/nhess-2023-107
Dallo, I., Stauffacher, M., and Marti, M. (2022b). Actionable and understandable? Evidence-based recommendations for the design of (multi-)hazard warning messages. Int. J. Disaster Risk Reduct. 74, 102917. doi: 10.1016/j.ijdrr.2022.102917
Danciu, L., Nandan, S., Reyes, C., Basili, R., Weatherill, G., Beauval, C., et al. (2021). The 2020 update of the European Seismic Hazard Model: Model Overview. EFEHR Technical Report 001 v1.0.0. doi: 10.12686/A15
Dransch, D., Rotzoll, H., and Poser, K. (2010). The contribution of maps to the challenges of risk communication to the public. Int. J. Digital Earth 3, 292–311. doi: 10.1080/17538941003774668
Edler, D., Keil, J., Tuller, M.-C., Bestgen, A.-K., and Dickmann, F. (2020). Searching for the ‘Right' legend: the impact of legend position on legend decoding in a cartographic memory task. Cartogr. J. 57, 6–17. doi: 10.1080/00087041.2018.1533293
Fagerlin, A., Zikmund-Fisher, B. J., Ubel, P. A., Jankovic, A., Derry, H. A., and Smith, D. M. (2007). Measuring numeracy without a math test: development of the subjective numeracy scale. Med. Deci. Making 27, 672–680. doi: 10.1177/0272989X07304449
Fäh, D., Moore, J., Burjanek, J., Iosifescu, I., Dalguer, L., Dupray, F., et al. (2012). Coupled seismogenic geohazards in alpine region. Bolletino di Geofisica Teorica ed Applicata 53, 485–508. doi: 10.4430/bgta0048
FOCP (2020). Katastrophen und Notlagen Schweiz 2020 - Bericht zur nationalen Risikoanalyse. Bern: Federal Office for Civil Protection.
Fritsche, S., Fäh, D., and Schwarz-Zanetti, G. (2012). Historical intensity VIII earthquakes along the Rhone valley (Valais, Switzerland): primary and secondary effects. Swiss J. Geosci. 105, 1–18. doi: 10.1007/s00015-012-0095-3
Fuchs, S., Spachinger, K., Dorner, W., Rochman, J., and Serrhini, K. (2009). Evaluating cartographic design in flood risk mapping. Environmental Hazards 8, 52–70. doi: 10.3763/ehaz.2009.0007
Gaspar-Escribano, J. M., and Iturrioz, T. (2011). Communicating earthquake risk: mapped parameters and cartographic representation. Nat. Hazards Earth Syst. Sci. 11, 359–366. doi: 10.5194/nhess-11-359-2011
Goldman, R., Stovall, W., Damby, D., and McBride, S. (2023). Hawai?i residents' perceptions of Kilauea's 2018 eruption information. Volcanica 6, 19–43. doi: 10.30909/vol.06.01.1943
Golebiowska, I. (2015). Legend layouts for thematic maps: A case study integrating usability metrics with the thinking aloud method. Cartogr. J. 52, 28–40. doi: 10.1179/1743277413Y.0000000045
Henstra, D., Minano, A., and Thistlethwaite, J. (2019). Communicating disaster risk? An evaluation of the availability and quality of flood maps. Nat. Hazards Earth Syst. Sci. 19, 313–323. doi: 10.5194/nhess-19-313-2019
Herrmann, D., and Pickle, L. W. (1996). A cognitive subtask model of statistical map reading. Vis. Cogn. 3, 165–190. doi: 10.1080/713756734
Ho, M.-C., Shaw, D., Lin, S., and Chiu, Y.-C. (2008). How do disaster characteristics influence risk perception? Risk Analy. 28, 635–643. doi: 10.1111/j.1539-6924.2008.01040.x
Höppner, C., Buchecker, M., and Bründl, M. (2010). Risk Communication and Natural Hazards, Swiss Federal Research Institute WSL. Available online at: http://caphaznet.org/outcomes-results/CapHaz-Net_WP5_Risk-Communication.pdf (accessed September 18, 2023).
Ickert, J., and Stewart, I. S. (2016). Earthquake risk communication as dialogue - insights from a workshop in Istanbul's urban renewal neighbourhoods. Nat. Hazards Earth Syst. Sci. 16, 1157–1173. doi: 10.5194/nhess-16-1157-2016
Ismail-Zadeh, A. T., Cutter, S. L., Takeuchi, K., and Paton, D. (2017). Forging a paradigm shift in disaster science. Nat. Hazards 86, 969–988. doi: 10.1007/s11069-016-2726-x
Jeong, H., Chun, M., Lee, H., Oh, S. Y., and Jung, H. (2023). “WATAA: Web Alternative Text Authoring Assistant for Improving Web Content Accessibility,” in Companion Proceedings of the 28th International Conference on Intelligent User Interfaces (New York, NY: Association for Computing Machinery), 41–45.
Johnson, C. R., and Shen, H. W. (2023). “AI for Scientific Visualization,” in Artificial Intelligence for Science: A Deep Learning Revolution, 535–552.
Karjack, S., Brudzinski, M. R., and Shipley, T. F. (2022). Assessment of the general public's understanding of rapidly produced earthquake information products ShakeMap and PAGER. Seismol. Soc. Am. 93, 2891–2905. doi: 10.1785/0220210318
Kremer, K., Gassner-Stamm, G., Grolimund, R., Wirth, S. B., Strasser, M., and Fäh, D. (2020). A database of potential paleoseismic evidence in Switzerland. J. Seismol. 24, 247–262. doi: 10.1007/s10950-020-09908-5
Kreuzmair, C., Siegrist, M., and Keller, C. (2017). Does iconicity in pictographs matter? The influence of iconicity and numeracy on information processing, decision making, and liking in an eye-tracking study: does iconicity in pictographs matter? Risk Analy. 37, 546–556. doi: 10.1111/risa.12623
Kunz, M., and Hurni, L. (2011). How to enhance cartographic visualisations of natural hazards assessment results. Cartogr. J. 48, 60–71. doi: 10.1179/1743277411Y.0000000001
Lang, D. J., Wiek, A., Bergmann, M., Stauffacher, M., Martens, P., Moll, P., et al. (2012). Transdisciplinary research in sustainability science: practice, principles, and challenges. Sustain. Sci. 7, 25–43. doi: 10.1007/s11625-011-0149-x
Laukenmann, J., Brupbacher, M., Barben, D., and Vögeli, P. (2023). “Was ein Erdbeben anrichten würde,” in Tages-Anzeiger. Available online at: https://www.tagesanzeiger.ch/was-ein-erdbeben-an-ihrem-wohnort-anrichten-wuerde-468893009445 (accessed July 12, 2023).
Lechowska, E. (2018). What determines flood risk perception? A review of factors of flood risk perception and relations between its basic elements. Nat. Hazards 94, 1341–1366. doi: 10.1007/s11069-018-3480-z
Leiner, D. J. (2019). “Too fast, too straight, too weird: non-reactive indicators for meaningless data in internet surveys,” in Survey Research Methods, 229–248.
Likert, R. (1932). “A technique for the measurement of attitudes,” in Archives of Psychology (Washington, DC).
Marti, M., Dallo, I., Roth, P., Papadopoulos, A. N., and Zaugg, S. (2023). Illustrating the impact of earthquakes: evidence-based and user-centered recommendations on how to design earthquake scenarios and rapid impact assessments. Int. J. Disaster Risk Reduct. 90, 103674. doi: 10.1016/j.ijdrr.2023.103674
Marti, M., Stauffacher, M., and Wiemer, S. (2019). Difficulties in explaining complex issues with maps. Evaluating seismic hazard communication – the Swiss case. Nat. Hazards Earth Syst. Sci. 19, 2677–2700. doi: 10.5194/nhess-19-2677-2019
Marti, M., Stauffacher, M., and Wiemer, S. (2020). Anecdotal evidence is an insufficient basis for designing earthquake preparedness campaigns. Seismol. Res. Lett. 91, 1929–1935. doi: 10.1785/0220200010
McBride, S. K., Bostrom, A., Sutton, J., de Groot, R. M., Baltay, A. S., Terbush, B., et al. (2020). Developing post-alert messaging for ShakeAlert, the earthquake early warning system for the West Coast of the United States of America. Int. J. Disaster Risk Reduct. 50, 101713. doi: 10.1016/j.ijdrr.2020.101713
Musacchio, G., Saraò, A., Falsaperla, S., and Scolobig, A. (2023). A scoping review of seismic risk communication in Europe. Front. Earth Sci. 11, 1155576. doi: 10.3389/feart.2023.1155576
Musacchio, G., and Solarino, S. (2019). Seismic risk communication: An opportunity for prevention. Bollettino di Geofisica Teorica ed Applicata. doi: 10.4430/bgta0273
Nakayachi, K. (1998). How do people evaluate risk reduction when they are told zero risk is impossible?. Risk Analy. 18, 235–242. doi: 10.1111/j.1539-6924.1998.tb01290.x
Nikkanen, M., Malinen, S., and Laurikainen, H. (2023). What drives feelings of responsibility for disaster preparedness? A case of power failures in Finland and New Zealand. Risk Hazard. Crisis Pub. Policy 14, 188–208. doi: 10.1002/rhc3.12263
Ogie, R. I., Rho, J. C., and Clarke, R. J. (2018). “Artificial intelligence in disaster risk communication: A systematic literature review,” in 2018 5th International Conference on Information and Communication Technologies for Disaster Management (ICT-DM) Sendai: IEEE, 1-8.
Papadopoulos, A. N., Roth, P., Danciu, L., Bergamo, P., Panzera, F., Fäh, D., et al. (2023). The earthquake risk model of Switzerland ERM-CH23. EGUsphere [Preprint]. doi: 10.5194/egusphere-2023-1504
Peters, E., Dieckmann, N. F., Västfjäll, D., Mertz, C. K., Slovic, P., and Hibbard, J. H. (2009). Bringing meaning to numbers: the impact of evaluative categories on decisions. J. Exp. Psychol. 15, 213. doi: 10.1037/a0016978
Peters, E., Hibbard, J., Slovic, P., and Dieckmann, N. (2007). Numeracy skill and the communication, comprehension, and use of risk-benefit information. Health Aff. 26, 741–748. doi: 10.1377/hlthaff.26.3.741
Peterson, G. N. (2020). GIS Cartography: A guide to effective map Design. Boca Raton and London: CRC Press. doi: 10.1201/9781003046325
Piangiamore, G. L., Falsaperla, S., Eva, E., and Musacchio, G. (2021). “Seismic risk communication: let's students show their own way,” in 2nd General Meeting KnowRISK Knowyour city, Reduce seISmic risKthrough non-structural elements, Catania 15-17 December 2016, eds. S. Falsaperla, H. Langer, S. Mangiagli, L. Scarfì. Available online at: http://istituto.ingv.it/l-ingv/produzione-scientifica/miscellanea-ingv/ (accessed December 26, 2023).
Poljansek, K., Casajus Valles, A., Marin Ferrer, M., De Jager, A., Dottori, F., Galbusera, L., et al. (2019). Recommendations for national risk assessment for disaster risk management in EU. EUR 29557 EN. Luxembourg: Publications Office of the European Union.
Pravossoudovitch, K., Cury, F., Young, S. G., and Elliot, A. J. (2014). Is red the colour of danger? Testing an implicit red–danger association. Ergonomics 57, 503–510. doi: 10.1080/00140139.2014.889220
Scheer, D., Benighaus, C., Benighaus, L., Renn, O., Gold, S., Röder, B., et al. (2014). The distinction between risk and hazard: understanding and use in stakeholder communication. Risk Analy. 34, 1270–1285. doi: 10.1111/risa.12169
Schneider, M., Cotton, F., and Schweizer, P.-J. (2022). Criteria-based visualization design for hazard maps. Nat. Hazards Earth Syst. Sci. 23, 2505–2521. doi: 10.5194/nhess-23-2505-2023
Sechi, G. J., Lopane, F. D., and Hendriks, E. (2022). Mapping seismic risk awareness among construction stakeholders: the case of Iringa (Tanzania). Int. J. Disaster Risk Reduct. 82, 103299. doi: 10.1016/j.ijdrr.2022.103299
Swiss Seismological Service at ETH Zurich (2023). “The earthquake risk map for Switzerland,” in Overview of the earthquake risk in Switzerland. Available online at: http://seismo.ethz.ch/en/knowledge/earthquake-hazard-and-risk/earthquake-risk-switzerland/overview/ (accessed December 26, 2023).
Thompson Clive, M. A., Lindsay, J. M., Leonard, G. S., Lutteroth, C., Bostrom, A., and Corballis, P. (2021). Volcanic hazard map visualisation affects cognition and crisis decision-making. Int. J. Disaster Risk Reduct. 55, 102102. doi: 10.1016/j.ijdrr.2021.102102
van der Bijl-Brouwer, M., and Dorst, K. (2017). Advancing the strategic impact of human-centred design. Design Stud. 53, 1–23. doi: 10.1016/j.destud.2017.06.003
Vinnell, L. J., Hudson-Doyle, E. E., Inch, P., Tan, M. L., Becker, J. S., and Johnston, D. M. (2022). Evacuation behavior and information needs of Wellington, Aotearoa New Zealand residents following the 5 March 2021 Mw 7.3 East Cape earthquake. Seismol. Res. Lett. 93, 1452–1463. doi: 10.1785/0220210286
Wachinger, G., and Renn, O. (2010). “Risk perception and natural hazards,” in Stuttgart: DIALOGIK Non-Profit Institute for Communication and Cooperative Research. Available online at: http://caphaz-net.org/outcomes-results/CapHaz-Net_WP3_Risk-Perception.pdf (accessed September 18, 2023).
Wachinger, G., Renn, O., Begg, C., and Kuhlicke, C. (2013). The risk perception paradox-implications for governance and communication of natural hazards: the risk perception paradox. Risk Analy. 33, 1049–1065. doi: 10.1111/j.1539-6924.2012.01942.x
Keywords: earthquake risk map, color scale, legend type, public survey, risk perception, correct interpretation
Citation: Dallo I, Schnegg LN, Marti M, Fulda D, Papadopoulos AN, Roth P, Danciu L, Valenzuela N, Wenk SR, Bergamo P, Haslinger F, Fäh D, Kästli P and Wiemer S (2024) Designing understandable, action-oriented, and well-perceived earthquake risk maps—The Swiss case study. Front. Commun. 8:1306104. doi: 10.3389/fcomm.2023.1306104
Received: 03 October 2023; Accepted: 19 December 2023;
Published: 08 January 2024.
Edited by:
Daniela Di Bucci, Dipartimento della Protezione Civile, ItalyReviewed by:
Iain Stewart, Royal Scientific Society, JordanGordon Woo, Risk Management Solutions, United Kingdom
Lucia Savadori, University of Trento, Italy
Mauro Dolce, University of Naples Federico II, Italy
Copyright © 2024 Dallo, Schnegg, Marti, Fulda, Papadopoulos, Roth, Danciu, Valenzuela, Wenk, Bergamo, Haslinger, Fäh, Kästli and Wiemer. This is an open-access article distributed under the terms of the Creative Commons Attribution License (CC BY). The use, distribution or reproduction in other forums is permitted, provided the original author(s) and the copyright owner(s) are credited and that the original publication in this journal is cited, in accordance with accepted academic practice. No use, distribution or reproduction is permitted which does not comply with these terms.
*Correspondence: Irina Dallo, irina.dallo@sed.ethz.ch