Rhythm pattern discovery in Niger-Congo story-telling
 Dafydd Gibbon
- Faculty of Linguistics and Literary Studies, Bielefeld University, Bielefeld, Germany
Description of interactive oral story-telling in West African Niger-Congo languages, “orature” in contrast to “literature”, has traditionally been firmly in the domain of anthropological linguistics. The discourse structures of narrator-responder interaction and call-response chanted interludes and their prosody are an open challenge to discourse analysts, linguists and phoneticians. Two orature examples from related Niger-Congo languages, recorded during fieldwork in Côte d'Ivoire, are analyzed from a macrostructural acoustic phonetic perspective in terms of realtime rhythms, and then compared with other related orature examples and examples of reading aloud. In this transdisciplinary methodology, long time domains of up to 5 min in duration and beyond are studied using long-term spectra and spectrograms of the amplitude modulation of speech. Long-distance timing regularities and their variation during story-telling exchanges are analyzed in detail and explained in terms of Rhythm Formant Theory (RFT), a further development of Speech Modulation Theory, and its associated methodology Rhythm Formant Analysis (RFA).
I would define, in brief, the Poetry of words as The Rhythmical Creation of Beauty.
Edgar Allen Poe, 1850, The Poetic Principle.
1. Background
1.1. Orature and its analysis
The purely orally performed narrative traditions of West Africa defy the literary analysis techniques which apply to written literature and its oral performance, and call for a transdisciplinary approach which takes account of the specific realtime rhythmic and melodic features of speech. One of the goals of the present study is exploration of the data with a methodology which facilitates the meeting of the interpretative methods of linguistic and anthropological studies of traditional but partly improvised extempore orature—unwritten poetry, narrative and drama—with phonetic methods, using signal processing coupled with data visualization. The domain is the rhetorical and poetic skills of West African orature, exemplified by rhythm variation and consistency in orature performances.
On the one hand, traditional qualitative approaches to language in the humanities use hermeneutic methods based on native speaker intuition and understanding. These methods range from literary studies of written poetry, narrative and drama and anthropological studies of orature to linguistic analysis of vocabulary and grammar and phonetic analysis of words, sentences and their prosody, often with support from the formal techniques of algebra and logic.
On the other hand, in the physical sciences measurements and numerical methods are used to analyze patterns in physically caused traces of speaking (or writing) events recorded in computer memory. Generalizations are induced with techniques from machine learning and artificial intelligence. In respect of language and speech the main relevant fields range from computational corpus linguistics and phonetic signal analysis to the “Large Language Models” (LLMs) and speech cloning of current language and speech engineering.
Between these two methodological poles of hermeneutic and causal explanation lie several hybrid disciplines, including linguistic phonetics and corpus linguistics, dialectometry, stylometry, experimental psycholinguistics and sociolinguistics, which apply quantitative methods to qualitative categories such as speech sounds and written characters, words, phrases and sentences, and which ground these categories in physical realities of stored or real-time speech and writing. One popular set of hybrid methods from these areas, in which many other disciplines such as geographical information systems and archaeology cooperate, comes together under the umbrella term of “digital humanities”. This “metadiscipline” was originally concerned with the digitization and preservation of ancient manuscripts, but in the meantime has undergone syncretistic expansion with absorption of methods from other hybrid disciplines (Ekpenyong and Udoh, 2022).
1.2. Objectives
The topic and methods of the research reported here are loosely related to digital humanities. The disciplines from this area which are most relevant to the present study are dialectometry (Nerbonne and Kretzschmar, 2003) and stylometry (Rybicki and Eder, 2011; Savoy, 2020), which combine corpus linguistic analysis with unsupervised and supervised machine learning in domains which go beyond sentences and investigate, for example, similarities and differences between entire novels and styles. With distance metrics, distance networks and hierarchical clustering, patterns of similarity between literary genres across languages can be classified and authorships of previously anonymous or pen-named works determined, in literary studies, linguistics and forensic text analysis (Juola, 2015).
The present study takes a comparable approach to spoken discourse in the later sections, adding a macrostructural discourse-phonetic dimension. While stylometry typically deals with written texts, except in specific forensic applications, and dialectology deals with both written texts and transcriptions, the present research applies these classification methods directly to physical measurements of spoken language, applying methods from acoustic phonetics and unsupervised machine learning.
The main goal is to provide explanations of perceived realtime rhythm variation in orature, both within a given orature event, and between spoken language events in different languages and in other language varieties such as reading aloud. One common type of causal explanation would focus on relating orature rhythms to learned repetition and rehearsal behavior; another would relate it to speech production processes and memory; a functional explanation might focus on mean opinion surveys (MOS) of perceived rhythmicity; a quantitative approach to explanation would develop correlational models based on neurophonetic measurements. Since no data of these types are available for the orature domain in view in the present study, nor can they be feasibly obtained, these kinds of explanation are not available.
Consequently, other more traditional types of explanation are invoked: functional explanation in terms of hermeneutic understanding of identifiable phases in orature events; structural explanation in terms of a static model of participant roles and a dynamic model of participant interaction; causal explanation in terms of the grounding of realtime rhythms, in terms both of variation in durations of annotated speaker turn events and of acoustic analysis of the low frequency (LF) spectrum of the complete event. The causal line of explanation is accompanied by a falsification chain from simpler and less adequate analyses such as annotation mining to more complex and more adequate approaches such as spectrogram analysis. The falsification chain is an explanatory feature which enables distinguishing between more and less adequate theories.
Specifically, the aim is to discover variability in the rhythmic organization of extempore story-telling dialogues in two Niger-Congo languages of the Ivory Coast, Anyi and Ega, in comparison with read-aloud written stories in other related languages and speech styles (Gibbon et al., 2002). Anyi and Ega are typologically related, and both have similar ranges of complicating factors which condition details of the spoken rhythms of the languages, including lexical and morphosyntactic tone and mildly agglutinating morphology, which they share with other Niger-Congo languages. An additional motivation for the study is to contribute toward insightful description and documentation of these languages (Gibbon et al., 2004) in terms of the acoustic dimension of a multimodal analysis (Rossini and Gibbon, 2011).
1.3. Realtime rhythms
The present concern is not with the syllable, word and sentence structures which have been referred to in the context of metrical phonology as “linguistic rhythm” (Liberman and Prince, 1977).1 The understanding of rhythm in the present context is more traditional and more diverse: rhythms are understood as sequences of regular beats in speech, music, song and dance, or related to events such as heartbeats, walking, chewing, or to interpersonal events such as handshaking and other bonding interactions. These rhythmic sequences of beats and pulses have a specific tempo and frequency, possibly with several simultaneous rhythms at different frequencies, and a beat sequence count of at least three (Nakamura and Sagisaka, 2011), a “minimal rhythm principle”. A duration of at least three seconds for word rhythms, for example, will be referred to as “persistence” and persistence at the same frequency will be referred to as “resonance”.
In the present context, rhythms are understood in the following general terms:
A rhythm is perceived, and can be measured, when at least three similarly structured events occur at approximately equal intervals in time and create an expectation of a further similarly structured event after a similar interval, subject to persistence and resonance conditions. Functionally, a rhythm implies an underlying principle of cohesion.
In the case of speech rhythms, the principle of cohesion is metalocutionary marking of a concurrent segment of speech of the same length. The definition is related to the interpretation in Dilley (2005) of pitch accent sequences in English as creating expectations of continuation, that is, lowering of entropy, and then termination, i.e., breaking the expectations. Formally, a speech rhythm is a low frequency (LF) oscillation which can be measured in the LF segment of the speech spectrum below about 10 Hz. The concept is taken up in the sections below on Rhythm Formant Theory2.
The linguistic correlates of rhythmic beats are in general strong or stressed syllables, or salient words and phrases. The beats contrast syntagmatically with the intervening non-beat intervals, such as weak or unstressed syllables and non-salient words and phrases. Beats and non-beats approximate to the categories of ictus and remiss in poetic meter and in linguistic phonetics.
In modulation theoretic approaches these sequences have been modeled as oscillations between strong and weak states of some audible parameter at temporally regular intervals, possibly with simultaneous oscillations in different frequency ranges (Ohala, 1992; Cummins and Port, 1998; Barbosa, 2002). In an idealized model with completely regular oscillations at a constant frequency, the beats are isochronous (i.e., have identical temporal interval durations). However, this is an idealization. In reality, “equal timing” is relative and involves variation over smaller or larger frequency ranges, depending on the prosodic typology of different languages and on different genres and styles of speaking (Arvaniti, 2009; Kohler, 2009).
1.4. Overview
This exploratory study uses quantitative acoustic phonetic methods for discovering rhythm patterns associated with a domain which is initially described and modeled with interpretative methods. Results are judged post hoc on a qualitative case-by-case basis because of the sparseness of the available fieldwork data, not in terms of statistical significance, though the latter is implied by the use of clustering methods. The specific questions addressed in exploring the data are as follows:
1. Which overall utterance duration patterns can be measured in different turn types (narrator, responder, audience) during the narrative?
2. How rhythmical are these patterns?
3. Are there functional interpretations of the differences between rhythm patterns within orature sessions or between sessions in different languages?
The argumentation strategy starts in the present section with the intuition-based qualitative description of language varieties as the explicandum, followed by the introduction of the data and then moves toward a valid formal explicans via a falsification chain in subsequent sections. First, annotation mining in the time domain is investigated and duration irregularity indices are rejected as incomplete characterizations of rhythm. Second, annotation mining is used to visualize long-term duration patterns and intuitively observable cyclic duration patterns as potential rhythms. Third, the annotation-mining method is replaced by the more precise frequency domain approach of Rhythm Formant Theory (RFT) and its methodology Rhythm Formant Analysis (RFA), starting with analysis of spectral frequency peaks. The spectra turn out to be helpful, but not a complete solution since they lack temporal information. Fourth, the spectra are replaced by spectrograms, i.e., a sequence of shorter term spectra along the time axis, supporting the persistence and resonance properties of rhythm. Fifth, a first step in automatic induction is made, with similarity visualization by means of distance maps. Sixth, the distance maps are replaced by hierarchical clustering rendered in dendrograms, which show exact rhythm-based relations between the language varieties. In this way, the present account of rhythm reaches an explanatory level of theoretically well-founded and methodologically well-grounded causal analyses in addition to further functional explanation through interpretations of visualized spectra and spectrograms.
The data are described in Section 2. Section 3 reports on the results of examining duration patterns in two stories, one each from Anyi and Ega, using the hybrid qualitative-quantitative method of speech annotation mining. In Section 4, Rhythm Formant Theory (RFT) and its associated methodology, Rhythm Formant Analysis (RFA) are introduced and the theory is located within the framework of Speech Modulation Theory. In Section 5 quantitative results in the form of distance maps and dendrograms are constructed by generating vectors of spectral features and using them to compare a total of 11 oral narrative productions in 5 different languages (2 Anyi, 1 Bete, 6 Ega, 1 Ibibio, 1 Côte d'Ivoire French) and in different styles (formal, informal). In Section 6, the causal explications are validated by means of holistic visual comparison of spectrum and spectrogram patterns. Section 7 provides a summary, reviews the conclusions and suggests an outlook for applications and future work.
2. Data
2.1. Language characterization
The two languages represented in the core of the present study are Niger-Congo tone languages: Anyi (Anyin, Agni, ISO 639-3 any) and Ega (ISO 639-3 ega). Anyi is a Central Tano Kwa language spoken in south-eastern Côte d'Ivoire (Ahoua and Adouakou, 2009), and is represented in the study with recordings of two interactive oral narratives. Ega is a putative Kwa isolate spoken in south-central Côte d'Ivoire (Bole-Richard, 1983; Connell et al., 2002; Blench, 2015), enclaved in an Eastern Kru-speaking area by the language Dida (ISO 639-3 dic), and is represented with six interactive oral narratives. The recordings in both languages were made during fieldwork in Côte d'Ivoire in 2001 and 2002. In each case, the interactive narrative scenario is the same and is characteristic of story-telling scenarios in the Kwa languages (Berry and Spears, 1991; Ninan et al., 2016; Lô et al., 2020).
In order to provide an initial grounding in terms of linguistic relationships between the Kwa language group and the enclaving Kru language group, hierarchical clusters based on the phoneme inventories of the languages are shown in Figure 1, based on previous studies (Gibbon, 2014, 2016). The sources of the phoneme similarity data are the inventories tabulated in the language atlases for the Kwa (Hérault, 1983) and Kru (Marchese, 1983) languages of Côte d'Ivoire. The dendrograms are constructed automatically from triangular distance tables which are based on pairwise Levenshtein Distance between the phoneme inventories formatted as strings (not unlike triangular distance tables in geographical maps) and are clustered hierarchically using complete linkage (farthest neighbor linkage). The automatically calculated subgroups are highly compatible with the general linguistic classifications in the language atlases.
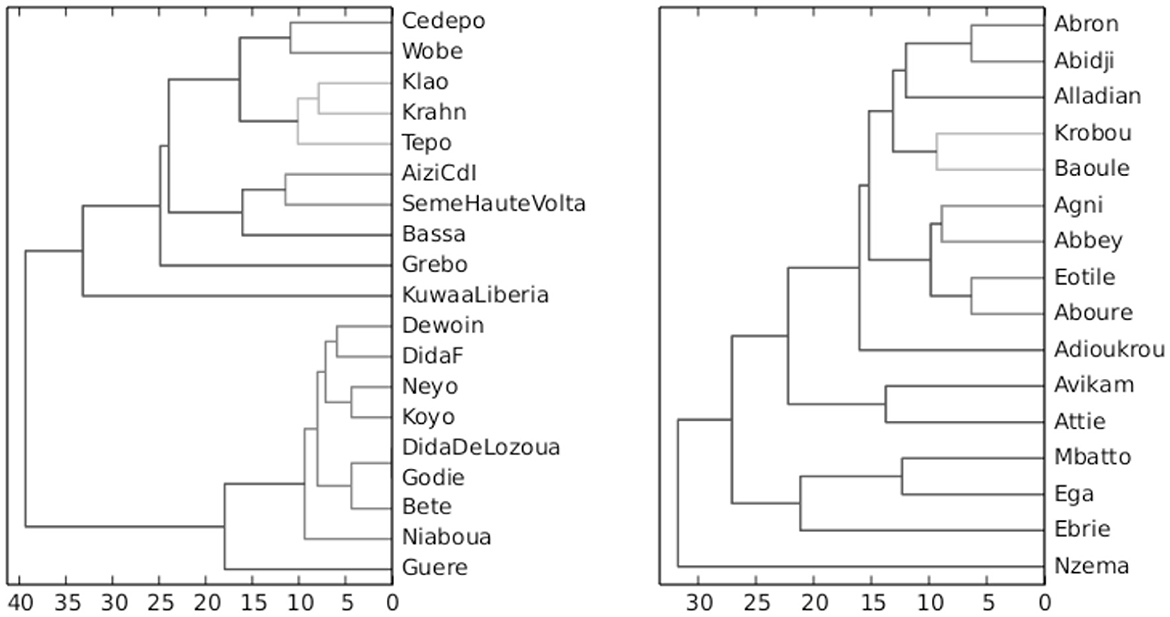
Figure 1. Hierarchical clustering of Côte d'Ivoire Kru (left) and Kwa (right) languages according to differences in phoneme inventories (greater difference shown by edge length and darker shade).
In addition to Anyi and Ega, a read-aloud narrative in educated Ivorian French (abbreviated “CdIFr”) by a native-speaker of Anyi is included, as well as two readings of translations of the benchmark parable used by the International Phonetic Association, The North Wind and the Sun, in two further Niger-Congo languages, Daloa Bete (Eastern Kru, Ivory Coast, ISO 639-3 bev), closely related to the Dida language which enclaves the Ega-speaking region, and reading in Ibibio (Lower Cross, Nigeria, ISO 639-3 ibb). The reason for including the reading genre in non-Kwa Niger-Congo languages is to investigate possible language-transcending genre differences. The read-aloud Bete and Ibibio stories are translations of the Aesop fable The North Wind and the Sun. The Ibibio recording is accessible via (Urua, 2004).
The recordings differ in length, which leads to differences in frequency resolution and energy distributions of spectra in the later analyses, but not in the actual frequencies. The durations are shown in Table 1. In the analyses these differences are length-normalized in order to make comparison viable.
Table 1. Durations of recordings.
2.2. The orature scenario
In the interactive narrative scenario a narrator addresses a responder, turning occasionally to the audience. The narrators are respected for their story-telling skills and may be the chef du village, in the case of Ega, or a popular story-teller, in the Anyi example. The responder provides ritual encouragement, skeptical or neutral back-channel feedback for the narrator, and may be either a designated village responder (Figure 2 left) or selected ad hoc by the narrator (Figure 2 right). The hand of the narrator is blurred in the photo because she is in the process of selecting her responder by resting her hand on his thigh, a conventional gesture in Kwa communities which signifies a request for support in a communal gathering. The audience provides occasional spontaneous backchannel responses of surprise, horror or amusement at highlights in the story.
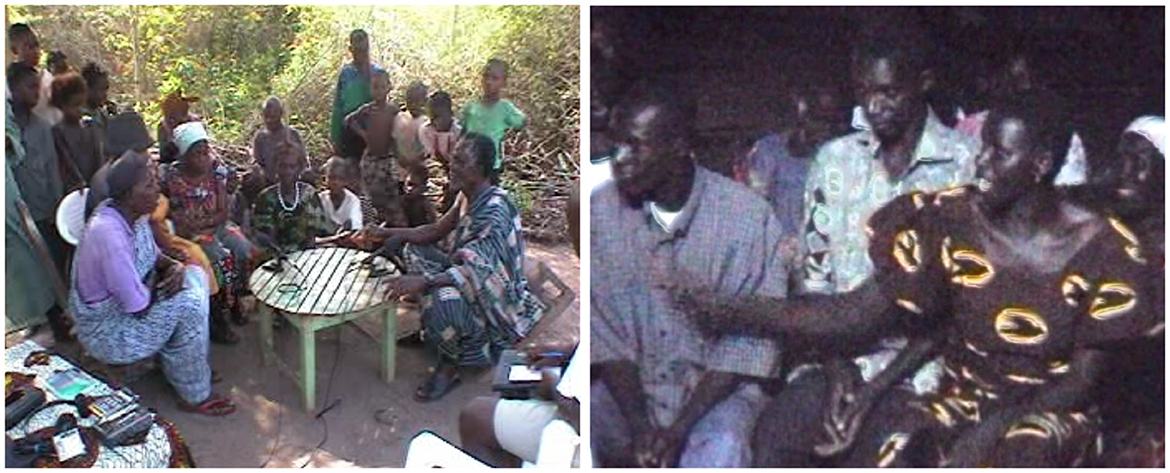
Figure 2. (Left panel) Narrator Grogba Gnaoré Marc (right) addressing his responder (left) and audience (background) during an Ega story-telling session in Gniguédougou village, Côte d'Ivoire, 2001. (Right panel) Narrator Kouamé Ama Bié (right) selecting her responder (left), with the audience (background), during an Anyi (Anyin, Agni) story-telling evening in Adaou village, Côte d'Ivoire, 2002.
The selected Anyi and Ega stories both follow the traditional genre of parable or fable, involving two participants who are competing or involved in a misunderstanding, and ending with a moral. One Anyi story (conte17) has a classic plot about an elephant who challenges a mouse to a race, and is shocked to find that the mouse can keep up, somewhat reminiscent of the well-known fable about the tortoise and the hare. The moral of the fable is that no-one should underestimate anyone.
One Ega story (conte2) is about a bird who tries to warn a bride, who is walking to meet her new bridegroom in another village (following the custom of exogamous marriage), that her jilted ex-bridegroom is planning to harm her, but the girl does not understand, continues, encounters the ex-bridegroom, is reproached by him, insults him, and meets her end as prophesied.
The moral of the Ega parable is not that the girl or the ex-bridegroom should have behaved more honorably, but that one should learn other languages in order to survive. The ironic point is that the bird's message is not just birdsong but is in Dida, the enclaving Kru language of the bridegroom, which the girl had not yet mastered, and not in the bride's endangered native tongue Ega. This metalinguistic moral was accompanied by a glance and a gesture toward the fieldworkers as learners of the Ega language, whose ambivalent participant-nonparticipant role was thereby underlined.
The narrative development of this parable starts with the exposition by the narrator, who presents an example of the appropriate audience response. There follows a very brief pause and an iterative pattern evolves: either continuation of the narrative or the responder's backchannel interjection, leading back to the narrative. After the narrative-backchannel sequence, the narrator initiates a chanting cycle with a call and a chanted response by the choir which is constituted by the audience. This overall cycle continues until the end of the story and the statement of the moral.
2.3. Modelling orature
The role pattern in the story-telling and recording scenario is shown as a static structure in Figure 3: the narrator-caller, in the center, has the main roles, supported by the responder, and the audience has two main roles, as listeners and as a chanting choir in response to the caller's chants. The observing fieldworkers have an ambivalent role as eavesdroppers, as it were, between participation and non-participation.
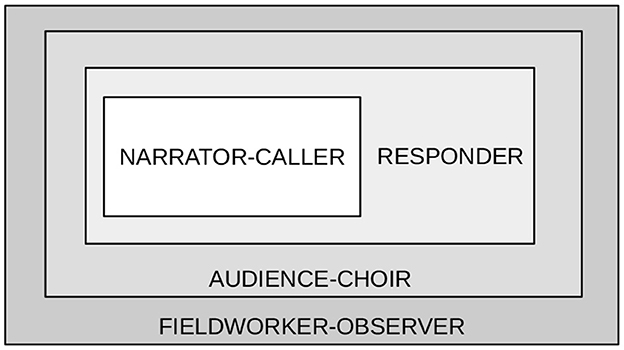
Figure 3. Participant role scenario in Kwa interactive narrative orature.
The cyclic dynamics of this variety of poetic orature are summarized visually in the iterative transition network depicted in Figure 4. The network formalizes four cycles or iterative principles: the narrative-pause cycle, the narrative-backchannel cycle and the call-response cycle, which together constitute an overall global cycle. This pattern applies both to the Anyi and the Ega narratives.
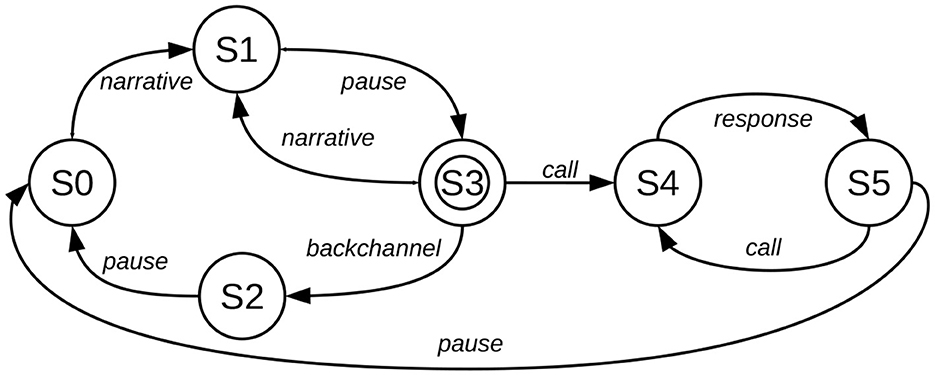
Figure 4. Iterative transition network model for interactive spoken narrative.
In this model, the narrator introduces the topic (a move from state S0 to S1) and after a brief rhetorical pause (S1 to to S3), the narrator either continues (a subordinate cyclic move from S3 to S1) and continues with the narrative or receives backchannel feedback from the responder (a different subordinate cyclic move from S3 to S2, then S2 to S0). Alternatively, at this point the narrator chants a call to the audience (S3 to S4), who respond as a choir with a chant (S4 to S5), after which the narrator has the option of another call-response sequence (a subordinate cyclic move S5 to S4), or of continuing via a pause (S5 to S0) with the next phase of the narrative, and starting the next main cycle (from S0). After several main and subordinate cycles the narrator formulates the moral of the story, ending via a pause (at terminal state S3).
The value of the iterative transition network in the present context is that it formally captures the turn interaction pattern and its relations with the long-term discourse-level rhythm and melody patterns.
2.4. Data selection and processing
Two data sets are analyzed. The smaller data subset consists of the Anyi and Ega stories, and the larger data set includes the subset, and contains a total of 11 recordings in five languages (2 Anyi, 6 Ega, 1 Bete, 1 Ibibio, 1 Ivory Coast French) including two further dimensions: two oral genres (interactive extempore narrative and reading aloud) and two styles (formal and informal). The languages are typologically or areally related. The selection is designed to facilitate the pilot analysis without too many typological variables.
The recordings were originally annotated shortly after recording using the TASX-annotator tool (Milde, 2002). The TASX XML format was converted for further processing to a CSV format, and a small number of annotation errors were also corrected. For the recent annotations used in the present study, the Praat phonetic workbench (Boersma, 2001) was used and the TextGrid files were also converted into CSV files for further processing. The signal processing analyses and generation of the figures were implemented in Python using the NumPy, SciPy, MatPlotLib and Tkinter libraries and are provided as open source code in a GitHub public repository3 in order to enable validation and reproducibility of the present results.
3. A time domain method: annotation mining
3.1. Duration irregularity as dispersion and distance
In linguistic phonetics, a popular method for examining speech timing is annotation mining, a method which originated in statistical language and speech engineering: the assignment of linguistic labels and time-stamps to segments of speech signals, together with the use of irregularity measures to calculate the difference between an assumed ideal of isochrony or equal timing of speech units such as syllables, words or feet and the reality of annotated durations. A number of measures have been used: some are global, based on mean rates or standard deviation for entire utterances, others restrict attention more realistically to the duration differences between neighboring units (Gibbon, 2006; White and Malisz, 2020).
Although often referred to as “rhythm metrics”, measures such as standard deviation or covariance are, strictly speaking, not metrics but measures of dispersion.4 An exception is the Pairwise Variability Index, whose variants (Grabe and Low, 2002) can be derived straightforwardly from the standard metrics Manhattan Distance and Normalized Manhattan Distance.
The more interesting point is that these measures tell only half the story of rhythm, the degree of relative duration irregularity, and have nothing to say about the other half, the alternations and oscillations. The alternations of a rhythm imply (relative) isochrony, but not vice versa, since a series of monotonically increasing durations may show relative isochrony but not rhythmic alternation. Rhythmic duration differences between neighboring syllables alternate between peaks and valleys, e.g., between positive (long-short) and negative (short-long) differences, but the irregularity measures use absolute or squared values, which turn all differences into positive values and thereby not only lose any relation to peak-valley rhythmic alternation but also introduce an ambiguity, a kind of “overkill”: the measures do not distinguish between alternating and non-alternating duration sequences [cf. overviews and discussion in Gibbon (2003, 2018, 2021) and Arvaniti (2009)].
A further problem is overgeneralization: by claiming a single irregularity index for a language, the functional variation of rhythm both within utterances and dialogues, and between language varieties and languages, is excluded.
Consequently, in a chain of falsification arguments for rhythm models, the irregularity measures must be regarded as falsified on both formal and empirical grounds, though they remain useful heuristic tools which provide an initial orientation in terms of relative isochrony.
3.2. Plotting syntagmatic turn duration patterns
Annotation mining can also provide useful information beyond irregularity indices, in the form of sequences of duration measurements which show clear syntagmatic duration variation patterns. The recordings of one Anyi narrative and one Ega narrative were annotated at turn level, according to the categories shown in Figures 3, 4, and visualized as time×duration scatter plots of turn sequencing in Figure 5 (top: Anyi, bottom: Ega).
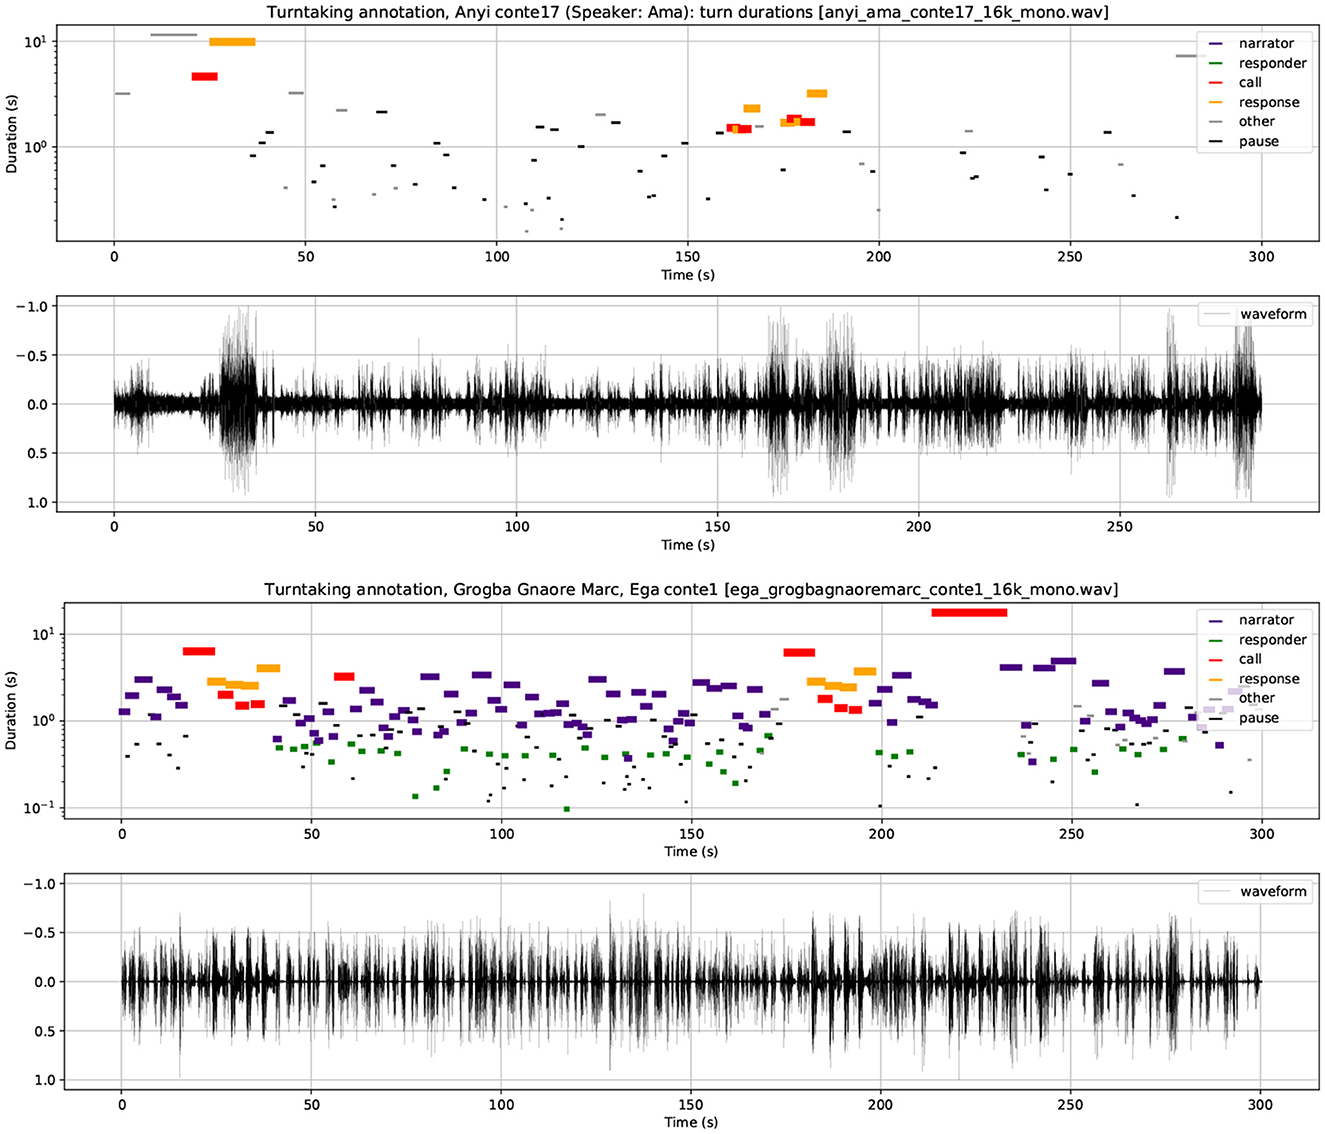
Figure 5. (Top panels) Sequential syntagmatic temporal distribution in the Anyi narrative. (Bottom panels) Sequential syntagmatic temporal distribution in the Ega narrative.
In the scatter plots the x-axis shows the temporal sequencing of utterance events and the y-axis shows the duration of each event on a logarithmic scale. Log scaling was chosen in order to compress the duration scale and thereby reduce the spread of longer durations along the y axis, permitting easier comparison of the very long narrative utterances with the shorter utterance types. For convenience in comparison, the durations, which are highly variable, are also shown by means of the length and thickness of the utterance event bars. The utterance categories (narrator, responder, call, response) are represented by different colors and listed in the figure legends together with their assigned colors.
Figure 5 demonstrates a number of particularly striking results pertaining to variations in turn duration and therefore tempo:
1. In contrast to many other types of dialogue interaction, the turns do not overlap temporally (this is slightly obscured at some points in the diagram by the use of bar width and length to indicate duration).
2. The Anyi turns have considerably shorter durations than the Ega turns, i.e., a faster turn tempo, perhaps a consequence of the relative informality of the Anyi scenario.
3. The two turn duration plots both show long-term iterative linear patterns of interactively generated long-term discourse rhythms. The discourse cycles are formally related to the linear cyclic prosodic grammars of intonation and rhythm (Pierrehumbert, 1980; Gibbon, 1981, 1987, 2001), and provide a backbone structure for discourse-level prosodic patterns.
4. The Ega duration sequence has a long-term rhythm in the form of periodically accelerating sequences of call-response sequences with rising and falling (i.e., decelerating and accelerating) intervening turn duration patterns. These patterns match the cyclical sequencing of utterance categories, possibly interpretable as a mark of the rhetorically very animated, though formal and authoritative style of the narrator.
5. In the Anyi sequence there is a very long term repetition of call-response sequences, and otherwise shorter rhythms of more diffuse decelerating-accelerating patterns can be seen (for example between about 35 and 90 s, and 110 and 140 s, followed by a call-response sequence). This is possibly another characteristic of the lively narrator and the much more informal style with drums accompanying the chants, much laughter and very much shorter turns.
6. Overall deceleration, in which turn durations become longer as the narrative phases proceed, is evident in both Anyi and Ega.
7. In both Anyi and Ega, the call-response sequences are also visible as conspicuous regular patterns, reflecting the long-term rhythmic expectations predicted by the transition network discourse grammar.
The conclusion from this analysis is that on the one hand interesting rhythmical sequences are shown, in the sense of iterating patterns, but on the other hand it is not yet clear whether these temporal patterns actually have the frequency properties of rhythms.
3.3. Paradigmatic turn clustering with spectral similarity
Anticipating the RFA methodology of the following sections, a cluster analysis of the low frequency (LF) similarities between spectral properties of the turns shown in Figure 6 was calculated. The very short events pause and backchannel are not included.
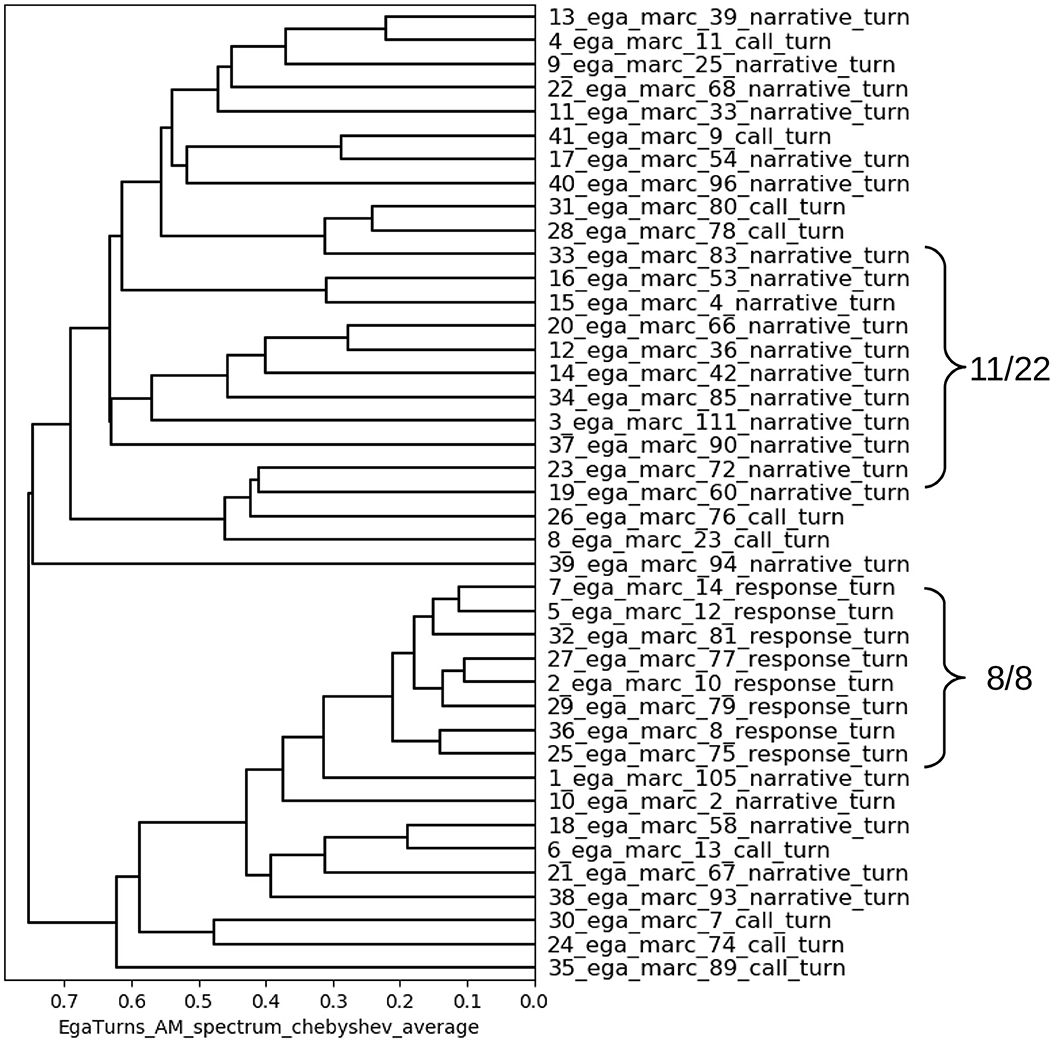
Figure 6. Distance dendrogram of turn durations in the Ega fable. Label numbering: 1. file processing sequence (excluding backchannels and pauses); 2. turn sequence in annotation.
The calls do not show the same consistency as the response turns or the narrative turns. But the latter form two clear category clusters:
1. The response turns, which are chanted and highly rhythmical, all cluster together, without exception, and are thereby shown to have very similar spectra;
2. Narrative turns also show a tendency toward similar cyclic patterns and most of them cluster together, though they are not chanted, unlike the response turns.
Several distance metrics and clustering criteria were examined for this test. The most plausible result was achieved with the Chebyshev Distance metric (also known as Chessboard Distance or Maximum Value Distance) together with average distance linkage for cluster hierarchy calculation.
The conclusion from this analysis is that there are consistent types of turn event behavior, which would be required for the analysis of rhythms, but it is again not yet clear whether the spectral similarities of turns are in fact rhythmical according to the criteria established in the first section. Since information about rhythmic patterns is crucial for the description and explanation of rhythms and their variation, the turn duration dendrogram model must also be seen as inadequate and, though useful, as partially falsified.
4. A frequency domain method: RFA
4.1. The missing link: modulation and demodulation
Though the time domain methods outlined in the preceding section provide useful insights, there are still missing links when it comes to describing and explaining speech rhythms, and the question arises of how these missing links may be captured. The question also arises of which styles, registers and genres of speaking are more likely to be rhythmical, and thus also isochronous, than others. Intuitively, counting, or rhetorical repetition, poetry reading and chanting are more likely to be more fluent and more rhythmical, while spontaneous speech is likely to be less fluent, less rhythmical and more hesitation-prone.
Rhythm Formant Theory (RFT), a further development of Speech Modulation Theory, together with its Rhythm Formant Analysis methodology, addresses the properties of rhythm which were defined in Section 1: rhythm as oscillation with temporal persistence and frequency resonance. None of these properties are accounted for in isochrony-oriented annotation-mining approaches, though the time×duration scatter plot approach of Figure 6 provides useful information.
The concept of rhythms as oscillations requires methods for detecting the frequencies of rhythmic modulations of the speech signal as peaks, or rhythm formants, in the speech spectrum. The appropriate algorithms are essentially the same as the algorithms used for phone formant estimation in acoustic phonetics, but used in a spectral domain below 10 Hz with a much lower frequency range than the range below and above 1 kHz which is relevant for phone formant estimation. The Rhythm Formant Analysis method uses spectral analysis algorithms (Fast Fourier Transform, FFT) to analyze the speech signal, and identifies the frequencies of magnitude peaks in the spectrum as acoustic correlates of rhythms, interpreted as rhythm formants.
The speech signal has three distinct components which are relevant for modulation analysis with RFA (there are interactions between the components, and other modulation types, but these are not immediately relevant here):
1. A carrier signal (F0 with harmonics, generated in the glottis; consonantal noise) which is modulated in two ways by information signals;
2. Frequency modulation (FM) of the carrier signal with a low frequency FM information signal derived from slowly changing tones, pitch accents and intonations, which modulate the frequency (F0) of the carrier signal;
3. Amplitude modulation (AM) of the frequency modulated carrier signal with a low frequency AM information signal pertaining to the syllables, words, phrases, and longer sonority curves, which modulate the amplitude of the carrier signal.
Phonetic analysis (and human perception) of the speech signal amounts to demodulation of the signal, in the exact same technical sense of extraction of information-bearing signals from the modulated carrier signal as in AM and FM radio broadcasting, though with the carrier in very different frequency ranges - around 100 Hz, not, say, 100 MHz:
1. FM demodulation extracts the LF FM information (relating to tones, pitch accents and intonations) and is shown as variations in fundamental frequency (F0, the “pitch track”).
2. AM demodulation extracts the LF AM information (the “sonority curve” of syllable, word, phrase and longer discourse units).
RFA is concerned with the demodulation of the speech signal. Only AM demodulation is considered in the present contribution. The details of rhythms, their frequencies and magnitudes, are obtained by spectral analysis with a Fast Fourier Transform (FFT) applied to long segments of the signal. The resulting spectrum is examined for spectral peaks which are compared with spectral peaks from long segments in other signals from the same speaker or from other speakers, genres or languages.
In a full analysis, for example in traditional forms of speech recognition, phones and phone sequences are also demodulated, but detailed phone demodulation is not of immediate interest. FM tones, pitch accents and intonations, i.e., modulations of F0, also contribute to impressions of rhythm, but are not further considered here (Gibbon, 2021).
4.2. A “clear case” of a rhythmic register: counting
Figure 7 illustrates several features of the RFA method with an acoustic phonetic visualization of counting from one to ten in Ibibio: kèèd, ìbà, ìtá, ìnààñ, ìtíòn, ìtìòkèèd, ìtíàbà, ìtìàìtà, ùsúkkèèd, dùòp. The top panel of Figure 7 shows the waveform and, superimposed, the demodulated LF AM “sonority” envelope. The middle panel shows the LF FM modulation of the male voice with modulations of the carrier wave ranging from 110 to 165 Hz. The bottom panel shows the LF AM spectra of the first and the second halves of the signal.
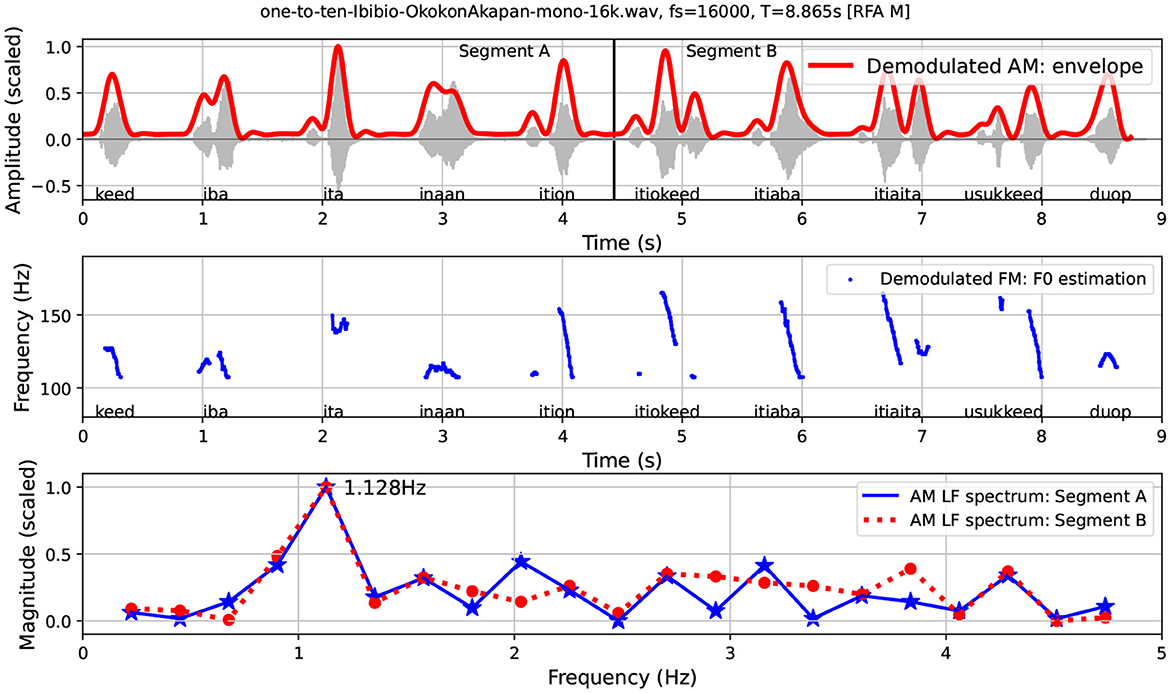
Figure 7. Counting from 1 to 10 in Ibibio: waveform, LF AM envelope, LF FM (F0) estimation and LF AM spectrum.
The morphology of numeral systems, together with the formality of the register of counting, can be expected to provide fairly precise information about basic word rhythms. In English (Gibbon, 2021) the largely simplex monosyllabic numerals below 10 contrast with the disyllabic teens and the trisyllabic twens of the system.
Figure 7 shows an RFA visualization of the base five numeral morphology of Ibibio, in which the morphologically simple numbers from 1 to 5 have a different morphophonological structure from the morphological compounds which constitute the numbers from 6 to 9 (5+1, 5+2, 5+3, 5+4), followed by a new morpheme for 10. The structure of the numerals from 1 to 5 is either monosyllabic (1) or disyllabic (2–5), while the structure of the numerals from 6 to 10 is either monosyllabic (10), trisyllabic (6, 7, 9) or quadrisyllabic (8). Consequently, different rhythmic effects in the two halves are to be expected.
Inspection of the waveform and the AM envelope shows that there are 10 words in 8.865 s, an average interval of about 0.887 s per word, corresponding to a word rate of ≈1.127 words per second. The word rate of 1.127 and the different morphophonology of the sequences 1–5 and 6–9 leads to two predictions. If the words are approximately equally timed, then:
1. There will be a measurable frequency of about 1.127 Hz in the LF spectrum, corresponding to the word rate, and
2. The more complex morphophonology in the second half will necessarily be associated with the faster rhythms of a higher number of component syllables than the simpler morphophonology in the first half.
To test these predictions the signal was divided into two halves: segment A, corresponding to the numerals 1–5, and segment B, corresponding to the numerals 6–10. Separate spectral analyses were made of these two halves. The analyses are shown as separate spectral slices in the bottom panel of Figure 7. Spectral magnitude values rather than energy values are used, with the values rescaled to 0, ..., 1 in order to permit comparison of the spectral shapes rather than of the absolute magnitudes (this also applies to the analyses in the following sections). The results are as follows:
1. The two spectral slices both share a high magnitude rhythm formant at 1.128 Hz, very close to the 1.127 Hz predicted by the rule-of-thumb word count based on the waveform and the AM envelope.
2. In the higher frequency ranges the spectral slices of the two segments differ, with much more diffuse frequencies for Segment B, by virtue of the greater range of morphophonological structures.
Accounting for the individual spectral magnitudes leads too far from the main topic of the present study and requires provision of spectral analyses of far more spectrum parts. However, the results of the counting example already show that RFT can provide a principled modulation-theoretic, empirically well-grounded causal explanation for different speech rhythms in the physical acoustic domain.
4.3. RFA in Speech Modulation Theory
The explanatory theoretical background to Rhythm Formant Theory lies in Speech Modulation Theory. The terminology “rhythm formant” is used because both LF rhythm formants (below 10 Hz) and HF (high frequency) phone formants (between about 300 Hz for F1 and 2,500 Hz for F2 and F3) share the same acoustic definition: magnitude peaks in the spectrum.5 A more detailed account of Rhythm Formant Theory and its associated Rhythm Formant Analysis methodology is given in Gibbon (2021) with an application to rhetorical speech in Gibbon and Li (2019) and to second language (L2) fluency evaluation (Lin and Gibbon, 2023).
The history of modulation theoretic analyses of rhythm is long but sparse, and ranges from linguistic phonetic and phonological approaches (Ohala, 1992; Dziubalska-Kołaczyk, 2002) to signal theoretic approaches (Todd and Brown, 1994; Traunmüller, 1994; Cummins and Port, 1998; Barbosa, 2002; Tilsen and Johnson, 2008; Tilsen and Arvaniti, 2013; Gibbon, 2021), among others.
The Speech Modulation Frequency Scale in Figure 8 shows the domain of RFT at the LF end of the three three main frequency ranges: (1) LF AM modulation by speech rhythms, (2) the carrier signal at mid-frequencies, with LF FM modulation attributable to tones, pitch accents and intonations, and (3) LF AM modulation of HF harmonics by filtering in the oral and nasal tract, attributable to phonemes and their allophones. The three frequency bands for the three components of the speech signal show an interesting exponential pattern: from order of magnitude 100 Hz (1 Hz) for word rhythms and 101 Hz (10 Hz) for syllable rhythms, pertaining to both LF AM and LF FM, through order of magnitude 102 Hz (100 Hz) for the FM modulated carrier frequency (F0), to order of magnitude 103 Hz (1,000 HZ) for the LF phone formant modulations of the carrier signal harmonics.
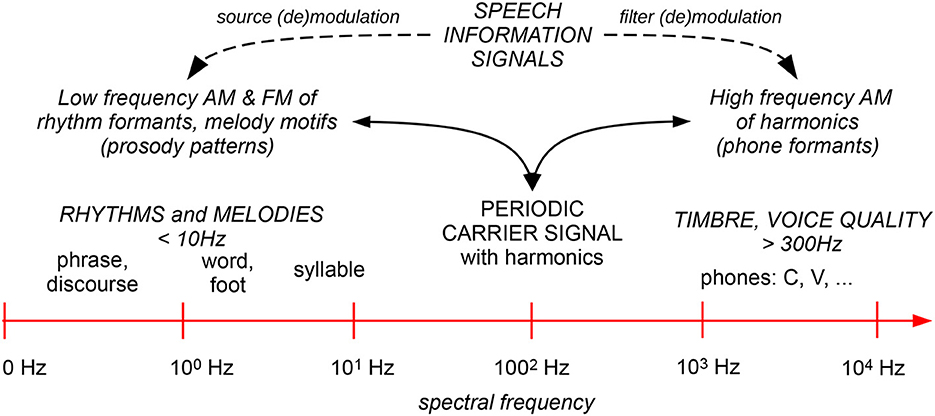
Figure 8. Speech modulation frequency scale.
The counting register described in the preceding subsection is a clear case in which rhythm formants can be clearly identified, implying that there are other registers which vary in rhythmicality, as the analysis of interactive orature in following section shows. RFA captures the frequency, persistence and resonance properties of rhythm, the missing links in the annotation-mining approaches. It is predicted that these properties can be used to compare rhythms of different language varieties and registers. This prediction is tested in the following section.
5. Quantitative results: data comparison
5.1. Rhythm vector extraction
The procedures described in the previous section provide the foundation for extracting spectral properties in the form of vectors for comparing languages and language varieties. There are many options for creating vectors, such as the following non-exhaustive list:
1. From the LF spectrum:
• The entire LF spectrum,
• The vector of the n highest magnitude frequencies or their magnitudes,
• The m highest magnitude spectral peaks or their magnitudes,
• Magnitudes and frequencies above a certain magnitude level l,
2. From the spectral slices in the LF spectrogram:
• The trajectory through all the spectral slices of the highest magnitude frequencies or their frequencies in each slice,
• A matrix of trajectories of other choices under the LF spectrum options.
The values of n, m and l in each case are chosen empirically on the basis of their value for interpreting comparisons between language varieties. For the present discussion, the 10 highest magnitude spectral frequencies were chosen (“lfammaxfreqs” in the figure legends). Extraction of the highest magnitude frequencies may result in ignoring lower magnitude peaks, but captures the lower but still high magnitude levels surrounding the highest peaks. These frequencies are important for characterizing the overall shape if the bandwidths of formants associated with the highest peaks are relatively broad, or the peak frequencies fluctuate slightly.
Using the selected vectors, standard distance metrics are used to generate a triangular distance table showing differences (and, by implication, similarities) between vectors. The distance table is created using a standard distance metric, Manhattan Distance (also known as Taxicab Distance, Cityblock Distance and Mannheim Distance), the sum of absolute differences between corresponding positions in the vectors. The intuition behind Manhattan Distance is that a complex terrain cannot always be traversed in a straight line (as with Euclidean Distance), but only via possibly right-angled corners, as a taxi-driver in Manhattan or Mannheim would do. Intuitively, the rhythm formant structure in the LF spectrum appears to be compatible with this assumption. There are many other distance metrics; in similar experiments, Canberra Distance, Euclidean Distance and Cosine Distance were also tried, but turned out to be less useful.
The spectral resolution of the FFT analysis depends on the window interval to which it is applied. Since the recordings differ in length, and the FFT window is the entire recording, the vectors for the different recordings differ in frequency resolution. As the distance metrics require identical lengths, all vectors are dynamically extrapolated to the length of the longest vector in the set.
5.2. Distance networks
The pairwise distances between the length-normalized vectors are rescaled to the range (0,...,1), and the triangular distance matrix is calculated and visualized as a distance network (Figure 9). If all distances are shown, the network is fully connected and the figure does not immediately reveal interesting visual patterns, so the network in Figure 9 uses a maximum distance threshold, in this case = 0.51. The example shows distances between recordings based on the 10 highest magnitude values in the LF spectrum below 10 Hz.
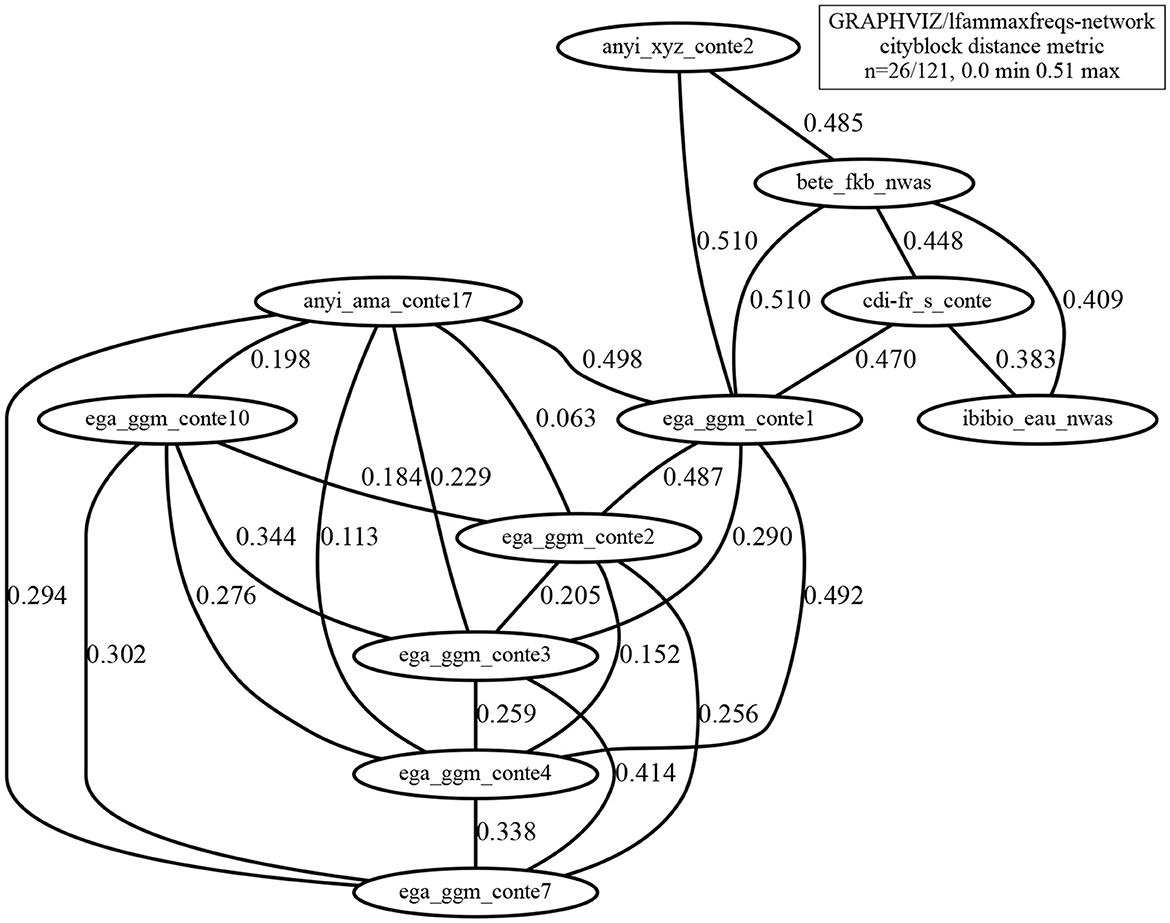
Figure 9. Distance network based on the vector of the 10 highest magnitude frequencies in the spectrum, relating recordings with pairwise distances < 0.51 (max. distance normalizlknow ed to 1.0).
The most conspicuous regions of the network are the following:
1. The cluster Bete, Ibibio and CdIFr recordings of reading aloud (top right), with distances <0.45;
2. The cluster with all but 2 of the Anyi and Ega extempore recordings (large leftmost cluster), with distances <0.42;
3. The Ega conte1 node linking these two regions, but closer to the reading group than to the rest of the extempore group, with distances <0.47 and <0.487, respectively;
4. The Anyi conte2 node is somewhat isolated, with a distance of 0.485 to its nearest node, which is actually in the reading-aloud cluster, the next nearest being the Ega conte1, the borderline linking node between the readings and the other extempore narratives; the style of Anyi conte2 is interpreted as being more formal than the style of the other Anyi presentation, bringing it closer to the Ega presentations.
It is striking that the first cluster in this list contains precisely the register of read-aloud non-interactive narratives and the second is the register of extempore stories. The similarity between the Ega conte1 recording and the read-aloud recordings may be because it was the first to be recorded in the Ega recording sessions, while the other Ega recordings became less formal as the sessions continued. The speaking style in the Anyi conte17 recording is informal, but the earlier Anyi conte2 recording is more formal, as already noted, possibly as it is also earlier in the recording series.
5.3. Distance hierarchies
A more complete overall picture of relationships between the recordings is given by hierarchical clustering and can be rendered as a dendrogram (Figure 10). The clustering is calculated according to the same criterion as the distance network, Manhattan Distance, with the addition of the complete (farthest neighbor) distance linkage clustering method, a robust criterion which takes the farthest distance between any two elements in the clusters in order to fuse the clusters into a superordinate cluster. The linkage criterion thus adds an additional layer of inductive generalization to the analysis.
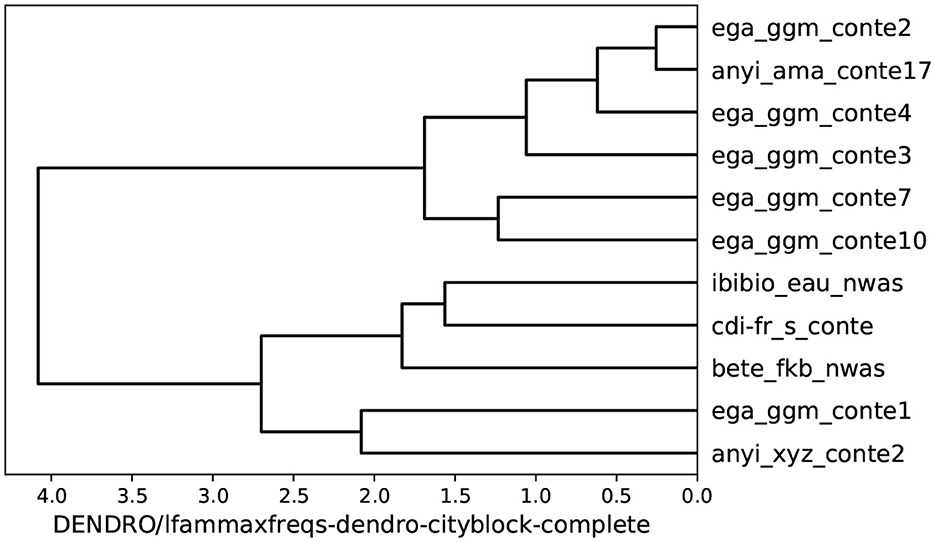
Figure 10. Hierarchical clustering of similarity relations between the recordings, with Manhattan Distance and farthest neighbor linkage, based on the vector of the 10 highest peaks in the spectrum.
The hierarchical clustering dendrogram shows the relations between reading and non-reading groups in more detail than the distance networks. The read-aloud recordings (ibibio_eau_nwas, cdi-fr_s_conte, bete_fkb_nwas) cluster together, and at the next hierarchical cluster level they are joined by the two more formal Ega and Anyi cases (ega_ggm_conte1, anyi_xyz_conte2). The more informal anyi_ama_conte17 clusters closely with the remaining 5 Ega recordings. As expected, the relations in Figure 9 are reflected in Figure 10. The pairwise distance comparison thus yields the predicted result: the read-aloud stories are distinguished from the interactive oral narratives, as predicted.
Automatically arranging languages or styles in a network or dendrogram is not the end of the story, however, though it is already very useful. The phonetician or linguist clamors for an explanation of why this classification works, not only a representation or a description. This need is addressed in the following section, first by means of holistic interpretation of long-term spectra of the data and then by means of holistic interpretation of spectrograms.
6. Interpretative results: a holistic perspective
6.1. Frequency: the LF spectrum
The quantitative analyses in the preceding section provide useful insights but they need explicit interpretation, as algorithmic correctness or statistical significance alone do not imply relevance or importance. Two interpretation steps are taken in this section. The first step is to examine and understand the spectral shapes which are extracted from the AM envelopes by applying an FFT to the entire event of story-telling or reading, and were illustrated in Figure 7. The holistic analysis is applied whether the event is a few seconds long, as in the Ibibio counting example, one minute, as with the read-aloud stories, or in the case of the extempore stories, five minutes or more.
Further quantitative analysis of spectral shapes are a legitimate but different issue. Holistic interpretation of the holistic LF spectra is not concerned with quantitative details of individual spectra but with the “gestalt” of the spectrum, i.e., the visual shape. Consequently, the individual subfigures in Figure 11 are deliberately kept together in a very compact format in order to encourage holistic interpretation. The sources of the spectra are identified in the caption. Ideally, the holistic descriptions would be performed by an independent panel of judges but this is not feasible within the current research environment.
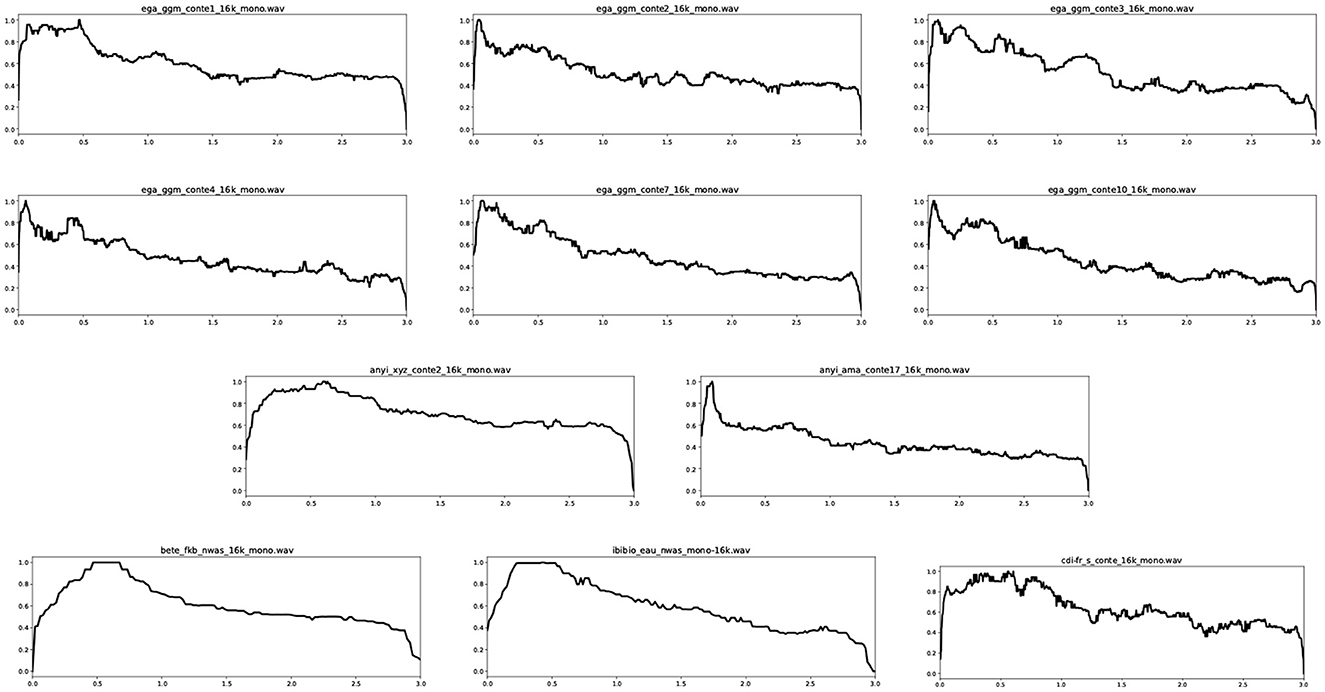
Figure 11. LF spectra of the data examples, smoothed with a moving median window and compactly formatted for holistic interpretation: Row 1: Ega conte1, Ega conte2, Ega conte3. Row 2: Ega conte4, Ega conte7, Ega conte10. Row 3: Anyi conte2, Anyi conte17. Row 4: Bete; Ibibio; CdIFr. (readings).
Interpretation:
1. Ega (rows 1 and 2): The lowest salient peaks cover approximately the same range, 0.1 to 0.5 Hz, indicating discourse rhythms which correspond to intervals between 10 and 2 s. The first Ega story (row 1: 1) has a broad formant over this range while the other Ega stories have similar patterns of two or three peaks. These stories are narrated by the same male speaker.
2. Anyi (row 3): The two stories have quite different spectral patterns, and are narrated by different female speakers. The first story is narrated in a very restrained and somewhat monotonous style and the LF spectrum is very much unlike the Ega LF spectra; it has a broad salient region with a peak at about 0.6 s. The second story is narrated in a lively style, with drums and chants, and the spectrum is similar to the Ega stories in having a salient peak at about 0.1 Hz, corresponding to intervals of 10 s.
3. North Wind and Sun readings (row 4: 1 and 2): The Bete (row 4: 1) and Ibibio (row 4: 2) readings of The North Wind and the Sun are in a fairly neutral formal reading style and have very similarly shaped spectra, with a slope up to a peak around 0.5 s (Bete) and 0.6 s (Ibibio). The shapes of the Bete and Ibibio LF spectra and the spectrum of the first Anyi story are very similar, perhaps indicating a shared feature of formality. The durations of the Bete and Ibibio spectra are very similar, while the first Anyi story is almost twice as long as these two, but has less than half the durations of the other Anyi story and the Ega stories.
4. CdI French reading (row 4: 3): The CdIFr LF spectrum has a similar overall shape to the Bete and Ibibio readings and the first Anyi story, again presumably indicating a feature of formality which may be associated with reading aloud, and also a feature of less lively oral narrations.
Although the long-term spectra show distinctive patterns which are explainable in terms of categories and structures of a discourse grammar, the spectrum has formal and empirical limitations: the spectrum contains no temporal information about how long the rhythms last, and therefore cannot capture the persistence and resonance criteria for rhythms. In fact, even one or two periods, which would not actually count as a rhythm, will be registered in the spectrum.
Consequently, a spectrum only permits formulating tentative hypotheses about rhythms, since it is an abstraction from the essential temporal information required for a full characterization of rhythm. The following section is concerned with providing the missing temporal dimension by means of interpretation of LF spectrograms.
6.2. Time: the LF spectrogram
LF spectrograms are calculated for each of the data items in order to capture temporal properties of rhythms. Each spectrogram consists of a sequence of spectral slices, i.e., spectra which are calculated from FFT analyses with shorter windows. However, “short' is relative: in order to capture the very low frequencies involved, the windows for the LF formants have to be very much longer than the 5 ms or so which are used to capture HF phone formants. In order to cover the low frequencies of the rhythm formants, the window interval is set at 8 s.
The 8 s moving window means high frequency resolution but low temporal resolution, a practical case of Heisenberg's “principle of uncertainty”. The lost temporal resolution is regained by overlapping the windows almost completely and moving forward in very short strides of the order of 50 ms. In order to ensure that the final 8 s are not ignored in the final window step, the recordings are lengthened by 8 s of blank audio (which creates small artifacts at the end of the spectrograms).
The spectrograms are rendered in traditional heatmap format with vertical spectral slices in a 3-dimensional representation time×frequency×magnitude, with time on the x-axis, frequency on the y-axis, and magnitude as color or gray shading (cf. Figure 12) with darkest meaning strongest. Rhythmic sequences at a given frequency appear as dark horizontal bars and provide evidence for the persistence and resonance criteria for rhythm.
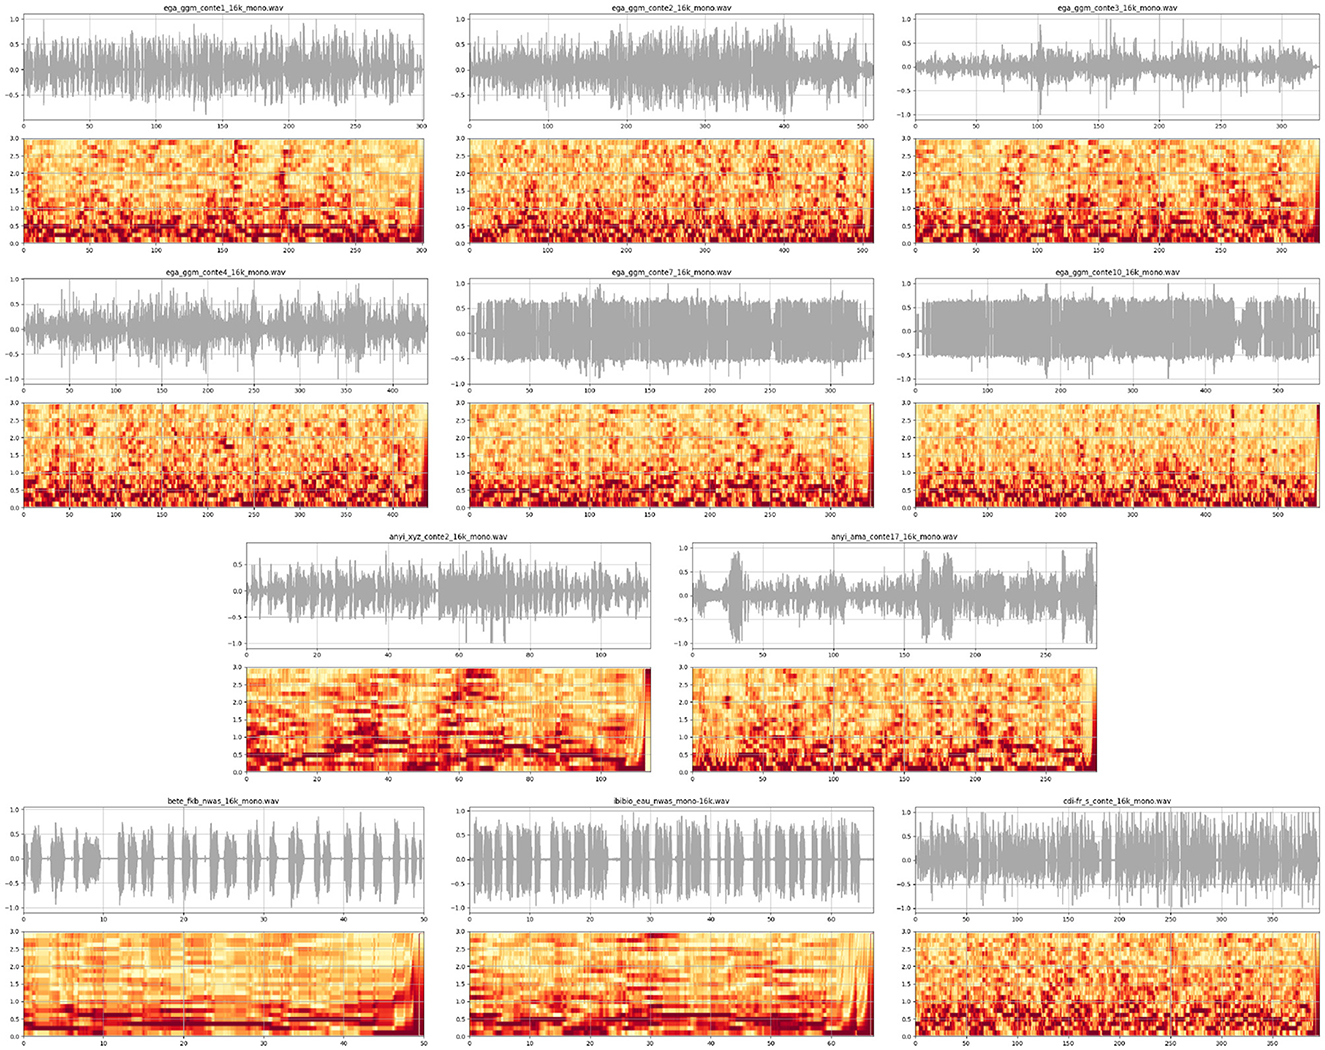
Figure 12. LF spectrograms of the data examples, filtered to emphasize the higher frequencies, and compactly formatted for holistic interpretation and comparison: Row 1: Ega conte1, Ega conte2, Ega conte3. Row 2: Ega conte4, Ega conte7, Ega conte10. Row 3: Anyi conte2, Anyi conte17. Row 4: Bete; Ibibio; CdIFr. (readings).
The spectrograms can be interpreted as follows:
1. Ega (rows 1 and 2): Pairs of dark horizontal bars are evident in the first Ega story (row 1: 1), at two frequencies, and correspond to the rhythmical chanting periods, which appear in the waveform oscillogram as regularly spaced vertical bars. The third story (row 1: 3) is somewhat similar, and the second story (row 1: 2) also contains a highly rhythmical section close to the beginning, with similar horizontal bars. In the other stories horizontal bars can also be oberved, though they are shorter and more scattered.
2. Anyi (row 3): The two Anyi spectra are quite different from each other, partly due to the much shorter duration and greater formality of the first story, where the horizontal bars are very prominent. In the second story, the horizontal bars are more scattered, as in the majority of the Ega stories.
3. Bete, Ibibio (row 4): The Bete (row 4: 1) and Ibibio (row 4: 2) readings have approximately the same duration, and the horizontal bars are very prominent, as expected in a more formal style (both native speakers are university professors). The very clear multiple rhythms at different frequencies in the Ibibio example are particularly interesting, indicating temporally regular enunciation of smaller speech units such as words and syllables.
4. CdIFr: The Ivorian French reading is more similar to the Ega stories and the second Anyi story, but with a greater concentration of lower frequencies in the spectrogram.
The detailed temporal information in the spectrograms supports the results of the holistic spectral analysis. In effect, they tease apart the formant peaks in the LF spectrum and assign them to different times. The horizontal bars are most salient in the readings which had already been interpreted as more formal, in particular in the shorter Bete and Ibibio readings. This might be expected from a reading aloud speech activity whose rhythmicity might be predicted to be quite high. The fact that these recordings have durations of around 1 min, rather than the 2–9 min of extempore narrations enhances the visual impression of the relatively long resonant phases in the spectrograms.
The many details which have not been discussed call for further investigation of the temporal patterning of small speech units within the story, in addition to the clear rhythmical patterns; this is beyond the scope of the present study, however.
In conclusion, the issue mentioned at the end of the previous section, that spectral analysis can register even a single period, is now resolved, since temporal information is available in the spectrogram. The interpretation of horizontal bars in the spectrogram is closely related to the principle that a rhythm must have at least three beats, expressed as the principles of persistence (a minimum rhythm sequence length) and resonance (persistence of the same frequency).
7. Summary, conclusions and outlook
The present transdisciplinary study explores a new methodology which combines functional, structural and causal explanations, and models rhythms and rhythm variation by means of acoustic phonetic analysis. The method is applied to interactive narratives in two West African languages, Anyi and Ega, in comparison with reading aloud in other West African languages.
The languages concerned were introduced, together with a brief account of the background to the narration events, the content of the narrative and the roles of the participants, and the dynamic narrative development pattern was summarized formally in a transition network. An initial discussion of time domain patterns in the narratives was conducted using a tier of turn annotations of two of the narratives, one each in Anyi and Ega, with interpretation of rhythms using visualization of a discourse turn duration pattern, and by relating a hierarchical classification of turn durations to turn types.
Rhythm Formant Theory (RFA) and its associated methodology of Rhythm Formant Analysis (RFA) were introduced and applied initially to rhythm formants in the low frequency spectrum and to the clustering of data samples. In order to provide time domain information on temporal rhythm variation, low frequency spectrograms were introduced for visual interpretation.
At the outset, the following questions were raised and answered in the course of the discussion:
1. Which overall utterance duration patterns are observed in different turn types (narrator, responder, audience) during the narrative? Answer: concurrent rhythms at different frequencies are empirically established using both annotation mining and RFA.
2. How rhythmical are these patterns? Answer: In order to complete the definition of rhythm as oscillation, additional criteria of persistence in time and resonance (persistence in frequency) were introduced.
3. Are there functional interpretations of the differences between rhythm patterns within orature sessions or between sessions in different languages? Answer: Functional interpretations of rhythm patterns were related to turn interaction types, speech registers and social structures, for example with the chef du village as narrator, compared with a popular and more informal narrator without this status, to different narration styles and to the genre difference between extempore interactive narration and more formal read-aloud narratives. Rhythm variation was initially demonstrated using the register of counting aloud.
The claim is that the Rhythm Formant Theory and Rhythm Formant Analysis approach is empirically better grounded the rhythm index approaches and also than approaches which rely only on the analysis of the LF spectrum rather than the LF spectrogram. It was demonstrated that the definition of rhythm provided from the start has inherent explanatory value in a number of ways. First, RFT/RFA provides criteria for distinguishing between more and less adequate descriptions, which was shown in the falsification chain of falsified and improved models. Second, RFT/RFA relates easily to functional explanation based on qualitative discourse analysis criteria. Third, RFT/RFA provides a structural explanation in the form of a formal explication for rhythm patterns in the form of a cyclical transition network. Fourth, RFT/RFA provides a causal theory, analysis method and interpretability criteria for realtime rhythm and its relations with the forms and structures of language.
Data availability statement
The datasets presented in this article are not readily available because the dataset consists of audio tracks of fieldwork recordings and the participants are identifiable. Therefore, the recordings are not publicly available but can be used provided that a request is made to the author. The two photos used in the article are by permission of the subjects. Requests to access the datasets should be directed to DG.
Ethics statement
Ethical review and approval was not required for the study on human participants in accordance with the local legislation and institutional requirements. The data was collected as part of fieldwork projects carried out in 2001 and 2002, with approval from the University of Abidjan and the relevant Président de la Préfecture and Chef du Village. Written informed consent for participation and publication of identifiable data/images was not required for this study in accordance with the national legislation and institutional requirements. The participants' oral consent for both participation and the publication of identifiable data/images was documented in the digital recordings. The procedure was approved at the time by the funding agencies VW Foundation and German Academic Exchange Service.
Author contributions
The author confirms being the sole contributor of this work and has approved it for publication.
Acknowledgments
Special thanks are due to Kouamé Ama Bié and the late Grogba Gnaoré Marc, the narrators of the Anyi and Ega fables; to the villagers of Adaou and Gniguédougou, Côte d'Ivoire; to Firmin Ahoua as co-PI and to Sandrine Adouakou, as Agni researcher; to Eno-Abasi Urua, Moses Ekpenyong, and Mfon Udoinyang for comprehensive support with Ibibio; to Sophie Salffner and Nadine Grimm, both as student co-fieldworkers and, together with Karin Looks and Alexandra Thies, as language documentation experts and annotators. I am very grateful to the late Nicla Rossini as co-author of a study on gesture in Ega orature; to Jolanta Bachan for discussions on finite state dialogue modeling; to the late Wiktor Jassem and the late Grzegorz Dogil for discussions of spectral analysis and segmentation; to Jue Yu and Huangmei Liu, Shanghai, and to Xuewei Lin and Peng Li, Guangzhou, for their support in developing RFT and RFA. Financial support from the DAAD, the VW Foundation and the DFG for fieldwork funding is also acknowledged. I am especially grateful to the reviewers and to Rosemarie Tracy for many insightful queries and comments, and for their insistence on paying more attention to reader uptake.
Conflict of interest
The author declares that the research was conducted in the absence of any commercial or financial relationships that could be construed as a potential conflict of interest.
Publisher's note
All claims expressed in this article are solely those of the authors and do not necessarily represent those of their affiliated organizations, or those of the publisher, the editors and the reviewers. Any product that may be evaluated in this article, or claim that may be made by its manufacturer, is not guaranteed or endorsed by the publisher.
Footnotes
1. ^The terms “word” and “sentence” are used in general senses, since grammar is not a prime concern in this context: “word” includes lexical words, phonological words and feet; “sentence” includes clauses and phrases.
2. ^The expectation created by a rhythm is conceptually related to the econometric concept of Granger Causality in time series, in that context without necessarily implying a rhythm: ”A time series X is said to Granger-cause Y if it can be shown [...] that those X values provide statistically significant information about future values of Y.” (Wikipedia; p.c. by A. J. Gibbon).
3. ^Available online at: https://github.com/dafyddg/RFAGUI/.
4. ^Technically, a metric must fulfil the “triangle inequality” condition: for any three points, the sum of the lengths (i.e., distances between the points) of any two sides of the triangle which they constitute must be greater than or equal to the length of the third side. In the case of equality the points are on a straight line.
5. ^The term “rhythm formant” was suggested by Huangmei Liu, Shanghai, and replaces the older term “rhythm zone”. The articulatory and perceptual definitions of “formant” differ: in articulatory terms a formant is a resonant filter frequency of the vocal tract, and in perceptual terms a formant is a filter frequency which contributes to a particular sound quality (as between the vowels [i] and [a]). Also, F0, the fundamental frequency, which functions as a carrier signal for FM and AM modulation, can be seen as a formant from the acoustic point of view (which is why it is often labelled “F0” rather than “f0' to match the phone formants F1, F2, F3), but not from an articulatory or perceptual point of view as it is a property of a carrier signal source not of a modulator.
References
Arvaniti, A. (2009). Rhythm, timing and the timing of rhythm. Phonetica 66, 46–63. doi: 10.1159/000208930
Barbosa, P. (2002). “Explaining cross-linguistic rhythmic variability via a coupled-oscillator model for rhythm production,” in Proceedings of the 1st International Conference on Speech Prosody, eds B. Bel, and I. Marlien (Aix-en-Provence: Laboratoire Parole et Langage), 163–166.
Berry, J., and Spears, R. (1991). West African Folktales. Evanston, IL: Northwestern University Press.
Blench, R. (2015). The Ega language of Côte d'Ivoire: Etymologies and Implications for Classification. Available online at: https://www.academia.edu/33800011/The_Ega_language_of_Cote_dIvoire_how_can_it_be_classified (accessed October 12, 2022).
Bole-Richard, R. (1983). “Ega,” in Atlas Linguistique des Langues Kwa, ed G. Hérault (Abidjan: Institut de Linguistique Appliquée, Agence de Coopération Culturelle et Technique), 359–401.
Connell, B., Ahoua, F., and Gibbon, D. (2002). Illustrations of the IPA: Ega. J. Int. Phonet. Assoc. 32, 99–104. doi: 10.1017/S002510030200018X
Cummins, F., and Port, R. (1998). Rhythmic constraints on stress timing in English. J. Phonet. 26, 145–171.
Dilley, L. C. (2005). The Phonetics and Phonology of Tonal Systems [thesis (Ph.D.)]. Cambridge, MA: Massachusetts Institute of Technology, Dept. of Linguistics and Philosophy.
Ekpenyong, M. E., and Udoh, I. I., (eds.). (2022). Current Issues in Descriptive Linguistics and Digital Humanities. A Festschrift in Honor of Professor Eno-Abasi Essien Urua. Singapore; Springer Nature.
Gibbon, D. (1981). “A new look at intonation syntax and semantics,” in New Linguistic Impulses in Foreign Language Teaching, eds A. James, and P. Westney (Tbingen: Narr), 171–198.
Gibbon, D. (1987). “Finite state processing of tone systems,” in Proceedings of the Third Conference of the European Association for Computational Linguistics (EACL) (Copenhagen: European Association for Computational Linguistics), 291–297.
Gibbon, D. (2001). “Finite state prosodic analysis of African corpus resources?,” in EUROSPEECH 2001, 7th European Conference on Speech Communication and Technology, 2nd INTERSPEECH (Aalborg), 83–86.
Gibbon, D. (2003). “Computational modelling of rhythm as alternation, iteration and hierarchy?,” in Proceedings of the International Congress of Phonetic Sciences, volume III (Paris: Barcelona), 2489–2492.
Gibbon, D. (2006). “Time types and time trees: Prosodic mining and alignment of temporally annotated data,” in Methods in Empirical Prosody Research, eds S. Sudhoff, D. Lenertova, R. Meyer, S. Pappert, P. Augurzky, I. Mleinek, et al. (Berlin: Walter de Gruyter), 281–209.
Gibbon, D. (2014). Visualisation of Distances in Language Quality Spaces: DistGraph, an Online Teaching Tool for Language Typology Data Mining. Available online at: https://wwwhomes.uni-bielefeld.de/gibbon/DistGraph/.
Gibbon, D. (2016). “Legacy language atlas data mining: mapping Kru languages,” in Proceedings of the Language Resources and Evaluation Conference (LREC). ELRA/ELDA.
Gibbon, D. (2018). “The future of prosody: it's about time,” in Proceedings of the 9th International Conference on Speech Prosody (Poznañ: SProSIG), 1–9.
Gibbon, D. (2021). The rhythms of rhythm. J. Int. Phonet. Assoc. 53, 233–265. doi: 10.1017/S0025100321000086
Gibbon, D., Bow, C., Bird, S., and Hughes, B. (2004). “Securing interpretability: the case of Ega language documentation,” in Proceedings of the 4th International Conference on Language Resources and Evaluation (LREC 2004) (Paris: ELRA), 1369–1372.
Gibbon, D., Gut, U., Adouakou, S., and Urua, E.-A. (2002). “Rhythm in West African tone languges: a study of Ibibio, Anyi and Ega,” in Typology of African Prosodic Systems, volume 1 of Bielefeld Occasional Papers in Typology (Bielefeld: Bielefeld University), 159–165.
Gibbon, D., and Li, P. (2019). “Quantifying and correlating rhythm formants in speech,” in Proceedings of Linguistic Patterns in Spontaneous Speech (LPSS) (Taipei. Academia Sinica), 1–6.
Grabe, E., and Low, E. L. (2002). “Durational variability in speech and the rhythm class hypothesis,” in Laboratory Phonology 7, eds C. Gussenhoven, and N. Warner (Berlin; New York, NY: De Gruyter Mouton), 515–546.
Hérault, G. (1983). Atlas Linguistique des Langues Kwa. Abidjan: Institut de Linguistique Appliquée, Agence de Coopération Culturelle et Technique.
Juola, P. (2015). The Rowling Case: a proposed standard analytic protocol for authorship questions. Digit. Scholar. Human. 30(Suppl. 1), 100–113. doi: 10.1093/llc/fqv040
Lin, X., and Gibbon, D. (2023). “Distant rhythms: computing fluency,” in Proceedings of the International Congress of Phonetic Sciences. Prague: Charles University.
Lô, G., de Boer, V., and van Aart, C. J. (2020). Exploring West African folk narrative texts using machine learning. Information 11, 236. doi: 10.3390/info11050236
Marchese, L. (1983). Atlas linguistique Kru. Abidjan: Institut de Linguistique Appliquée, Agence de Coopération Culturelle et Technique.
Milde, J.-T. (2002). “The TASX-environment: an XML-based toolset for the creation of multimodal corpora,” in COLING-02: The 2nd Workshop on NLP and XML (NLPXML-2002) (Stroudsberg, PA: Association for Computational Linguistics), 1–6.
Nakamura, S., and Sagisaka, Y. (2011). “A requirement of texts for evaluation of rhythm in English speech by learners,” in 17th International Congress of Phonetic Sciences, ed I. P. Association (Hong Kong: International Phonetics Association), 1438–1441.
Nerbonne, J., and Kretzschmar, W. (2003). “Introducing computational techniques in dialectometry,” in Computers and the Humanities, Computational Methods in Dialectometry, eds B. Miller, A. Lieto, R. Ronfard, S. G. Ware, and M. A. Finlayson, (Philadelphia: Kluwer) 245–255.
Ninan, O. D., Ajíbádé, G. O., and Odéjobí, O. A. (2016). “Appraisal of computational model for Yorùbá folktale narrative,” in Proceedings of the 7th Workshop on Computational Models of Narrative (CMN 2016), eds B. Miller, A. Lieto, R. Ronfard, S. G. Ware, and M. A. Finlayson (Kraków), 1–14.
Ohala, J. (1992). “Alternatives to the sonority hierarchy for explaining segmental sequential constraints,” in Papers from the Parasession on the Syllable (Chicago, IL: Chicago Linguistics Society), 319–338.
Pierrehumbert, J. B. (1980). The Phonology and Phonetics of English Intonation. [Thesis (Ph.D.)]. Cambridge, MA: Massachusetts Institute of Technology, Dept. of Linguistics and Philosophy.
Rossini, N., and Gibbon, D. (2011). “Why gesture without speech but not talk without gesture?,” in Gesture and Speech Interaction Conference (GESPIN 2011) Bielefeld.
Rybicki, J., and Eder, M. (2011). Deeper Delta across genres and languages: do we really need the most frequent words? Liter. Linguist. Comp. 26, 315–321.
Savoy, J. (2020). Machine Learning Methods for Stylometry: Authorship Attribution and Author Profiling. Cham: Springer.
Tilsen, S., and Arvaniti, A. (2013). Speech rhythm analysis with decomposition of the amplitude envelope: characterizing rhythmic patterns within and across languages. J. Acoust. Soc. Am. 134, 628–639. doi: 10.1121/1.4807565
Tilsen, S., and Johnson, K. (2008). Low-frequency Fourier analysis of speech rhythm. J. Acoust. Soc. Am. 124, 34–39. doi: 10.1121/1.2947626
Todd, N. P. M., and Brown, G. J. (1994). “A computational model of prosody perception,” in Proceedings of the International Conference on Speech and Language Processing (Yokohama), 127–130. doi: 10.21437/ICSLP.1994-35
Traunmüller, H. (1994). Conventional, biological, and environmental factors in speech communication: a modulation theory. Phonetica 51, 170–183.
Keywords: Rhythm Formant Theory, Modulation Theory, speech rhythm, orature, story-telling, Ega, Anyi, Niger-Congo
Citation: Gibbon D (2023) Rhythm pattern discovery in Niger-Congo story-telling. Front. Commun. 8:1090030. doi: 10.3389/fcomm.2023.1090030
Received: 04 November 2022; Accepted: 20 April 2023;
Published: 17 May 2023.
Edited by:
Plinio Almeida Barbosa, State University of Campinas, BrazilReviewed by:
Donna Mae Erickson, Haskins Laboratories, United StatesDaniel Hirst, UMR7309 Laboratoire Parole et Langage (LPL), France
Copyright © 2023 Gibbon. This is an open-access article distributed under the terms of the Creative Commons Attribution License (CC BY). The use, distribution or reproduction in other forums is permitted, provided the original author(s) and the copyright owner(s) are credited and that the original publication in this journal is cited, in accordance with accepted academic practice. No use, distribution or reproduction is permitted which does not comply with these terms.
*Correspondence: Dafydd Gibbon, gibbon@uni-bielefeld.de
†ORCID: Dafydd Gibbon orcid.org/0000-0002-9825-5516