Five types on perception of global warming in Japanese
 Motoko Kosugi
 Kenshi Baba
- 1College of Engineering, Academic Institute, Shizuoka University, Hamamatsu, Shizuoka, Japan
- 2Faculty of Environmental Studies, Tokyo City University, Yokohama, Japan
Introduction: The study seeks to examine Japanese people's perceptions and attitudes toward climate change by segmenting and characterizing respondents using online survey data from 2017 and 2020.
Methods: The survey administered in 2017 had 2,997 respondents and the survey in 2020, 1,100 respondents. Five segments were identified based on aspects of people's understanding of global warming, their attitudes toward taking countermeasures, and analyses of the characteristics and changes in the segment composition.
Results: The groups identified were the “Alarmed,” who have a strong sense of urgency and undertake proactive measures; the “Indifferent,” who have limited interest and no clear opinion; the “Affirmative,” who tend to agree with all questions regardless of their content; and the “Skeptic,” who tend to suspect global warming. Provide negative responses to contradictory questions. The 2017 survey also yielded a segment called “Dismissive 2017,” and in the 2020 survey, a new segment called “Cautious 2020” was identified. People with unclear perceptions about climate change accounted for about 50% of respondents in both surveys.
Conclusion: The findings suggest that in communicating with the public regarding the implementation of countermeasures, it is necessary to consider the differences in awareness, knowledge, and perception of the effects of global warming among various segments of the population.
1 Introduction
1.1 Background of the study
The Intergovernmental Panel on Climate Change (IPCC) Sixth Assessment (IPCC The Sixth Assessment Report, 2021) reports that the global average temperature (2011–2020) has increased by 1.09°C compared to preindustrial times, and the frequency and intensity of heavy rainfall have increased since the 1950s over most of the land area. It concludes, “there is no doubt that human activity has warmed the atmosphere, oceans, and land area.”
Rising temperatures have resulted in various natural disasters around the world. In the Mediterranean region, climate change is accelerating environmental changes such as rising temperatures, heat waves, and droughts, causing loss of life and damage to infrastructure and ecosystems (Cramer et al., 2018). In the United States, warming of terrestrial ecosystems over the past century has led to changes in the frequency, intensity, and spatial patterns of natural disasters (Lamper et al., 2022), and Texas, a state particularly vulnerable to natural disasters, has shown a diverse and frequent occurrence of large-scale events with potentially harmful effects on mental health (Sansom et al., 2022). Climate change is also having a significant impact on agriculture and natural disasters in East and South Asian countries. Changes in climate patterns, such as higher temperatures, changes in precipitation, and increased frequency of extreme events such as cyclones, droughts, floods, and storms, are adversely affecting crop yields and livestock production (Rhaman et al., 2022). Climate change has increased the frequency and severity of extreme events such as heat waves, droughts, floods, and typhoons in China (You and Wang, 2021; Ning et al., 2022), while in Korea, both summer precipitation intensity and typhoon intensity have increased (Kim et al., 2018), as have drought frequency and severity (Nam et al., 2015).
Thus, climate change is a threat that directly endangers people's daily lives and requires urgent action. To drastically reduce the current level of greenhouse gas emissions, it is necessary for not only governments and corporations but also individual people to alter their behavior. Moreover, even under a scenario with the lowest greenhouse gas emissions and the smallest temperature increases, as mentioned above, rises in temperatures and changes in rainfall are already occurring, and people will have to respond to these as well.
1.2 Previous studies on risk communication
To encourage people to reduce greenhouse gas emissions and to take action against the impacts that are already occurring, it is imperative to provide them with appropriate information on climate change and countermeasures. In seeking to deliver such knowledge, it is critical to determine what type of people are seeking what type of information, what type of information media and communication measures and so on are effective, and to design information delivery measures tailored to the characteristics of the target population. The method of separating a target audience according to demographic and socioeconomic characteristics, values, and attitudes is called segmentation in the marketing field, and integrated marketing methods have been developed to combine content, media, and tools suitable to the characteristics of a target segment (Schultz, 1993; Nakayama, 2009). Concerning the provision of information on global warming, it is important to identify the number of people who share the same attitude toward global warming, in order to shape the content of the information and activities that are most effective in promoting understanding and action. In particular, when considering the use of adaptation measures to respond to climate change, it is necessary to have some understanding of the kind of knowledge and the attitudes about climate change that the people living in a particular country or region possess, because the type and scale of climate damage differ depending on geographical conditions.
Researchers who participated in the Yale Program on Climate Change Communication (YPCCC) conducted a public opinion survey in the United States in 2008 and found that “knowing the recipients” is a key first step in providing effective information. Using 36 items from public opinion survey data on climate change-related beliefs, attitudes, risk perceptions, involvement in the issue, and political preferences and actions, they classified Americans into the following six segments (the “Six Americas”) (Leiserowitz et al., 2009): the “alarmed,” who are the most concerned about global warming and willing to change their behavior and actively support policies; the “concerned,” who recognize global warming is a serious problem but have not taken action; the “cautious,” who are aware of the problem but do not feel the need to act; the “disengaged,” who have little interest in or concern about the issue; the “doubtful,” who believe that global warming is caused by natural changes in the environment; the “dismissive,” who believe that global warming is not a threat of anthropogenic origin and should not be addressed by the national government. This project identifies not only attitudes toward climate change but also details personal attributes, such as age, gender, values, political party support, and sources of information respondents come into contact with (Leiserowitz et al., 2012, 2015). YPCCC regularly conducts surveys and observes changes in the composition of the Six Americas. It has been reported that in the period of the five years from October 2014 to November 2019, the “concerned” from 34 to26% and the “cautious” decreased from 23 to 16%, the “alarmed” increased from 11 to 31%; and the “alarmed” became the largest number among Americans (Goldberg et al., 2020).
Studies categorizing people as in the YPCCC, have also been conducted in Australia (Morrison et al., 2013), India (Leiserowitz et al., 2013), Germany (Metag et al., 2017), and other countries. The categorization of Germans yielded five segments, that matched the same types found in the United States excluding the “dismissive”. In India, the segment characteristics are different, with one segment consisting of those who have “never heard” of climate change. In Bangladesh, while 94.5% of the respondents were aware of climate change and extreme weather events, a high percentage (45.8%) did not know about climate change (Kabir et al., 2016). The study by Kabir et al. (2016) suggests that education is the most influential factor in understanding the link between climate change and health impacts. Experiences of extreme weather events and associated natural disasters also shape people's perceptions that climate change is occurring.
These previous studies consistently indicate the importance of providing information that is tailored to the understanding and attitudes of people living in a country or region, and to their experience and realization of the effects of climate change.
1.3 Situation in Japan
In Japan, the temperature has increased at a rate of 1.28°C per century since the statistics began being recorded in 1989 (Japan Meteorological Agency, 2022a), and the annual frequency of 50 to 80 mm or more of precipitation per hour and the number of days with 200 mm or more, and with 400 mm or more of precipitation per day have also risen significantly (Japan Meteorological Agency, 2022b). According to a public opinion survey (Cabinet Office, 2016) on global warming conducted by the Cabinet Office in 2016, 87.2% of respondents (the sum total of the “concerned” and the “somewhat concerned”) were “concerned” about “global environmental issues such as global warming, ozone depletion, and tropical deforestation,” which is slightly lower than the 92.3% in a similar survey conducted in 2007, but the level of interest is high (Cabinet Office, 2007). Regarding the effects of global warming, many respondents cited an increase in natural disasters such as floods, storm surges, and tidal waves (63.1%), and a decrease in the quality and yield of agricultural products (57.7%). This result suggests that many Japanese perceive the recent increase in flood damage and the more intense impact on crops as linked to global warming.
According to the 2007 poll, more than half of the respondents were taking actions to combat climate change, such as “turning off lights frequently to reduce monthly electricity consumption (71.7%),” “not leaving the shower running (60.2%),” and “adjusting air conditioning temperature to 28°C in summer and 20°C in winter (53.8%). These energy- and resource-saving steps are mitigation measures to reduce greenhouse gas emissions, and people recognize and implement them daily to some extent. Regarding adaptation measures, the 2016 poll asked the respondents to read description as follows before response: It is clear that even with the implementation of global warming countermeasures, the average global temperature will increase. Adaptation to the effects of climate change refers to minimizing the damage and impacts of climate change caused by global warming and dealing with them in a way that allows for rapid recovery.” After this explanation, less than half of respondents were answered that they know “how to cope with climate change caused by global warming” (4.3% knew “well enough” and 43.2% “roughly enough”), indicating that adaptation measures are not well understood.
1.4 Purpose of the study
It is crucial to determine what type of information and communication measures are most effective in deepening people's understanding of how to respond to global warming, especially the use of adaptation measures, and to encourage them to support such measures and take action at the individual level. In this study, we segmented Japanese people based on their attitudes toward global warming using data from questionnaire surveys. These surveys were conducted in 2017 and 2020 to identify the characteristics of each segment and determine what kinds of beliefs the Japanese have about global warming and what percentages of the Japanese hold such beliefs, as well as whether the proportions of people with these beliefs are changing.
2 Materials and methods
2.1 Overview of the survey
The analysis in this study used data from online questionnaires administered in March 2017 and March 2020; therefore, this section provides an overview of the implementation of the two surveys, the content structure of the questionnaires, and the analytical methods used to segment the respondents.
2.1.1 Survey targets and implementation period
2017 survey: Internet monitors from a private research firm (2.2 million registered respondents) were asked to cooperate with the survey via email. Respondents' place of residence (47 prefectures) was assigned based on Japanese demographics so as to be representative of the Japanese population (adults). In addition, gender and age (20–79, in 10-year age increments) were assigned equally. However, since gender and age could not be assigned equally in prefectures with smaller populations and fewer respondents, we adjusted for respondents from prefectures with larger populations. The survey was conducted from March 27–29, 2017, and responses were received from 3,522 respondents.
2020 survey: Internet monitors (3.55 million registered respondents) from a different private research firm than in the 2017 survey were asked to cooperate in a survey via email, and 1,100 respondents responded. The number of respondents was assigned by place of residence (47 prefectures) based on demographics. Gender and age group (20–69, in 10-year increments) were assigned equally. The survey period was March 16–18, 2020. See Kosugi et al. (2018) for details of the 2017 survey and Kosugi et al. (2020) for details of the 2020 survey.
In Japan, the Climate Change Adaptation Law came into effect in December 2018, between the two surveys, and local governments are now developing regional climate change adaptation plans and establishing regional climate change adaptation centers as bases for collecting and providing information on adaptation (Climate Change Adaptation Information Platform, 2016; Ministry of the Environment, 2016).
2.2 Questionnaire
Both the 2017 and the 2020 survey consisted of three parts. Part 1 comprised questions aimed at measuring knowledge on global warming (climate change) and environmental problems and attitudes. The contents of Parts 2 and 3 were different according to the objectives of each survey. The 2017 survey comprised items focused on support for measures against global warming, expectations for public administration, and domains affected by global warming (environment, health, and security). The 2020 survey comprised items related to the level of mitigating measures (up to now/future, local/worldwide).
The items used for the analysis were those in Part 1, which was common to both surveys. Specifically, those items asked about interest in global warming, risk recognition, (an) organization(s) that should deal with the issue, actual feelings about the impacts of global warming, thoughts about global warming, agreement among scientists, cause(s) of global warming, and the practice of environmentally friendly actions. Of these, the ones inquiring about thoughts on global warming and about environmentally friendly actions were the questions used when Americans were segmented in a previous study (Leiserowitz et al., 2015) with modifications in some wording and the addition of action details according to the Japanese context.
2.3 Ethical considerations
Because the university with which the person responsible for conducting this survey is affiliated has no ethics review committee, we ensured that the survey design and methodology complied with the university's ethical code. Additionally, the authors involved in the survey design completed the Ethics Education Course on Research Involving Human Subjects that is part of the Research Ethics Education Program offered by the Association for the Promotion of Research.
2.4 Analytical method for the segmentation
We employed cluster analysis to segment respondents by their attitudes toward climate change. This technique is used to group samples based on the commonality of characteristics when the sample size is large. To examine measures for providing information based on the characteristics of the respondents, the k-means method was employed, with the particular characteristics of the attitude of each segment being considered and the number of segments extracted in previous studies, the number of which can be adjusted by looking at the characteristics of the clusters. Table 1 shows the 13 items used in the analysis. The response format was a five-point scale, ranging from “not at all agree (=1)” to “strongly agree (=5).”
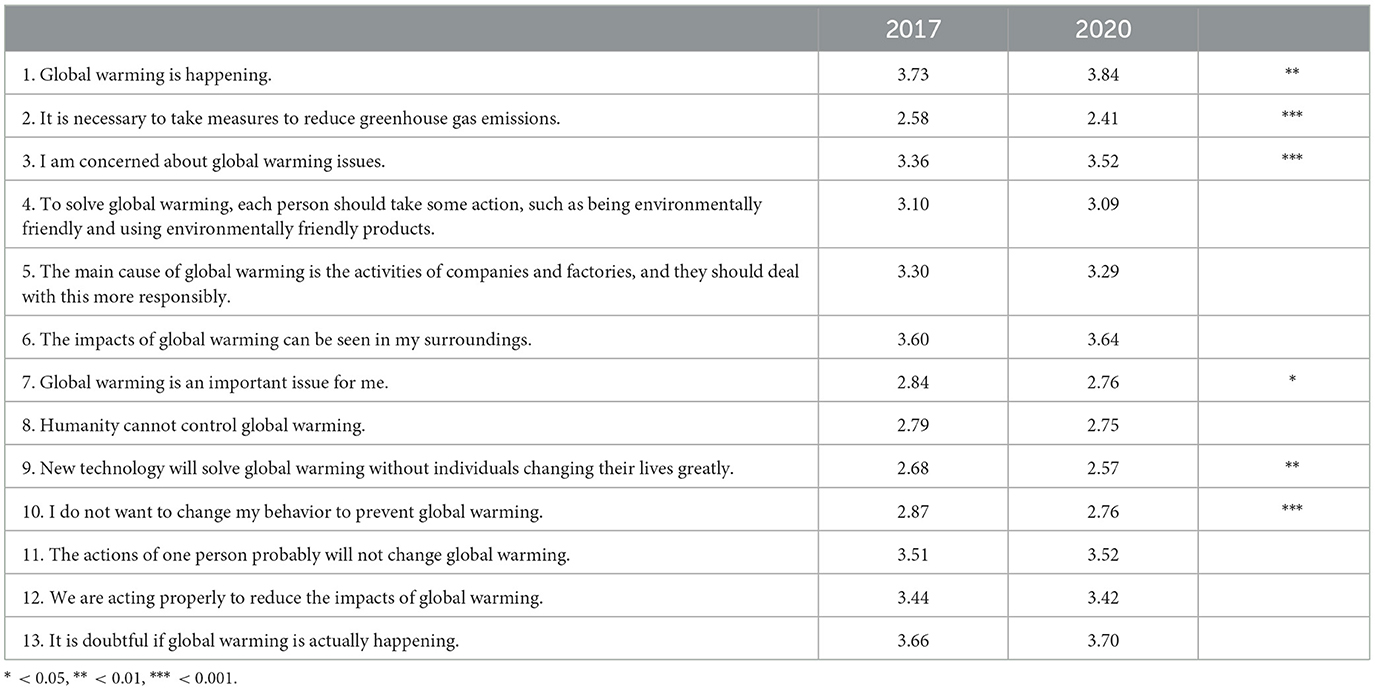
Table 1. Thirteen items used for segmentation.
3 Results
3.1 Respondent attributes
To analyze both surveys together, we include 2,997 respondents from the 2017 survey who are under 70 years of age and 1,100 respondents from the 2020 survey who are between 20 and 69 years of age (total number is 4,097).
The sex ratio of respondents in the 2017 survey was 50.0% male and 50.0% female for the 1,497 respondents, and in the 2020 survey, 50.1% male and 49.9% female for the 1,100 respondents. The mean age was 46.2 years in both surveys, and the percentages of all respondents aged 20–29 were 19.3% in the 2017 survey and 19.4% in the 2020 survey, those aged 30–39 were 23.0 and 23.1%; those aged 40–49 were 22.6 and 22.8%; those aged 50–59 were 19.5 and 19.4%; and those aged 60 and 69 were 15.5 and 15.4%, respectively. In addition to gender and age, there were no statistically significant differences in education, occupation, or residential status by survey year.
There are no statistically significant differences in the above attributes by survey year.
3.2 Five segments
Table 1 shows the 13 items of recognition of global warming used in the cluster analysis. The values in Table 1 are the average of the responses on a 5-point scale for the degree of agreement with the statements, with higher scores indicating greater agreement. Because there were items for which the response means differed depending on the year of the survey, t-tests were conducted according to the year of the survey. The respondents tended to agree with “Item 1: Global warming is happening” and “Item 3: I am concerned about global warming issues,” more than those in the 2017 survey did. Concerning other items, the tendency to agree with “Item 2: It is necessary to take measures to reduce greenhouse gas emissions,” “Item 7: Global warming is an important issue for me,” “Item 9: New technologies will solve global warming without individuals changing their lives greatly,” and “Item 10: I do not want to change my behavior to prevent global warming” was weaker than it was in the 2017 survey. However, this did not affect segmentation because we conducted cluster analysis for each survey year.
Cluster analysis was carried out using the 13 items described above, and five segments were extracted for both the 2017 and the 2020 survey (Figures 1, 2). Items 1–13 in the figure correspond to the question items used in the analysis shown in Table 1. As indicated in the figures, there are three types of segments: those with a response average of about three (Neither) for all 13 statements; those with a response average of about four (agree); and those with a response average of four or higher, up to item 7, and three or lower after item 8. The three types of segments were extracted in both the 2017 and the 2020 survey.
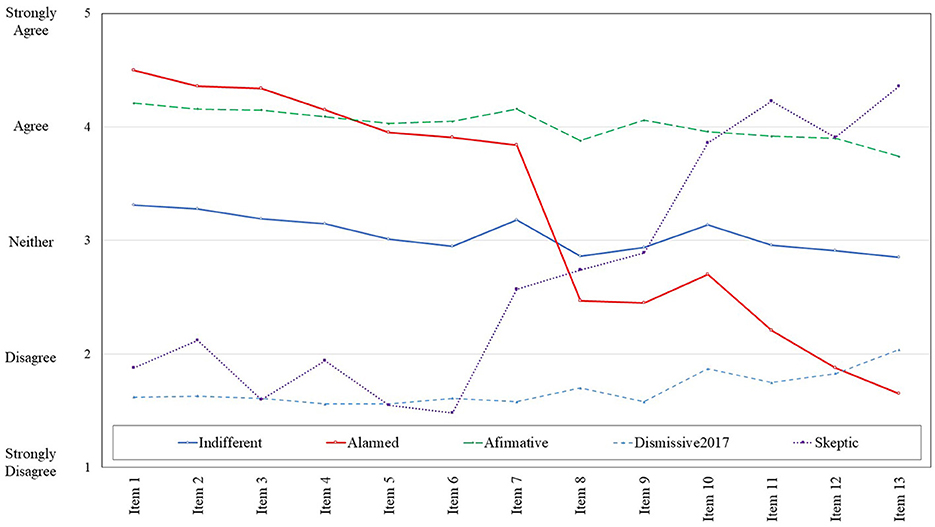
Figure 1. Characteristics of recognition of global warming by five clusters (2017).
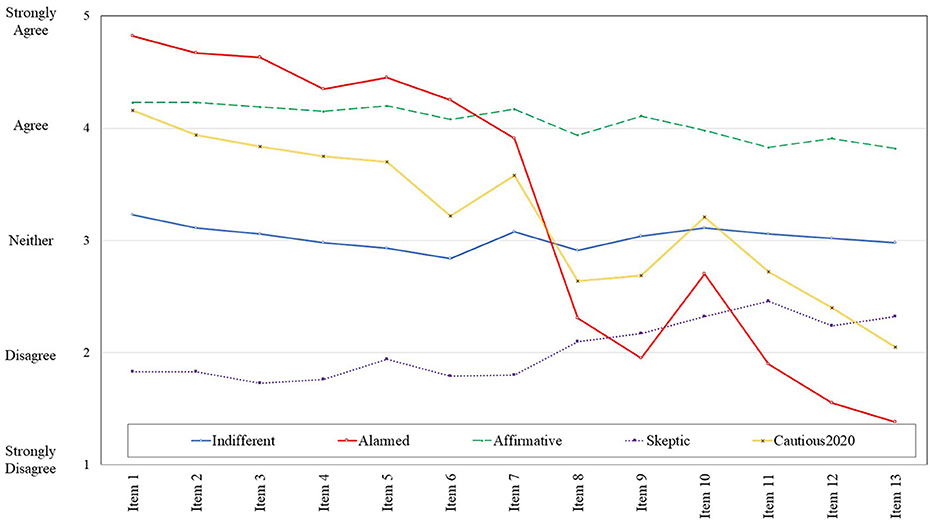
Figure 2. Characteristics of recognition of global warming by five clusters (2020).
The first segment is characterized as “indifferent,” meaning that the respondents do not have a clear opinion on all 13 statements regarding global warming, and they will be referred to as the “Indifferent” segment below.
The 13 items include irreconcilable contents such as “Item 1: Global warming is real” and “Item 13: It is doubtful whether global warming is happening”; and “Item 4: Individuals should take actions such as choosing environmentally friendly behavior and products to solve the global warming problem,” and “Item 11: Humans cannot curb global warming.” It is unlikely that respondents with clear attitudes and opinions would agree on both items in these pairs at the same time.
The second segment tends to agree with all items and is characterized by an affirmation of all statements rather than a clear attitude toward global warming. This segment is hereafter the “Affirmative (yes tendency)” group.
The third segment is characterized by a high tendency to agree with “Item 1: Global warming is real,” “Item 2: It is necessary to take measures to reduce greenhouse gas emissions,” and “Item 3: I am concerned about the problem of global warming,” indicating they recognize that global warming is a real problem that needs to be addressed. Simultaneously, they disagreed with items 13 and 11, which are contradictory to items 1 and 4, indicating a consistent response based on their perceptions. The segment with this characteristic is hereafter the “Alarmed” group.
Contrary to the “alarmed,” the segment that tends to doubt the global warming problem and the necessity of countermeasures, that is, the segment that tends to strongly disagree with items 1 and 3 and relatively agree with items 11 and 13, is called the “Skeptic.” This is the fourth segment.
The fifth segment has different characteristics depending on the year of the survey, with the 2017 survey extracting a segment that shows the opposite response pattern of the “Affirmative” and a segment with a response average of less than 2 for all items. This segment, extracted only in the 2017 survey, is referred to as “Dismissive2017.” In the 2020 survey, a segment was extracted that exhibits a response pattern which mitigates the strong pro- and anti-tendency of the “Alarmed” group and is considered to have an awareness of global warming and to show consistent responses in line with that awareness, although not as clearly as the “Alarmed” group. This segment is referred to as “Cautious 2020.”
3.2 Characteristics of each segment
For each survey year, age gender and risk perceptions are shown in Table 2, subjective knowledge of global warming in Figure 3, responses about the consensus of scientists in Figure 4, responses about causes in Figure 5, and responses about perceived impacts in Figures 6, 7, summarizing the salient characteristics of each segment.
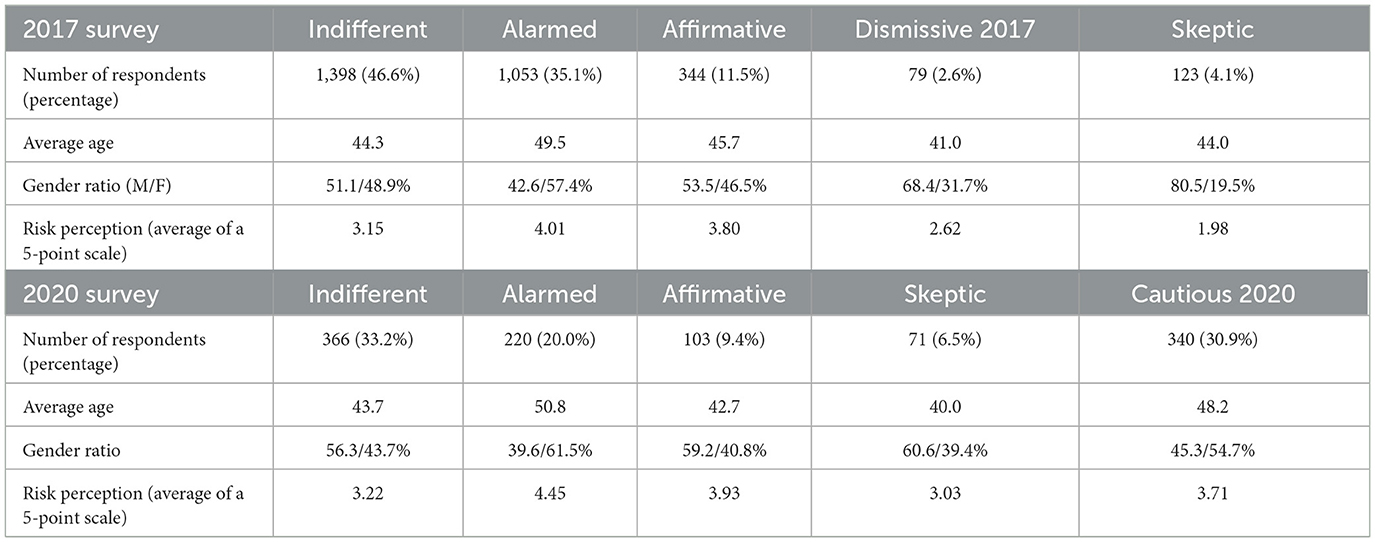
Table 2. Characteristics of five segments.
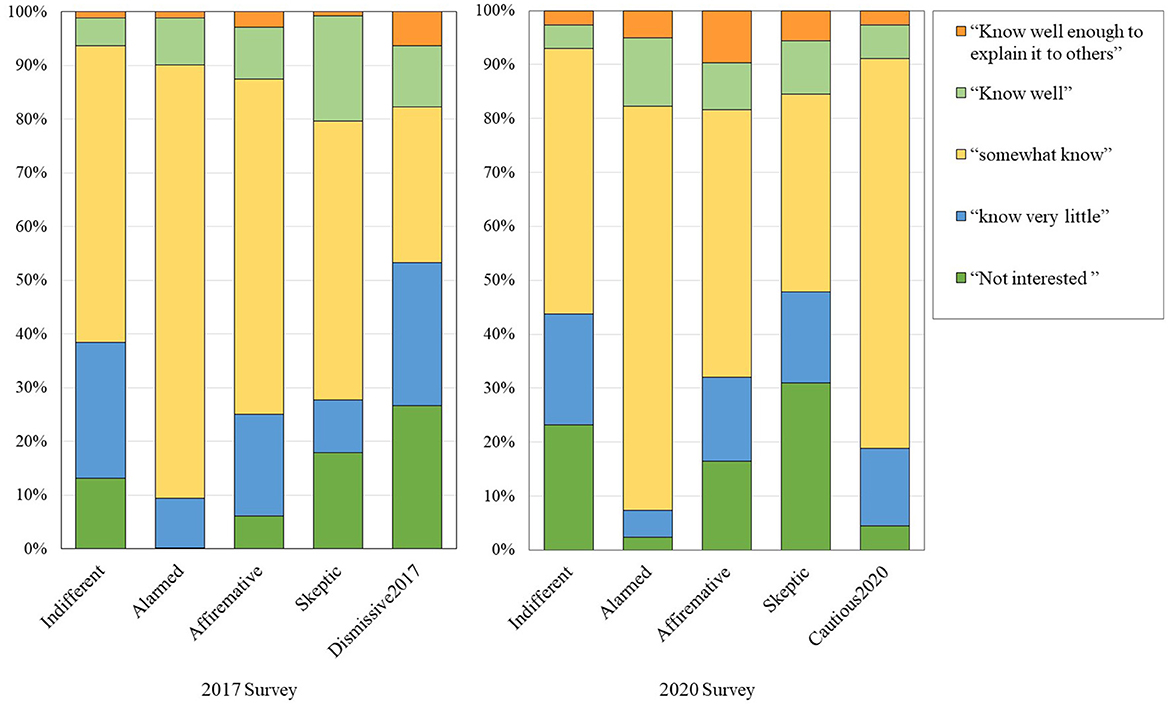
Figure 3. Subjective knowledge about global warming by five segments.
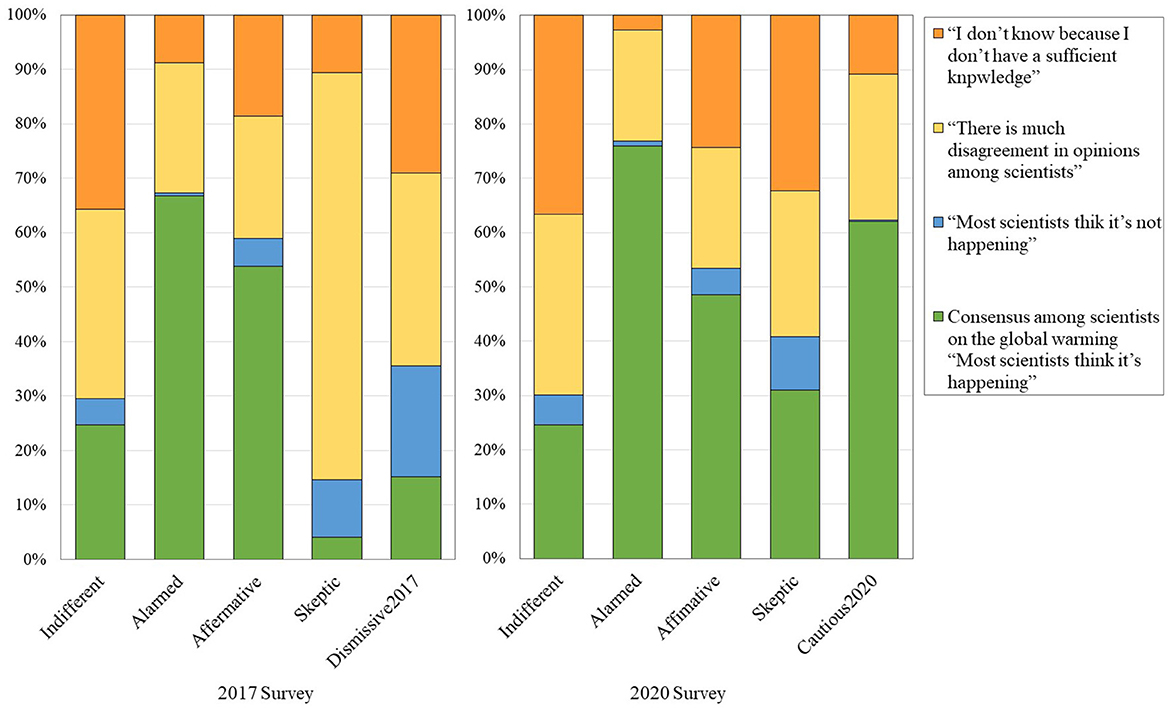
Figure 4. Consensus among scientist on global warming by five segments.
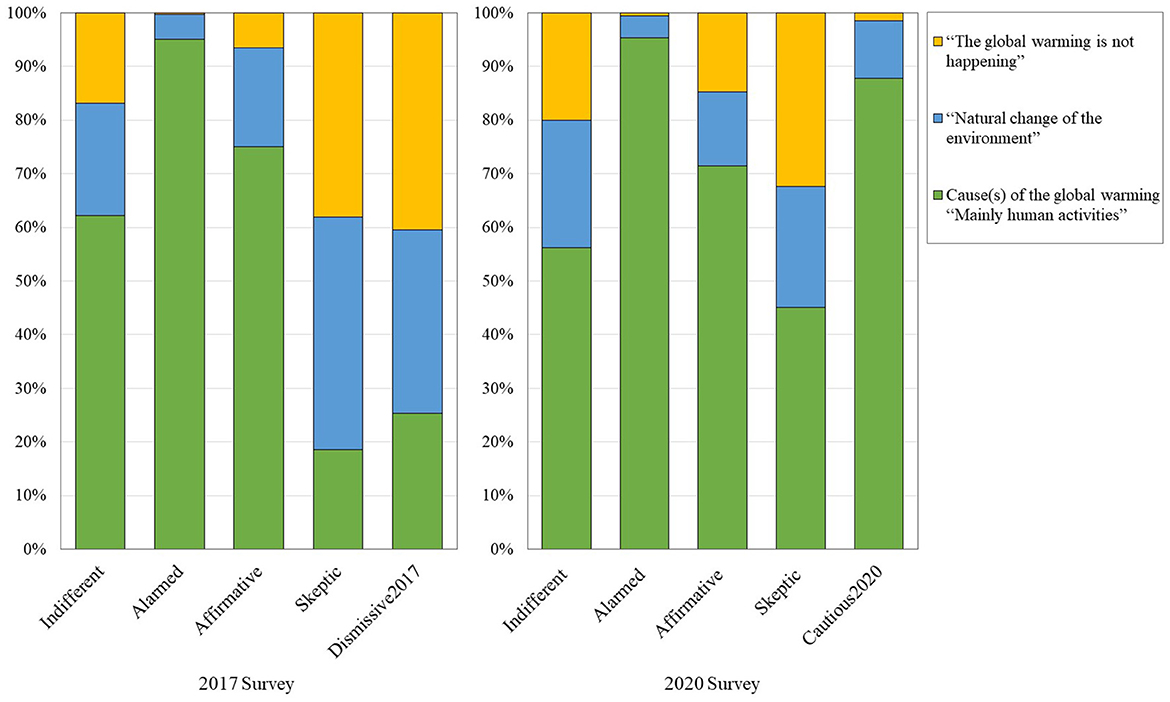
Figure 5. Cause of global warming by five segments.
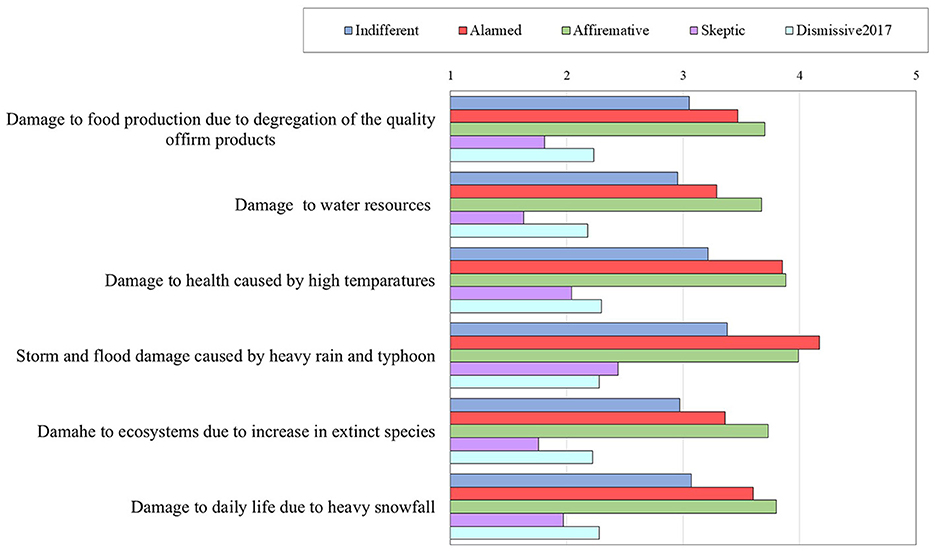
Figure 6. Cause of global warming by five segments in 2017 survey.
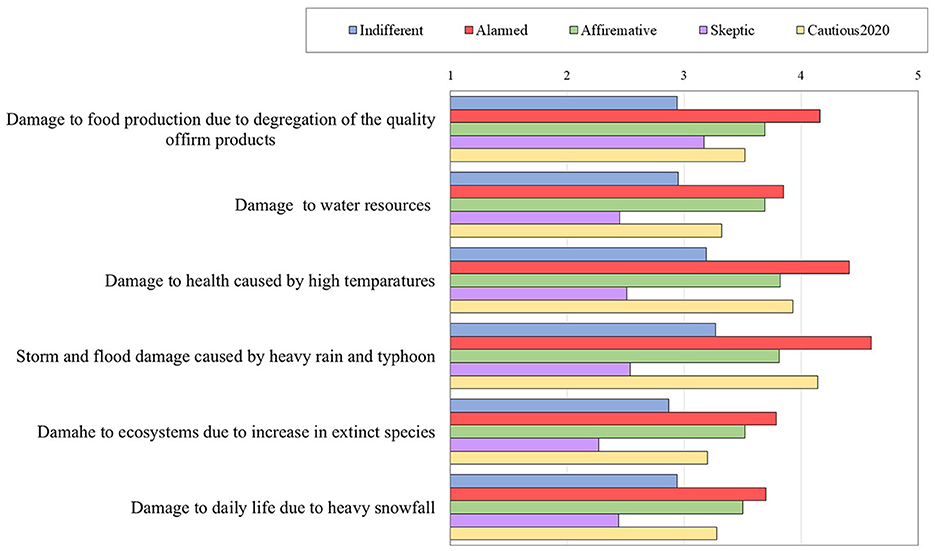
Figure 7. Cause of global warming by five segments in 2020 survey.
“Indifferent” is a large segment, accounting for 46.7% of the respondents in the 2017 survey and 33.3% in the 2020 survey. Demographic characteristics are close to sample averages, with average ages of 44.3 (2017) and 43.7 (2020) years, and male proportions of 51.1% (2017) and 56.3% (2020). The average risk perception was 3.15 (2017) and 3.22 (2020), which is close to 3, as were the responses to the perception item. The percentages of respondents who selected “I am not interested in or concerned” about global warming were 13.1% (2017) and 23.2% (2020); the percentages of respondents who selected “I don't know because I don't have enough knowledge regarding scientists' agreement on global warming” were 35.7% (2017) and 36.6% (2020); and the percentages of respondents who selected “There is a great deal of disagreement” had a higher selection rate than the other segments, at 34.8% (2017) and 33.3% (2020). The average response score for the impact of global warming was around 3 (=neither), but relatively more respondents chose “wind and flood damage caused by local heavy rains and typhoons” (3.38: 2017, 3.27: 2020) and “health problems such as heatstroke in summer and deterioration of physical condition” (3.21: 2017, 3.19: 2020).
For the “Alarmed”, the average age was higher than the sample average, at 49.5 years old (2017) and 50.8 years old (2020), and higher proportions of female respondents at 57.4% (2017) and 61.5% (2020). A high percentage of respondents “know some” about global warming, at 80.7% (2017) and 75.0% (2020), and only a small percentage are “uninterested or unconcerned,” at 0.2% (2017) and 2.3% (2020). Risk perception was highest among the five segments (4.0: 2017, 4.45: 2020). Compared to the other segments, more respondents believed that global warming is caused “primarily by human activity,” at 94.1% (2017) and 95.0% (2020), and recognized there is consensus among most scientists that global warming is occurring, at 66.8% (2017) and 75.9 % (2020). The overall sense of the effects of global warming is also strong, with particularly high averages for “wind and flood damage caused by localized heavy rains and typhoons” (4.17: 2017, 4.60: 2020) and “health problems such as summer heatstroke and worsening physical condition” (3.85: 2017, 4.41: 2020).
“Affirmative” was 11.5% in the 2017 survey and 9.4% in the 2020 survey, with an average age of 45.7 (2017) and 42.7 (2020) years, and a higher proportion of males at 53.5% (2017) and 59.2% (2020). The mean risk perception was 3.80 (2017) and 3.93 (2020), which is close to four, as were the responses to the perception item. The percentage of those who believe that global warming has been caused mainly by “human activity” is high for the “alarmed” group, at 74.4% (2017) and 70.9% (2020), and the percentage is high of those who recognize there is consensus among most scientists that global warming is occurring, at 53% (2017) and 53% (2020). A high percentage of respondents acknowledge that consensus exists among most scientists that global warming is occurring, at 53.8% (2017) and 48.5% (2020). As with the responses to the attitude items, the average response mean for the impact of global warming was close to four (=feel some extent), and relatively high percentages of respondents realized that “wind and flood damage due to localized heavy rain and typhoons” (3.99: 2017, 4.14: 2020) and “health problems such as heatstroke in summer and deterioration of physical condition” (3.88: 2017, 3.93: 2020) are connected to global warming.
“Skeptics” were smaller than the three segments above, accounting for 4.1% of respondents in 2017 and 6.5% in the 2020 survey. The average age of the respondents was 44 (2017) and 41 (2020), with a higher percentage of males than females (80.5% of males in 2017 and 68.4% in 2020). A higher percentage of respondents chose “not interested” in global warming (17.9% in 2017 and 31.0% in 2020), indicating that global warming is either “not happening (35.0% in 2017 and 32.4% in 2020)” or “caused by natural changes in the environment (39.8% in 2017 and 34.2% in 2020). Differences in the agreement of scientists on global warming were observed among the survey years, with the highest percentage of respondents selecting “there is a lot of disagreement among scientists (74.8%)” in 2017, while in the 2020 survey the percentage of respondents selecting “many scientists agree” and “I don't know because I have no knowledge” was almost the same. The “Skeptics” in the 2017 survey were highly skeptical of global warming, believing that the current phenomenon is within the range of some natural change and that there is much disagreement in the scientific community. However, while the “skeptics” sampled in the 2020 survey doubted global warming and thought it was caused by natural variability, they were also less interested in global warming and more unsure of the consensus among scientists, indicating a relatively unclear perception of global warming.
“Dismissive 2017” was the smallest segment with 2.6% of respondents, woth more males than females (68.4% of males) with an average age of 41 years. The percentage of respondents selecting “I am not interested or concerned” about global warming is highest among the five segments (26.6%). However, 11.4% (2017) and 9.9% (2020) of respondents were “well informed” about global warming, which is the second highest among the “Alarmed”. Regarding the causes of global warming, the highest selection rate was for “global warming is not occurring (40.5%),” indicating that the realization of global warming effects was generally low.
“Cautious 2020” is a large segment, accounting for 30.9% of respondents, with an average age of 48.2 years and a slightly higher percentage of women (54.7%). The proportion of respondents who were “uninterested” in global warming was low (4.4%), and they recognized that it was caused mainly by “human activity” (86.8%). Concerning the effects of global warming, the respondents felt that to some extent, “wind and flood damage caused by localized heavy rains and typhoons (4.14%)” and “health problems such as heatstroke in summer and deterioration of body length (3.93%)” were the most common results.
3.3 Segments and countermeasure implementations
Table 3 shows the results of the implementation rate for global warming countermeasures (the selection rate of “always” and “often”) for each segment.
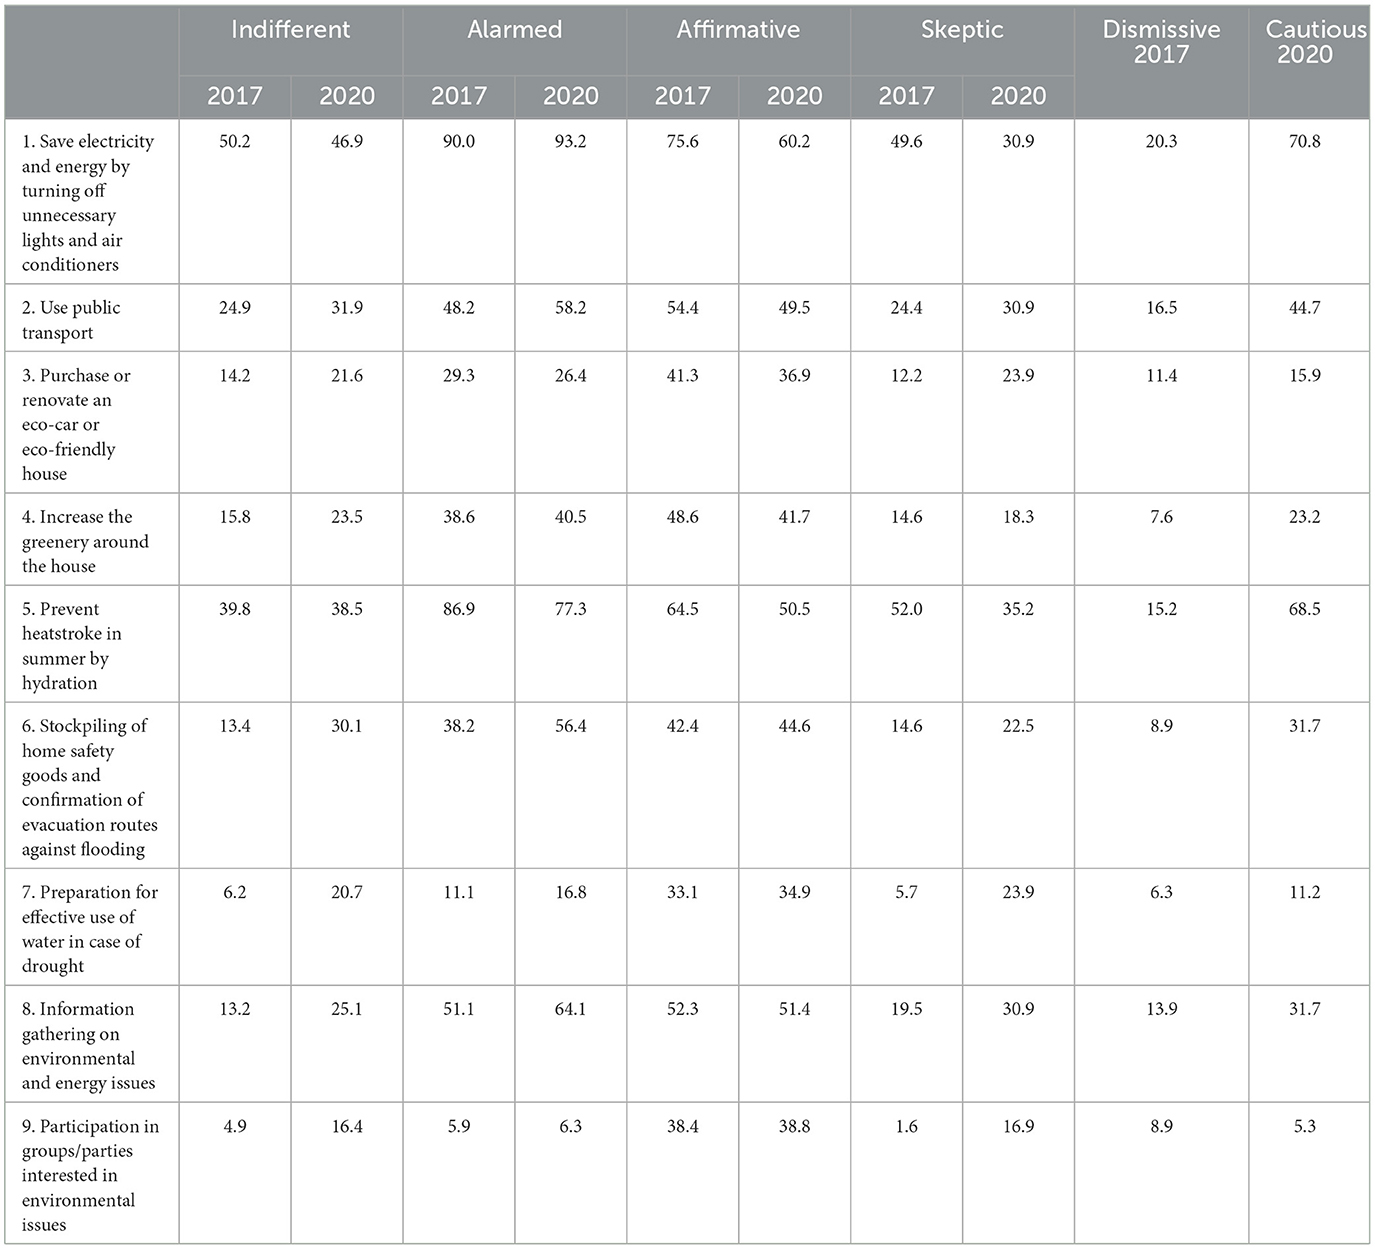
Table 3. Percentage of implementation of countermeasures by segments.
The countermeasure actions can be categorized as follows: the top four items in the table are mitigation measures, the next three items are adaptation measures, and the remaining two items are information gathering.
Although the implementation rates varied depending on the year of the survey, but the “Alarmed” had the highest rate of implementation of multiple countermeasure actions, while the “Indifferent” and “Skeptic” groups had relatively low rates of implementation.
The “Alarmed” group has a high implementation rate of “1. saving electricity and energy” (90.0%: 2017, 93.2%: 2020), “5. prevention of heat stroke (86.9%: 2017, 77.3%: 2020),” “8. gathering information on environmental and energy issues (51.1%: 2017, 64.1%: 2020)” and “2. using public transportation (48.2%: 2017, 58.2%: 2020)” were high. In addition, the implementation rates for all measures except for item 3 were higher in the 2020 survey than in the 2017 survey. The “Indifferent” and “Skeptic,” as well as the “Alarmed”, have relatively high implementation rates for items 1, 2, 5, and 8, while the implementation rates for measures other than items 1 and 5 was higher in the 2020 survey. The “Affirmative” had the second highest implementation rate for each measure after the “Alarmed”, with a higher implementation rate in the 2017 survey, mainly in mitigation measures, and no differences in adaptation measures or information gathering between the survey years. “Dismissive 2017” has the lowest implementation rate of countermeasure actions in the 2017 survey, with 20.3% even for item 1, which has the highest implementation rate, and about half of the countermeasures have an implementation rate of less than 10%. In the 2020 survey, “Cautious 2020” showed the second highest implementation rate after the “Alarmed” group.
In summary, All segments showed high rates of implementation of energy electricity and energy (item 1), use of public transportation (item 2), and prevention heat stroke (item 5), but low rates of participation in groups/parties on environmental issues (item 9) and drought countermeasures (item 7). In other words, the implementation rate of mitigation measures tends to be higher than that of information gathering and adaptation measures, a trend common to both surveys.
Table 4 shows the results of multiple regression analysis for each segment, with the number of implementation of the above nine measures as the dependent variable. The independent variables were risk perception, perceived impact (mean of 7 items), subjective knowledge, causes of global warming, consensus of scientists, and age and gender were put into the model as control variables. Only the goodness of fit of the model and the test results of the effects of the independent variables (F-values) are reported here.
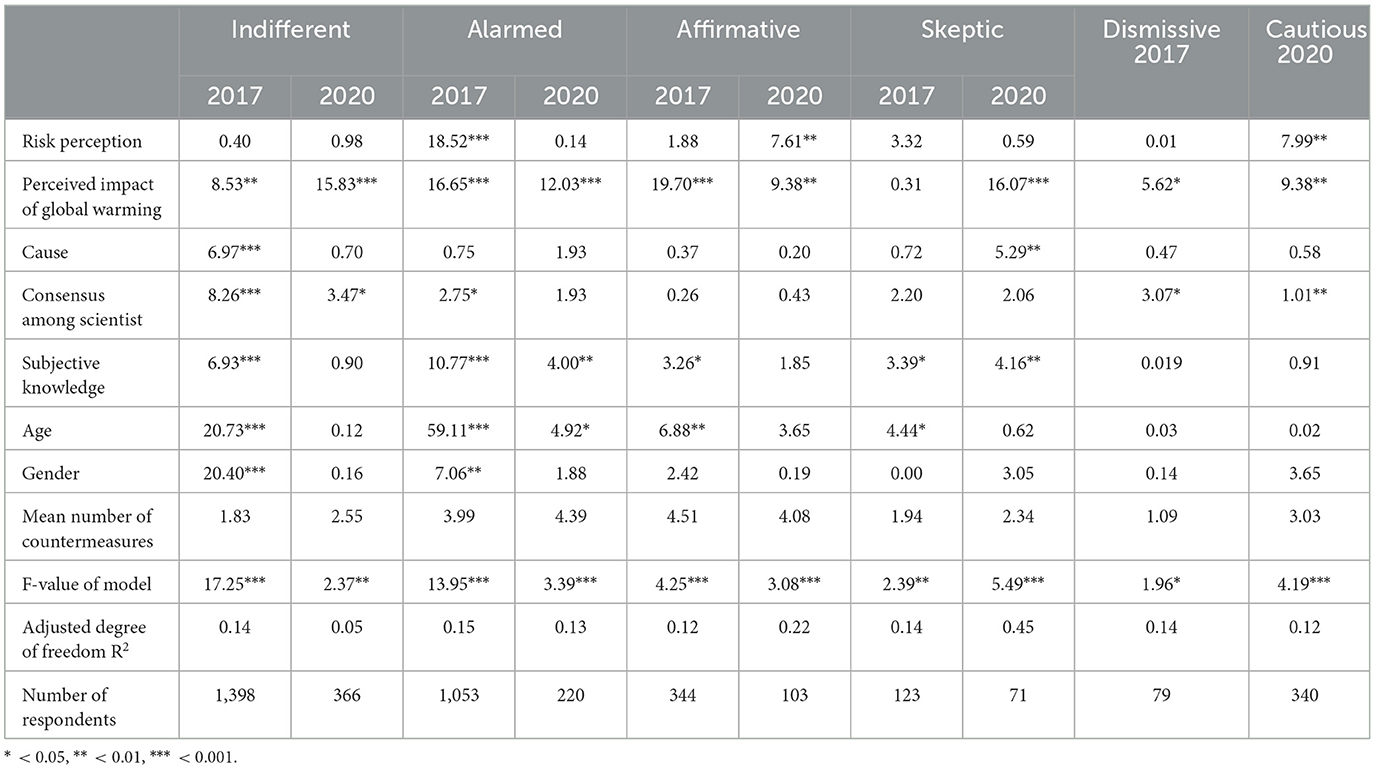
Table 4. Multiple regression model explaining the number of measures implemented by segments.
The regression model explaining the number of measures implemented by the “Alarmed” was significant, although not highly explanatory, at 0.15 and 0.13 for both 2017 and 2020. While the effects of perceived impact and subjective knowledge are significant in both surveys, risk perception and scientist consensus are significant only in the model of the 2017 survey. The model for the “Indifferent” cannot explain the implementation measures with the independent variables entered, since the model for the 2017 survey has a significant poor fit and the model for the 2020 survey has very low explanatory power. The “Affirmative” has more explanatory power in the 2020 model, and the impact realization and risk perception contribute to the number of measures implemented. The “Skeptic” model has more explanatory power in 2020 than in 2017, indicating that impact realization, causes of global warming, and subjective knowledge have significant effects. The model of “Dismissive 2017” shows that the perceived impact and the agreement of scientists have a significant effect on the number of measures implemented, while the model of “Cautious 2020” shows that risk perception, perceived impact, and the agreement of scientists have an effect on the number of measures implemented.
In most of the models, the perceived impact has a significant effect on the number of measures implemented, while risk perception has no effect, suggesting that while the perceived impact of crops and natural disasters contributes to the implementation of measures (especially adaptation measures), the perceived risk of global warming may not necessarily be associated with measures (mainly mitigation measures such as energy-saving behavior and use of public transportation).
3.4 Summary
Segmentation by perception of global warming yielded five segments for both the 2017 and 2020 surveys. Four segments, “Alarmed,” “Indifferentists,” “Affirmative,” and “skeptics,” were commonly extracted in the two surveys. The remaining one segment is “Disumissive2017,” which does not have a clear attitude toward global warming and consistently answers negatively in the 2017 survey. In the 2020 survey, the “Cautious 2020” was selected, who recognize global warming as a problem and believe that some countermeasures should be taken, but to a milder extent than the “Alarmed” group.
The “Skeptic” in the 2017 survey showed a pattern of disagreement with items 1–7, including “Global warming is real,” and agreement with items 8–13, including “I doubt whether global warming is occurring.” However, in the 2020 survey, the trend of agreement with the latter half of the items was weaker than in the 2017 survey, compared to the clear disagreement with the first half of the items. Reasons for the “Skeptics” in the 2020 survey showing these attitudinal characteristics could be that people's skeptical perception of global warming has moderated, or that the “Dismissive 2017,” which was the smallest segment in the 2017 survey, was not extracted as a segment in the 2020 survey and included in this segment.
The “Indifferent” and “Alarmed” groups each showed similar risk perceptions and impact realizations in both surveys, but the incidence of both groups decreased by about 10–15% in the 2020 survey from the 2017 survey. These decreases may be explained by a 30% increase in the number of new occurrences, or “Cautions 2020.” Those who have a strong sense of urgency and believe that countermeasures are necessary, were extracted as “Alarmed” in both 2017 and 2020, but in 2020, those who were both strongly in in favor of and against global warming and had more measures implemented were extracted as “Alarmed.” It is also possible that those with clear global warming awareness were selected as the “Alarmed” group, and those not included there and those with a moderate sense of urgency who were included in the “Indifferent” or unclear awareness segment in 2017, were extracted as one group.
The “Affirmative” group, which tends to agree with all items and accounts for about 10% of respondents, can be regarded as a group that is not concerned about global warming because they do not have consistent answers in their perception of global warming. Similarly, the “Dismissive 2017” group can be regarded as a group that is not interested in global warming. In this way, the “Indifferent”, “Affirmative” and “Dismissive 2017” are extracted as different segments, but they are people who have little interest in global warming and no clear perception or attitude toward it.
Comparing the impact of global warming in 2017 and 2020 in the four common segments, the “Alarmed” group significantly felt higher in “(1) damage to food production,” “(2) damage to water resources,” “(3) damage to health such as heat stroke,” “(4) wind and flood damage,” “(5) damage to ecosystems,” and “(6) damage from heavy snowfall” in the 2020 survey. The “Skeptic” also had a significantly higher realization of items 1, 2, 5, and 6. On the other hand, the “Indifferent” had significantly lower perceptions of items 1, 4, 5, and 6, and the “Affirmative” had significantly lower perceptions of items 4, 5, and 6 in the 2020 survey. It is possible that the respondents experienced the same meteorological phenomena and associated damage to their daily lives, but perceived them differently and interpreted them differently in relation to global warming.
In terms of countermeasure actions, all segments showed relatively high rates of implementation of energy saving and public transportation as mitigation measures, and high rates of implementation of heat prevention as adaptation measures. The number of measures implemented tended to be higher among the “Alarmed” and “Affirmative” and lower among the “Skeptical” group, and was higher in the 2020 survey than in the 2017 survey. The fact that the implementation rate of “Indifferent” and “Skeptic” groups also exceeded 2, and that the number of “Dismissive 2017” was the smallest, suggests that mitigation and adaptation measures are not always implemented as measures against global warming. For example, mitigation measures may be implemented to save electricity and fuel costs, and adaptation measures may be implemented to cope with individual disasters such as heavy rains and heat wave.
4 Conclusion
This study used data from questionnaires administered in 2017 and 2020 to identify five segments based on characteristics of Japanese people's understanding about global warming, the degree to which they recognize and carry out countermeasure actions, and their attitudes, and analyzed the characteristics and changes in the segment composition. Therefore, the “Alarmed,” “Indifferent,” “Affirmative,” and “Skeptic” segments were commonly extracted. As a segment unique to the 2017 survey, “Dismissive 2017,” with a doubtful view of global warming, was extracted, and in the 2020 survey, a segment called “Cautious 2020,” which has a lower degree of awareness and perception of the effects of global warming than the “Alarmed,” was extracted.
The YPCCC's Six Americas report shows that the “alarmed” segment, which is the segment most concerned about global warming and most involved in taking action and supporting policies, increased 21% from 5 years ago, which is the largest increase in volume. The “concerned” and “cautious” segments, who are less active in their support of actions and policies, have decreased, suggesting that these two segments have changed their attitudes toward actions and policies in some way, leading them to be termed “alarmed.”
If that is the case, “Cautious 2020,” which was newly extracted in the 2020 survey, may be those who fall into the “indifferent” and “alarmed” segments, which have declined since 2017. It is possible that their understanding changed as the result of some experience or event and was extracted as one segment. However, the presence or triggering experience and its content is not clear because the perception of impact of global warming is lower in 2020 than in 2017 for all segments except the “Alarmed” and “Skeptic,” and the “Cautious 2020” has no segment in th e 2017 survey to compare.
4.1 Implication for information provision
In considering how to engage in communication to encourage people to carry out climate change countermeasures, we consider what should be kept in mind with regard to differences in awareness, knowledge, and perception of the effects of global warming among various segments of the population.
As mentioned in the previous section, agricultural damage caused by natural disasters and extreme weather events such as typhoons and torrential rains has increased recently. Not only the “Alarmed” group but also the “Indifferent,” “Affirmative,” “Skeptical,” and “Cautious 2020” groups have relatively high implementation rates in terms of heatstroke and flood preparedness. However, it is unclear to what extent the linkage between adaptation actions and global warming will be accepted by segments of the population that are less concerned about global warming. Human information processing is designed to selectively take in information that is unconsciously important (highly relevant) to a person, and no matter how much knowledge is provided in relation to global warming, it is likely not to reach those who are indifferent. Information that encourages adaptive behavior from the perspective of protecting life and property from risks such as storms, floods, and heatstroke might be more effective than information that helps people comprehend global warming and mitigation measures.
With regard to mitigation measures, the “Alarmed” group's recognition of global warming and realization of its impacts, as well as the rate of putting countermeasures into practice, suggest that providing information on the mechanism of global warming and greenhouse gas emission reductions based on future projections, which has been done in the past, would be effective.
However, the “Indifferent,” “Affirmative” are considered to be people who do not have a clear understanding of global warming and are not interested in global warming, and therefore live their lives without contact with information. Therefore, information provided in the frame of global warming countermeasures is considered to be weak in appealing to them. Therefore, as one of the future information provision strategies, the “Indifferent” and “Affirmative” should be further subdivided by their attributes and lifestyles, and the adaptation and mitigation measures should be reorganized from the viewpoint of issues in which the target population is highly involved. As mentioned in 3.4, more than two out of nine options for global warming countermeasures are practiced in all segments in the 2020 Survey, and many people take energy-saving actions and measures against heat stroke even if they are not concerned about global warming or are skeptical about it. Therefore, it is thought that measures that reframe measures as actions for economic savings, health maintenance, and disaster prevention, and that deliver information to those who are highly involved, will have a certain effect in promoting the implementation of measures. Another approach is to encourage people to engage in action through nudges and by changing defaults for decision-making rather than by carrying out measures through normative decision-making by processing the information that is provided. In the field of disaster preparedness and risk management, there are many previous studies on factors that influence countermeasure behavior, along with studies on the implementation of policies that employ nudges, we would like to consider using these findings as support for the characteristics of the segment.
In addition, there was variation among segments in gender, age, and type of residence. Thus, preferences for information media and measures may also differ by segment. Therefore, not only the information content but also the selection of more suitable media for each segment should be considered.
4.2 Limitation of this study
Finally, we discuss the limitations and challenges of this study. The purpose of this questionnaire survey was to determine the characteristics of interest in and attitudes toward global warming among Japanese adults, as well as the proportion of such interest and attitudes within this population. Therefore, most respondents were from urban areas and few were from rural areas. Two types of measures were employed: those that are uniform across the country and easy to take action on (mainly greenhouse gas emission control and environmental taxes), and those that vary in importance depending on regional characteristics and occupation (e.g., flood control and food damage control). In considering how to provide effective activities for disseminating information regarding those measures that vary in importance, it is necessary to conduct a more detailed survey that connects regional characteristics, occupation, life stage, and other factors with respondents' attitudes toward global warming.
There are limitations to the examination of changes in segment composition in this survey. Because the survey data used in the analysis were obtained from different respondents in 2017 and 2020, it is impossible to analyze how and why individuals who were in one segment in 2017 moved to another segment. What this survey data can tell us is what percentage of people have what perceptions and attitudes, and whether those perceptions and attitudes differed between 2017 and 2020. To determine how people's perceptions and behaviors might change—for example, whether people who are segmented as “alarmed” will go through a phase in which they are segmented as “cautious” prior to that, or whether these people will remain in the same segment with little or no change in their attitudes—it is necessary to conduct a panel survey in which the same respondents are asked the same question multiple times.
Furthermore, since this study uses data from online questionnaire surveys and using Likert scale, the influence of the respondent's response set and minimization of the respondent's effort (satisficing) cannot be excluded. The responses of “Alarmed,” “Skeptic,” and “Cautious 2020” can be considered somewhat reliable because the response patterns can be seen as reflecting their consistent perceptions and attitudes toward global warming. However, the “Indifferent” and “Affirmative” responses are considered to be a mixture of those who are truly indifferent and those who do not have a clear attitude toward global warming, which is a pretense due to their response tendencies and corner cutting, but it is difficult to distinguish these responses. Compared to the responses of perception and attitude, those of experience and attributes of the respondents, such as implementation of countermeasures, are considered to be relatively reliable. The number of implementation of countermeasures was high for the “Alarmed” and “Cautious 2020” and low for the “Indifferent” and “Skeptical, suggesting a certain validity in the extracted segments. However, since it cannot determine the extent to which the respondents' attitudes are affected by the minimization of effort and the tendency to respond, it is difficult to confirm the reflection of the respondents' attitudes in the “Affirmative,” “Dismissive 2017,” and “Indifference. For these segments, the findings of this study may not be sufficient as a basis for considering information provision strategies. In next study, it will be necessary to devise ways to eliminate influences that may interfere with the measurement of respondents' true perceptions and attitudes at the stage of questionnaire design.
Data availability statement
The raw data supporting the conclusions of this article will be made available by the authors, without undue reservation.
Ethics statement
The studies involving humans were approved by Shizuoka University Ethics Committee/Shizuoka University. The studies were conducted in accordance with the local legislation and institutional requirements. The participants provided their written informed consent to participate in this study.
Author contributions
MK and KB contributed to the conception and design of the study. MK wrote the statistical analysis and the first draft of the manuscript. KB wrote the introduction and discussion of the manuscript. All authors contributed to revisions of the manuscript, read, and approved the submitted manuscript.
Funding
This study was supported by the Social Implementation Program on Climate Change Adaptation Technology (SI-CAT) of the Ministry of Education, Culture, Sports, Science and Technology (MEXT), Japan, Grant No. JPMXD0715667201 and also supported by the Japan Science and Technology Agency (JST), the Research Institute of Science and Technology for Society (RISTEX), Japan, Grant No. JPMJRX20B5, and JSPS KAKENHI Grant No. 21H03675.
Conflict of interest
The authors declare that the research was conducted in the absence of any commercial or financial relationships that could be construed as a potential conflict of interest.
Publisher's note
All claims expressed in this article are solely those of the authors and do not necessarily represent those of their affiliated organizations, or those of the publisher, the editors and the reviewers. Any product that may be evaluated in this article, or claim that may be made by its manufacturer, is not guaranteed or endorsed by the publisher.
References
Cabinet Office (2007). Public Opinion Survey About the Global Warming Measure (in Japanese). Available online at: http://survey.gov-online.go.jp/h28/h28-ondanka/index.html (accessed September 9, 2022).
Cabinet Office (2016). Public Opinion Survey About the Global Warming Measure (in Japanese). Available online at: http://survey.gov-online.go.jp/h19/h19-globalwarming/index.html (accessed September 9, 2022).
Climate Change Adaptation Information Platform (2016). Approach of the Government (in Japanese). Available online at: https://adaptation-platform.nies.go.jp/plan/government/index.html (accessed September 9, 2022).
Cramer, W., Guiot, J., Fader, M., Garrabou, J., Gattuso, J., Iglesias, A., et al. (2018). Climate change and interconnected risks to sustainable development in the mediterranean. Nat. Clim. Chan. 8, 972–980. doi: 10.1038/s41558-018-0299-2
Goldberg, M., Gustafon, A., Rosenthal, S., Kotcher, J., Maibach, E., and Leiserowitz, A. (2020). For the First Time, the Alarmed are Now the Largest of Global Warming's Six Americas. Yale Program on Climate Change Communication, Yale University and George Mason University, New Haven. Available online at: https://climatecommunication.yale.edu/publications/for-the-first-time-the-alarmed-are-now-the-largest-of-global-warmings-six-americas/ (accessed May 24, 2023).
IPCC The Sixth Assessment Report (2021). Climate Change 2021: The Physical Science Basis. Available online at: https://www.ipcc.ch/report/sixth-assessment-report-working-group-i/ (accessed September 16, 2022).
Japan Meteorological Agency (2022a). Secular Change in Annual Mean Temperature Anomaly in Japan. Available online at: https://www.data.jma.go.jp/cpdinfo/temp/an_jpn.html (accessed September 9, 2022).
Japan Meteorological Agency (2022b). Changes in Heavy Rainfall and Extremely Hot Days (Extreme Events) to Date. Available online at: https://www.data.jma.go.jp/cpdinfo/extreme/extreme_p.html (accessed September 9, 2022).
Kabir, M. I., Rahman, M. B., Smith, W., Lusha, M. A. F., Azim, S., and Milton, A. H. (2016). Knowledge and perception about climate change and human health: findings from a baseline survey among vulnerable communities in Bangladesh. BMC Public Health 16, 1–10. doi: 10.1186/s12889-016-2930-3
Kim, G., Cha, D., Park, C., Lee, G., Jin, C., Lee, D., et al. (2018). Future changes in extreme precipitation indices over korea. Int. J. Climatol. 38, e862–e874. doi: 10.1002/joc.5414
Kosugi, M., Baba, K., and Tanaka, M. (2018). Problem of clarification and the provision of information of the target person (in Japanese). Jap. Soc. Civil Eng. Coll. Papers G. 74, I_41–I_51. doi: 10.2208/jscejer.74.I_41
Kosugi, M., Baba, K., and Tanaka, M. (2020). Japanese's attitude change toward global warming (in Japanese). Jap. Soc. Civil Eng. Coll. Papers G. 76, I_167–I_176. doi: 10.2208/jscejer.76.5_I_167
Lamper, A., McMillion, C. W., and Harwell, L. C. (2022). Observed changes in the frequency, intensity, and spatial patterns of nine natural hazards in the united states from 2000 to 2019. Sustainability. 14, 4158. doi: 10.3390/su14074158
Leiserowitz, A., Maibach, E., Roser-Renouf, C., Feinberg, G., and Howe, P. (2012). Global Warming's Six Americas: September 2012. Available online at: http://environment.yale.edu/climate/publications/Six-Americas-September-2012 (accessed September 9, 2022).
Leiserowitz, A., Maibach, E., Roser-Renouf, C., Feinberg, G., and Rosenthal, S. (2015). Climate Change in the American Mind: March 2015. Yale Project on Climate Change Communication, Yale University, Fairfax, George Mason University and New Haven. Available online at: https://climatecommunication.yale.edu/wp-content/uploads/2015/04/Global-Warming-CCAM-March-2015.pdf (accessed 23 May 2023).
Leiserowitz, A., Maibach, E., Roser-Renouf, C., and Smith, N. (2009). Global Warming Six Americas 2009. Available online at: http://environment.yale.edu/climat-ecommunication/files/climatechange-6americas.pdf (accessed September 9, 2022).
Leiserowitz, A., Thaker, J., Feinberg, G., and Cooper, D. (2013). Global Warming's Six Indias: An Audience Segmentation Analysis. Available online at: https://climatecommunication.yale.edu/wp-content/uploads/2016/02/2013_05_Global-Warming%E2%80%99s-Six-Indias.pdf (accessed 16 September 2022).
Metag, J., Fuchslin, T., and Schafer, S. M. (2017). Global warming's five Germanys: a typology of Germans' views on climate change and patterns of media use and information. Public Understand. Sci. 26, 434–451. doi: 10.1177/0963662515592558
Ministry of the Environment (2016). Adaptation to the Climate Change (in Japanese). Available online at: http://www.env.go.jp/earth/tekiou.html (accessed September 9, 2022).
Morrison, M., Duncan, R., Sherley, C., and Parton, K. (2013). A comparison between attitudes to climate change in Australia and the United States. Aust. J. Environ. Manag. 20, 87–100. doi: 10.1080/14486563.2012.762946
Nakayama, K. (2009). Way of thinking called the unification type marketing communication (IMC) - Mainly on specific case of the IMC development - (in Japanese). Matsuyama Univ. Essays. 20, 268–302.
Nam, W., Hayes, M., Svoboda, M., Tadesse, T., and Wilhite, D. (2015). Drought hazard assessment in the context of climate change for south korea. Agricult. Water Manag. 160, 106–117. doi: 10.1016/j.agwat.2015.06.029
Ning, G., Luo, M., Zhang, W., Liu, Z., Wang, S., and Gao, T. (2022). Rising risks of compound extreme heat-precipitation events in china. Int. J. Climatol. 42, 5785–5795. doi: 10.1002/joc.7561
Rhaman, M., Tahjib-Ul-Arif, N., Kibria, M., and Hoque, A. (2022). Climate change and its adverse impacts on plant growth in south asia: current status and upcoming challenges. Phyton 91, 695–711. doi: 10.32604/phyton.2022.018898
Sansom, G., Thompson, C. M., Sansom, L., Fawkes, L., and Boerlin, E. (2022). Compounding impacts of hazard exposures on mental health in houston, tx. Nat. Hazards 111, 2809–2818. doi: 10.1007/s11069-021-05158-x
Schultz, E. D. (1993). Integrated marketing communication: maybe definition is in the point of view. Market. News 27, 17.
Keywords: climate change, global warming, questionnaire survey, attitude, countermeasure, mitigation, adaptation
Citation: Kosugi M and Baba K (2023) Five types on perception of global warming in Japanese. Front. Clim. 5:1227585. doi: 10.3389/fclim.2023.1227585
Received: 23 May 2023; Accepted: 06 November 2023;
Published: 24 November 2023.
Edited by:
Khandaker Jafor Ahmed, Georgetown University, United StatesReviewed by:
Charles Galdies, Institute of Earth Systems, University of Malta, MaltaShah Md Atiqul Haq, Shahjalal University of Science and Technology, Bangladesh
Copyright © 2023 Kosugi and Baba. This is an open-access article distributed under the terms of the Creative Commons Attribution License (CC BY). The use, distribution or reproduction in other forums is permitted, provided the original author(s) and the copyright owner(s) are credited and that the original publication in this journal is cited, in accordance with accepted academic practice. No use, distribution or reproduction is permitted which does not comply with these terms.
*Correspondence: Motoko Kosugi, kosugi.motoko@shizuoka.ac.jp