Commentary: Evaluating Risk and Possible Adaptations to Climate Change Under a Socio-Ecological System Approach
 Diego A. Alfaro
- Climathics, Mexico City, Mexico
A Commentary on
Evaluating Risk and Possible Adaptations to Climate Change Under a Socio-Ecological System Approach
by Haro, A., Mendoza-Ponce, A., Calderón, O., Velasco, J. A. and Estrada, F. (2021). Front. Clim. 3:54. doi: 10.3389/fclim.2021.674693
Introduction
Maize yields are highly dependent on meteorological conditions (Ray et al., 2015), and climate change could lead to a significant reduction in yields, especially at tropical latitudes (Rosenzweig et al., 2014). This is relevant in Mexico, where maize is by far the most widespread cultivated crop, grown extensively by small-scale farmers with little-to-no access to technology, insurance, or financial services (SAGARPA-FAO, 2014). The study by Haro et al. (2021; hereafter Haro21) provides a much-needed assessment of the socioecological risks facing rainfed maize cultivation in Mexico due to climate change. However, given the spatiaotemporal structure of maize yields in Mexico and their machine learning modeling framework, additional justification and more robust validations are needed to substantiate Haro21's findings.
Validating A Maize Yield Model: Beyond R2
Mexico is a very diverse country in social, economic, and ecoclimatic terms. These factors give way to large geographic variability in rainfed maize yields, wherein some municipalities exceed 8 ton/ha, while others remain below 0.5 ton/ha (Figure 1). To deal with the complex problem of modeling maize yields in Mexico, Haro21 trained a random forest (RF) tree-ensemble using socioeconomic and climatic variables during the 2003–2018 period. They cross-validated their model by randomly splitting the dataset into training (70% of the data) and a testing (remaining 30%) datasets. Their model achieved R2 ≈ 0.65, which was interpreted as a robust criterion for validation. Nonetheless, this R2 value is insufficient to validate the model for projections under climate change because most of the variability in yields occurs geographically, a dimension that is highly dependent on socioeconomic factors. More specifically, it is possible that Haro21's model achieved high R2 through its ability to fit the data geographically, while having a poor representation of yield sensitivity to changing climatic conditions.
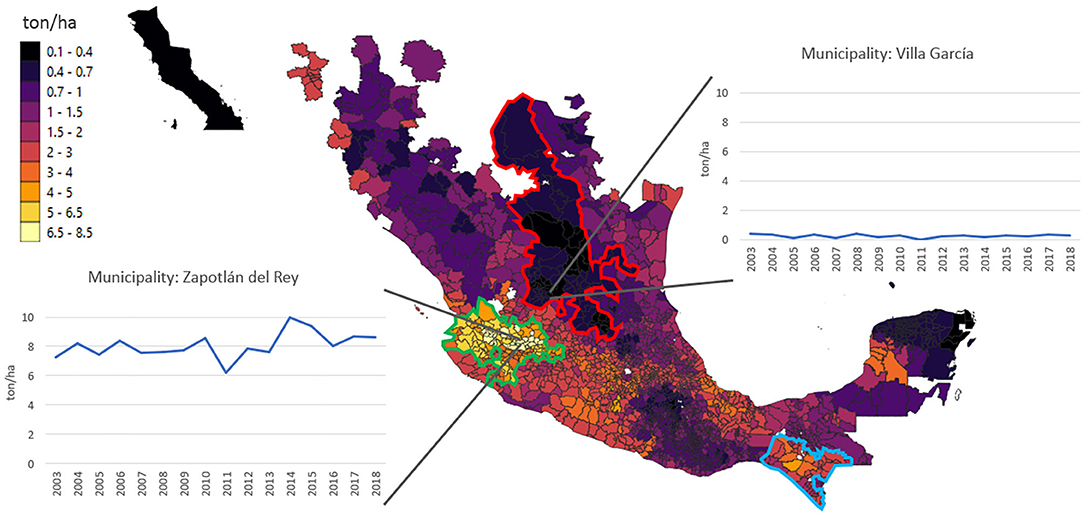
Figure 1. Map showing the 2003–2018 mean yield at the municipality scale for rainfed maize cultivated during the Spring-Summer cycle in Mexico, as indicated by de label bar. Two graphs displaying yield timeseries are included to contrast a high-yielding municipality (Zapotlán del Rey, Jalisco) with a low-yielding municipality (Villa García, Zacatecas). Clusters of municipalities with high (>4 ton/ha), moderate (between 1.5 and 4 ton/ha), and low (<0.7 ton/ha) mean yields are enclosed by the green, blue, and red lines, respectively. With data from SIAP (2018).
To give an example, consider a “mean_model” that estimates yields at the municipality scale with the mean yield of all years available between 2003 and 2018. To cross-validate the mean_model, 70% of the data is used for training, while the remaining 30% is used for computing R2 (only municipalities with at least 1 entry in the training set are considered). Using this framework on the same dataset considered by Haro21 for the Spring-Summer cycle (SIAP, 2018), mean_model consistently attains R2 ≈ 0.77, despite having no temporal structure. The skill of the mean_model lies in its ability to locate municipalities, because yield variations are dominated by the spatial dimension. Clearly, large R2 values do not guarantee a model's suitability for climate change projections.
Methodological Limitations for Making Future Climate Projections
The need for more detailed validations is further substantiated by specific aspects in Haro21's methodology, including the use of bioclimatic variables for modeling maize yields under climate change scenarios. In this regard, climatic impacts on maize yields vary as a function of phenological stage (Tsimba et al., 2013; Sah et al., 2020), and it is unlikely that yearly aggregated variables can capture such effects throughout a country with diverse planting/harvesting dates covering two cultivation cycles (SIAP, 2018). Thus, it is unclear whether bioclimatic variables offer increased predictive ability in varying climatic conditions, or if they merely enhance the model's skill by providing environmental queues for locating a datapoint's likely region of origin.
Another relevant matter pertains to the spatial clustering evident in Figure 1, wherein contiguous regions have similar mean yields. RFs are not designed to account for such spatial autocorrelations (Hajjem et al., 2014; Santibanez et al., 2015; Hengl et al., 2018), and biases can arise due to interdependence and non-identically distributed data (Darrell et al., 2015). For instance, considering the RF training step of fitting a regression tree (Hastie et al., 2004), spatiotemporal representations within high-yielding regions might be prioritized over their low-yielding counterparts, as larger variations in the former imply greater impacts toward minimizing the sum of the square residuals (SSR). Moreover, given that yield variability in Haro21's dataset is strongly dominated by the spatial dimension, SSR minimization will primarily shape trees so they can determine yield levels by associating inputs with a—herein loosely defined—geographic cluster, with no guarantee that the model will have any temporal predictive skill.
Discussion: A Path Forward
Observations presented herein make clear that temporal analyses are crucial for validating a maize yield model. Indeed, the primary means to establish the model's ability to capture climatic impacts is through its accuracy for representing interannual yield variations. Many pertinent assessments exist, such as computing R2 over anomalies—yields minus the municipality mean—, which removes the relationship between yield levels and geography (e.g., see Müller et al., 2017). In addition, pointwise (municipality-wise) linear correlations and Nash-Sutcliffe efficiencies can help identify regions where the model's performance is satisfactory and those where it is poor. Yet another alternative is to formulate the cross-validation procedure as “leave-one-(year)-out” (Thorp et al., 2007), which is commonly used in modeling applications with few years of data. Any of these temporal validations could help Haro21 address concerns about their modeling framework.
Abovementioned limitations in Haro21's methodology indicate possible areas of improvement. For example, the spring-summer and autumn-winter cultivation cycles can be modeled independently, and climatic variables could be reformulated over relevant periods between planting and harvest. Haro21 could also benefit from using a machine learning framework suitable for modeling spatiotemporal data, including alternatives based on RF. The RF for spatiotemporal predictions of Hengl et al. (2018) accounts for point interrelations based on spatial proximity. Another option is to model spatial clustering as a random effect via the mixed-effects RF of Hajjem et al. (2014), which has shown improvements over traditional RFs in recent crop modeling applications (Sahajpal et al., 2020a,b).
This commentary does not pertain to Haro21 as a whole. Their socioecological systems approach holds much promise, and their goals are highly pertinent to the risks facing agriculture in Mexico under climate change. But additional justification and robust validations are needed to substantiate the suitability of their maize yield model for future climate projections.
Author Contributions
The author confirms being the sole contributor of this work and has approved it for publication.
Conflict of Interest
The author declares that the research was conducted in the absence of any commercial or financial relationships that could be construed as a potential conflict of interest.
Publisher's Note
All claims expressed in this article are solely those of the authors and do not necessarily represent those of their affiliated organizations, or those of the publisher, the editors and the reviewers. Any product that may be evaluated in this article, or claim that may be made by its manufacturer, is not guaranteed or endorsed by the publisher.
Acknowledgments
The author is grateful to two reviewers for their constructive comments which helped improve the manuscript.
References
Darrell, T., Kloft, M., Pontil, M., Rätsch, G., and Rodner, E. (2015). “Machine learning with interdependent and non-identically distributed data (dagstuhl seminar 15152)” in Dagstuhl Reports. Vol. 5. Schloss Dagstuhl-Leibniz-Zentrum fuer Informatik.
Hajjem, A., Bellavance, F., and Larocque, D. (2014). Mixed-effects random forest for clustered data. J. Stat. Comput. Simul. 84, 1313–1328. doi: 10.1080/00949655.2012.741599
Haro, A., Mendoza-Ponce, A., Calderón, O., Velasco, J. A., and Estrada, F. (2021). Evaluating risk and possible adaptations to climate change under a socio-ecological system approach. Front. Clim. 3:54. doi: 10.3389/fclim.2021.674693
Hastie, T., Tibshirani, R., Friedman, J., and Franklin, J. (2004). The elements of statistical learning: data mining, inference, and prediction. Math. Intell. 27, 83–85. doi: 10.1007/BF02985802
Hengl, T., Nussbaum, M., Wright, M. N., Heuvelink, G. B. M., and Gräler, B. (2018). Random forest as a generic framework for predictive modeling of spatial and spatio-temporal variables. PeerJ 6:e5518. doi: 10.7717/peerj.5518
Müller, C., Elliott, J., Chryssanthacopoulos, J., Arneth, A., Balkovic, J., Ciais, P., et al. (2017). Global gridded crop model evaluation: benchmarking, skills, deficiencies and implications. Geosci. Model Dev. 10, 1403–1422. doi: 10.5194/gmd-10-1403-2017
Ray, D. K., Gerber, J. S., MacDonald, G. K., and West, P. C. (2015). Climate variation explains a third of global crop yield variability. Nat. Commun. 6, 1–9. doi: 10.1038/ncomms6989
Rosenzweig, C., Elliott, J., Deryng, D., Ruane, A. C., Müller, C., Arneth, A., et al. (2014). Assessing agricultural risks of climate change in the 21st century in a global gridded crop model intercomparison. Proc. Natl. Acad. Sci. 111, 3268–3273. doi: 10.1073/pnas.1222463110
SAGARPA-FAO (2014). Diagnóstico del sector rural y pesquero de México 2012. Mexico City: Secretaría de Agricultura, Ganadería, Desarrollo Social, Pesca y Alimentación (SAGARPA).
Sah, R. P., Chakraborty, M., Prasad, K., Pandit, M., Tudu, V. K., Chakravarty, M. K., et al. (2020). Impact of water deficit stress in maize: phenology and yield components. Sci. Rep. 10, 1–15. doi: 10.1038/s41598-020-59689-7
Sahajpal, R., Becker-Reshef, I., and Coutu, S. (2020b). Optimizing crop cut collection for determining field-scale yields in an insurance context. Workshop Fragile Earth Data Sci. Sustain. Planet. doi: 10.31223/X5J59H. [Epub ahead of print].
Sahajpal, R., Fontana, L., Lafluf, P., Leale, G., Puricelli, E., O'Neill, D., et al. (2020a). “Using machine-learning models for field-scale crop yield and condition modeling in Argentina,” in XII Congreso de AgroInformática (CAI 2020)-JAIIO 49.
Santibanez, S., Lakes, T., and Kloft, M. (2015). “Performance analysis of some machine learning algorithms for regression under varying spatial autocorrelation,” in The 18th AGILE International Conference on Geographic Information Science, Lisboa, Portugal, 9–12.
SIAP (2018). Servicio de Información Agroalimentaria y Pesquera (SIAP). Sistema de Información Agroalimentaria y de Consulta (SIACON). Mexico City: Secretaría de Agricultura, Ganadería, Desarrollo Social, Pesca y Alimentación (SAGARPA).
Thorp, K. R., Batchelor, W. D., Paz, J. O., Kaleita, A. L., and DeJonge, K. C. (2007). Using cross-validation to evaluate CERES-Maize yield simulations within a decision support system for precision agriculture. Trans. ASABE 50, 1467–1479. doi: 10.13031/2013.23605
Keywords: crop modeling, maize yield model, machine learning, random forest, cross-validation, climate change risk, spatiotemporal data
Citation: Alfaro DA (2021) Commentary: Evaluating Risk and Possible Adaptations to Climate Change Under a Socio-Ecological System Approach. Front. Clim. 3:732293. doi: 10.3389/fclim.2021.732293
Received: 28 June 2021; Accepted: 21 October 2021;
Published: 12 November 2021.
Edited by:
Jose A. Marengo, Centro Nacional de Monitoramento e Alertas de Desastres Naturais (CEMADEN), BrazilReviewed by:
Nidhi Nagabhatla, The United Nations University Institute on Comparative Regional Integration Studies (UNU-CRIS), BelgiumAngelyn Lao, De La Salle University, Philippines
Copyright © 2021 Alfaro. This is an open-access article distributed under the terms of the Creative Commons Attribution License (CC BY). The use, distribution or reproduction in other forums is permitted, provided the original author(s) and the copyright owner(s) are credited and that the original publication in this journal is cited, in accordance with accepted academic practice. No use, distribution or reproduction is permitted which does not comply with these terms.
*Correspondence: Diego A. Alfaro, diego.alfaro@climathics.com