Qualitative Analysis of Drug-Containing Plasma and its Application to Quantitative Analysis and Pharmacokinetic Study of Zexie Decoction Using UPLC-MS/MS
 Jiashuo Wu1†
  Shunliang Zheng1,2† Fangqing Zhang1 Haonan Ruan1 Haotian Xue1,3 Jingxun Wang1 Zhuangzhuang Li1 Weiyi Jin1,4 Weihua Wang5
  Jing Xia6 Yue Shi1*
- 1Institute of Medicinal Plant Development, Chinese Academy of Medical Sciences and Peking Union Medical College, Beijing, China
- 2Mudanjiang Youbo Pharmceutical Co., Ltd., Mudanjiang, China
- 3College of Public Health, Hebei University, Baoding, China
- 4College of Public Health, Hebei Medical University, Shijiazhuang, China
- 5School of Pharmaceutical Sciences, Tsinghua University, Beijing, China
- 6Department of Pharmacognosy, School of Pharmacy, China Medical University, Shenyang, China
ZeXie Decoction (ZXD) is one of the traditional Chinese medicine formulas (TCMFs) comprising Alisma orientalis (Sam.) Juzep. (ZX) and Atractylodes macrocephala Koidz. (BZ) in 5:2 ratios and is widely employed in clinical applications since ancient times. In this study, UHPLC-QE-Orbitrap-MS was used for qualitative analysis of ZXD in rats’ plasma after a single oral dose of 750 mg/kg body weight. Afterward, UHPLC-Q-TRAP-MS/MS was used for simultaneous analysis of three bioactive chemical compounds including alisol A, alisol B, and alisol A 24-acetate in ZXD’s ethanol extract. Subsequently, the pharmacokinetic profiles of the three analytes were investigated in rat plasma utilizing UHPLC-Q-TRAP-MS/MS. The multiple reaction monitoring (MRM) mode for the three analytes were at m/z 508.4→383.2 for alisol A, m/z 490.4→365.2 for alisol B, and m/z 550.4→515.5 for alisol A 24-acetate. The analysis method was validated in terms of its accuracy, stability, repeatability, linearity, spiked recovery and matrix effect. As a result, twenty-five chemical constituents of ZXD were putatively identified in plasma, and rapid, sensitive, and accurate methods were established for the quantitative analysis and pharmacokinetic study of ZXD. The findings of this study can provide a scientific base for further study of in vivo pharmacokinetics of TCMFs.
1 Introduction
The traditional Chinese medicine formulas (TCMFs) have been employed clinically for a long time owing to their features of being “multi-component, multi-target, and multi-pathway” (Song et al., 2019). TCMFs, nowadays, are playing an important role in the diagnosis and treatment of a wide range of complicated disorders, including diabetes, non-alcoholic fatty liver disease, epilepsy, and osteoporosis (Ping Yang et al., 2020; Xu et al., 2020; Wu et al., 2021a; Xia et al., 2021). However, significant challenges are presented in terms of the quality control of TCMF due to the complex chemical constituents present in these TCMFs, thus limiting their wider clinical applicability. To understand the chemical constitution of TCMF in plasma, qualitative and quantitative analytical techniques, as well as pharmacokinetic studies, are routinely employed.
ZeXie Decoction (ZXD) is composed of Alisma orientalis (Sam.) Juzep. (Zexie, ZX) and Atractylodes macrocephala Koidz. (Baizhu, BZ) at a ratio of 5:2. It was recorded on “Synopsis of Golden Chamber”, a TCM masterpiece written by Zhongjing Zhang. Recent reports suggested that ZXD had a lipid-lowing and anti-inflammatory pharmacological effect, and it was frequently employed clinically to treat non-alcoholic fatty liver, atherosclerosis and hyperlipidemia clinically (Wu et al., 2021a). Although there are many investigations on the quali-quantitative analysis (Na Yang et al., 2020; Tang et al., 2021) and pharmacokinetic analysis (Tao et al., 2019) of the aqueous extract of ZXD and ZX, comparative investigations of their ethanol extracts are rather scarce.
In our previous study, a comparative study of the ethanol and aqueous extracts of ZXD based on UHPLC-Q-TOF-MS as well as an in vitro biological activity in the HepG2 cell line was performed. The results had suggested that the ethanolic extract of ZXD manifested a better hypolipidemic effect than the aqueous extract owing to the different chemical composition (Chang et al., 2021). Afterward, the ethanolic extract of ZXD was proved to have a therapeutic effect on non-alcoholic fatty liver disease in SD rats (Wu et al., 2021b). As a result, it was discovered that the ethanolic extract of ZXD had the significantly better potential for future investigation.
Herein, a total of twenty-five chemical constituents of ZXD were putatively identified in plasma using UHPLC-QE-Orbitrap-MS, three of which were selected for further quantitative analysis and pharmacokinetic study by using UHPLC-Q-TRAP-MS/MS. These three chemical constituents were putatively identified as alisol A, alisol B, and alisol A 24-acetate, respectively. Overall, rapid, sensitive, and accurate methods were established for the qualitative, and quantitative analysis and pharmacokinetic profile of ZXD.
2 Materials and Methods
2.1 Chemicals and Reagents
The dried rhizomes of ZX and BZ (Batch number: DD6081, DD8061) were supplied by Beijing Huamiao Pharmaceutical Co., Ltd. (Beijing, China). Three standards including alisol A, alisol B, alisol A 24-acetate (Batch number CHB180313, CHB180316, and CHB180315) were supplied by Chengdu Chroma-Biotechnology Co., Ltd. HPLC grade methanol and acetonitrile were purchased from Honeywell Burdick and Jackson. Ultra-pure water was obtained by using a super-pure water system (Beijing, China). Nimodipine was purchased from Macklin reagent Co., Ltd. (Shanghai, China).
2.2 Apparatus and Analytical Conditions
2.2.1 Qualitative Analysis Using UHPLC-QE-Orbitrap-MS
Qualitative analysis was performed by using UHPLC equipped with the online degassing machine, quaternary gradient pump, column temperature chamber and automatic sampler. The heated electrospray ionization (HESI) source was used in conjunction with the Q Exactive PlusTM Orbitrap MS system (Thermo Scientific, Waltham, MA, United States). Separation of the analytes was carried out using Waters ACQUITY UPLC HSS T3 C18 column (2.1 mm × 100 mm, 1.8 μm). The temperature of the analytical column was preset at 30°C. The injection volume was 5 μL and a flow rate of 0.2 ml/min was used throughout the experiment. Gradient elution was carried out with water with 0.1% (v/v) formic acid in water (solvent B) and acetonitrile (solvent A). The gradient elution was as follow: 0–10 min, 100% B; 10–20 min, 100–70% B; 20–25 min, 70–60%B; 25–30 min, 60–50% B; 30–40 min, 50–30%B; 40–45 min, 30–0% B; 45–60 min, 0 %B; 60–60.1 min, 0–100% B; 60.1–70 min, 100% B. The qualitative analysis was performed based on a positive ion mode or a negative ion mode at the range of m/z 100–1,500. The optimized parameters of MS were set as follows: aux gas heater temperature, 350°C; capillary temperature, 320°C; sheath gas flow, 40 arb; auxiliary gas flow rate, 15 arb; positive spray voltage, 3.2 kv; resolution of MS, 70,000; resolution of MS/MS, 17,500.
2.2.2 Quantitative Analysis and Pharmacokinetic Study Using UPLC-Q-TRAP-MS/MS
The quantitative analysis and pharmacokinetic investigation were conducted using an AB SCIEX QTRAP 5500 triple quadrupole mass spectrometer (AB SCIEX, Foster, CA, United States). The separation of alisol A, alisol B, and alisol A 24-acetate was carried out using an ACQUITY HSS T3 column (2.1 × 100 mm, 2.5 μm) coupled to a I-Class UPLC system (Waters Corporation, Milford, MA, United States) equipped with a binary pump. The analytical column was set to 35°C. This experiment employed an injection volume of 10 μL and a flow rate of 0.2 ml/min. Gradient elution was carried out with 0.1% (v/v) formic acid in water (solvent B) and acetonitrile with 2 mM ammonium acetate (solvent A). The gradient elution was as follow: 0–6 min, 40–0% B; 6–8 min, 0–40% B; 8–12 min, 40% B. The following were the optimum MS parameters: The ESI ion source temperature was 500°C; the air curtain pressure was 30 psi; the collision activated dissociation (CAD) gas parameters were medium, and the ion spray voltage was 5500 V.
2.3 Preparation of Samples
2.3.1 Extraction Method
The ZXD samples were prepared by combining ZX and BZ pieces in the (w/w) ratio of 5:2. After being crushed, pulverized, and decocted three times with a ten-times volume of 95% ethanol for 2 h each. After that, the decoctions were filtered, mixed, and concentrated under reduced pressure before being dried at 60°C for 48 h under a vacuum. The extraction rate of ZXD was 14.29% according to the following formula: Extraction rate = weight of ZXD powder/weight of ZX and BZ pieces.
2.3.2 Pretreatment of Extract Samples
To prepare the working solutions of extract samples for quantitative analysis, 50 mg of ZXD ethanol extracts were diluted in 10 ml of 50% methanol to yield a solution with a concentration of 5 mg/ml. To obtain solutions with concentrations of 1 mg/ml, correctly weighted portions of the three standards were dissolved in 50% methanol to yield solutions with concentrations of 1 mg/ml. For measurement, the standard solutions were further diluted with acetonitrile.
2.3.3 Pretreatment of Plasma Samples
The plasma samples were performed protein precipitation. 100 μL of the samples were spiked with 300 μL 20% methanol/60% acetonitrile/20% isopropanol/0.1% formic acid and vortexed for 1 min. Following that, the samples were centrifuged at 12,000 rpm for 10 min. After collection of the supernatant, it was spun dried and redissolved in 50% methanol for UPLC-MS analysis. The quality control (QC) samples of two levels were prepared in the same way at concentrations of 3 ng/ml and 400 ng/ml.
2.4 Methodology Validation
2.4.1 Accuracy and Precision
Intra-day and inter-day precision were evaluated by two levels of QC samples on the same day (intra-day, n = 7) and three consecutive days (inter-day, n = 21).
2.4.2 Stability
The short-term and long-term stability were evaluated by two levels of QC samples (n = 7) under the storage condition of 4°C for 24 h and −20°C for 14 days. The samples were further processed by freeze-thaw cycles repeated thrice.
2.4.3 Specificity
To avoid endogenous interference, the specificity was determined by comparing representative multiple reaction monitoring (MRM) chromatograms of blank plasma to plasma spiked with alisol A, alisol B, alisol A 24-acetate, and an internal standard (IS).
2.4.4 Linearity and the Threshold of Detection
Blank plasma samples containing alisol A, alisol B, alisol A 24-acetate and IS were prepared at eight different concentrations (2, 5, 10, 20, 50, 100, 200, 500 ng/ml for the three analytes). The linearity curves were plotted using the x-axis for concentrations and the y-axis for peak area. To obtain regression equations, least-squares linear regression was used. Furthermore, the limits of quantification and detection (LOQ and LOD) were determined, which was set to a signal-to-noise ≥10 and that ≥3.
2.4.5 Spiked Recovery and Matrix Effect
Spiked recovery of spiked plasma samples was determined by comparing the observed concentrations of pre- and post-spiked plasma samples. Additionally, the matrix effect was calculated by comparing the observed concentrations of post-spiked plasma samples and IS adjusted solutions of pure standards.
2.5 Preparation of Experimental Animals
All the animal experiments were approved by the Institute of Medicinal Plant Development, Chinese Academy of Medical Sciences and Peking Union Medical College. A total of twelve Sprague-Dawley (SD) rats weighing 200 ± 20 g were provided by the Beijing Vital River Laboratory Animal Technology Co. Ltd. and were adaptively bred in an SPF-level environment for 3 days. The rats were randomly divided into two groups, including the treatment group (n = 6) and blank group (n = 6). Animals were fasted for 12 h before the experiment and were given free access to water. ZXD was dissolved in 0.5% sodium carboxymethylcellulose (CMC-Na) aqueous solution. Considering that the analytes in drug-containing plasma possess the characteristics of low content and strong interference, the maximum dosage was attempted (Zhou et al., 2010; Ying et al., 2020). The concentration of 150 mg/ml was adopted, which also showed flowability for administration. The volume of administration was 5 ml/kg, and thus ZXD was delivered orally to rats in the treatment group at a single dose of 750 mg/kg body weight. As a negative control, distilled water was given to the blank group rats. Animals were anesthetized with ether inhalation and blood samples were obtained in EDTA-anticoagulant tubes at the following time points: pre-dose, 20 min, 40 min, 1.5, 2, 3, 4.5, 6, 8, 10, 12, and 24 h. Plasma was collected from the blood samples by centrifugation at 3,000 g for 10 min and stored at −80°C for subsequent analysis. After the final time point of blood collection, rats were sacrificed via anesthetic overdose.
For the qualitative examination of plasma-containing drugs, a portion of plasma samples collected at various time points was combined. The remainders of the samples were used for the pharmacokinetic study to analyze the dynamic processes of chemical constituents in animals.
2.6 Data Analysis
The LC-MS data were examined using the Xcalibur workstation’s Qual Browser and Quan Browser (Thermo Scientific, United States, Version 4.1). SPSS 23.0 software (SPSS Inc., United States, Version 23) was used for statistical analysis, and sample concentrations were expressed as mean ± SD. The pharmacokinetic profile was depicted by GraphPad Prism software (Bethesda, United States, Version 6.02), and the pharmacokinetic parameters were calculated by Phoenix WinNonlin software (Certara, Corp., Version 6.3).
3 Results and Discussion
3.1 The Selection Criteria of Analytes
In a pre-experiment, we proved that alisol A, alisol B, and alisol A 24-acetate had significant lipid-lowing effect in vitro through an oleic acid-reduced lipid accumulation model in the HepG2 cell line (Supplementary Figures S7–S9). Moreover, the lipid-lowing and anti-inflammatory activities of alisol A, alisol B, and alisol A 24-acetate have been broadly reported recently (Zeng et al., 2016; Fei et al., 2018; Ho et al., 2019). Considering ZXD-mediated treatment of NAFLD and a number of other diseases related to dysregulation of lipid metabolism (Song et al., 2014; Xue et al., 2014; Wu et al., 2021b; Chang et al., 2021), alisol A, alisol B and alisol A 24-acetate were selected to analyzed in the present study.
3.2 Optimization of Analysis Conditions
Figure 1 depicts the chemical structures of the three analytes. Different kinds of mobile phases were compared to screen the optimized conditions. The eluting solvent system consisting of water with 0.1% (v/v) formic acid in water (solvent B) and acetonitrile (solvent A) was found suitable to improve the separation of components. The recovery was found not satisfactory if we solely used acetonitrile or methanol for protein precipitation. Therefore, we selected 20% methanol/60% acetonitrile/20% isopropanol/0.1% formic acid mixture to attain better precipitation results.
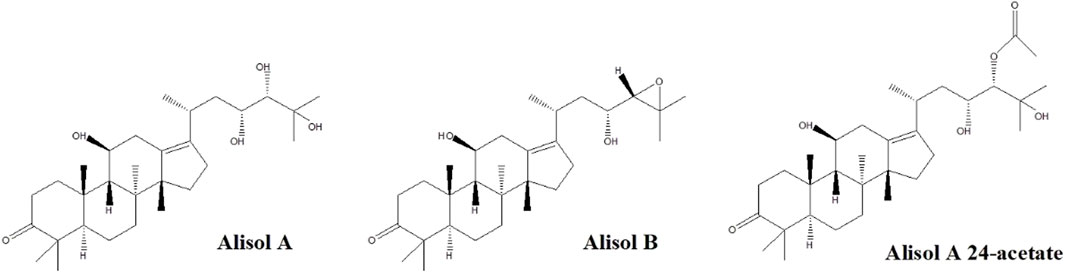
FIGURE 1. Chemical structures of alisol A, alisol B, and alisol A 24-acetate.
For the qualitative analysis, the high-resolution mass spectra based on UHPLC-QE-Orbitrap-MS was used to screen the maximum chemical constituents in plasma. The gradient elution procedures with a total run time of 70 min were adopted for a better separation effect. Additionally, both positive and negative ion modes of operation were carried out. It was demonstrated that a greater number of peaks can be recorded in positive ion mode, thus was chosen for formal trials.
For the quantitative analysis and pharmacokinetic study, targeted quantitative mass spectra based on UPLC-Q-TRAP-MS/MS were employed for accurate quantification. The gradient elution procedures of 12 min were adopted to accommodate both efficiency and separation effect. Additionally, the collision energy and de-clustered voltage parameters of the best fit in MRM mode were investigated to assure the highest possible relative abundance of the ion components (Table 1).
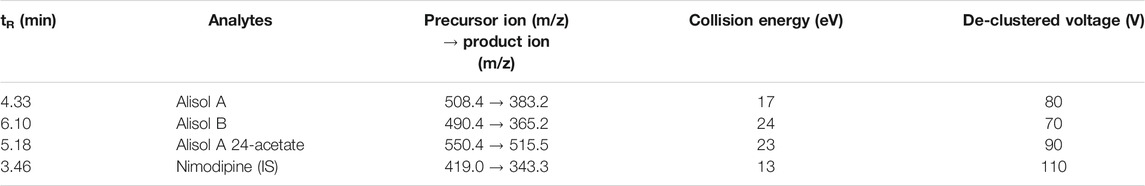
TABLE 1. The mass spectrometry parameters for analytes.
For the methodology validation, Table 2 shows the accuracy and precision of QC samples, indicating that this assay has an acceptable precision. Additionally, the samples were stable in the presence of long- and short-term storage, as well as three-freeze–thaw cycles (Table 3). At the retention times of alisol A (4.33 min), alisol B (6.10 min), alisol A 24-acetate (5.18 min), and IS (3.46 min), no endogenous interferences were identified (Figure 2). The linearity curves of the three analytes exhibited excellent linearity (R2 > 0.99) (Table 4). The LOD and LOQ met the requirements of the present quantitative analysis (Table 4; Supplementary Figures S1–S6). The spiked recovery and matrix effect were determined from 90–110% (Table 5).
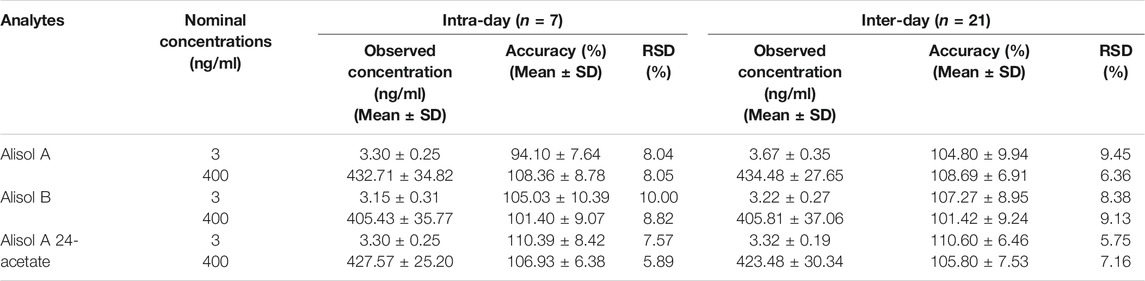
TABLE 2. Accuracy and precision of QC samples.
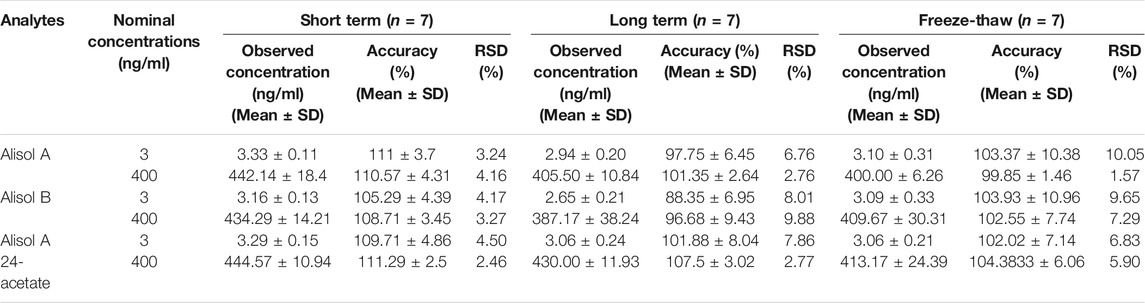
TABLE 3. Stability of QC samples.
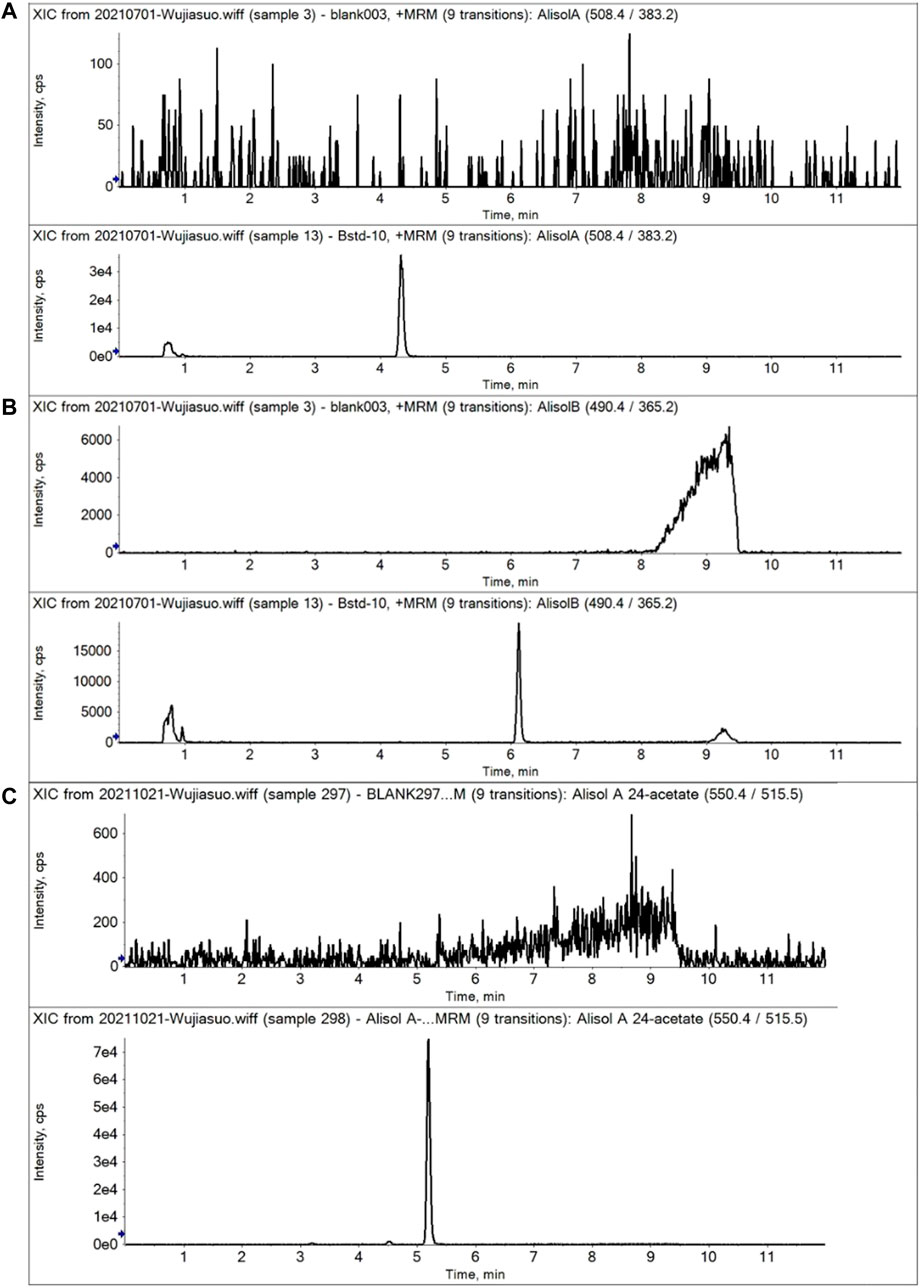
FIGURE 2. Representative MRM chromatograms of alisol A, alisol B, and alisol A 24-acetate in plasma samples. (A). Alisol A; (B). Alisol B; (C). Alisol A 24-acetate. (Up-down, blank plasma and that spiked three analytes).
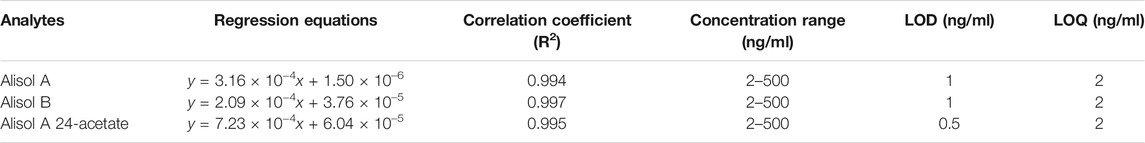
TABLE 4. Linearity of the three analytes.
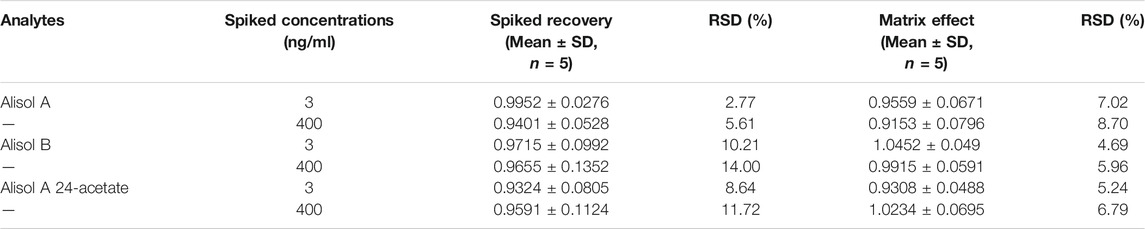
TABLE 5. Spiked recovery and matrix effect of the three analytes.
3.3 Results of Qualitative Analysis
The qualitative data were analyzed by Excalibur software. In the positive MSn spectra, the error values of quasi-molecular ions, including (M + H)+and [M + Na] +, were calculated and the values lying within 15 ppm were selected to analyze the fragment ions in the light of previous reports and chemical databases. Afterward, the probable chemical structure was determined. Twenty-five chemical constituents of ZXD were putatively identified in drug-containing plasma in total. The details such as retention time, putative identification, and molecular formula are given in Table 6.
TABLE 6. The putatively identified chemical constituents in drug-containing plasma by UHPLC-QE-Orbitrap-MS.
Parts of representative and potential bio-active compounds in ZX and BZ were chosen to clarify their second-order mass spectrometry graphs and proposed fragmentation pathways, including 16-oxo-alisol A, alisol B, alisol B 23-acetate, alisol C 23-acetate, alisol F, alisol I, atractylenolide I, II and III (Liu et al., 2010; Chao et al., 2016; Chen et al., 2016; Li et al., 2016; Bi et al., 2017; Na Yang et al., 2020; Kanno et al., 2017; Fei et al., 2018; Zhang et al., 2018; Chang et al., 2021). Detailed descriptions were as follows.
3.3.1 16-Oxo-alisol A
Peak 10 (tR = 33.16 min) displayed a quasi-molecular ion peak [(M + H)+] at m/z 505.3527 (C30H49O6)+, which was putatively determined to be 16-oxo-alisol A. Fragment ions at m/z 487.3388, 469.3321, and 451.3203 were ascribed to three dehydrations taking place at 11-OH, 23-OH, and 25-OH groups. Moreover, the fragment ion at 90 Da at m/z 415.2850 was presumably formed following the cleavage of the C23-C24 chemical bond from (C30H49O6)+, one of the characteristic fragmentations of alisol A derivatives, 16-oxo-alisol A included. Further dehydration occurred at 11-OH of the fragment ion at m/z 415.2850, which formed the fragment ion at m/z 397.2732. Thus, after comprehensive analysis, we putatively identified peak 10 as 16-oxo-alisol A (Figure 3).
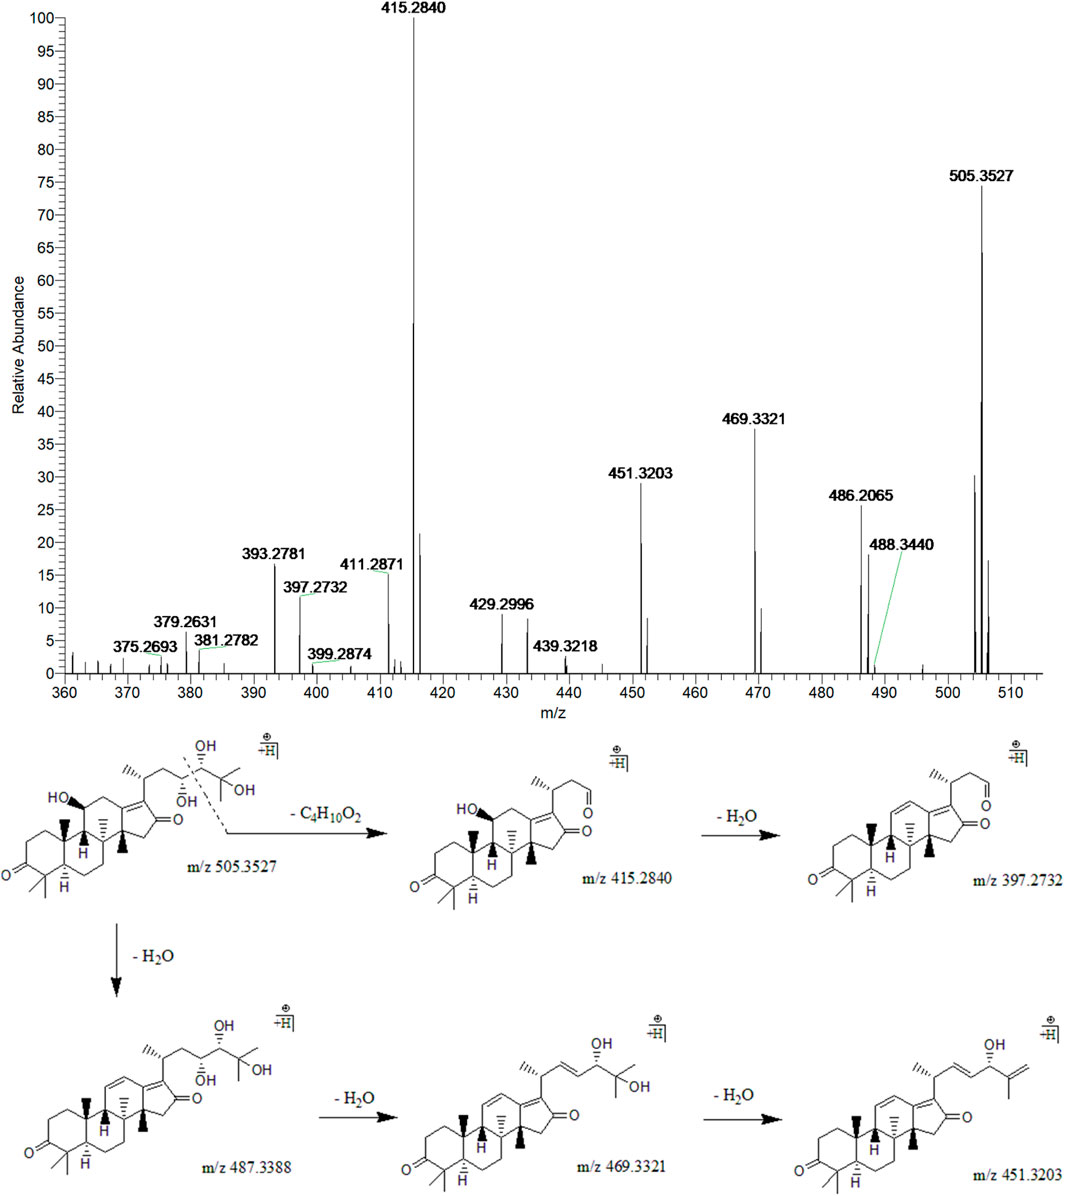
FIGURE 3. The second-order mass spectrometry graphs and proposed fragmentation pathways of 16-oxo-alisol A (peak 10).
3.3.2 Alisol B and Alisol B 23-Acetate
Peak 18 (tR = 39.01 min) displayed a quasi-molecular ion peak [(M + H)+] at m/z 473.3597 (C30H48O4)+, which was putatively identified as alisol B. A series of dehydrations and the breaking of the C23-C24 chemical bond formed fragment ions at m/z 455.3488, 437.3436, and 383.2946, which was similar to the characteristic fragmentation process of 16-oxo-alisol A. Moreover, the fragment ion at m/z 339.2687 was attributed to the hydrogen-rearrangement in the ion at m/z 383.2946, and thus peak 18 was putatively identified as alisol B. Similarly, Peak 19 (tR = 39.61 min) displayed a quasi-molecular ion peak [(M + H)+] at m/z 515.3749 (C32H50O5)+. Just as peak 18, fragment ions at m/z 497.3636 and 383.2939 were detected for dehydration from the parent ion and breaking of the C23-C24 chemical bond. Fragment ion at m/z 437.3417 could generate from that at m/z 497.3636 for deacetylation at 23-OAc. Thus, we putatively identified peak 19 as alisol B 23-acetate (Figure 4).
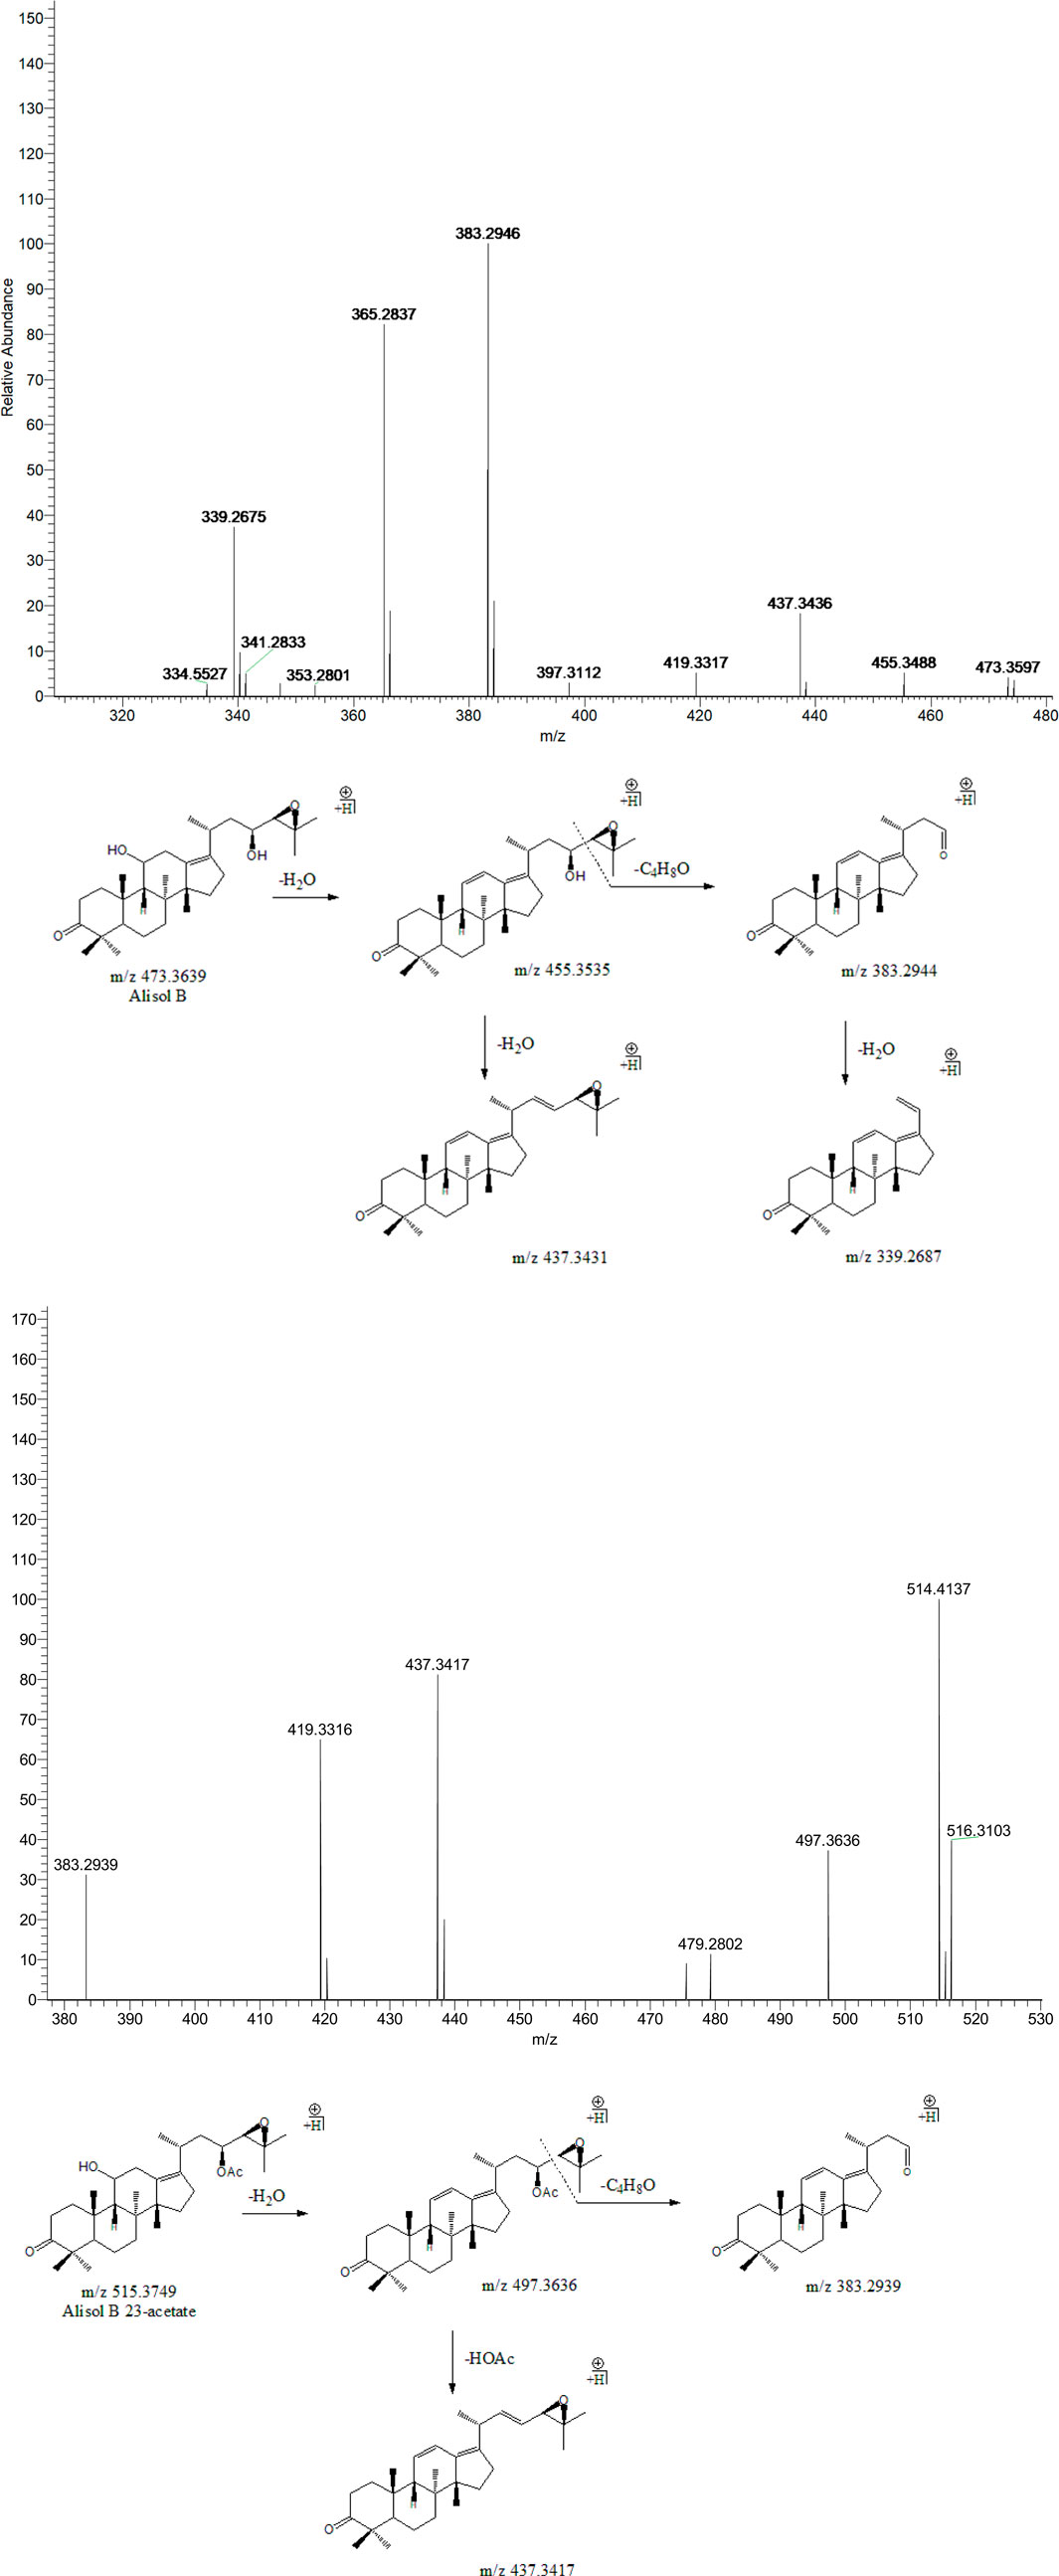
FIGURE 4. The second-order mass spectrometry graphs and proposed fragmentation pathways of alisol B and alisol B 23-acetate (peaks 18 and 19).
3.3.3 Alisol C 23-Acetate
Peak 16 (tR = 36.91 min) displayed a quasi-molecular ion peak [(M + H)+] at m/z 529.3524 (C32H48O6)+, which was putatively identified as alisol C 23-acetate. Fragment ion at m/z 511.3402 was putatively identified as arising from dehydrations at 11-OH. Similar to alisol B 23-acetate, fragment ion at m/z 451.3216 was detected for deacetylation at 23-OAc. Fragment ions at m/z 415.2985 and 397.2874 were formed because of further cleavage of C23-C24 chemical bond and dehydration from that at m/z 451.3216. Therefore, peak 16 was putatively identified as alisol C 23-acetate (Figure 5). The only difference between alisol C and alisol C 23-acetate was the presence of acetyl group. Thus, peak 5 that exhibited similar second-order mass characteristics as peak 16 was putatively identified as alisol C.
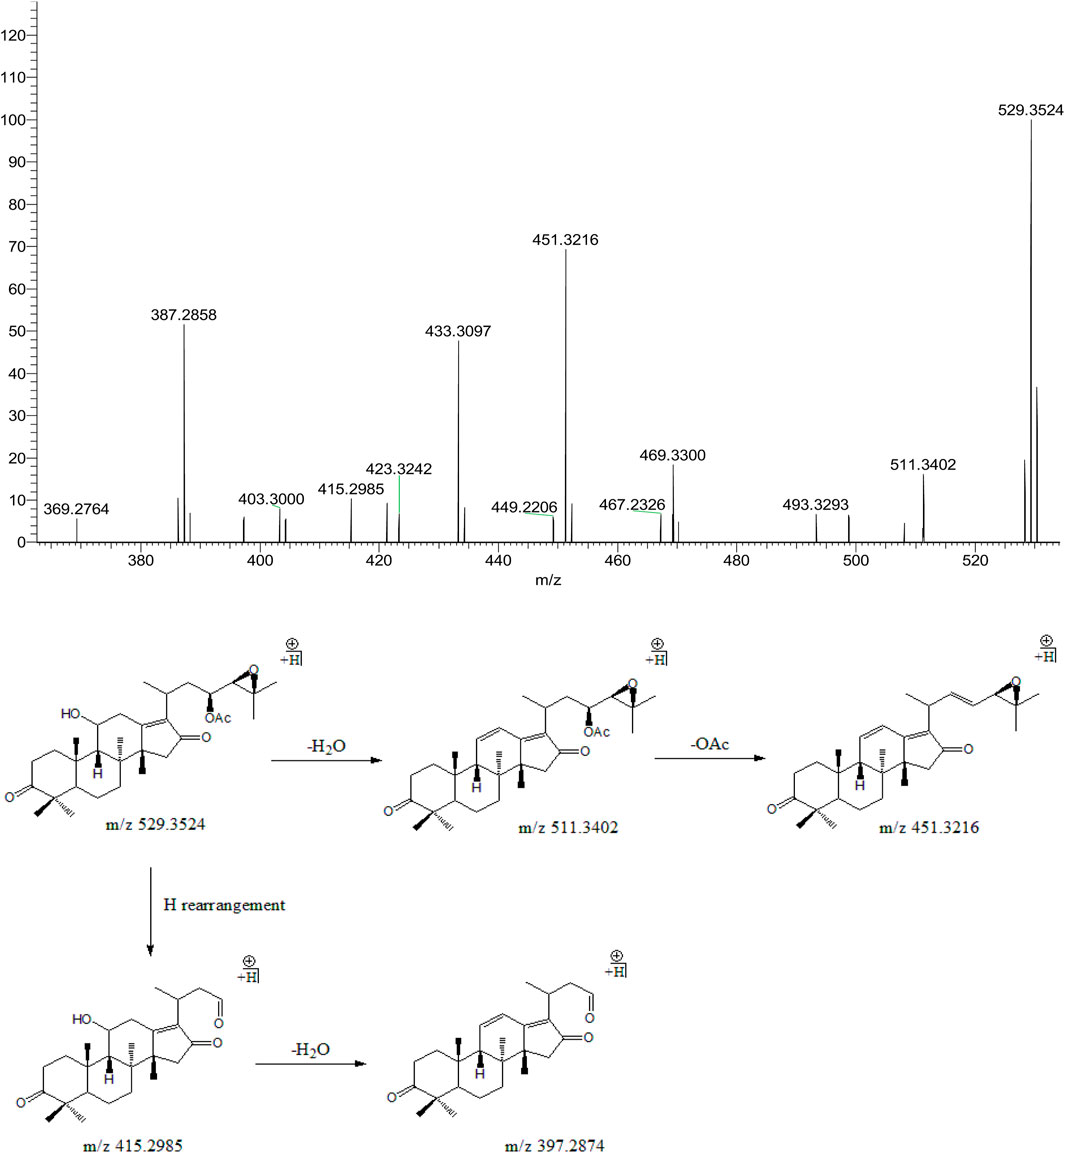
FIGURE 5. The second-order mass spectrometry graphs and proposed fragmentation pathways of alisol C 23-acetate (peak 16).
3.3.4 Alisol F
Peak 14 (tR = 36.63 min) displayed a quasi-molecular ion peak [(M + H)+] at m/z 489.3583 (C30H49O5)+, which was putatively established as alisol F. Fragment ions at m/z 471.3473 and 453.3371 were detected for two dehydrations at 11-OH and 25-OH groups. Fragment ions at m/z 399.2897 and 381.2788 were formed for the breaking of the C23-C24 bond in the ions responsible for the peaks at m/z 489.3583 and 471.3473, respectively. In addition, fragment ion at m/z 381.2788 could also generate from dehydration at 11-OH of the ion at m/z 399.2897. Therefore, peak 14 was putatively identified as alisol F (Figure 6).
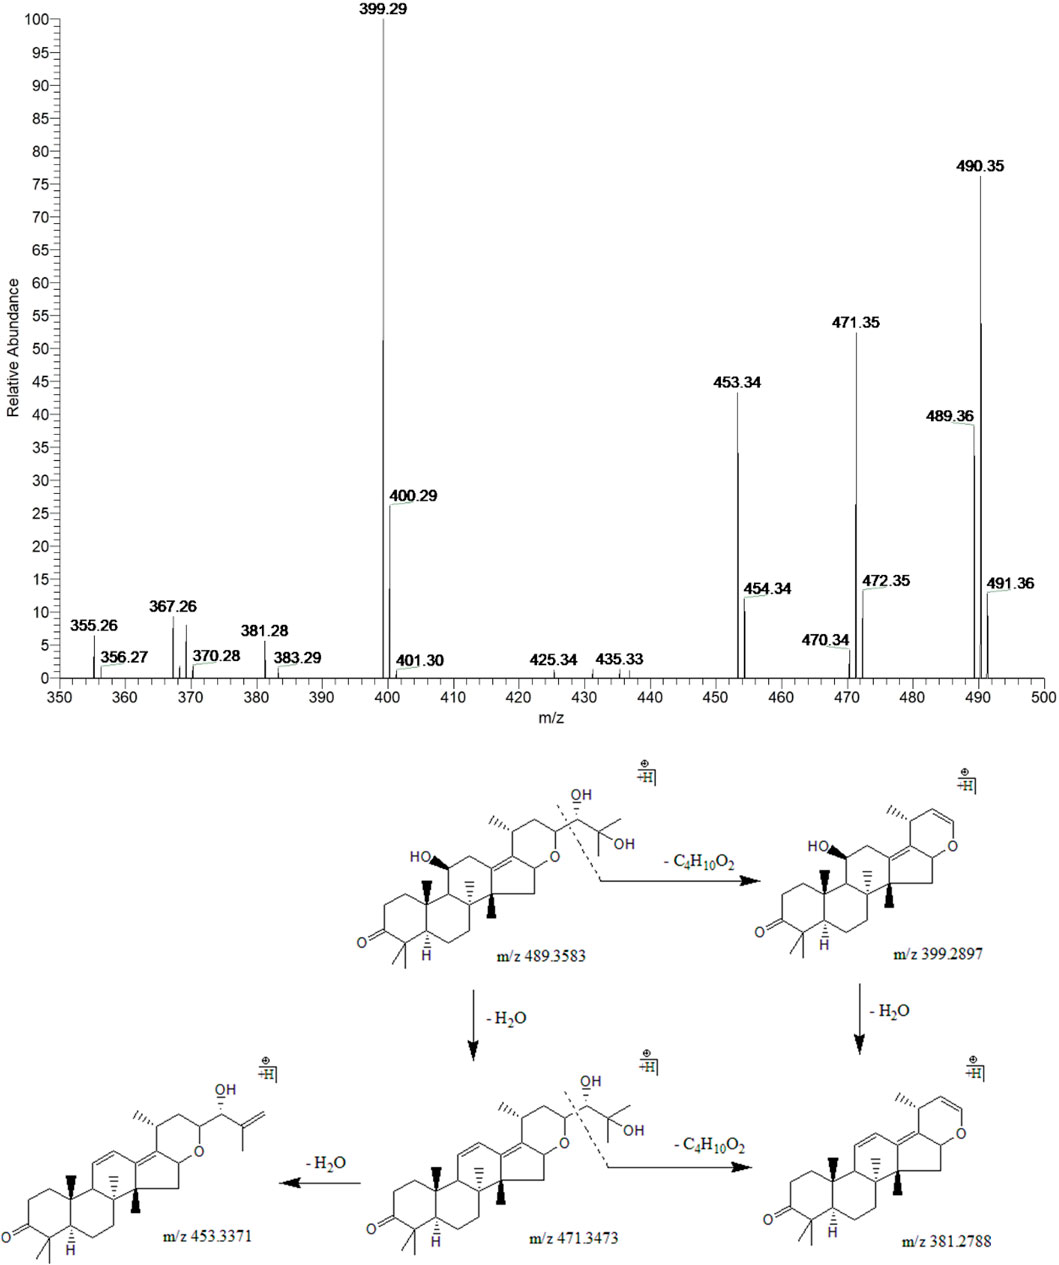
FIGURE 6. The second-order mass spectrometry graphs and proposed fragmentation pathways of alisol F (peak 14).
3.3.5 Alisol I
Peak 23 (tR = 44.46 min) displayed a quasi-molecular ion peak [(M + H)+] at m/z 455.3495 (C30H46O3)+, which was deduced as alisol I. Fragment ion at m/z 383.2965 was putatively identified as arising from the cleavage of C23-C24 chemical bond, which was the same as alisol F. Fragment ion at m/z 341.2838 formed by the ion-source dissociation of the 16,23-oxide 6-membered ring of that at m/z 383.2965, and thus peak 23 was putatively identified as alisol I. (Figure 7).
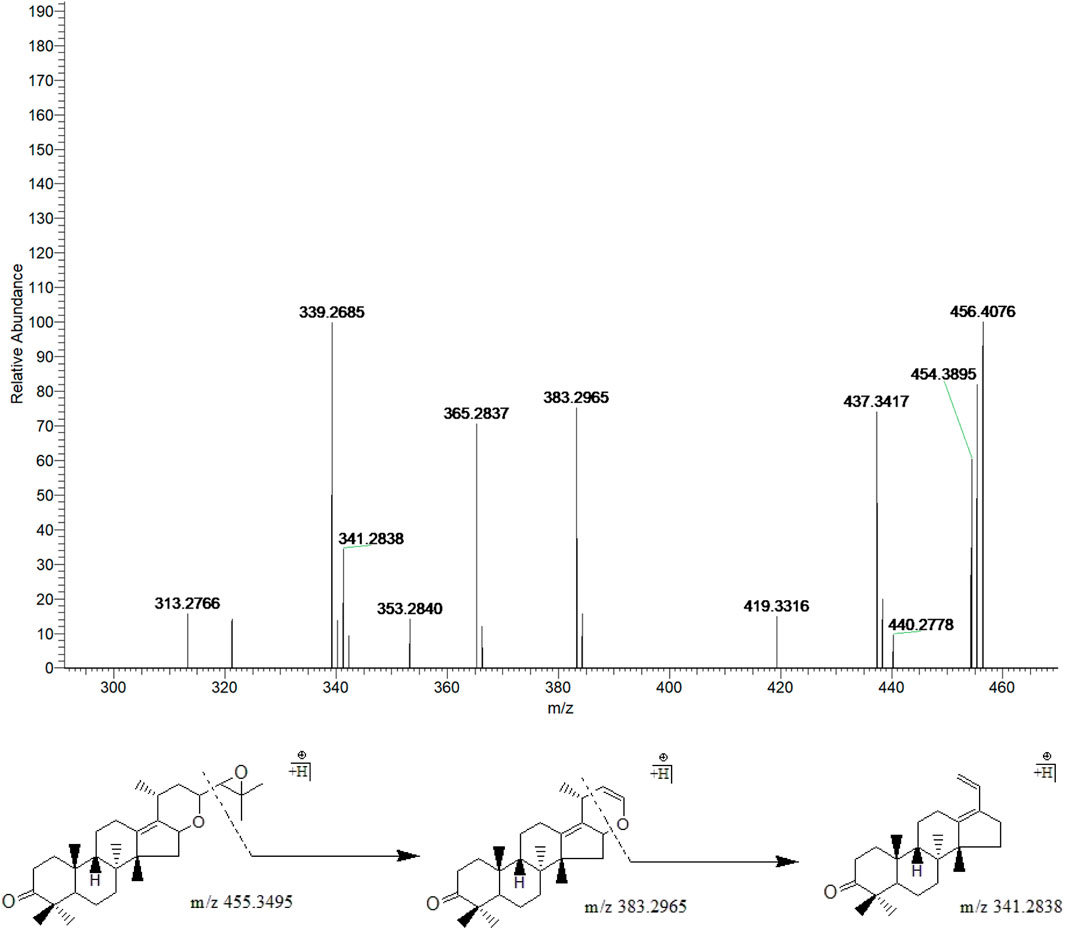
FIGURE 7. The second-order mass spectrometry graphs and proposed fragmentation pathways of alisol I (peak 23).
3.3.6 Atractylenolide I, II, and III
Peak 3, 4 and 12 (tR = 24.21, 25.68 and 33.68 min) displayed quasi-molecular ion peaks at m/z 249.1484 (C15H20O3)+, 233.1538 (C15H20O2)+and 231.1385 (C15H18O2)+, which were putatively determined as atractylenolide III, II and I, respectively. Atractylenolide belongs to the family of sesquiterpene lactone compound, which existed ubiquitously in BZ. The existence of γ-lactone moieties can be authenticated by the characteristic fragment ions like (M + H-H2O)+ and (M + H-H2O-CO)+, which further cleave into characteristic fragment ions by the loss of CH2, C2H4, C3H6, and C4H8 in the 12-membered ring of the parent ion. By screening the MS/MS spectrum of peak 3, fragment ions like (M + H-H2O)+, (M + H-H2O-CO)+, (M + H-H2O-C3H6)+, (M + H-H2O-C4H8)+, and (M + H-H2O-C4H8-CO)+ were generated at m/z 231.1379, 203.1432, 189.1275, 175.1120, and 147.0807, respectively. Similarly, peak 4 generated fragment ions like (M + H-H2O)+, (M + H-H2O-CO)+, (M + H-H2O-CO-C2H4)+, and (M + H-H2O-CO-C3H6)+ at m/z 215.1431, 187.1485, 159.1171, and 145.1013, respectively. Moreover, peak 12 exhibited comparable fragmentation patterns in line with peaks 3 and 4. Therefore, they were putatively identified as atractylenolide I, II and III, respectively (Figure 8).
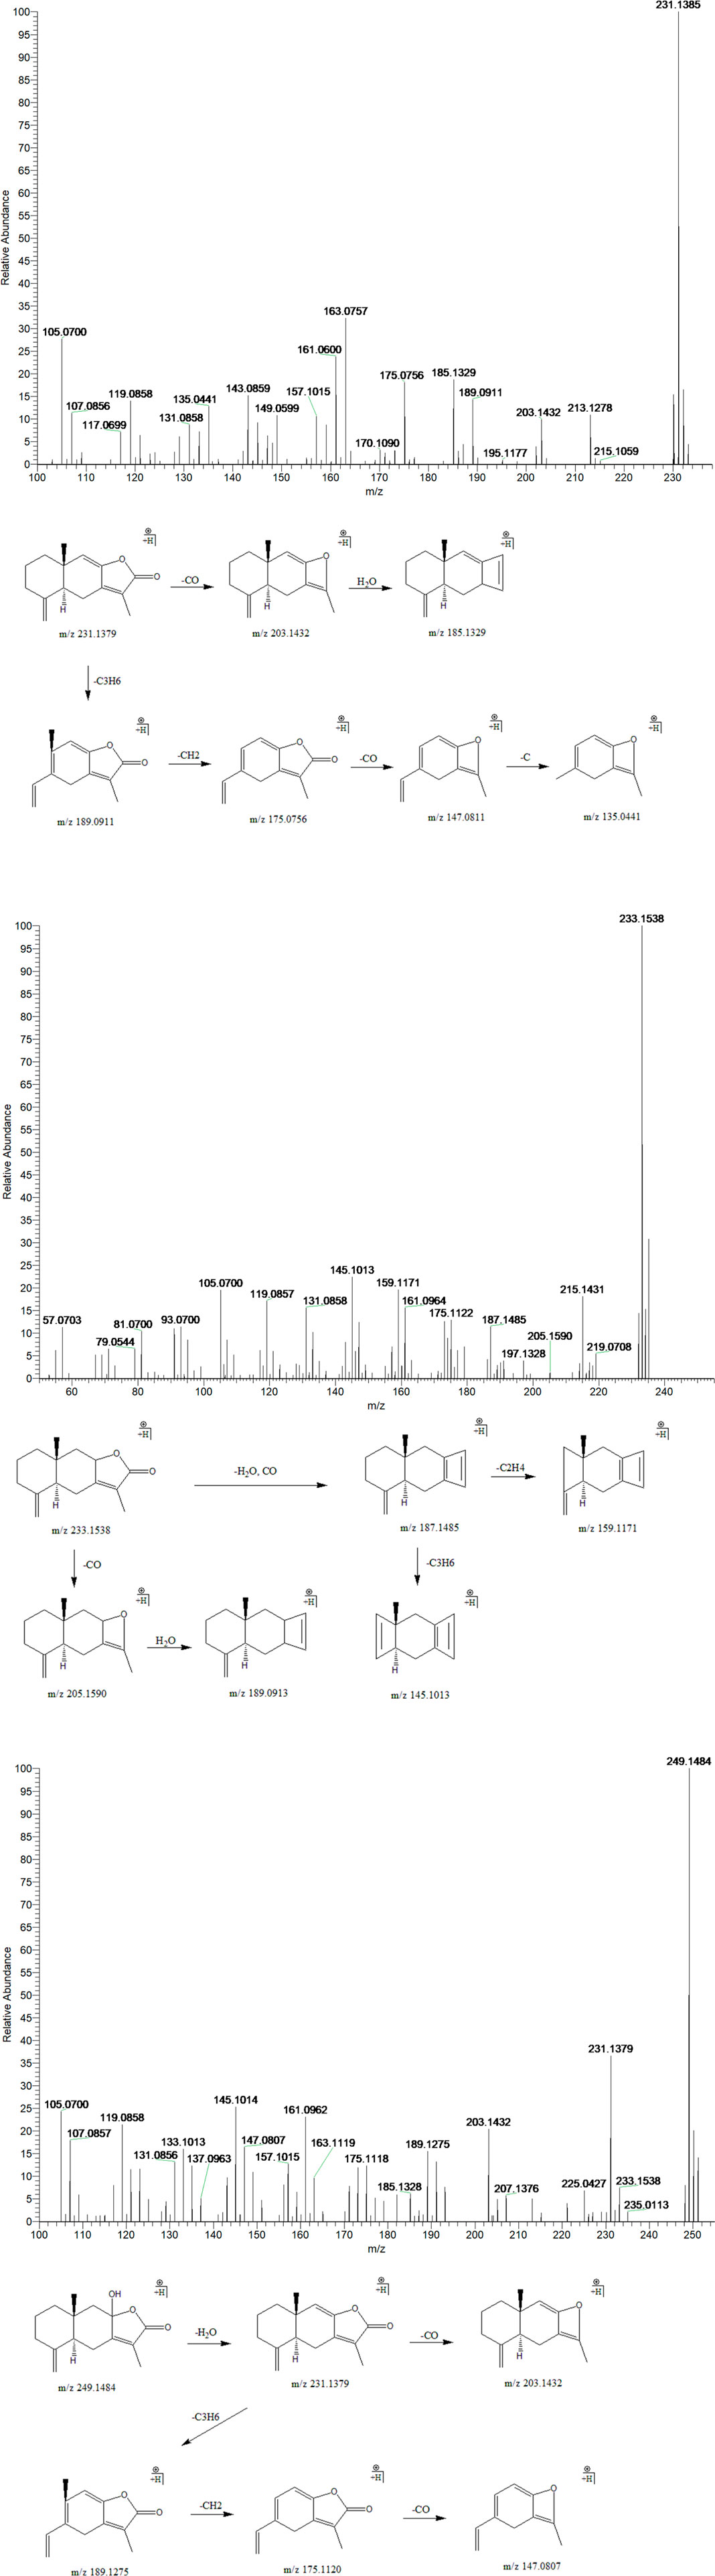
FIGURE 8. The second-order mass spectrometry graphs and proposed fragmentation pathways of atractylenolide I, II, and III (peaks 3, 4, and 12).
3.4 Results of Quantitative Analysis
The quantitative analysis of alisol A, alisol A 24-acetate, and alisol B in the ethanol extract of ZXD was performed using validated UPLC-Q-TRAP-MS/MS methods. The three constituents’ contents were determined using their respective calibration curves. As a result, the alisol A, alisol A 24-acetate, and alisol B concentrations in ZXD were determined to be 1.5506, 0.4276, and 1.7571 mg/g, respectively (raw plant equivalent).
3.5 Results of the Pharmacokinetic Study
Drug-containing plasma samples collected in pre-dose and eleven different time points precisely; 20 min, 40 min, 1.5, 2, 3, 4.5, 6, 8, 10, 12, and 24 h were analyzed using UPLC-Q-TRAP-MS/MS to obtain the pharmacokinetic profiles of alisol A, alisol A 24-acetate and alisol B (Figure 9). GraphPad Prism software was used to visualize the mean plasma concentration-time curves. The time following administration was plotted on the X-axis, and the blood concentrations of the three constitutions were plotted on the Y-axis. The pharmacokinetic parameters were listed in Table 7. The results suggested that alisol A and alisol 24-acetate had comparable profiles with a slow-release impact 12 h after administration, which may be explained by their similar structures. All three constitutions were absorbed well orally in rats, and the analysis assay was sensitive and precise.
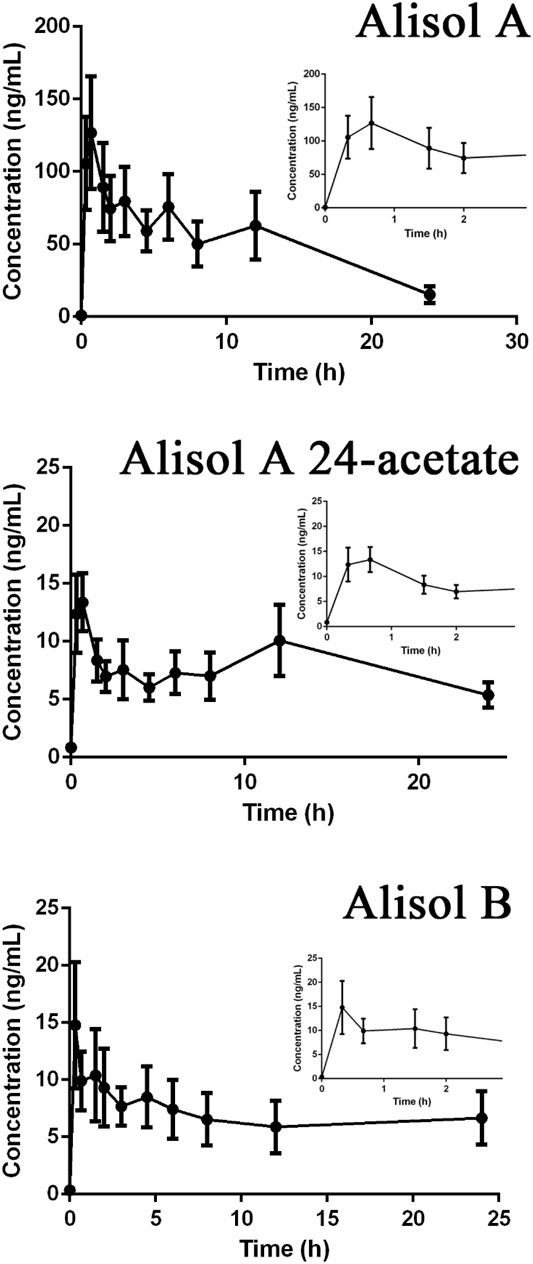
FIGURE 9. The pharmacokinetic profiles of alisol A, alisol A 24-acetate, and alisol B.

TABLE 7. The pharmacokinetic parameters of animals administered ZXD at a single dose of 750 mg/kg.
4 Conclusion
In summary, rapid, sensitive, and accurate methods were successfully developed for qualitative and quantitative analysis of the ethanolic extract of ZXD. Twenty-five chemical constituents of ZXD were putatively identified in plasma using UHPLC-QE-Orbitrap-MS, three of them were further quantified and pharmacokinetically studied using UHPLC-Q-TRAP-MS/MS. Alisol A, alisol A 24-acetate, and alisol B were present in ZXD at concentrations of 1.5506, 0.4276, and 1.7571 mg/g (raw plant equivalent), respectively, and their pharmacokinetic profiles were presented. Our study will establish a theoretical base for future research and clinical applications of ZXD.
Data Availability Statement
The original contributions presented in the study are included in the article/Supplementary Material, further inquiries can be directed to the corresponding author.
Author Contributions
YS provided the way of thinking. YS, JW, and SZ designed the framework. JW, SZ, and HR conducted the qualitative analysis. JW and FZ conducted the quantitative analysis. Pharmacokinetic study was performed by JW, FZ, and HX. HR and HX is responsible for the using of software. ZL, WJ, and WW investigated the background of the present study and were responsible for supervision. YS and JX was responsible for review. WW provided us with technical support. JW and wrote the manuscript, which was edited by SZ.
Funding
This work was financially supported by the CAMS Innovation Fund for Medical Sciences (CIFMS) (Grant Nos. 2016-I2M-1–012). JW and SZ contributed equally to this work.
Conflict of Interest
SZ was employed by Mudanjiang Youbo Pharmceutical Co., Ltd.
The remaining authors declare that the research was conducted in the absence of any commercial or financial relationships that could be construed as a potential conflict of interest.
Publisher’s Note
All claims expressed in this article are solely those of the authors and do not necessarily represent those of their affiliated organizations, or those of the publisher, the editors and the reviewers. Any product that may be evaluated in this article, or claim that may be made by its manufacturer, is not guaranteed or endorsed by the publisher.
Acknowledgments
We would like to thank Ran Du (Metabolomics platform at Agricultural Genomics Institute at Shenzhen, Chinese Academy of Agricultural Sciences) for providing AB SCIEX QTRAP 5500 system.
Supplementary Material
The Supplementary Material for this article can be found online at: https://www.frontiersin.org/articles/10.3389/fchem.2022.815886/full#supplementary-material
References
Bi, X., Wang, P., Ma, Q., Han, L., Wang, X., Mu, Y., et al. (2017). Anti-Inflammatory Activities and Liver Protection of Alisol F and 25-Anhydroalisol F through the Inhibition of MAPK, STAT3, and NF-Κb Activation In Vitro and In Vivo. Molecules 22 (6), 951. doi:10.3390/molecules22060951
Chang, X., Li, Z., Wu, J., Jin, W., and Shi, Y. (2021). Identification of the Triterpenoids in the Extracts of ZeXie Decoction and Investigation of Their Effects on Nonalcoholic Fatty Liver. Prog. Mod. Biomed. 21, 1–12. doi:10.13241/j.cnki.pmb.2021.01.001
Chao, C.-L., Huang, H.-C., Lin, H.-C., Chang, T.-C., and Chang, W.-L. (2016). Sesquiterpenes from BaiZhu Stimulate Glucose Uptake by Activating AMPK and PI3K. Am. J. Chin. Med. 44 (5), 963–979. doi:10.1142/S0192415X16500531
Chen, Y., Yang, W., Guo, L., Wu, X., Zhang, T., Liu, J., et al. (2016). Atractylodes Lactone Compounds Inhibit Platelet Activation. Platelets 28 (2), 194–202. doi:10.1080/09537104.2016.1209477
Xu, F., Lu, C., Wu, Q., Gu, W., Chen, J., Fang, F., et al. (2018). Studies on the Lipid-Regulating Mechanism of Alisol-Based Compounds on Lipoprotein Lipase. Bioorg. Chem. 80, 347–360. doi:10.1016/j.bioorg.2018.07.001
Ho, C., Gao, Y., Zheng, D., Liu, Y., Shan, S., Fang, B., et al. (2019). Alisol A Attenuates High‐fat‐diet‐induced Obesity and Metabolic Disorders via the AMPK/ACC/SREBP‐1c Pathway. J. Cel Mol Med 23, 5108–5118. doi:10.1111/jcmm.14380
Kanno, Y., Yatsu, T., Yamashita, N., Zhao, S., Li, W., Imai, M., et al. (2017). Alisol B 23-acetate from the Rhizomes of Alisma Orientale Is a Natural Agonist of the Human Pregnane X Receptor. Phytomedicine 26, 22–27. doi:10.1016/j.phymed.2017.01.003
Li, X., Wang, X., Huang, X., Wu, T. T., Xu, W., and Wu, S. S. (2016). Development of a Cell-Based Peroxisome Proliferator-Activated receptors(PPARs) Screening Model and its Application for Evaluation of Triterpenoids Isolate from Alismatis Rhizoma. Cjcmm 21 (41), 4015–4022. doi:10.4268/cjcmm20162121
Li, S., Wang, L., Du, Z., Jin, S., Song, C., Jia, S., et al. (2019). Identification of the Lipid-Lowering Component of Triterpenes from Alismatis Rhizoma Based on the MRM-Based Characteristic Chemical Profiles and Support Vector Machine Model. Anal. Bioanal. Chem. 411, 3257–3268. doi:10.1007/s00216-019-01818-x
Liu, X., Li, S.-L., Zhou, Y., Song, J.-Z., Zheng, Y.-F., Peng, G.-P., et al. (2010). Characterization of Protostane Triterpenoids inAlisma Orientalisby Ultra-performance Liquid Chromatography Coupled with Quadrupole Time-Of-Flight Mass Spectrometry. Rapid Commun. Mass. Spectrom. 24, 1514–1522. doi:10.1002/rcm.4548
Yang, N., Dong, Y. Q., Wu, M. F., Li, S. Z., Yu, H. X., and Yang, S. S. (2020). Establishing a Rapid Classification and Identification Method for the Major Triterpenoids of Alisma Orientale. Phytochem. Anal. 31, 384–394. doi:10.1002/pca.2907
Yang, P., Qin, Y., Zhu, Y., Li, F., Xia, S.-s., Zhou, B., et al. (2020). Chaihu-Longgu-Muli Decoction Relieves Epileptic Symptoms by Improving Autophagy in Hippocampal Neurons. J. Ethnopharmacology 259, 112990. doi:10.1016/j.jep.2020.112990
Song, C., Huang, X., Lu, K., Peng, M., Yu, S., and Fang, N. (2014). The Rationality of the Hypolipidemic Effect of Alismatis Rhizoma Decoction, a Classical Chinese Medicine Formula in High-Fat Diet-Induced Hyperlipidemic Mice. Iran J. Pharm. Res. 13, 641–649. doi:10.2515/therapie/2013071
Song, Y., Wang, H., Pan, Y., and Liu, T. (2019). Investigating the Multi-Target Pharmacological Mechanism of Hedyotis Diffusa Willd Acting on Prostate Cancer: A Network Pharmacology Approach. Biomolecules 9, 591. doi:10.3390/biom9100591
Tang, W., Gao, Y., Yang, C., Liu, B., Wang, Y., Liu, F., et al. (2021). Establishment of UPLC Fingerprint of Zexie Decoction Which Is a Classical Herbal Formula. Chin. J. Mod. Appl. Pharm. 6, 680–687. doi:10.13748/j.cnki.issn1007-7693.2021.06.008
Tao, Y., Huang, S., Yan, J., and Cai, B. (2019). Pharmacokinetic Study of Six Triterpenoids of Raw and Processed Alisma Plantago-Aquatica in Rat Plasma by Using Ultra Performance Liquid Chromatography-Tandem Mass Spectrometry Approach. J. Chromatogr. B 1124, 323–330. doi:10.1016/j.jchromb.2019.06.026
Wu, J., Chang, X., Li, Z., Jin, W., and Shi, Y. (2021a). Research Progress on Molecular Mechanism of Lipid-Lowering and Anti-inflammatory Effect of Zexietang. Chin. J. Exp. Traditional Med. Formulae 27, 224–232. doi:10.13422/j.cnki.syfjx.20210236
Wu, J., Zhang, F., Ruan, H., Chang, X., Wang, J., Li, Z., et al. (2021b). Integrating Network Pharmacology and RT-qPCR Analysis to Investigate the Mechanisms Underlying ZeXie Decoction-Mediated Treatment of Non-alcoholic Fatty Liver Disease. Front. Pharmacol. 12, 722016. doi:10.3389/fphar.2021.722016
Xia, H., Liu, J., Yang, W., Liu, M., Luo, Y., Yang, Z., et al. (2021). Integrated Strategy of Network Pharmacological Prediction and Experimental Validation Elucidate Possible Mechanism of Bu-Yang Herbs in Treating Postmenopausal Osteoporosis via ESR1. Front. Pharmacol. 12, 1–15. doi:10.3389/fphar.2021.654714
Xu, X., Niu, L., Liu, Y., Pang, M., Lu, W., Xia, C., et al. (2020). Study on the Mechanism of Gegen Qinlian Decoction for Treating Type II Diabetes Mellitus by Integrating Network Pharmacology and Pharmacological Evaluation. J. Ethnopharmacology 262, 113129–129. doi:10.1016/j.jep.2020.113129
Xue, X., Chen, T., Wei, W., Zhou, X., Lin, Z., and Chen, L. (2014). Effects of Alisma Decoction on Lipid Metabolism and Inflammatory Response Are Mediated through the Activation of the LXRα Pathway in Macrophage-Derived Foam Cells. Int. J. Mol. Med. 33, 971–977. doi:10.3892/ijmm.2014.1646
Ying, Y., Wan, H., Zhao, X., Yu, L., He, Y., and Jin, W. (2020). Pharmacokinetic-Pharmacodynamic Modeling of the Antioxidant Activity of Quzhou Fructus Aurantii Decoction in a Rat Model of Hyperlipidemia. Biomed. Pharmacother. 131, 110646. doi:10.1016/j.biopha.2020.110646
Zeng, L., Tang, W., Yin, J., Feng, L., Li, Y., Yao, X., et al. (2016). Alisol A 24-acetate Prevents Hepatic Steatosis and Metabolic Disorders in HepG2 Cells. Cell Physiol Biochem 40, 453–464. doi:10.1159/000452560
Zhang, Y., Bo, C., Fan, Y., An, R., Chen, L., Zhang, Y., et al. (2018). Qualitative and Quantitative Determination of Atractylodes Rhizome Using Ultra‐performance Liquid Chromatography Coupled with Linear Ion Trap-Orbitrap Mass Spectrometry with Data‐dependent Processing. Biomed. Chromatogr. 33, e4443. doi:10.1002/bmc.4443
Keywords: qualitative analysis, quantitative analysis, pharmacokinetic study, zexie decoction, alisol
Citation: Wu J, Zheng S, Zhang F, Ruan H, Xue H, Wang J, Li Z, Jin W, Wang W, Xia J and Shi Y (2022) Qualitative Analysis of Drug-Containing Plasma and its Application to Quantitative Analysis and Pharmacokinetic Study of Zexie Decoction Using UPLC-MS/MS. Front. Chem. 10:815886. doi: 10.3389/fchem.2022.815886
Received: 16 November 2021; Accepted: 25 January 2022;
Published: 22 February 2022.
Edited by:
Shusheng Zhang, Linyi University, ChinaReviewed by:
Camilla Montesano, Sapienza University of Rome, ItalyYi Tao, Zhejiang University of Technology, China
Copyright © 2022 Wu, Zheng, Zhang, Ruan, Xue, Wang, Li, Jin, Wang, Xia and Shi. This is an open-access article distributed under the terms of the Creative Commons Attribution License (CC BY). The use, distribution or reproduction in other forums is permitted, provided the original author(s) and the copyright owner(s) are credited and that the original publication in this journal is cited, in accordance with accepted academic practice. No use, distribution or reproduction is permitted which does not comply with these terms.
*Correspondence: Yue Shi, shiyue1029@126.com
†These authors have contributed equally to this work