Vapor–Liquid Equilibrium Study of LiBr + H2O and LiBr + CaCl2 + H2O Systems
 Huinan Wang
  Xianzhen Xu
- Laboratory of Fiber Materials and Modern Textile, Shandong Sino-Japanese Center for Collaborative Research of Carbon Nanomaterials, Collaborative Innovation Center for Marine Biomass Fiber Materials and Textiles, College of Chemistry and Chemical Engineering, Qingdao University, Qingdao, China
Vapor–liquid equilibrium (VLE) data and modeling for LiBr + H2O and LiBr + CaCl2 + H2O are reported in this paper. This work focuses on the experimental determination of the boiling point of LiBr + H2O and LiBr + CaCl2 + H2O solutions with vapor pressures between 6 and 101.3 kPa and the total molality of salt ranging from 0 to 21.05 mol•kg−1. The procedures were carried out in a computer-controlled glass apparatus. The relationship between the boiling point and saturated vapor pressure is obtained, and Xu's model is used to correlate and predict the VLE. By correlation of the data (literature and experimental) for LiBr + H2O and LiBr + CaCl2 + H2O, the parameters are obtained. We compared the results with the ElecNRTL model and Pitzer model. The parameters for the LiBr + H2O, CaCl2 + H2O, and LiBr + CaCl2 + H2O systems can be successfully used to calculate and predict the VLE data.
Introduction
The vapor–liquid equilibrium (VLE) of electrolyte sol utions is widely used in industries, natural processes, chemistry, and chemical engineering. LiCl, LiBr, and CaCl2 aqueous solutions have extensive applications in the field of refrigeration, cooling, and heat transforming systems based on absorption cycles (Lan et al., 2017; Li et al., 2017). Simultaneously, the thermodynamic properties of the solutions play a key role in the absorption cycles.
Due to the strong demand for absorption and separation process design, an increasing number of researchers have studied the VLE of electrolyte systems. Massive quantities of phase equilibrium data have been reported in recent years. Some solubility isotherms of the LiCl + CaCl2 + H2O system have been measured (Filippov and Mikhelson, 1977; Zeng et al., 2008), and VLE data of LiCl + H2O, CaCl2 + H2O, and LiCl + CaCl2 + H2O systems have been obtained (Xu et al., 2014, 2019a). Lan et al. (2017) and N'Tsoukpoe et al. (2013) experimentally determined the saturated vapor pressure of LiBr aqueous solution with mass fractions ranging from 43.14 to 65.26 wt.% at high temperature. Chua et al. (2000) presented a thermodynamically consistent set of specific enthalpy, entropy, and heat capacity fields for a LiBr + H2O solution. However, the phase equilibrium data of the systems containing LiBr with a wide range of pressures and temperatures are still rare.
The experimental data and thermodynamic models are equally important (Xu et al., 2019b). Significant improvements have been made in calculating thermodynamic properties using theoretical models; most models are based on the Wilson model (Wilson, 1964), NRTL model (Renon and Prausnitz, 1968), and UNIQUAC model (Abrams and Prausnitz, 1975). For electrolyte solutions, the Pitzer model (Pitzer, 1973), ElecNRTL model (Chen et al., 1982; Chen and Evans, 1986), Lu–Maurer model (Lu and Maurer, 1993; Lu et al., 1996), extended UNIQUAC model (Thomsen et al., 1998), and Xu model (Xu et al., 2016, 2019c) have been widely utilized. The thermodynamic properties of the binary systems (CaCl2 + H2O and LiCl + H2O) were simulated by the Pitzer–Simonson–Clegg (PSC) model in Li's work (Li et al., 2015, 2016). Patek and Klomfar (2006) developed an effective formulation of the thermodynamic properties of LiBr–H2O solutions from 273 to 500 K. Despite the aforementioned research works, thermodynamic property calculations for some electrolyte systems still face great challenges, and more accurate models over a wide range of pressures, temperatures, and concentrations are needed.
Due to the lack of VLE data for systems containing LiBr at a wide range of pressures and temperatures, in this work, VLE data of LiBr + H2O and LiBr + CaCl2 + H2O systems are experimentally measured at concentrations ranging from 0 to 21.05 mol•kg−1 and pressures ranging from 6 to 101.3 kPa. In addition, the obtained data are used to parameterize Xu's model (Xu et al., 2016). We expand the scope of the model, such as concentration, pressure, and temperature. Correlation and prediction of the VLE of LiBr + H2O and LiBr + CaCl2 + H2O were successfully developed.
Experimental Section
Materials
Anhydrous LiBr (purity ≥ 99.5%) and anhydrous CaCl2 (purity ≥ 99.99%) were purchased from Adamas-Beta. Distilled water (18.2 Ω cm) was used for the preparation of solutions.
Apparatus and Procedures
A dual circulation glass ebulliometer (40 ml) was used in the VLE measurements, as shown in Figure 1. The main experimental instruments are listed in Table 1, including a vacuum pump in the ebulliometer, a pressure controller, a heating mantle, and a temperature controller.
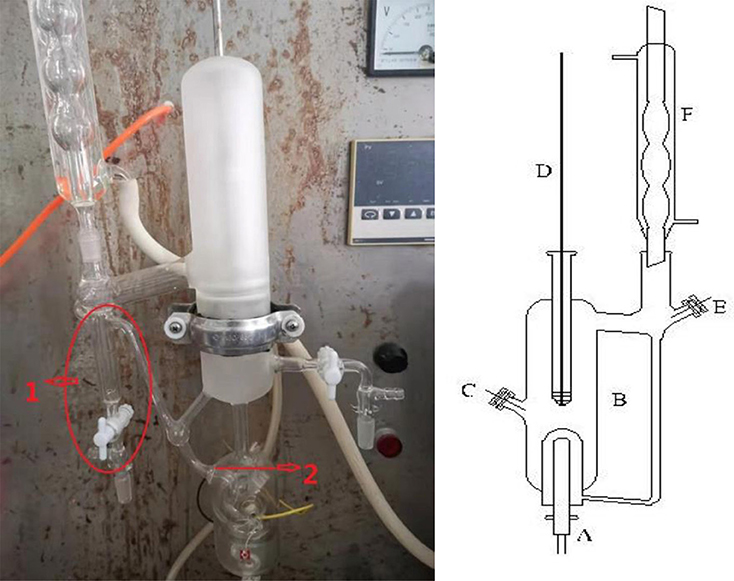
Figure 1. A dual circulation glass ebulliometer.
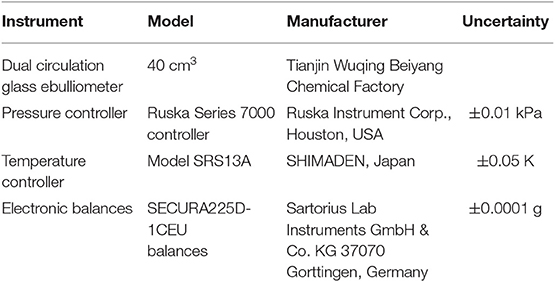
Table 1. The main experimental instruments.
The reliability of the experiment has been verified in the literature (Xu et al., 2014, 2019a) (i.e., CaCl2 + H2O and NaCl + KCl + H2O), as shown in Figure 2. The experimental data for the LiBr + H2O and LiBr + CaCl2 + H2O systems at different molalities are listed in Tables 2–6. Each VLE experimental data in this work are averages taken after three experiments. For the systems containing LiBr, the solubility of the salt is relatively high, with a value of 21.05 mol•kg−1 at 298.15 K. The absorption is relatively strong at higher salt concentrations. The pressure (6–101.3 kPa) is an important factor for the design of absorption and separation processes.
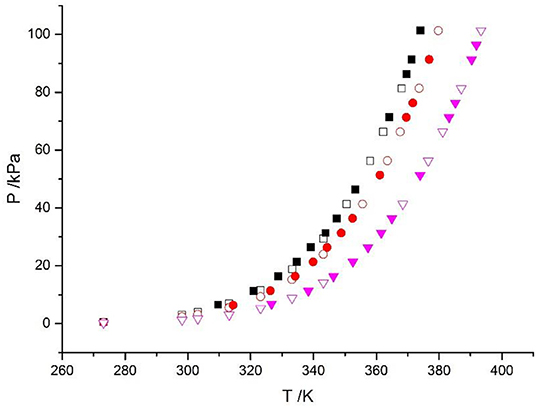
Figure 2. Vapor-liquid equilibrium in the CaCl2 + H2O system. Empty symbols ( , m = 1 mol/kg;
  , m = 3 mol/kg;
  , m = 6 mol/kg): literature data (Xu et al., 2014, 2016; Lan et al., 2017); full symbols (
 , m = 1 mol/kg;
  , m = 3 mol/kg;
  , m = 6 mol/kg): experimental data (Xu et al., 2014).
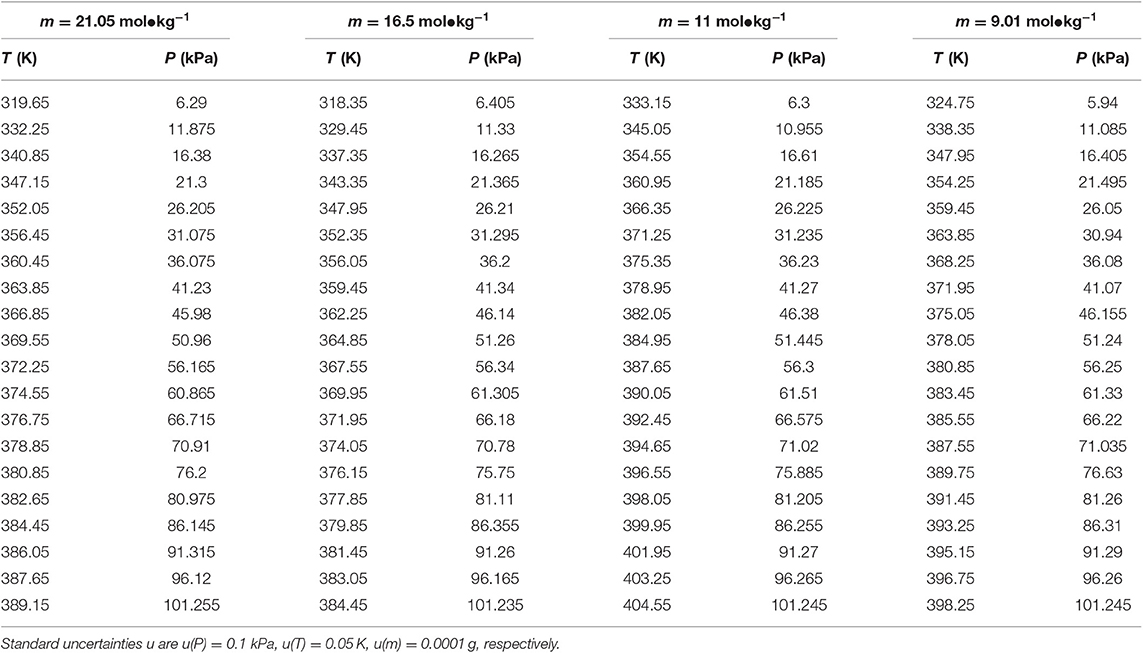
Table 2. Experimental VLE data for temperature T, pressure P, and molality m—LiBr for the LiBr + H2O system.
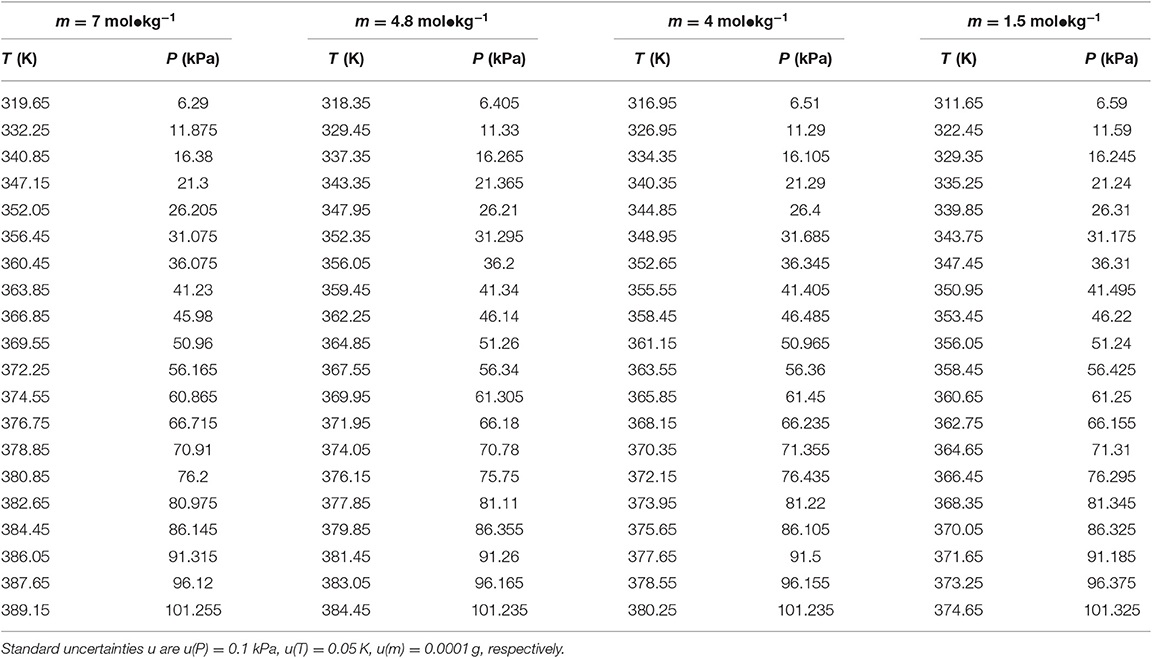
Table 3. Experimental VLE data for temperature T, pressure P, and molality m—LiBr for the LiBr + H2O system.
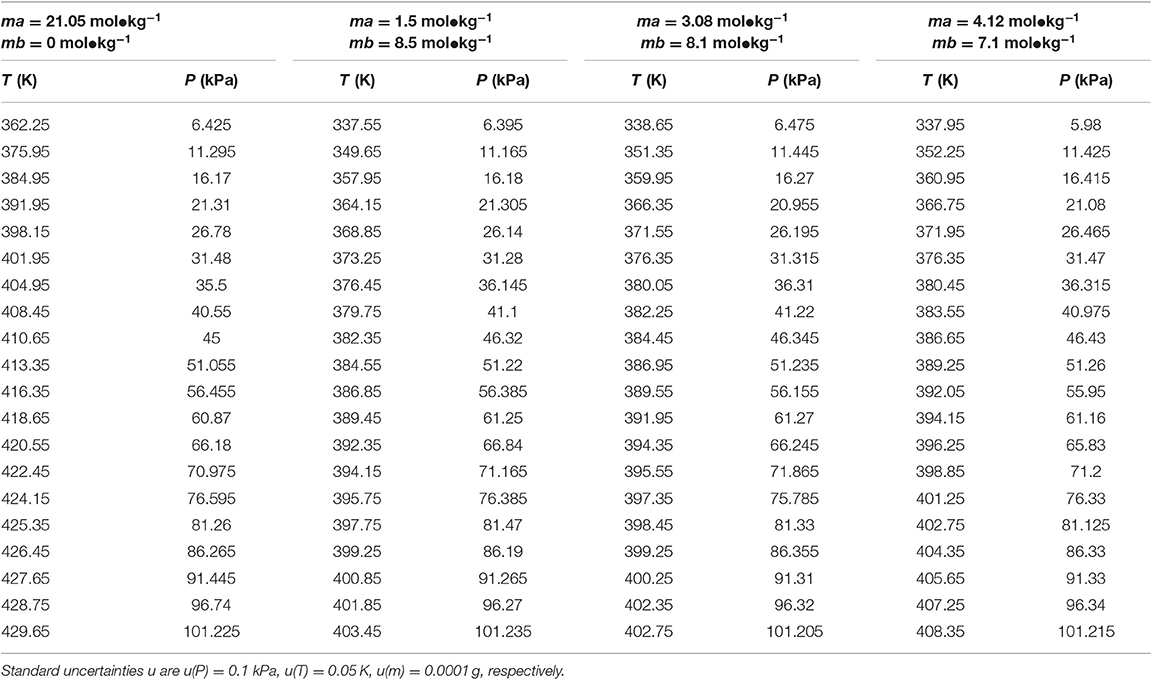
Table 4. Experimental VLE data for temperature T, pressure P, and molality m (ma—LiBr, mb—CaCl2) for the LiBr + CaCl2 + H2O system.
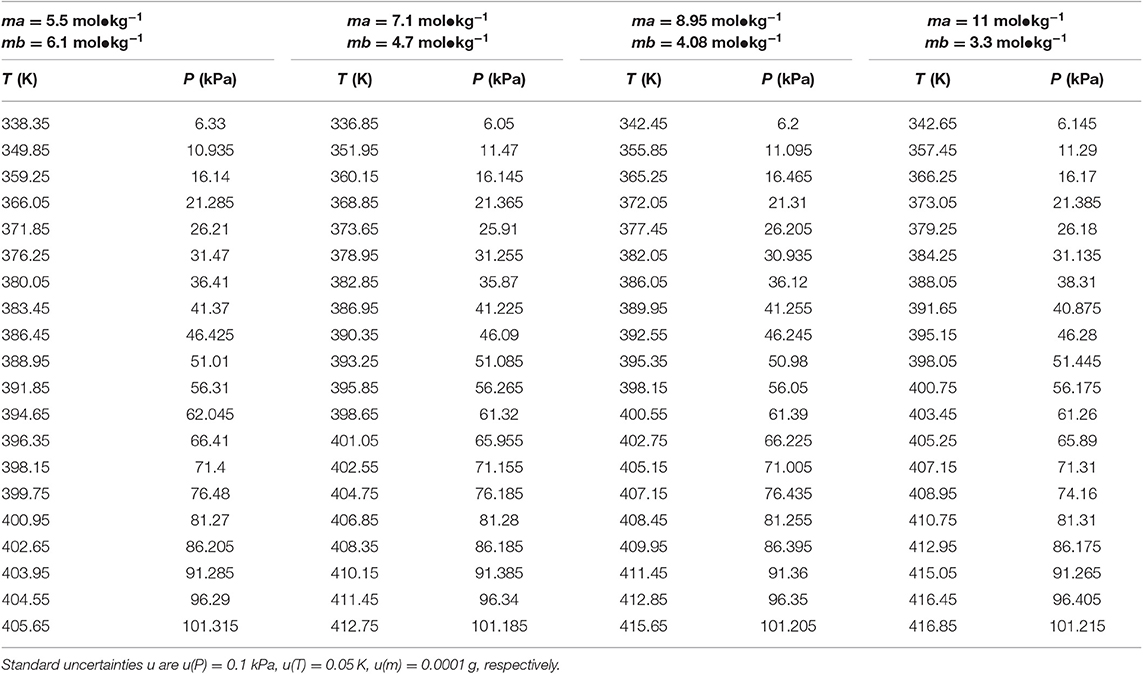
Table 5. Experimental VLE data for temperature T, pressure P, and molality m (ma—LiBr, mb—CaCl2) for the LiBr + CaCl2 + H2O system.
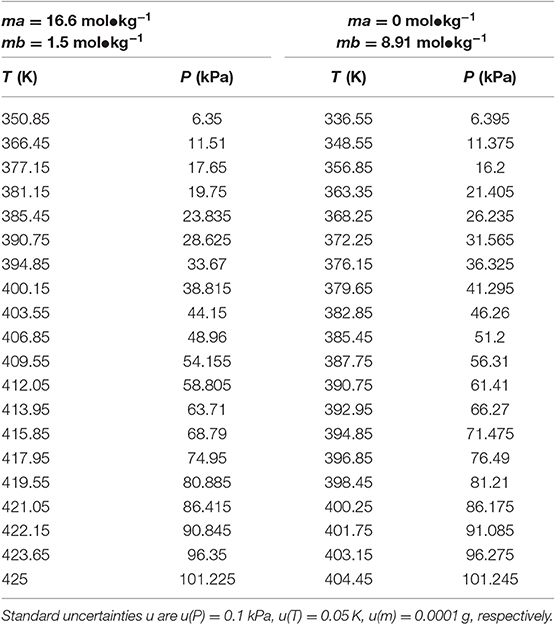
Table 6. Experimental VLE data for temperature T, pressure P, and molality m (ma—LiBr, mb—CaCl2) for the LiBr + CaCl2 + H2O system.
The experimental procedures are as follows: (1) During the experiments, the sample was placed into the glass ebulliometer. When we were ready to add the sample into the ebulliometer, we filled the sample solution in the part marked 1 in Figure 1. Because of the problem of water condensation, if the part was not filled with the sample solution, the experimental results would have a large error. The sample should be added to the height of mark 2 shown in Figure 1. (2) The ebulliometer was heated by the heating mantle and was controlled by the voltage controller. (3) The operation pressure was controlled by the vacuum pump, the pressure sensor, and the control valve. (4) After the sample was added, we turned on the heater and controlled the heating voltage. Then, we stably controlled the pressure in the ebulliometer through the pressure controller. (5) The vapor H2O was condensed in a spherical condenser (length 40 cm) and then returned to the mixing chamber for recirculation. The time was 0.5–1 h in the first equilibrium, and the following equilibrium time was 10–20 min. The judging standard of the VLE is an important factor. The condensate reflux of the ebulliometer was controlled at two to three drops per second and was stably refluxed for ~15 min to establish an equilibrium state. (6) After the VLE was reached, we recorded the temperature and pressure.
Model Description
Xu Model
In the Xu model (Xu et al., 2016) for mixed electrolyte solution systems, the equation was based on the NRTL model:
The final equation can be written as:
In this model, Equation (9) is the final objective function. Five parameters (h, , , , and ) need to be calculated in the equation. Experimental data (Tables 2–6) and the data in the literature (Xu et al., 2014, 2016) were used for correlation. τw,i and τi,w are related to the temperature, and the temperature range is between 298.15 and 440.15 K.
The physical meaning of parameters (n, mx, mi, mw, hi, nt, Ms, τw,x, τx,w, τw,i, and τi,w) in this model is shown in the NOMENCLATURE. In this model, the reference state of activity coefficients is γi → 1 as xi(=ni/nt) → 1. Five parameters (h, , , , and ) were fitted to the VLE data for the LiBr + CaCl2 + H2O system in the final equations. The 1stOpt 7.0 (7D-Soft High Technology Inc.) optimization software was chosen as the main tool for simulation calculations.
Results and Discussion
In this work, the VLE data of the LiBr + H2O and LiBr + CaCl2 + H2O systems were experimentally measured at concentrations ranging from 0 to 21.05 mol•kg−1 and pressures ranging from 6 to 101.3 kPa; the data are listed in Tables 2–6. Analysis and summary of the experimental data are shown in Figures 3, 4.
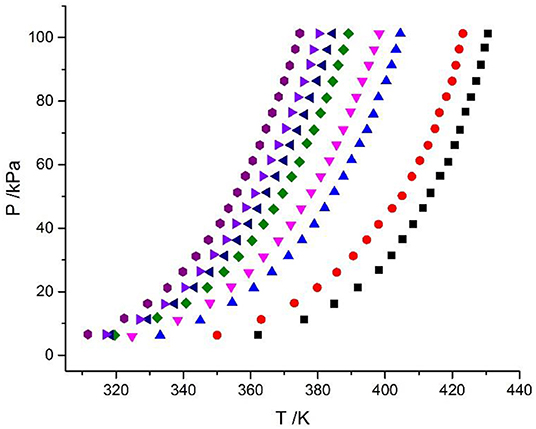
Figure 3. Vapor–liquid equilibrium in the LiBr + H2O system. Full symbols (, m = 21.05 mol/kg; , m = 16.5 mol/kg;  , m = 11 mol/kg; , m = 9 mol/kg;
  , m = 7 mol/kg;
  , m = 5.5 mol/kg;
  , m = 4 mol/kg;
  , m = 3 mol/kg): experimental data.
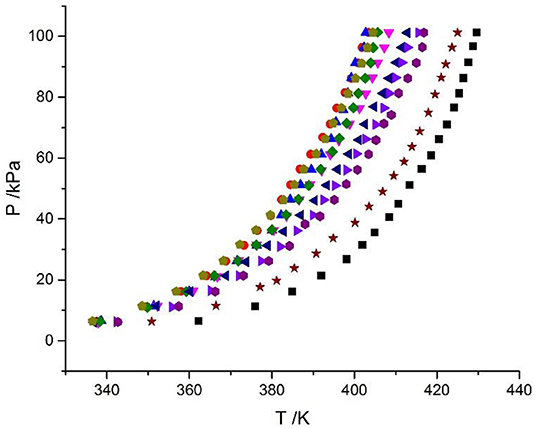
Figure 4. Experimental VLE data for the LiBr + CaCl2 + H2O system. Symbols (, ma = 21.05 mol/kg, mb = 0 mol/kg; , ma = 1.5 mol/kg, mb = 8.5 mol/kg; , ma = 3.08 mol/kg, mb = 8.1 mol/kg; , ma = 4.12 mol/kg, mb = 7.1 mol/kg; , ma = 5.5 mol/kg, mb = 6.1 mol/kg; , ma = 7.1 mol/kg, mb = 4.7 mol/kg; , ma = 8.95 mol/kg, mb = 4.08 mol/kg; , ma = 11 mol/kg, mb = 3.3 mol/kg;  , ma = 16.5 mol/kg, mb = 1.5 mol/kg;
  , ma = 0 mol/kg, mb = 8.91 mol/kg): experimental data (this work).
For the study of the activity coefficient model for electrolyte solutions, we usually choose the activity coefficient of the molality concentration standard. Thus, we only need to study the activity data of water in the electrolyte solutions (Chen et al., 1982; Chen and Evans, 1986; Xu et al., 2014). The Xu model was used to correlate and predict the VLE for the LiBr + H2O and LiBr + CaCl2 + H2O systems. The applicable system of the model was extended in this work. The correlation and prediction results were used to compare the Pitzer model (Pitzer, 1973), ElecNRTL model (Chen et al., 1982; Chen and Evans, 1986), and Xu model, and the VLE behavior of the LiBr + CaCl2 + H2O system was investigated.
Discussion of Experimental Results
The LiBr + H2O and LiBr + CaCl2 + H2O systems were chosen to study the VLE, as shown in Tables 2–6 and Figures 3, 4. The tables and figures show that the VLE of LiBr + H2O and LiBr + CaCl2 + H2O are similar. It is well-known that as the salt concentration increases in the LiBr + H2O and LiBr + CaCl2 + H2O systems, the vapor pressure of water decreases. From Tables 2–6 and Figures 3, 4, we can see that the vapor pressure at mLiBr = 21.05 mol•kg−1 and mCaCl2 = 0 mol•kg−1 in the LiBr + CaCl2 + H2O system is lowest, and the activity at the corresponding temperature is lowest.
The VLE of the CaCl2 + H2O, LiBr + H2O, LiBr + CaCl2 + H2O, and LiCl + CaCl2 + H2O systems are shown in Figures 4, 5. From the figures, it can be known that the LiBr + H2O curve at saturated solubility (m = 21.05 mol•kg−1) and normal temperature is lower than that of CaCl2 + H2O, LiBr + CaCl2 + H2O, and LiCl + CaCl2 + H2O. The LiBr + CaCl2 + H2O curve at the same concentration and temperature is lower than that of LiCl + CaCl2 + H2O. Therefore, the hygroscopicity of some systems containing LiBr is also relatively high, and the hygroscopicity of the LiBr + H2O system at saturated solubility (m = 21.05 mol•kg−1) is the highest.
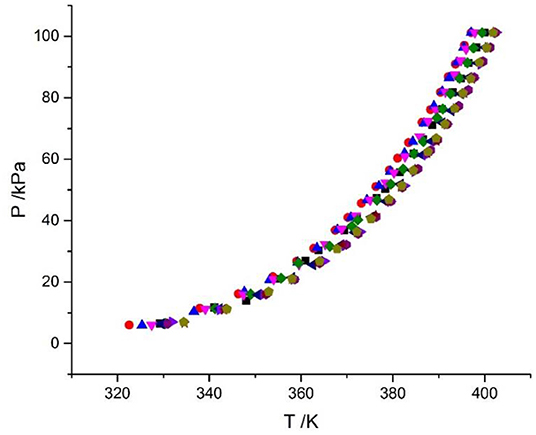
Figure 5. VLE data for the LiCl + CaCl2 + H2O system (Xu et al., 2019a). Symbols (, ma = 20.08 mol/kg, mb = 0 mol/kg; , ma = 15.63 mol/kg, mb = 1.3 mol/kg; , ma = 10.4 mol/kg, mb = 3.14 mol/kg; , ma = 8.83 mol/kg, mb = 4.07 mol/kg; , ma = 7.46 mol/kg, mb = 4.68 mol/kg; , ma = 5.41 mol/kg, mb = 5.95 mol/kg; , ma = 3.73 mol/kg, mb = 6.73 mol/kg; , ma = 2.43 mol/kg, mb = 7.08 mol/kg; , ma = 1.66 mol/kg, mb = 7.14 mol/kg; , ma = 0 mol/kg, mb = 7.72 mol/kg).
Results of the Modeling
Correlation of the VLE
Equation (9) was used to correlate VLE data for the LiBr + H2O and LiBr + CaCl2 + H2O systems. The results of the correlation for the LiBr + CaCl2 + H2O system are shown in Figure 6. The deviation between the literature and the calculated values for the LiBr + H2O, CaCl2 + H2O, and LiBr + CaCl2 + H2O systems are listed in Table 8. Parameters, , , , , , , , , , , , , h1, and h2were obtained from the correlation of the experimental and literature data, as listed in Table 7. For LiBr + CaCl2 + H2O, it can be seen from Table 8 that dY = 0.31 kPa and dP = 2.55%. dY and dP were calculated via the following equations:
where N denotes the number of data points, and Pexp and Pcal denote experimental vapor pressure and calculated vapor pressure, respectively.
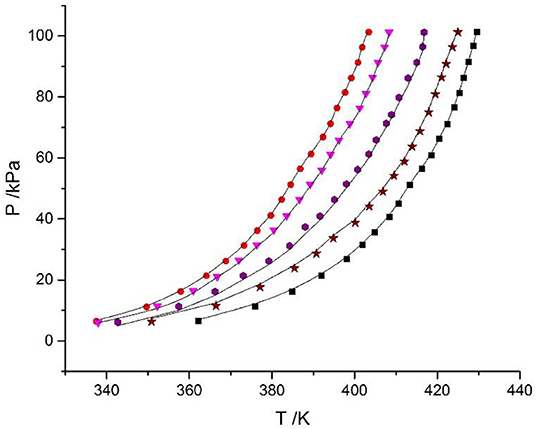
Figure 6. Correlation of experimental VLE data for the LiBr + CaCl2 + H2O system. Symbols (, ma = 21.05 mol/kg, mb = 0 mol/kg; , ma = 1.5 mol/kg, mb = 8.5 mol/kg; , ma = 4.12 mol/kg, mb = 7.1 mol/kg; , ma = 11 mol/kg, mb = 3.3 mol/kg; , ma = 16.5 mol/kg, mb = 1.5 mol/kg): experimental data (this work); lines: correlation of the model.
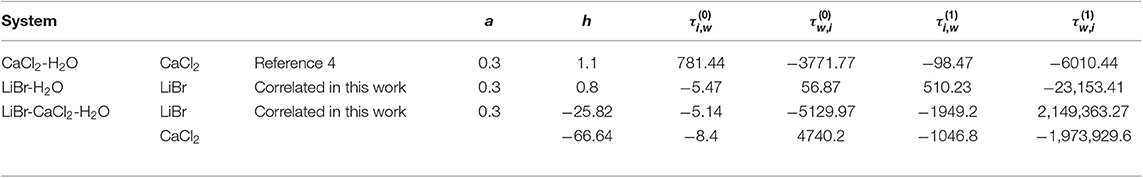
Table 7. Model parameters for the CaCl2-H2O, LiBr-H2O, and LiBr-CaCl2-H2O systems.
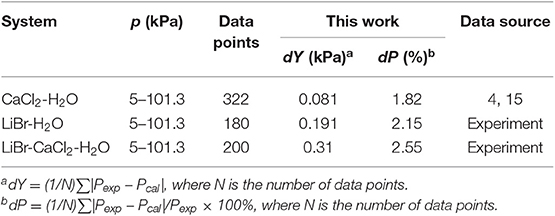
Table 8. Correlation results of VLE data.
Prediction of the VLE
The Xu model was chosen to correlate and predict the VLE. In previous work, the model was also successfully applied to predict the VLE data in mixed electrolyte solution systems with binary parameters (Xu et al., 2016). However, the parameters of LiBr are lacking. The prediction parameters of CaCl2 were obtained from the literature (Xu et al., 2019a), the parameters of LiBr were calculated using LiBr + H2O experimental data in this work, as listed in Table 7. The prediction result is shown in Figure 7, where dY = 3.1 kPa and dP = 5.96%, which are worse than the correlation results.
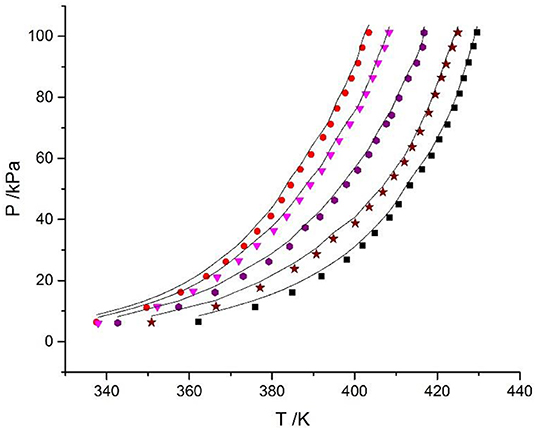
Figure 7. Prediction of experimental VLE data for the LiBr + CaCl2 + H2O system. Symbols (, ma = 21.05 mol/kg, mb = 0 mol/kg; , ma = 1.5 mol/kg, mb = 8.5 mol/kg; , ma = 4.12 mol/kg, mb = 7.1 mol/kg; , ma = 11 mol/kg, mb = 3.3 mol/kg; , ma = 16.5 mol/kg, mb = 1.5 mol/kg): experimental data (this work); lines: prediction of the model.
Comparison With Other Methods
For the LiBr + CaCl2 + H2O system calculation, we choose the ElecNRTL model and Pitzer model for comparison with this work. The Pitzer equation for the thermodynamic properties of electrolytes is developed on the basis of theoretical insights from improved analysis of the Debye-Huckel model. The system of equations developed in the first paper of this series is successfully applied to the available free energy data at room temperature for 227 pure aqueous electrolytes in which one or both ions are univalent. The ElecNRTL model proposed by Chen et al. (1982) is generalized to represent the excess Gibbs energy of aqueous multicomponent electrolyte systems. Using only binary parameters, the model correlates and predicts the deviation from ideality of aqueous multicomponent electrolyte systems over the entire range of temperatures and concentrations. The comparison results are shown in Table 9. Note that the results from both the ElecNRTL and Pitzer models were calculated by the software Aspen Plus 8.1 (Xu et al., 2019a).
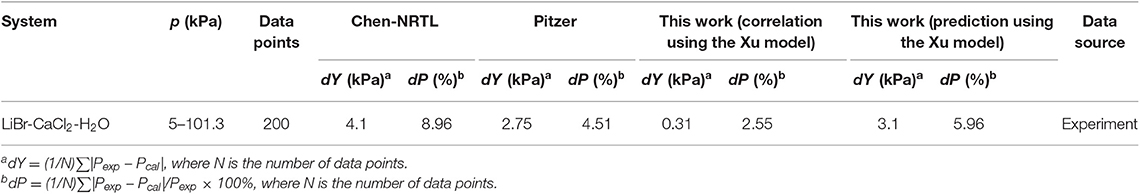
Table 9. Comparison of models for the electrolyte solutions.
For the LiBr + CaCl2 + H2O system, the dY value (0.31 kPa) of this work (correlation) using the Xu model is smaller than that of the ElecNRTL model (dY = 4.1 kPa) and Pitzer model (dY = 2.75 kPa). Likewise, the dP value (2.55%) of this work (correlation) is smaller than that of the ElecNRTL model (dP = 8.96%) and Pitzer model (dP = 4.51%).
In this work, we expand the scope of the model based on previous work (Xu et al., 2014, 2019a). The parameters of the LiBr + H2O system were obtained in this paper. Then, the binary parameters of LiBr + H2O and CaCl2 + H2O were used to predict the VLE for the LiBr + CaCl2 + H2O system. However, the results are not satisfactory. Therefore, we recommend using the correlated parameters of LiBr + CaCl2 + H2O in Table 8 to calculate the VLE.
Conclusions
In this paper, VLE data for LiBr + H2O and LiBr + CaCl2 + H2O systems were measured and reported. By the analysis, it is shown that the type and concentration of salt are important factors affecting the VLE. The VLE curve of the LiBr + H2O system at saturated solubility (m = 21.05 mol•kg−1) and 25°C is lower than that of CaCl2 + H2O, LiBr + CaCl2 + H2O, and LiCl + CaCl2 + H2O. The hygroscopicity of some systems containing LiBr is also relatively high, and the hygroscopicity of the LiBr + H2O system at saturated solubility (m = 21.05 mol•kg−1) is the highest.
By correlation of the experimental data, the parameters of the LiBr + H2O and LiBr + CaCl2 + H2O systems were obtained in this paper. The correlation results and prediction results were compared to those of the ElecNRTL and Pitzer model. By comparison, the correlation results of the LiBr + CaCl2 + H2O system in this work are better than those of the ElecNRTL and Pitzer models. The model can be used to successfully calculate VLE data for LiBr + H2O and LiBr + CaCl2 + H2O systems.
Data Availability Statement
All datasets generated for this study are included in the article/supplementary material.
Author Contributions
HW: experimental design and data processing. HC: experimental design and experimental equipment assembly. WC: experimental operation and data processing. HS: data processing and modeling. XX: overall planning of the article and modeling.
Funding
This work was supported by the National Natural Science Foundation of China (no. 21703115).
Conflict of Interest
The authors declare that the research was conducted in the absence of any commercial or financial relationships that could be construed as a potential conflict of interest.
References
Abrams, D. S., and Prausnitz, J. M. (1975). Statistical thermodynamics of liquid mixtures: a new expression for the excess Gibbs energy of partly or completely miscible systems. AIChE J. 21, 116–128. doi: 10.1002/aic.690210115
Chen, C. C., Britt, H. I., Boston, J., and Evans, L. (1982). Local composition model for excess Gibbs energy of electrolyte systems. Part I: Single solvent, single completely dissociated electrolyte systems. AIChE J. 28, 588–596. doi: 10.1002/aic.690280410
Chen, C. C., and Evans, L. B. (1986). A local composition model for the excess Gibbs energy of aqueous electrolyte systems. AIChE J. 32, 444–454. doi: 10.1002/aic.690320311
Chua, H., Toh, H., Malek, A., Ng, K., and Srinivasan, K. (2000). Improved thermodynamic property fields of LiBr–H2O solution. Int. J. Refrig. 23, 412–429. doi: 10.1016/S0140-7007(99)00076-6
Filippov, V., and Mikhelson, K. (1977). A thermodynamic study of the system LiCl-CaCl2-H2O at 25 and 35 C. Zh. Neorg. Khim. 22, 1689–1694.
Lan, Z., Ma, X., Hao, Z., and Jiang, R. (2017). Experiments on saturated vapor pressure of aqueous lithium bromide solution at high temperatures. Int. J. Refrig. 76, 73–83. doi: 10.1016/j.ijrefrig.2016.11.025
Li, D., Li, S., Meng, L., Deng, T., and Guo, Y. (2017). Solid–liquid phase equilibria of ternary systems LiCl–LiBr–H2O and CaCl2-CaBr2-H2O at 288.15 K. J. Chem. Eng. Data 62, 833–838. doi: 10.1021/acs.jced.6b00855
Li, D., Zeng, D., Han, H., Guo, L., Yin, X., and Yao, Y. (2015). Phase diagrams and thermochemical modeling of salt lake brine systems. I. LiCl + H2O system. Calphad 51, 1–12. doi: 10.1016/j.calphad.2015.05.001
Li, D., Zeng, D., Yin, X., Han, H., Guo, L., and Yao, Y. (2016). Phase diagrams and thermochemical modeling of salt lake brine systems. II. NaCl + H2O, KCl + H2O, MgCl2 + H2O and CaCl2 + H2O systems. Calphad 53, 78–89. doi: 10.1016/j.calphad.2016.03.007
Lu, X., Zhang, L., Wang, Y., Shi, J., and Maurer, G. (1996). Prediction of activity coefficients of electrolytes in aqueous solutions at high temperatures. Ind. Eng. Chem. Res. 35, 1777–1784. doi: 10.1021/ie950474k
Lu, X. H., and Maurer, G. (1993). Model for describing activity coefficients in mixed electrolyte aqueous solutions. AIChE J. 39, 1527–1538. doi: 10.1002/aic.690390912
N'Tsoukpoe, K., Le Pierrès, N., and Luo, L. (2013). Experimentation of a LiBr–H2O absorption process for long-term solar thermal storage: prototype design and first results. Energy 53, 179–198. doi: 10.1016/j.energy.2013.02.023
Patek, J., and Klomfar, J. (2006). A computationally effective formulation of the thermodynamic properties of LiBr–H2O solutions from 273 to 500 K over full composition range. Int. J. Refrig. 29, 566–578. doi: 10.1016/j.ijrefrig.2005.10.007
Pitzer, K. S. (1973). Thermodynamics of electrolytes. I. Theoretical basis and general equations. J. Phys. Chem. 77, 268–277. doi: 10.1021/j100621a026
Renon, H., and Prausnitz, J. M. (1968). Local compositions in thermodynamic excess functions for liquid mixtures. AIChE J. 14, 135–144. doi: 10.1002/aic.690140124
Thomsen, K., Rasmussen, P., and Gani, R. (1998). Simulation and optimization of fractional crystallization processes. Chem. Eng. Sci. 53, 1551–1564. doi: 10.1016/S0009-2509(97)00447-8
Wilson, G. M. (1964). Vapor-liquid equilibrium. XI. A new expression for the excess free energy of mixing. J. Am. Chem. Soc. 86, 127–130. doi: 10.1021/ja01056a002
Xu, X., Cao, D., Liu, J., Gao, J., and Wang, X. (2019c). Research on ultrasound-assisted demulsification/dehydration for crude oil. Ultrason. Sonochem. 57, 185–192. doi: 10.1016/j.ultsonch.2019.05.024
Xu, X., Gu, X., Wang, Z., Shatner, W., and Wang, Z. (2019b). Progress, challenges and solutions of research on photosynthetic carbon sequestration efficiency of microalgae. Renew. Sustain. Energy Rev. 110, 65–82. doi: 10.1016/j.rser.2019.04.050
Xu, X., Hu, Y., Wang, X., and Wu, L. (2016). Experimental and modeling of vapor–liquid equilibria for mixed electrolyte solution systems. J. Chem. Eng. Data 61, 2311–2320. doi: 10.1021/acs.jced.5b01028
Xu, X., Hu, Y., Wu, L., and Zhang, S. (2014). Experimental and modeling of vapor–liquid equilibria for electrolyte solution systems. J. Chem. Eng. Data 59, 3741–3748. doi: 10.1021/je500623w
Xu, X., Wang, Y., Sun, X., and Zhou, Y. (2019a). Vapor–liquid equilibria study of the LiCl + CaCl2 + H2O System. ACS Omega 4, 4390–4396. doi: 10.1021/acsomega.8b03570
Zeng, D., Xu, W., Voigt, W., and Xia, Y. (2008). Thermodynamic study of the system (LiCl + CaCl + HO). J. Chem. Thermodynamics 40, 1157–1165. doi: 10.1016/j.jct.2008.02.010
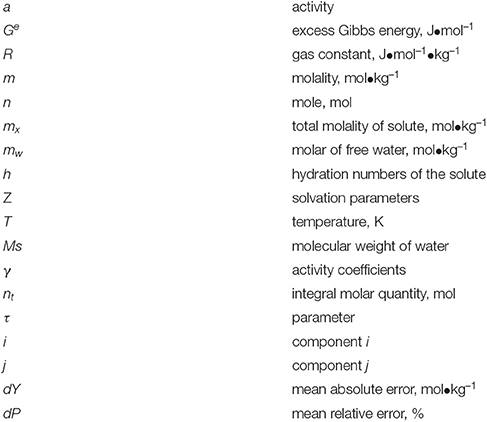
Nomenclature
Keywords: electrolyte solution, vapor–liquid equilibrium (VLE), measurement, modeling, thermodynamics
Citation: Wang H, Chen H, Chen W, Sun H and Xu X (2020) Vapor–Liquid Equilibrium Study of LiBr + H2O and LiBr + CaCl2 + H2O Systems. Front. Chem. 7:890. doi: 10.3389/fchem.2019.00890
Received: 30 October 2019; Accepted: 10 December 2019;
Published: 23 January 2020.
Edited by:
Ramesh L. Gardas, Indian Institute of Technology Madras, IndiaReviewed by:
Jun Gao, Shandong University of Science and Technology, ChinaAndres Mejia, University of Concepcion, Chile
Copyright © 2020 Wang, Chen, Chen, Sun and Xu. This is an open-access article distributed under the terms of the Creative Commons Attribution License (CC BY). The use, distribution or reproduction in other forums is permitted, provided the original author(s) and the copyright owner(s) are credited and that the original publication in this journal is cited, in accordance with accepted academic practice. No use, distribution or reproduction is permitted which does not comply with these terms.
*Correspondence: Xianzhen Xu, xuxianzhen@qdu.edu.cn