A Bioelectrochemical System for Waste Degradation and Energy Recovery From Industrial Coffee Wastewater
 Lina María Agudelo-Escobar
 Santiago Erazo Cabrera
 Claudio Avignone Rossa
- 1Biotransformation Research Group, School of Microbiology, University of Antioquia, Medellín, Colombia
- 2Department of Microbial Sciences, School of Biosciences and Medicine, University of Surrey, Guilford, United Kingdom
The primary production of coffee involves the extensive use of water resources, since it is not only used for irrigation of coffee plantations, but it is also required in large volumes for the processing of the coffee berry to obtain high quality green beans. It is calculated that for every kg of dry coffee grain produced, up to 40 L of water are consumed, and its disposal represents a significant environmental problem, since most coffee growers are small producers with no access to efficient technologies for wastewater treatment. This situation leads to these liquid wastes to be discarded untreated in natural water sources, generating environmental pollution and public health problems. Bioelectrochemical Systems (BES) have been proposed as an alternative to conventional wastewater treatments, either as a primary bioremediation strategy or for secondary wastewater treatment systems. Among BES, microbial fuel cells (MFCs) are designed to exploit the metabolic capability of andophilic microorganisms to degrade the organic matter present in the waste. Anodophilic microorganisms use electrodes as terminal electron acceptors, generating a flow of electrons that can be used in the generation of electricity. In this work, we evaluated the ability of native microbial communities to degrade the organic matter present in wastewater from the coffee agroindustry and its electrogenic potential for the co-generation of electricity was evaluated using an MFC device developed by the authors. Wastewater samples obtained at different stages of the coffee wet process were used as inoculum and feedstocks. The system was operated in fed-batch, in both open and closed-circuit conditions, for 60 days. The degree of decontamination or bioremediation of the wastewater was assessed by measurements of physicochemical parameters. For the characterization of the native microbial community, microscopic and molecular techniques were used and the electrogenic potential was established by assessing the electrochemical performance of the system. With the proposed bioelectrochemical system, a reduction of up to 70% of the initial content of organic matter of the residual water from the coffee benefit was achieved, and open circuit voltages of up to 400 mV were recorded, comparable to those reported for conventional air breathing cathode MFC.
1 Introduction
By the year 2020, the global coffee market was USD 102.02 billion and an annual growth of 4.28% is estimated for the period between 2021–2026. Europe, North America and Asia are recognized as the main importing and consuming markets for coffee (Voora et al., 2020). Brazil ranks as the world’s leading producer, with an estimated production of 56.4 million 60-kg sacks of green coffee, followed by Vietnam, Colombia, and Indonesia, countries that present ideal climate and environmental conditions for cultivation of this crop. In most coffee-producing countries, the primary production of “washed soft coffees” involves the use of the traditional wet processing method, resulting in large amounts of wastewater with high organic-content. This causes a severe negative environmental impact in the ecosystem of coffee farming areas, due to the large amount of lixiviates, drainage of pulp, and mucilage disposed onto the environment without treatment (Dankowska et al., 2017; Campos et al., 2021). These coffee wastes have a deleterious effect on the hydrographic basins around the coffee farms, resulting in severe contamination of soil and aquatic ecosystems as well as causing an increase in the transmission of waterborne illnesses (Didanna, 2014; Rodriguez et al., 2015).
The potential implementation of bioelectrochemical systems (BES) to reduce wastewater contamination and generate electricity represents an invaluable opportunity for small coffee farmers. BES technology is suitable in this case due to the high organic content in coffee waste and the possibility of bio-prospection of coffee-associated microbial communities. Chemical Oxygen Demand (COD) values between 13.0 and 29.5 g/L in coffee wastewater have been reported (Said et al., 2020; Campos et al., 2021), indicative of the need for efficient treatment processes. Leveraging and adding value to the coffee agroindustrial waste has a high impact from the environmental, social, and economic points of view. Reducing the polluting load of the residues by treatment in microbial fuel cells would generate environmental benefits in the coffee farming areas, lowering the high COD levels in the water systems and soils around the coffee production sites. The goal of this research was the evaluation of the bioelectrochemical performance of a native microbial community for the degradation of wastewater from the coffee agroindustry and the production of bioelectricity in a microbial fuel cell (MFC) prototype developed by the authors (unpublished data). We analyzed the characteristics and properties of the native communities in terms of their capacity to degrade the residues, and evaluated the degree of degradation achieved and the bioelectricity generated during the operation of the MFC using the native microbial community. This research is aligned with the existing global challenges of sustainable development. It includes aspects related to clean water and sanitation, affordable and clean energy, responsible consumption and production, life below water, life, and land and climate action.
2 Materials and Methods
2.1 Microorganisms and Medium
Wastewater samples and native microbial communities from an agroindustrial coffee environment were obtained at one of the Coffee Processing Centers located in Andes, in the southwestern region of the Department of Antioquia, Colombia. Andes is located at 75°52′43.57″ W; 5°29′31.96″ N, at an atlitude of 1,360 m above sea level. The climate in Andes is classified as Tropical rainforest (Köppen climate classification Af), with high mean annual temperatures, small temperature ranges, very humid and wet, with rains throughout the year.
The scheme in Figure 1 depicts the various stages involved in wet coffee processing. In this process, coffee cherries are subjected to an initial washing process to remove particulate matter and dirt (Stage 1). In Stage 2, they are subjected to the pulping process, in which the cherry seed (the bean) is released from the husk and pulp. The husk and pulp free bean is subjected to a fermentation process (Stage 3) to remove the mucilage layer. After this phase, the mucilage-free coffee bean is undergoes a drying step to obtain the dry bean (green coffee), the final product of the process. Solid pulp and husk waste are stored under cover for later use in other composting applications or for disposal. During this storage period, leachates are generated that are accumulated in a tank (Stage 4). Finally, the wastewater generated in each stage is collected and taken to the wastewater treatment plant. The points along the wet processing coffee method selected for collection of wastewater samples were: 1 Coffee cherry washing water; 2 Pulping water; 3 Fermentation tank water; 4 Leachate tank water; 5 Mixed water inlet to the water treatment plant. The samples were processed and stored under two different conditions. Water samples used as inocula of the microbial fuel cells were cryopreserved at −80°C. Water samples used as feedstock were stored either at 4°C or frozen at −20°C until use.
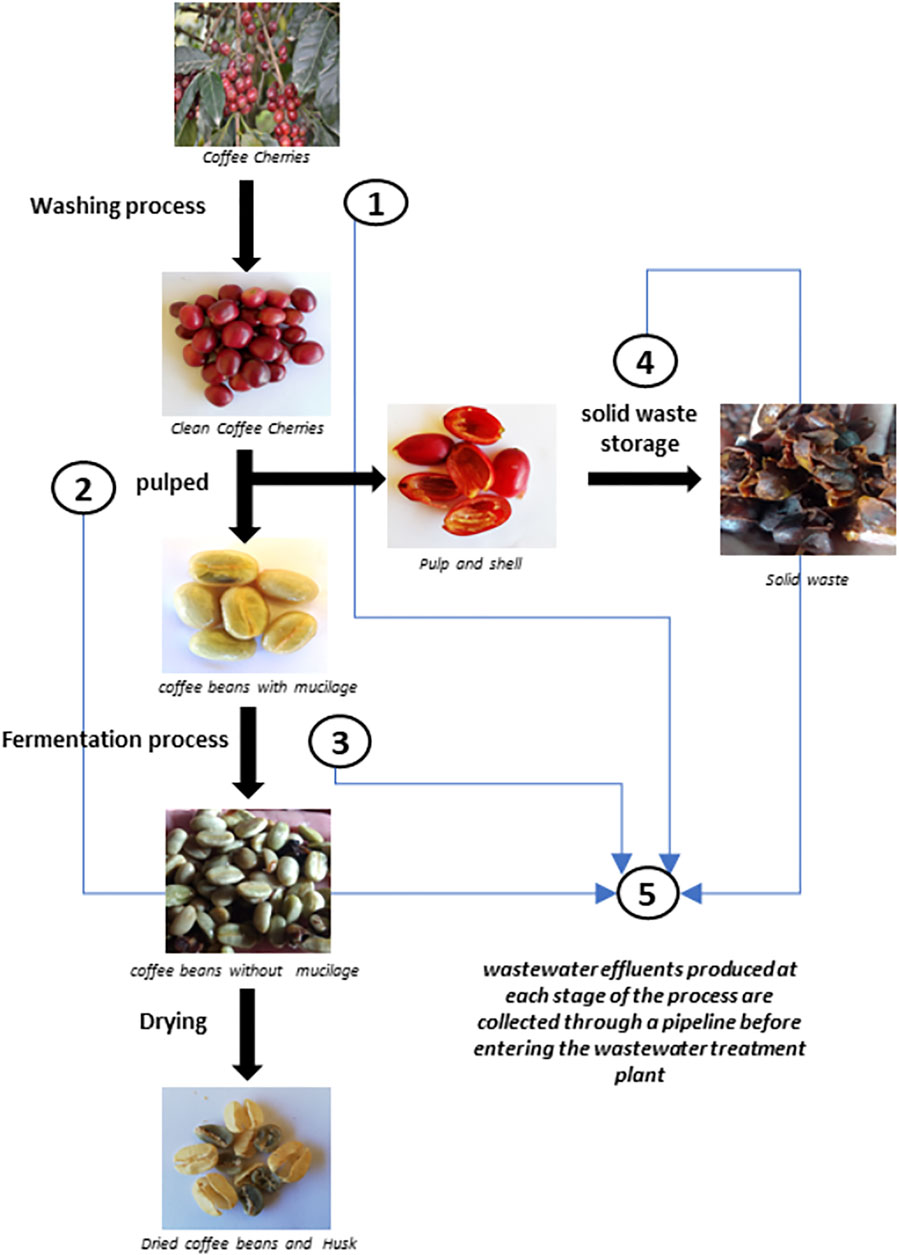
FIGURE 1. Schematic representation of the wet processing coffee method.
2.2 Bioelectrochemical System
2.2.1 Microbial Fuel Cells configuration
An air-breathing cathode MFC made of ABS polymeric material resistant to basic and acid chemical agents, with a 200 ml anodic chamber capacity was used in all the experiments. The cation exchange membrane used was a 5 mm thick earthenware plate (width: 40 mm; length: 70 mm). The anode was made of a carbon felt piece measuring 6.5 cm by 13.5 cm (projected anode area: 87.75 cm2). Titanium wire was used as electron collector with a length of 45.0 cm for the anode and 25.0 cm for the cathode. The assembled MFC was characterised before the start-up of the experiments, by ensuring and establishing suitable anaerobic conditions, operating volume, substrate supply, sampling procedure, and adequacy of sensors for monitoring and recording physicochemical and electrochemical properties. Figure 2 shows images of the MFC at diverse stages of the construction and operation.
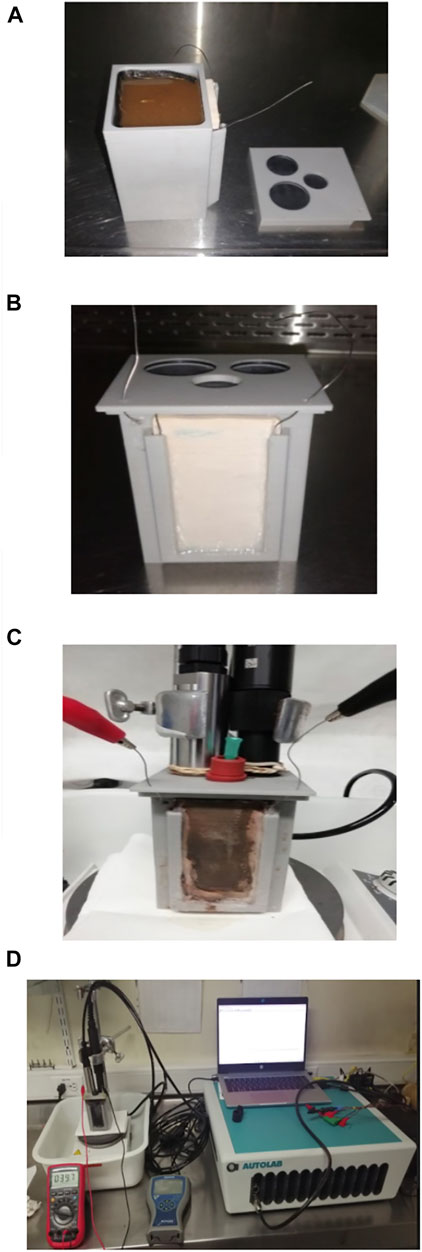
FIGURE 2. Prototype Microbial Fuel Cell made of polymer and with ceramic membrane. (A) Detail of MFC assembly with the anode chamber filled with fresh coffee wastewater used as feedstock. (B) Front view of MFC prototype assembly showing the ceramic membrane. (C) MFC assembly with sensors and probes adapted. (D) Detail of MFC set up.
2.2.2 Microbial Fuel Cells operation
The MFC was operated using as anodic feedstock the wastewater taken from different sampling points of the coffee processing plant. For the experimental setup MFC1, 170 ml of a 1:1 mixture of wastewater from leachate (sampling point 4) and fermentation (sampling point 3) were used. After open circuit operation for 58 days, the spent medium in the anode chamber was replaced with fresh wastewater mixture medium. The external circuit was closed with a 100 Ω resistance, and the system was operated for a further 37 days. During the entire operation, both in open and closed circuits, the liquid volume in the anodic chamber was maintained at a constant level by daily addition of medium to compensate for losses caused by evaporation or consumption of wastewater.
The acclimatised microbial community was used as inoculum for the study of the electrochemical performance of the microbial fuel cell (Experimental setup MFC2). 150 ml of the 1:1 mixture of fermentation wastewater and leachates were inoculated with 20 ml of the matured culture obtained in MFC1 and operated as open circuit system for 30 days. Subsequently, all the remaining liquid was replaced with 170 ml of fresh wastewater mixture. The external circuit was closed with a resistance of 100 Ω and the system was operated under these conditions for a further 30 days.
All experiments were carried out at an ambient temperature of 25°C and with magnetic stirring of 150 rpm to ensure good mixing. Liquid samples from the anode chamber were taken regularly to determine the concentration of organic matter, and samples from the anode were taken at the end of the open circuit stage of the MFC to evaluate the formation, evolution, and composition of the microbial community in the biofilm.
2.3 Chemical Analyses
The wastewater generated in the coffee wet process was analysed to determine the content of metals, phosphates, nitrogen, and organic matter, and using standardized quantification reference methods. For metals, SM 3030E, SM 30303F, and SM 3120B; for organic N, SM 4500B; for NH3, SM 4500 NH3B (Standard Methods for the Examination of Water and Wastewater, APHA/AWWA/WEF, 2012a). Organic matter content was analysed by the standard protocol SM 5220 D for the determination of COD in wastewater samples of agricultural origin (Standard Methods for the Examination of Water and Wastewater, APHA/AWWA/WEF, 2012b). The protocol was modified by performing a 1:50 dilution of a 1.5 ml sample volume in distilled water. 0.65 ml of the diluted solution were mixed with 0.39 ml of the COD digestion solution and 0.91 ml of sulfuric acid mixed with silver. The samples were placed in micro-COD digestion tubes and incubated in a Spectroquant TR 420 thermoreactor at 150°C for 120 min. After digestion, the content was transferred to quartz cuvettes and the optical density was read at 600 nm in a spectrophotometer (Thermo Spectronic Genesys 2, Thermo Fisher Scientific). COD was calculated using a standard COD concentration curve, using distilled water as a blank.
Operational parameters (temperature, pH, dissolved oxygen (DO), and redox potential) were monitored and recorded continuously by an automatic data acquisition system with a multimeter (ODEON Portable meter pH-Conductivity, AQUALABO, France).
2.4 Electrochemical Measurements
Cell voltage monitoring was performed using a digital multimeter (UNI-T UT61C, Uni-Trend, Czech Republic). The electric current was calculated using Ohm’s Law, I = V/R, where V is the voltage and R the external resistance. To determine the electrical power, equation p = V x I was used, and the volumetric power and current densities were calculated by dividing the values of Power and Current by the volume of the anode chamber. Polarization curves were obtained using external resistances between the range of 1–15,000 Ω, with an interval of 10 min between each resistance change to achieve the registration of a stable value.
2.5 Microbial Community Analysis
Anode samples of 0.25 cm2 were taken at the end of the open- and closed-circuit operations for analysis of the microbiological community. Samples of the biofilm were scraped off the carbon cloth using a sterile scalpel, and bacterial DNA was extracted using the GenElute Soil Extraction Kit. The molecular identification of the microorganisms present in the native community was carried out by Microbial amplicon sequencing-16S rRNA gene analysis of the V4 region with 515F and 806R primers. The analysis was carried out by Novogene Corporation (United Kingdom).
2.6 Electron Microscopy
Scanning electron microscopy (SEM) analyses were performed using a JEOL JSM 6490 LV electron microscope. The samples were fixed on a graphite tape, and coated with a thin gold coating of approximately 12.5 nm in a Denton Vacuum desk IV equipment. High resolution images were obtained by vacuum scanning electron microscope, and a secondary electron detector was used to analyse the morphology and topography of the samples. The analyses were carried out at the Advanced Microscopy Center (CAM) of the University of Antioquia.
3 Results and Discussion
3.1 Characterization of Coffee Wastewater
Wastewater resulting from the wet processing of coffee was analysed to determine the content of organic matter, ions, and other components. Table 1 shows the results of the analysis of samples taken from Sampling point 5 (see Figure 1) at two diferent times during the operation of the coffee wet process, labelled Sample 1 and Sample 2. The results of the analysis indicate the presence of nitrates, phosphates, iron, chromium, copper, potassium, zinc, magnesium, and sodium. These ions can act as co-factors for the development and evolution of microorganisms in the anodic chamber, and affect the electron transfer mechanisms in the MFC by changes in conductivity. Interestingly, Sample 1, and Sample 2 (obtained at different times during the process) present different concentrations of the measured components. This difference can be explained by the fact that coffee processing is not a standardized and controlled process, resulting in a highly variable composition. The amount of water used in the process depends on the initial load of processed coffee and operational conditions such as washing time, fermentation time, and pulp storage time for leachate decantation, among other variable conditions during the operation.
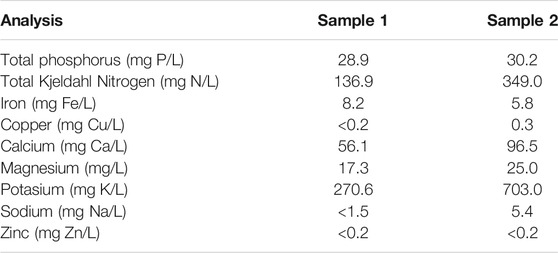
TABLE 1. Chemical characterization of coffee wet processing wastewater from Sampling point 5.
Table 2 shows the organic matter content, expressed as Chemical Oxygen Demand (COD), for the wastewater samples collected at different sampling points in the processing plant. The organic matter content of samples taken at early stages of the wet processing (sampling points 1 and 2, Washing and Pulped) show large differences in samples taken at different times (36.39 g/L for Sample 1 vs 19.51 g/L for Sample 2). The difference is smaller in samples taken from sampling points 2, 3, and 4, which show relatively similar values between Sample 1 and Sample 2.
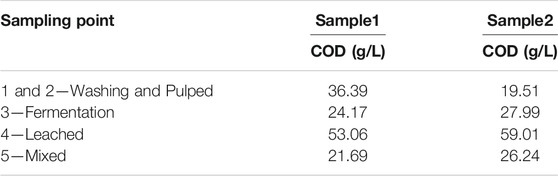
TABLE 2. COD analysis results of the wastewater samples from the Coffee Wet Processing Plant.
The degree of contamination varies depending on the stage of the process being sampled (See scheme in Figure 1). The COD results indicate that the wastewater with the highest organic load is originated in sampling point 4–Leached, with values of 53.06 g/L and 59.01 g/L for Sample 1 and Sample 2, respectively. Sampling point 4 collects the leachate obtained from the husk and pulp waste. Those leachates are collected in tanks and stored for periods ranging from 12 to 24 h before being transferred to its final disposal outside the coffee processing plant. For Sample 1, the wastewater identified as Sampling point 1-2 (Washing and Pulped) with a COD value of 36.39 g/L has a higher load of organic matter than the wastewater from the Sampling point 3 (Fermentation), with a COD of 24.17 g/L. However, in Sample 2, the Fermentation wastewater has a higher organic load than the wastewater from Washing and Pulped, with COD of 24.17 g/L and 19.51 g/L, respectively. Finally, these variations in the concentrations of organic matter have an effect on the final concentration of the wastewater from Sampling point 5 (Mixture), which collects the mixture of all the wastewater from the different wastewater generation points in the wet coffee processing process. The COD values determined were 21.69 g/L and 26.24 g/L, for Sample 1 and Sample 2, respectively.
For illustration, images of the solid waste heaps of shell and pulp, the leachate storage tank, and the water treatment plant are presented in the Supplementary Material.
3.2 Performance of the Microbial Fuel Cells
3.2.1 Electrochemical activity
As indicated in the Methods section, the performance of the MFCs was evaluated during 60 days. Fresh substrate was added to the MFCs to maintain a constant volume in the anodic chamber. On average, the daily volume added for the cell identified as MFC1 was 12 and 28 ml for the cell identified as MFC2. This difference may be related to the physical changes observed in the substrate, such as the formation of a dense layer on the surface of the medium (Figure 7A). This phenomenon has been observed in other systems associated to foaming (Yang et al., 2021), probably caused by the biochemical transformation of the substrate. As the microbial community develops and specializes, its metabolic activity increases achieving a greater and faster transformation of the substrate, producing an increase in the amount of biomass and by-products such as extracellular polymeric substances and CO2, which result in changes in the volume of the liquid substrate in the anode chamber. The evolution of pH, temperature, dissolved oxygen, and redox potential in MFC1 is presented in Figure 3. As it can be seen, all parameters remained stable during operation, except for the redox potential, which showed significant variations, without any clear trend during the entire operating time. The temperature remained constant, at an average value of approximately 25°C, and the pH showed some variations, but generally remained at a value of around 3.6. The concentration of dissolved oxygen was 0, indicating that the anode chamber remained anaerobic throughout the operation.
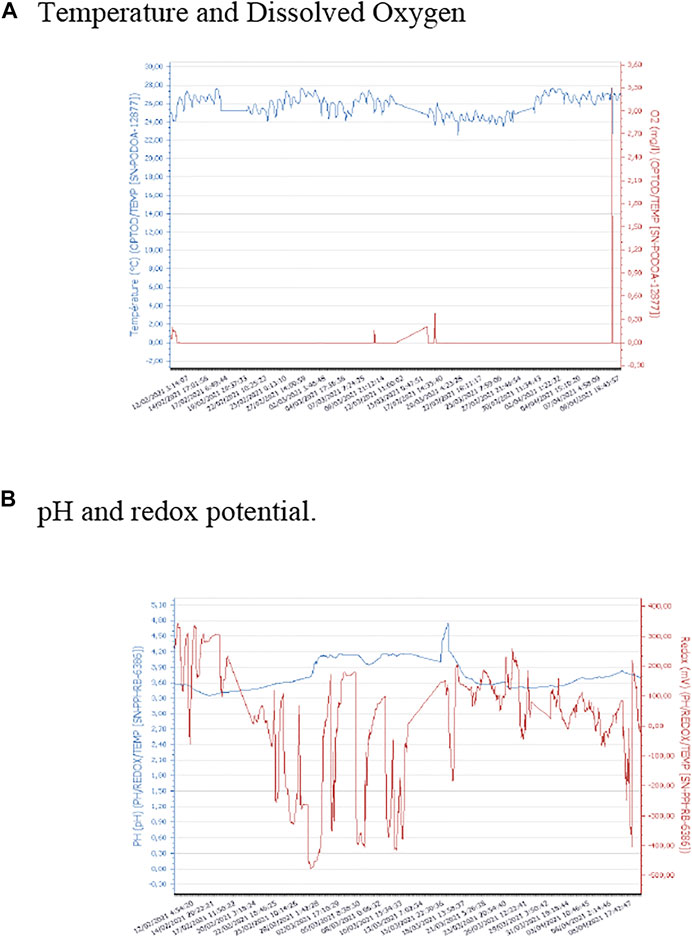
FIGURE 3. Monitoring of physicochemical parameters during operation of MFC1. (A) Temperature and Dissolved Oxygen. (B) pH and redox potential.
The open circuit voltage (OCV) was monitored during operation of both MFCs (Figure 4), 58 days for MFC1 and 30 days for MFC2. Although both cells were set up with the same configuration, materials, ceramic membrane, and anodic and cathode electrodes, and were fed with the same substrate, differences in the electrochemical behaviour were observed. For MFC1, a fast increase in voltage occurs approximately during the first 10 days of operation, reaching a value close to 300 mV at t = 10 days, and slowly increasing thereafter to reach a maximum voltage of 335 mV at t = 21 days. The voltage remained at a relatively constant voltage of 330 mV until t = 30 days, decreasing thereafter down to 206 mV at t = 43 days, and from this day until the end of the operation (t = 58 days), when the recorded voltage is approximately 186 mV. A different behaviour was observed in MFC2: In this case, a slower increase in OCV is observed, reaching a maximum value of 378 mV at t = 28 days. In this set-up, no periods of stable voltage output are observed, with some oscillations but with a clear increasing trend.
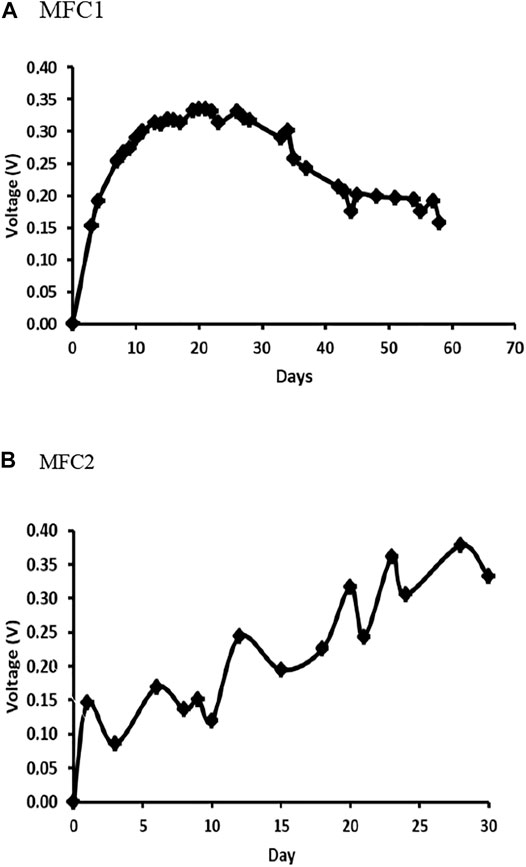
FIGURE 4. Voltage tracking of MFCs. (A) MFC1 (B) MFC2
The electrochemical performances of the MFCs operated at closed circuit voltage (CCV) were also different. Taking into account the low output voltage reached in MFC1 at day 58, the closed-circuit operation was performed with an external resistance of 100 Ω; however, no electrochemical response was obtained. On the contrary, the polarization curve determined in MFC2 operated at CCV by connecting an external resistance of 100 Ω at 30 days reached a maximum power density of 21.16 W/m3 achieved with an external resistance of 3,800 Ω (Figure 5). The better electrochemical performance observed in MFC2 can be attributed to the use of a mature community as inoculum, indicating that the electrochemical behavior is directly related to the development and evolution of the microbial community colonizing the anode.
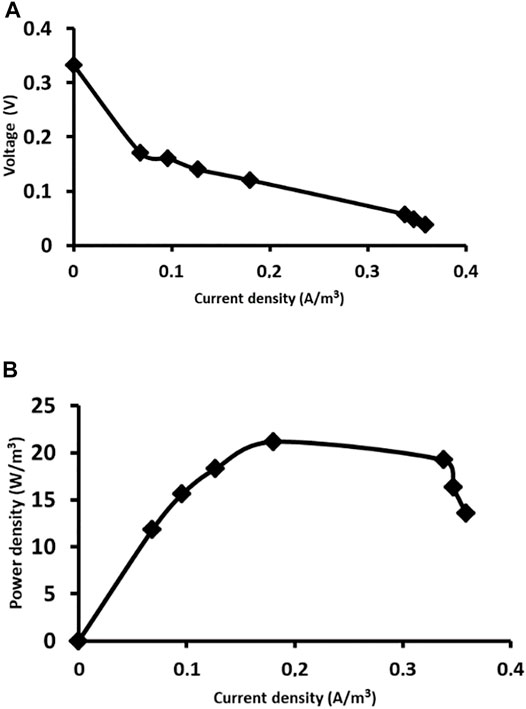
FIGURE 5. Electrochemical performance of MFC2 at day 30: (A) Polarization curve; (B) Power density curve.
3.2.2 COD reduction
Together with the electrochemical performance, we evaluated the capacity of the MFCs to degrade the organic matter present in the wastewater. Figure 6 shows the results of COD measurements in samples taken from MFCs at different times during the operation. In terms of COD concentration in the anodic chamber, MFC1 showed a constant decrease in COD until day 33, equivalent to a total COD reduction of 69%.
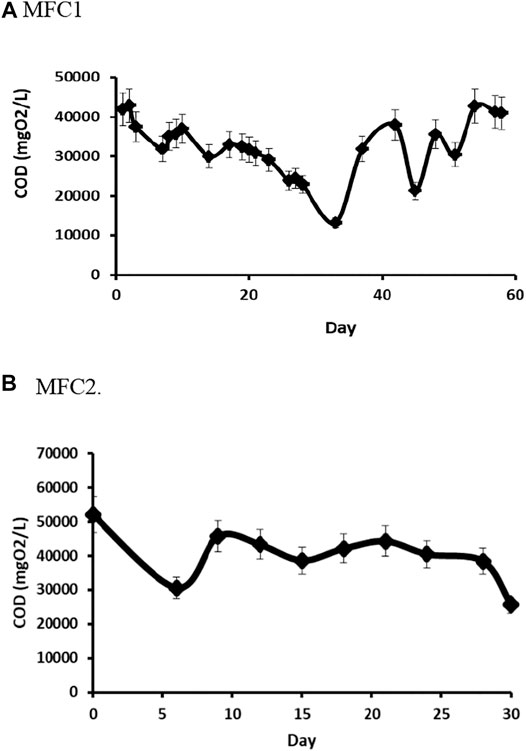
FIGURE 6. Changes in COD during operation of MFCs. Anode chambers were replenished daily with fresh medium to compensate for decrease in liquid volume. The COD measured is the difference between the amount fed and the amount consumed. (A) MFC1 (B) MFC2
However, these measurements do not consider that the liquid in the chamber was replenished during operation by addition of fresh medium. Therefore, to calculate the consumption of organic matter, under these experimental conditions, and the calculation needs to be corrected to account for the daily addition of medium. Although the complexity of the system makes it difficult to obtain accurate values, approximate rates of COD reduction can be calculated to be approximately 4.5 gCOD/l/d for MFC1, assuming linearity and correcting for medium replenishment: In this case, the consumption of COD is approximately 71%. Although the concentration of organic matter in the system (measured as COD) increases after day 33, reaching a value close to the initial value (41.3 gCOD/l), the calculation shows that the system is still able to consume COD at a rate of approximately 2.5 gCOD/l/d. This decrease in the capacity for COD consumption might be a result of diffusional limitations that could be eliminated by careful design of the process and adjustment of operational variables.
In MFC2, the COD was reduced by 41% during the first 5 days of operation, but between 10 and 28 days, the concentration of organic matter remained approximately constant at a value of 40.8 gO2/l, which represents a reduction of 21.7%. Finally, by 30 days, a reduction of 49.4% was achieved. However, when a correction for the replenishment of medium in the system is taken into account, the reduction of COD is much larger. On day 5, the reduction is approximately 70%, reaching 80% by day 22 and 91% at the end of operation at day 30. The rate of decrease measured assuming linearity shows a very high rate of 11.57 gCOD/l/d at day 5, and decreasing to relatively constant values fluctuating between 8.5 and 9.0 gCOD/l/d.
The differences in electrochemical and biochemical behaviour could be associated with changes in physical properties of the liquid and the electrodes. Visual observation shows an increase in the viscosity of the medium, and the formation of a thick deposit on the surface of the anodes during the operation (Figure 7). This can be attributed to the increase in microbial biomass and the secretion of extracellular polymeric substances, as evidenced by the presence of a gelatinous material adhered to the walls of the anode chamber and suspended in the wastewater. A layer of a material with similar characteristics was observed on the surface of the anodes. As it can be seen in Figure 7A for the MFC1, despite the presence of gelatinous material, the wastewater in the centre of the chamber has a less viscous consistency and presents a slightly lighter colour, when compared to the fresh wastewater that was fed to the cell (Figure 3A).
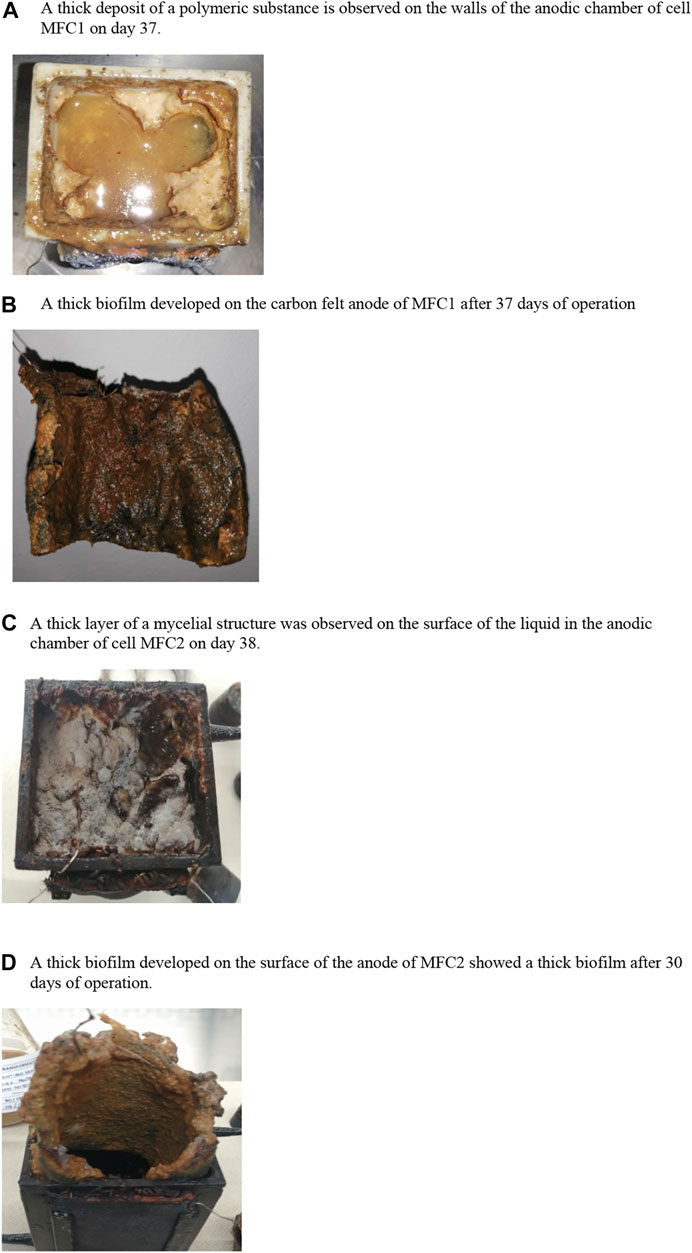
FIGURE 7. Macroscopic changes observed in the anodic chamber of MFCs. (A) A thick deposit of a polymeric substance is observed on the walls of the anodic chamber of cell MFC1 on day 37. (B) A thick biofilm developed on the carbon felt anode of MFC1 after 37 days of operation. (C) A thick layer of a mycelial structure was observed on the surface of the liquid in the anodic chamber of cell MFC2 on day 38. (D) A thick biofilm developed on the surface of the anode of MFC2 showed a thick biofilm after 30 days of operation.
The macroscopic changes in the development and evolution of the microbial community in MFC2 are more significant. As it can be seen in Figures 7A,C mycelial mat developed on the surface of the liquid in the anode chamber. Once this thick layer of microorganisms has been removed, it is possible to see the differences in viscosity and coloration of the treated wastewater compared to the initially observed characteristics. Figure 7D shows that the biofilm layer formed was thicker and more compact than that observed in MFC1 (Figure 7B). The development and evolution of microbial communities with different physical structures may account for the different results of bioelectrochemical performance and degradation of organic matter in the 2 MFCs. This issue needs to be carefully considered when designing a bioelectrochemical system to remediate wastewaters with high content of organic matter of variable and undefined composition.
3.3 Macroscopic and Microscopic Analysis of the Native Microbial Community
The macroscopic development and evolution of the microbial community in the MFC was evidenced as shown in Figure 7 and discussed in the previous section. However, to confirm the evidence of the adaptation and colonization of the surface and internal structure of the anode electrodes, we performed a scanning electron microscopic analysis of anode samples. Figure 8 shows micrographs of anode samples taken from MFC1. Figures 8A,B correspond to micrographs of the surface of the carbon felt used as an anodic electrode. As it can be seen in Figure 8A, the material has a structure composed of very different fibres randomly intertwined, with large spaces between them. Figure 8B shows details of one of the fibres, with a flat and smooth surface but a multi-layered configuration, which creates cavities and crevices along the fibre. In Figure 8C, the presence of microbial cells and biological material can be seen adhered to the surface of the fibres or embedded in the cavities of the material. Morphological structures corresponding to bacilli and cocci are observed, in addition to other amorphous structures that may correspond to components of the wastewater used as a substrate and to exopolysaccharides or other extracellular polymeric substances secreted by microorganisms to improve their adhesion to the surfaces of the material. Figures 8D,E show details of the microorganisms and deposits of substances that modify the surface structure, generating a rough and irregular layer of material to which cells may attach by means of structures (e.g. pili). These structures have also been reported as being involved in mechanisms of electron transfer in electricity generation processes in bioelectrochemical systems (Shelobolina et al., 2007; Shelobolina et al., 2008).
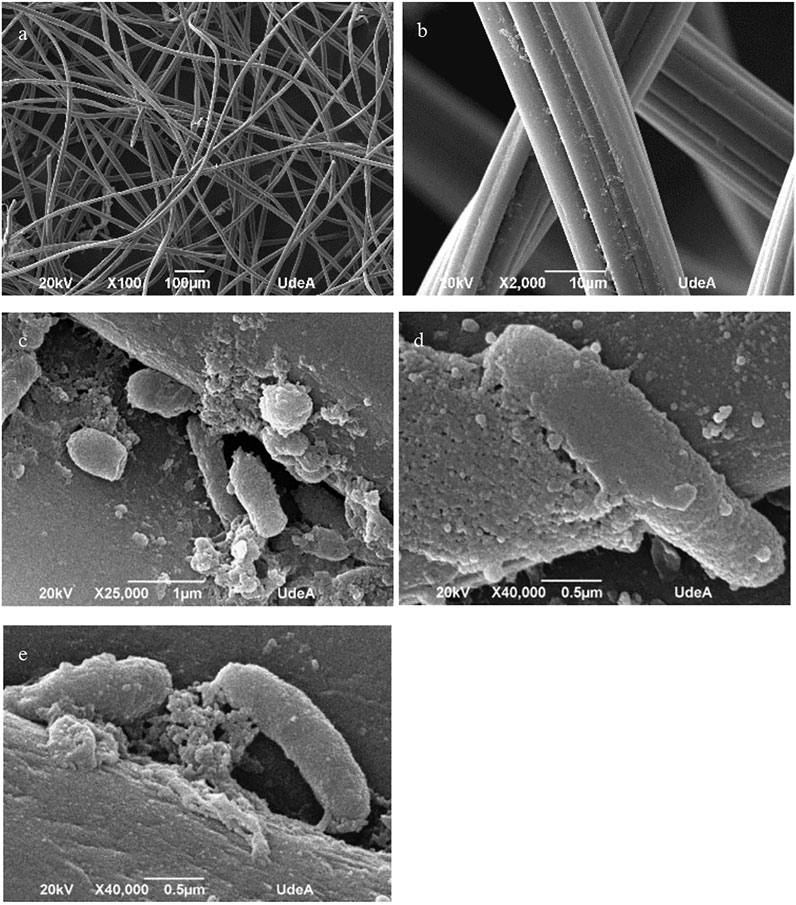
FIGURE 8. Analysis by scanning electron microscopy of the anode of MFC1. The images show the microscopic changes observed in the carbon felt fibres after operation for 37 days (A) X100 magnification; (B) 2000X magnification. (C) Microbial cells embedded in polymeric substance can be observed attached to the carbon fibres; (D,E). show details of the rough and irregular surface of the fibres caused by the deposits of polymeric substances.
Figure 9 shows the results of the SEM analysis carried out for the anode of MFC2. Here, the development and evolution of the microbial community present important differences with respect to the biofilm formation and anode colonization in the anode of MFC1. Figures 9A,B show regions of the anode where the fibres of the carbon felt are completely covered by a uniform layer of biological material. In the detail of Figure 9B, it is observed that the substance spreads in a regular way, covering completely the entire surface of the carbon fibre. However, in Figure 9C a large cluster of biological material is observed, which, unlike the thin layer in Figure 9B, presents a rather rough and amorphous structure with cavities and interstices, dispersed on the surface in an irregular manner. In Figures 9D,E, microorganisms with bacilli and cocci morphologies can be seen attached to this material with a different arrangement and configuration. In the case of the bacilli, membrane extension structures that may act as anchors for cell adhesion to surfaces and other cells can be observed. For the cocci, a very compact cluster of cells is observed. The differences in the structure of the biofilms could also be related to the significant differences on the electrochemical performance of the system.
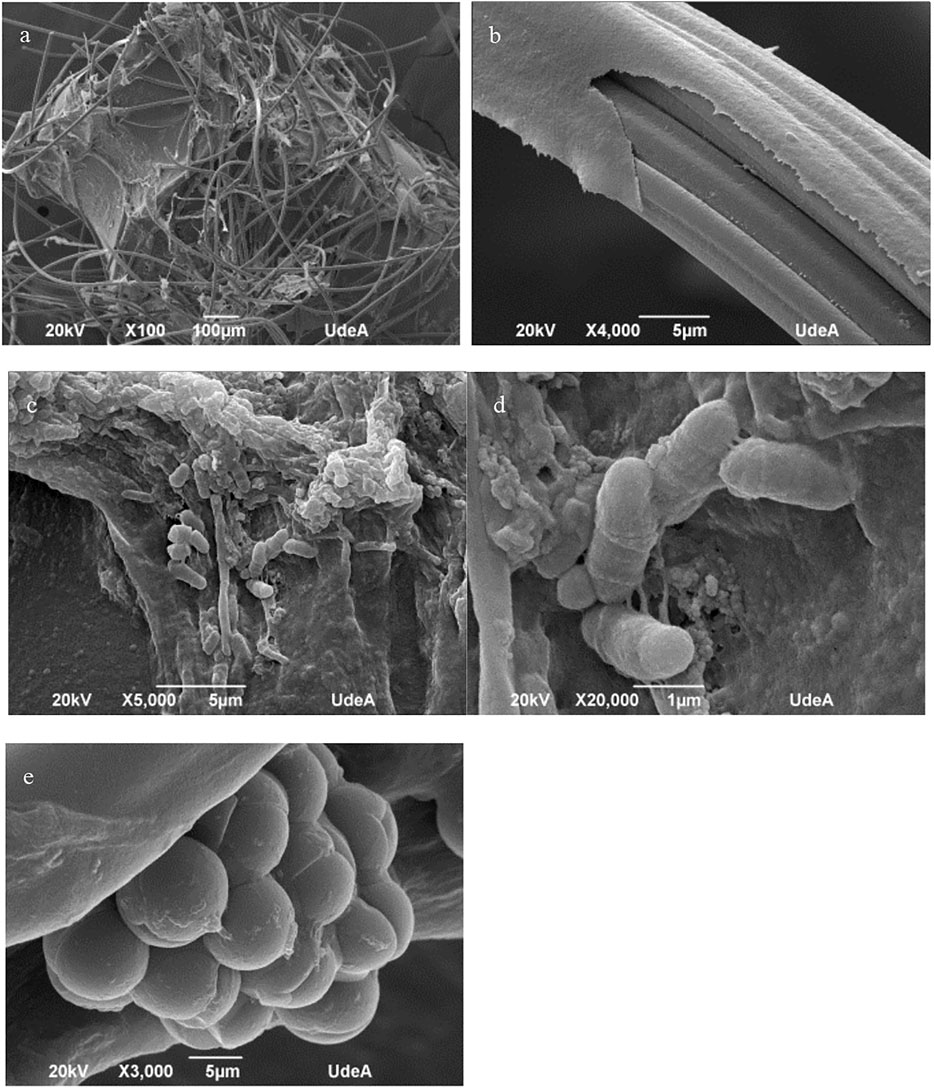
FIGURE 9. Analysis by scanning electron microscopy of the anode of MFC2. The images show the microscopic changes observed in the carbon felt fibres after operation for 30 days (A) structure of the carbon felt at X100 magnification; (B) detail of the anode surface fibres covered by a layer of biological material at 4,000X magnification. (C) Microbial cells embedded in polymeric substance can be seen attached to the carbon fibres; (D) bacilli and (E) cocci can be observed attached to the carbon fibres.
3.4 Molecular Analysis of the Microbial Communities
In order to elucidate the taxonomic structure of the native and the evolved microbial communities developed in the MFCs, we performed a metataxonomic analysis of anodic biofilm samples. Some of the results of the molecular identification are presented in Figures 10, 11. Figure 10 corresponds to the results of relative abundance of the Phyla present in the analysed samples. Samples AR1, AR2, AR3, and AR4 correspond to the wastewater from the Washing, Fermentation, Leachate, and Mixed water sampling points. Samples SP1 corresponds to a soil sample from coffee plantations, and sample IM5 is the mixture of the wastewaters from the different sampling points. The samples identified as MFC1d30 and MFC1d37 correspond to samples of the microbial community present in the liquid of the anode chamber on days 30 and 37, respectively, after the start of the operation of MFC1. The sample identified as MFC1d37A corresponds to samples of the microbial community attached to the anode electrode of MFC1 at day 37. Samples L2, correspond to water samples taken in other environmental settings and regions other than the coffee agroindustry zone, and were included in the analysis for comparison purposes, to determine if the microbial communities associated to coffee present any functional characteristics specific to their natural environment.
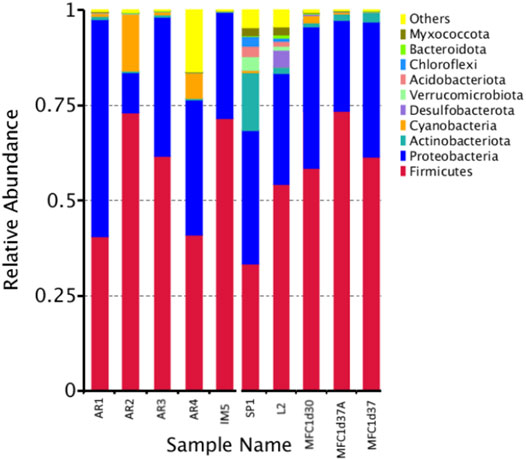
FIGURE 10. Relative abundance at the level of Phylum from native microbial communities. Samples AR1–AR4 correspond to wastewater obtained at different stages of the process Washing, Fermentation, Leachate and Mixed, respectively, and as shown in the scheme in Figure 1. Sample IM5 is the mixture of the wastewater from all sampling points. Sample SP1 is a sample from soil associated to coffee plants. Sample L2 is a sample from soil not related to coffee farms, used as a comparison. Samples MFC1d30 and MFC1d37 are sample from the anolyte from MFC1 at 30 and 37 days of operation, respectively. Sample MFC1d37A is a sample form the anodic biofilm from MFC1 at 37 days of operation.
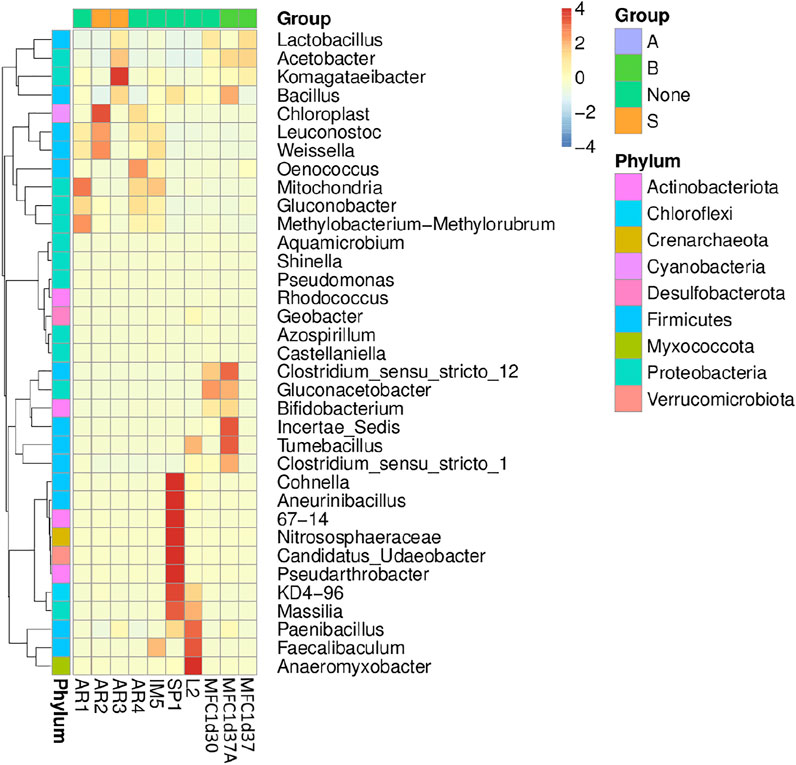
FIGURE 11. Heat map with the bacterial genera of the samples of the native microbial communities and from the anode of MFCs, as described in Figure 10.
In general terms, the results of relative abundance at the Phylum level indicate a higher abundance of Firmicutes and Proteobacteria in wastewater samples from the environment of the coffee region and, therefore, and in the communities present in the MFCs. The Phyla Actinobacteriota, Cyanobacteria, Acidobacteriota, Desulfobacterota, among others are also present at significant abundances. The sample exhibiting a higher diversity of Phyla corresponds to the microbial community obtained from the soil of the coffee plantation, sample SP1, which has a greater similarity to the diversity observed in the environmental samples identified as L2. The phyla with higher abundances in those samples are Firmicutes and Proteobacteria, while also Actinobacteriotas, Desulfobacteriota, Bacteroidota, Chloroflexi, and Myxococcota are detected.
In Figure 11, the genera identified in the native microbial community are presented. There are differences between the genera found in the different samples. For the SP1 sample, the genera Clostridium, Cohnella, Aneurinibacillus, and Candida, among others were identified, while the samples obtained in the different sampling points contain genera such as Gluconacetobacter, Clostridium, Acetobacter, Bacillus, Weissella, Leucononostoc, and Lactobacillus. However, the analysis of the samples from MFC1 show a significant proportion of unidentifiable genera. Besides the mentioned genera, the presence of Tumebacillus and Bifidobacterium is observed in anode sample MFC1d37, while the genus Oenococcus was identified in sample MFC1d30.
4 General Discussion
Despite the fact that equipment and technology incorporated in wet processing coffee plants should allow the reduction of water consumption, large amounts of wastewater are released from coffee bean production process. In Colombia, the international recognition of the quality of its coffee is directly related to the category of “washed soft coffees”, which makes the consumption of water essential in the process (Rodriguez et al., 2015). The COD results shown in Table 2 are evidence of the degree of organic contamination carried by these wastewaters, before being subjected to conventional treatment in the water treatment plant. The COD values are above the levels allowed by the environmental authority, which establishes for the coffee agroindustry maximum CODs of 3.00 gO2/l for the ecological coffee processing, and 0.65 gO2/l for the traditional process that involves the wet processing of coffee (Resolution 631/2015, Ministerio de Ambiente y Desarrollo Sostenible, 2015). In addition to the need to treat the wastewater generated in large coffee processing units, the needs of small coffee producers, representing ca. 95% of the country’s coffee growers, must also be considered. However, due to socio-economic factors and cultivation conditions (farm sizes not exceeding 2 hectares), these producers cannot access appropriate infrastructure to implement ecological technologies for coffee production, nor do they have the possibility of implementing wastewater treatment plants in their production processes (Federación Nacional de Cafeteros, 2021).
As evidenced in the results of the characterization of the wastewater from the wet processing coffee (Table 1), the differences in the concentration of the substances present are significant. These results are similar to those reported by other authors (Said et al., 2020), who determined concentrations of COD and Phosphorus and Nitrogen different from other reports, i.e., 137 mg N/L and 12 mg P/L. The differences in agroindustrial effluents can be attributed to variations in the harvesting processes (Lopes et al., 2014). In many cases, it is impossible to carry out controlled process, and the characteristics of the wastewater will depend on the amount of fruit processed, the amount of water used in washing and pulping the cherry, the fermentation times for the transformation of sugars, the storage times of the pulp and the peel, and the consequent generation of leachates, as well as other operational and environmental factors. The importance of the composition of wastewater lies in the fact that it affects the conditions required for its treatment, both in conventional wastewater treatment systems, as well as its potential for bioremediation through bioelectrochemical systems (Borjas et al., 2015).
In the case of microbial fuel cells, these wastewaters are used as feedstock in the anode chamber so that microorganisms from native communities can degrade and transform organic matter through anaerobic processes of oxidation (Romero et al., 2012; Lovley, 1991). The wastewater from the coffee agroindustry contains Mg, Na, Ca, Zn, Cu, Fe, and other trace elements and co-factors essential for the growth and evolution of electrogenic microorganisms such as the reference electrogenic species Geobacter sulfurreducens (Lin et al., 2004; Romero et al., 2012; Echeverria and Nuti, 2017; Campos et al., 2021). Using native microbial communities ensures the metabolic adaptation of these microorganisms to the nutritional and environmental conditions of the wastewater, to degrade organic matter and to co-generate electricity (Logrono et al., 2015; Varanasi et al., 2017).
Regarding the performance of the MFC, the results indicate that the native microbial community present in the wastewater managed to carry out the transformation of the organic matter, achieving very high COD reductions. The COD reduction observed in MFC1 are close to those reported for degradation of wastewaters using microbial electrochemical systems, such as 64.9% COD reduction for urine (Zang et al., 2012), 58.6% for an integrated upflow wetland system coupled to a microbial fuel cell (Oon et al., 2015), or 63.5% COD reduction MFC fed with distillery wastewater (Samsudeen et al., 2015), while MFC2 showed COD reduction values similar to other systems fed with agroindustrial or domestic waste (Mansoorian et al., 2013; Firdous et al., 2018; Liang et al., 2018). Regarding the potential generation of electricity, the performance of the MFC under the evaluated conditions reached values of up to 378 mV in open circuit and power density values of 21.6 W/m3, comparable to those reported by other authors (Mardanpour et al., 2012; Liang et al., 2018). These results provide clear evidence of the bioelectrochemical functioning of MFC, where a native microbial community exhibits bioremediation capacity to reduce water pollution, and while exhibiting potential for electricity co-generation.
However, it is important to indicate that the performance of microbial fuel cells is affected by different factors, such as the design of the system; the electrode and membrane materials; the environmental and operational conditions; the characteristics of the substrate used; and the microorganisms or microbial communities used as inoculum (Palanisamy et al., 2019). Therefore, the selection and evaluation of these factors is essential to achieve a better performance of the CFMs. In this study, the MFC evaluated was manufactured with inexpensive materials. The carcasse was constructed with ABS (acrylonitrile butadiene styrene), a commercial material with multiple industrial and domestic applications (Perez, 2018). Similarly, the ceramic separation membranes evaluated were manufactured by an artisanal procedure from easily available local clays which present outstanding characteristics and properties for use in MFCs (Winfield et al., 2016; Yousefi et al., 2017). The maximum power achieved in the MFC was 21.6 W/m3, higher than those reported by other authors who used MFCs of similar configurations, with open cathode and ion exchange membranes made of ceramic materials, e.g. 2.83 and 3.66 W/m3 (Winfield et al., 2013); 6.57 W/m3 (Jadhav et al., 2014); 4.21 W/m3 (Chatterjee and Ghangrekar, 2014); 15 W/m3 (Walter et al., 2016). The improved electrochemical performance of the MFC is probably due to the substrate and the microbial community used.
Nevertheless, despite these promising results, the performance of the MFC could be affected by the operational conditions under which the experimentation was carried out (Rabaey et al., 2011). As was observed in our long-term experiments, the formation of a thick biofilm on the anode electrode and the presence of exopolysaccharides in the liquid, a product of cell metabolism and the transformation of the substrate, could generate limitations in mass transfer. The negative effect of these limitations would be related to the high demand for fresh substrate due to the significant increase in biomass and the decrease in contact between the substrate and the cells. Both phenomena would cause a reduction in the anaerobic oxidation of organic matter, thus limiting the bioremediation capacity of the MFC. On the other hand, if the adaptation and evolution of the microbial community is achieved and an optimal amount of immobilized biomass is reached on the anode electrode, either by controlling biofilm formation, by implementing larger surface areas on the electrode anode, or by modification of the operational conditions (ie., Hydraulic Retention Time), an increase in the rate of bioremediation in the MFC, and therefore electricity generation, could be achieved (Li et al., 2014). The formation of a layer of biological material, shown in detail in Figures 8C, 9B, may represent an advantage for survival and adaptation of microorganisms, which, taking advantage of the electron-accepting nature of the anode material, increase their metabolic activity (Li et al., 2010; Srivastave et al., 2015). However, this increase in biomass can also cause long-term plugging problems in the electrode and affect the performance of the MFC. As several authors have indicated, ideally a microbial community is expected to be synergistic, with microorganisms playing a specific role in the so-called “nutrient cycle ecosystem” (Costerton, 2007; Li et al., 2018).
The results of the molecular characterization carried out on the native microbial communities present in the coffee agroindustry and in the MFCs (see Figures 10, 11) indicate the presence of Phyla such as Proteobacteria, Firmicultes, Acidobacteria, and Actinobacteria. These phyla are formed by multiple genera with metabolic capabilities for the biotransformation of the complex matrix of coffee wastewater. If the results of relative abundance in the samples of wastewater from the coffee agroindustry are compared with those obtained for samples from other non-coffee growing regions, important differences can be established in the composition of the microbial communities. In the case of environmental samples identified as R1 and R2, the community is composed mainly of the Phylum Actinobacteriota, followed by Proteobacteria and Desulfobacterota. However, the microbial community of the samples from coffee regions is composed mainly by microorganisms belonging to the Phyla Firmicutes, followed by Proteobacteria. The differences in the relative abundance of the microbial communities of the different sampling points in the processing plant, identified as AR1, AR2, AR3, and AR4, are not so significant, with only a greater abundance of the Phylum Cyanobacteria observed in the AR2 sample, and which corresponds to the wastewater from the fermentation stage. The metabolic capacity of Cyanobacteria in the production of methane has recently been reported (BižićKlintzsch et al., 2020). SP1, which corresponds to soil from coffee plantations, is the sample that exhibits the greatest diversity. Unlike the other samples, and a greater presence of the Phylum Actinobacteriota is observed. In environmental samples, the presence of the genus Geobacter is well-known, as members of this genus are recognized for their outstanding electrogenic characteristics, due to the ability to directly transfer electrons to different substances (Lovley et al., 2004; Holmes et al., 2006). For the samples from the coffee zone, the genus Clostridium stands out. Clostridium has been reported as possessing potential electrogenic capability (Jiang et al., 2016; Deng et al., 2017). Also, in these samples, the presence of the genus Komagataeibacter is evidenced. Within this genus, species with a wide metabolic capacity for the processing of glucose, glycerol, and cellulose have been reported. Their ability as producers of bionanocellulose and the synthesis of exopolysacatides is also highlighted (Ryngajłło et al., 2019). The genera Bacteroides, Clostridium, Leucononostoc, and Lactobacillus possess fermentative metabolism (Hodgson et al., 2016), while species of the genus Bidifobacterium present heterofermentative metabolism of glucose and lactose (Pokusaeva et al., 2011). It is possible to attribute an approximate metabolic function, taking into account the type of metabolic products present in the environment. However, it is not possible in a complex microbial community to identify the specific metabolic functions performed by each species (Hodgson et al., 2016). It is worth highlighting the importance of exploring different environments or specific environmental niches, since many species present in native microbial communities may present multiple metabolic capacities that can be used both for decontamination processes and for the co-generation of electricity in bioelectrochemical systems.
Data Availability Statement
The datasets presented in this study can be found in online repositories. The names of the repository/repositories and accession number(s) can be found below: https://dataverse.harvard.edu/dataset.xhtml?persistentId=doi:10.7910/DVN/DTCR01. The research has the permission to access genetic resources contract No RGE156-10 issued by the Colombian authority Ministry of Environment and Sustainable Development.
Author Contributions
All authors have made substantial direct and intellectual contribution to the work. Author contribution. SEC: Investigation, Data analysis, CA-R: Conceptualization, Data analysis, Writing (review and editing), Funding acquisition. LMA-E: Conceptualization, Experimental design, Data analysis, Project administration, Writing (original draft, review and editing), Funding acquisition. All authors approved the manuscript for publication.
Funding
This research was funded by the Colombia-UK Newton Prize Award 2018 “Valorisation of agro-industrial waste: A Bioelectrochemical System for waste degradation and energy recovery from industrial coffee waste” (Project number 1175).
Conflict of Interest
The authors declare that the research was conducted in the absence of any commercial or financial relationships that could be construed as a potential conflict of interest.
Publisher’s Note
All claims expressed in this article are solely those of the authors and do not necessarily represent those of their affiliated organizations, or those of the publisher, the editors and the reviewers. Any product that may be evaluated in this article, or claim that may be made by its manufacturer, is not guaranteed or endorsed by the publisher.
Acknowledgments
The authors would like to thank Cooperativa De los Andes for supplying wastewater samples and providing access to the coffee processing plants. CAR would like to thank the Biotechnology and Biological Sciences Research Council (BBSRC).
Supplementary Material
The Supplementary Material for this article can be found online at: https://www.frontiersin.org/articles/10.3389/fceng.2022.814987/full#supplementary-material
References
APHA/AWWA/WEF (2012a). “5220 Chemical Oxygen Demand (COD),” in Standard Methods for the Examination of Water and Wastewater. Editors E.R.A. RiceBairdEaton, and L. Clesceri. 22nd ed., 14–19. Available at: http://edgeanalytical.com/wp-content/uploads/Inorganic_SM5220.pdf.
APHA/AWWA/WEF (2012b). “Standard Methods for the Examination of Water and Wastewater,” in Standard Methods. Editors E. Rice, R. Baird, A. Eaton, and L. Clesceri. 22nd ed.
BižićKlintzsch, M. T., Klintzsch, T., Ionescu, D., Hindiyeh, M. Y., Günthel, M., Muro-Pastor, A. M., et al. (2020). Aquatic and Terrestrial Cyanobacteria Produce Methane. Sci. Adv. 6, eaax5343. doi:10.1126/sciadv.aax5343
Borjas, Z., Ortiz, J., Aldaz, A., Feliu, J., and Esteve-Núñez, A. (2015). Strategies for Reducing the Start-Up Operation of Microbial Electrochemical Treatments of Urban Wastewater. Energies 8, 14064–14077. doi:10.3390/en81212416
Campos, R. C., Pinto, V. R. A., Melo, L. F., Rocha, S. J. S. S. d., and Coimbra, J. S. (2021). New Sustainable Perspectives for "Coffee Wastewater" and Other By-Products: A Critical Review. Future Foods 4, 100058. doi:10.1016/j.fufo.2021.100058
Chatterjee, P., and Ghangrekar, M. M. (2014). Design of Clayware Separator-Electrode Assembly for Treatment of Wastewater in Microbial Fuel Cells. Appl. Biochem. Biotechnol. 173, 378–390. doi:10.1007/s12010-014-0846-x
Dankowska, A., Domagała, A., and Kowalewski, W. (2017). Quantification of Coffea Arabica and Coffea Canephora Var. Robusta Concentration in Blends by Means of Synchronous Fluorescence and UV-Vis Spectroscopies. Talanta 172, 215–220. doi:10.1016/j.talanta.2017.05.036
Deng, H., Xue, H., and Zhong, W. (2017). A Novel Exoelectrogenic Bacterium Phylogenetically Related toClostridium sporogenesIsolated from Copper Contaminated Soil. Electroanalysis 29, 1294–1300. doi:10.1002/elan.201600673
Didanna, H. L. (2014). A Critical Review on Feed Value of Coffee Waste for Livestock Feeding. World J. Biol. Biol. Sci. 2, 72–86.
Echeverria, M. C., and Nuti, M. (2017). Valorisation of the Residues of Coffee Agro-Industry: Perspectives and Limitations. Towmj 10, 13–22. doi:10.2174/1876400201710010013
Federación Nacional de Cafeteros (2021). Our Coffee Growers. Available at: https://www.cafedecolombia.com/particulares/our-coffee-growers/?lang=en (Accessed November 3, 2021).
Firdous, S., Jin, W., Shahid, N., Bhatti, Z. A., Iqbal, A., Abbasi, U., et al. (2018). The Performance of Microbial Fuel Cells Treating Vegetable Oil Industrial Wastewater. Environ. Tech. Innovation 10, 143–151. doi:10.1016/j.eti.2018.02.006
Hodgson, D. M., Smith, A., Dahale, S., Stratford, J. P., Li, J. V., Grüning, A., et al. (2016). Segregation of the Anodic Microbial Communities in a Microbial Fuel Cell cascade. Front. Microbiol. 7, 699. doi:10.3389/fmicb.2016.00699
Holmes, D. E., Chaudhuri, S. K., Nevin, K. P., Mehta, T., Methe, B. A., Liu, A., et al. (2006). Microarray and Genetic Analysis of Electron Transfer to Electrodes in Geobacter Sulfurreducens. Environ. Microbiol. 8, 1805–1815. doi:10.1111/j.1462-2920.2006.01065.x
Jadhav, D. A., Ghadge, A. N., Mondal, D., and Ghangrekar, M. M. (2014). Comparison of Oxygen and Hypochlorite as Cathodic Electron Acceptor in Microbial Fuel Cells. Bioresour. Tech. 154, 330–335. doi:10.1016/j.biortech.2013.12.069
Jiang, Y., Deng, H., Huang, X., Zhang, Y., and Zhong, W. (2016). Characterization of a Novel Electrogenic Clostridium Sporogenes Isolated from forest Soil. Wei Sheng Wu Xue Bao 56, 846–855. doi:10.13343/j.cnki.wsxb.20150335
Li, B., Zhou, J., Zhou, X., Wang, X., Li, B., Santoro, C., et al. (2014). Surface Modification of Microbial Fuel Cells Anodes: Approaches to Practical Design. Electrochimica Acta 134, 116–126. doi:10.1016/j.electacta.2014.04.136
Li, M., Zhou, M., Tian, X., TanMcDaniel, C. C. T., McDaniel, C. T., Hassett, D. J., et al. (2018). Microbial Fuel Cell (MFC) Power Performance Improvement through Enhanced Microbial Electrogenicity. Biotechnol. Adv. 36, 1316–1327. doi:10.1016/j.biotechadv.2018.04.010
Li, Z., Zhang, X., Lin, J., Han, S., and Lei, L. (2010). Azo Dye Treatment with Simultaneous Electricity Production in an Anaerobic-Aerobic Sequential Reactor and Microbial Fuel Cell Coupled System. Bioresour. Tech. 101, 4440–4445. doi:10.1016/j.biortech.2010.01.114
Liang, P., Duan, R., Jiang, Y., Zhang, X., Qiu, Y., and Huang, X. (2018). One-year Operation of 1000-L Modularized Microbial Fuel Cell for Municipal Wastewater Treatment. Water Res. 141, 1–8. doi:10.1016/j.watres.2018.04.066
Lin, W. C., Coppi, M. V., and Lovley, D. R. (2004). Geobacter Sulfurreducens Can Grow with Oxygen as a Terminal Electron Acceptor. Appl. Environ. Microbiol. 70, 2525–2528. doi:10.1128/aem.70.4.2525-2528.2004
Logroño, W., Ramírez, G., Recalde, C., Echeverría, M., and Cunachi, A. (2015). Bioelectricity Generation from Vegetables and Fruits Wastes by Using Single Chamber Microbial Fuel Cells with High Andean Soils. Energ. Proced. 75, 2009–2014. doi:10.1016/j.egypro.2015.07.259
Lopes, P. R., Araújo, K. C. S., Lopes, I. M., Rangel, R. P., Santos, N. F. F., and Kageyama, P. Y. (2014). Uma análise das consequências da agricultura convencional e das opções de modelos sustentáveis de produção –agricultura orgânica e agroflorestal. REDD –Revista Espaço de Diálogo e Desconexão 8, 1–38. doi:10.32760/1984-1736/REDD/2014.v8i2.6912
Lovley, R. (1991). Dissimilatory Fe(III) and Mn(IV) Reduction. Microbiol. Rev. 55, 259–287. doi:10.1128/mr.55.2.259-287.1991
Lovley, D. R., Holmes, D. E., and Nevin, K. P. (2004). Dissimilatory Fe(III) and Mn(IV) Reduction. Adv. Microb. Physiol. 49, 219–286. doi:10.1016/S0065-2911(04)49005-5
Mahdi Mardanpour, M., Nasr Esfahany, M., Behzad, T., and Sedaqatvand, R. (2012). Single Chamber Microbial Fuel Cell with Spiral Anode for Dairy Wastewater Treatment. Biosens. Bioelectron. 38, 264–269. doi:10.1016/j.bios.2012.05.046
Mansoorian, H. J., Mahvi, A. H., Jafari, A. J., Amin, M. M., Rajabizadeh, A., and Khanjani, N. (2013). Bioelectricity Generation Using Two Chamber Microbial Fuel Cell Treating Wastewater from Food Processing. Enzyme Microb. Tech. 52, 352–357. doi:10.1016/j.enzmictec.2013.03.004
Ministerio de Ambiente y Desarrollo Sostenible (2015). Resolución 631. Capitulo VI. Artículo 9. Parámetros fisicoquímicos y sus valores límites máximos permisibles en los vertimientos puntuales de aguas residuales no domésticas (ARND) a cuerpos de aguas superficiales. Sector Agroindustria.
Oon, Y.-L., Ong, S.-A., Ho, L.-N., Wong, Y.-S., Oon, Y.-S., Lehl, H. K., et al. (2015). Hybrid System Up-Flow Constructed Wetland Integrated with Microbial Fuel Cell for Simultaneous Wastewater Treatment and Electricity Generation. Bioresour. Tech. 186, 270–275. doi:10.1016/j.biortech.2015.03.014
Palanisamy, G., Jung, H.-Y., Sadhasivam, T., Kurkuri, M. D., Kim, S. C., and Roh, S.-H. (2019). A Comprehensive Review on Microbial Fuel Cell Technologies: Processes, Utilization, and Advanced Developments in Electrodes and Membranes. J. Clean. Prod. 221, 598–621. doi:10.1016/j.jclepro.2019.02.172
Pérez, M. (2018). Nueva Generación de Materiales Plásticos Basados en ABS de Altas Prestaciones Técnicas o más Sostenibles con el Medio Ambiente. Tesis doctoral. Doctorado Industrial en Química. España: Universidad Autónoma de Barcelona.
Pokusaeva, K., Fitzgerald, G. F., and van Sinderen, D. (2011). Carbohydrate Metabolism in Bifidobacteria. Genes Nutr. 6, 285–306. doi:10.1007/s12263-010-0206-6
Rabaey, K., Lissenns, G., and Verstraete, W. (2011). “Microbial Fuel Cells: Performances and Perspectives,” in Biofuels for Fuel Cells: Biomass Fermentation towards Usage in Fuel Cells. Editors P. Lens, P. Westermann, M. Haberbauer, and A. Moreno (London: IWA Publishing).
Rodriguez, N., Sanz, J. R., Oliveros, C., and Ramirez, C. A. (2015). Beneficio del café en Colombia Prácticas y estrategias para el ahorro, uso eficiente del agua y el control de la contaminación hídrica en el proceso de beneficio húmedo del café. Manizales, Colombia: Federación Nacional de Cafeteros.
Romero, A., Vásquez, J., and Lugo, A. (2012). Bacterias, fuente de energía para el futuro. Tecnura 16, 117–142.
Ryngajłło, M., Kubiak, K., Jędrzejczak‐Krzepkowska, M., Jacek, P., and Bielecki, S. (2019). Comparative Genomics of theKomagataeibacterstrains-Efficient Bionanocellulose Producers. MicrobiologyOpen 8, e00731. doi:10.1002/mbo3.731
Said, N. S. M., Abdullah, S. R. S., IsmailHasan, N. I. H. A., Hasan, H. A., and Othman, A. R. (2020). Phytoremediation of Real Coffee Industry Effluent through a Continuous Two-Stage Constructed Wetland System. Environ. Tech. Innovation 17, 100502. doi:10.1016/j.eti.2019.100502
Samsudeen, N., Radhakrishnan, T. K., and Matheswaran, M. (2015). Bioelectricity Production from Microbial Fuel Cell Using Mixed Bacterial Culture Isolated from Distillery Wastewater. Bioresour. Tech. 195, 242–247. doi:10.1016/j.biortech.2015.07.023
Shelobolina, E. S., Nevin, K. P., Blakeney-Hayward, J. D., Johnsen, C. V., Plaia, T. W., Krader, P., et al. (2007). Geobacter Pickeringii Sp. nov., Geobacter Argillaceus Sp. Nov. And Pelosinus Fermentans Gen. nov., Sp. nov., Isolated from Subsurface Kaolin Lenses. Int. J. Syst. Evol. Microbiol. 57, 126–135. doi:10.1099/ijs.0.64221-0
Shelobolina, E. S., Vrionis, H. A., Findlay, R. H., and Lovley, D. R. (2008). Geobacter Uraniireducens Sp. nov., Isolated from Subsurface Sediment Undergoing Uranium Bioremediation. Int. J. Syst. Evol. Microbiol. 58, 1075–1078. doi:10.1099/ijs.0.65377-0
Srivastava, P., Yadav, A. K., and Mishra, B. K. (2015). The Effects of Microbial Fuel Cell Integration into Constructed Wetland on the Performance of Constructed Wetland. Bioresour. Tech. 195, 223–230. doi:10.1016/j.biortech.2015.05.072
Varanasi, J. L., Sinha, P., and Das, D. (2017). Maximizing Power Generation from Dark Fermentation Effluents in Microbial Fuel Cell by Selective Enrichment of Exoelectrogens and Optimization of Anodic Operational Parameters. Biotechnol. Lett. 39, 721–730. doi:10.1007/s10529-017-2289-2
Voora, V., Bermúdez, S., Larrea, C., and Baliño, S. (2020). Global Market Report: Coffee. Winnipeg, MB: International Institute for Sustainable Development IISD. Availabe at: https://www.iisd.org/system/files/publications/ssi-global-market-report-coffee.pdf (Accessed December 24, 2021).
Walter, X. A., Forbes, S., Greenman, J., and Ieropoulos, I. A. (2016). From Single MFC to cascade Configuration: The Relationship between Size, Hydraulic Retention Time and Power Density. Sustainable Energ. Tech. Assessments 14, 74–79. doi:10.1016/j.seta.2016.01.006
Winfield, J., Gajda, I., Greenman, J., and Ieropoulos, I. (2016). A Review into the Use of Ceramics in Microbial Fuel Cells. Bioresour. Tech. 215, 296–303. doi:10.1016/j.biortech.2016.03.135
Winfield, J., Greenman, J., Huson, D., and Ieropoulos, I. (2013). Comparing Terracotta and Earthenware for Multiple Functionalities in Microbial Fuel Cells. Bioproc. Biosyst Eng 36, 1913–1921. doi:10.1007/s00449-013-0967-6
Yang, P., Peng, Y., Tan, H., Liu, H., Wu, D., Wang, X., et al. (2021). Foaming Mechanisms and Control Strategies during the Anaerobic Digestion of Organic Waste: A Critical Review. Sci. Total Environ. 779, 146531. doi:10.1016/j.scitotenv.2021.146531
Yousefi, V., Mohebbi-Kalhori, D., and Samimi, A. (2017). Ceramic-based Microbial Fuel Cells (MFCs): A Review. Int. J. Hydrogen Energ. 42, 1672–1690. doi:10.1016/j.ijhydene.2016.06.054
Zang, G.-L., Sheng, G.-P., Li, W.-W., Tong, Z.-H., Zeng, R. J., Shi, C., et al. (2012). Nutrient Removal and Energy Production in a Urine Treatment Process Using Magnesium Ammonium Phosphate Precipitation and a Microbial Fuel Cell Technique. Phys. Chem. Chem. Phys. 14, 1978–1984. doi:10.1039/C2CP23402E
Keywords: coffee wastewater, water treatment, microbial fuel cell (MFC), bioelectrochemical systems (BES), native microbial community, green energy, agro-industrial waste
Citation: Agudelo-Escobar LM, Cabrera SE and Avignone Rossa C (2022) A Bioelectrochemical System for Waste Degradation and Energy Recovery From Industrial Coffee Wastewater. Front. Chem. Eng. 4:814987. doi: 10.3389/fceng.2022.814987
Received: 14 November 2021; Accepted: 21 January 2022;
Published: 28 February 2022.
Edited by:
Albert Guisasola, Universitat Autonoma de Barcelona, SpainReviewed by:
Marika Kokko, Tampere University, FinlandElizabeth Susan Heidrich, Newcastle University, United Kingdom
Copyright © 2022 Agudelo-Escobar, Cabrera and Avignone Rossa. This is an open-access article distributed under the terms of the Creative Commons Attribution License (CC BY). The use, distribution or reproduction in other forums is permitted, provided the original author(s) and the copyright owner(s) are credited and that the original publication in this journal is cited, in accordance with accepted academic practice. No use, distribution or reproduction is permitted which does not comply with these terms.
*Correspondence: Lina María Agudelo-Escobar, lina.agudelo@udea.edu.co