Single cell RNA-sequencing and RNA-tomography of the avian embryo extending body axis
 G. F. Mok1*
  S. Turner2†
  E. L. Smith1 L. Mincarelli2†
  A. Lister2
  J. Lipscombe2 V. Uzun2† W. Haerty2
  I. C. Macaulay2*
  A. E. Münsterberg1*
- 1School of Biological Sciences, University of East Anglia, Norwich, United Kingdom
- 2Earlham Institute, Norwich, United Kingdom
Introduction: Vertebrate body axis formation initiates during gastrulation and continues within the tail bud at the posterior end of the embryo. Major structures in the trunk are paired somites, which generate the musculoskeletal system, the spinal cord—forming part of the central nervous system, and the notochord, with important patterning functions. The specification of these different cell lineages by key signalling pathways and transcription factors is essential, however, a global map of cell types and expressed genes in the avian trunk is missing.
Methods: Here we use high-throughput sequencing approaches to generate a molecular map of the emerging trunk and tailbud in the chick embryo.
Results and Discussion: Single cell RNA-sequencing (scRNA-seq) identifies discrete cell lineages including somites, neural tube, neural crest, lateral plate mesoderm, ectoderm, endothelial and blood progenitors. In addition, RNA-seq of sequential tissue sections (RNA-tomography) provides a spatially resolved, genome-wide expression dataset for the avian tailbud and emerging body, comparable to other model systems. Combining the single cell and RNA-tomography datasets, we identify spatially restricted genes, focusing on somites and early myoblasts. Thus, this high-resolution transcriptome map incorporating cell types in the embryonic trunk can expose molecular pathways involved in body axis development.
Introduction
The generation of somites, which arise in a regular sequence during embryogenesis, is fundamental for creating the vertebrate segmented body plan (Benazeraf and Pourquie, 2013). Pairs of somites form on either side of the neural tube from unsegmented, paraxial mesoderm, and the process of somitogenesis, which involves waves of cycling gene expression, has been studied extensively in chick embryos (Pourquie, 2004). Prospective paraxial mesoderm cells emerge from the primitive streak during gastrulation (Psychoyos and Stern, 1996) and follow a stereotypical migration trajectory towards their destination (Yang et al., 2002; Iimura et al., 2007). As the body axis elongates, bi-potential neuromesodermal progenitors (NMP) located in the tailbud continue to generate paraxial mesoderm and cells of the neural tube (Wilson et al., 2009; Henrique et al., 2015; Wymeersch et al., 2021). The dynamics of this specialised cell population has been mapped in detail in chick embryos (Guillot et al., 2021) and it has been shown that the extension of neural and paraxial mesoderm tissues in the embryonic body is coordinated by mechanical interactions (Xiong et al., 2020).
Somite differentiation proceeds along the posterior-to-anterior axis and serves as a paradigm for the study of cell fate specification. Multiple signals from surrounding tissues are integrated by somite cells to produce the lineages of the musculoskeletal system, including chondrocytes of the axial skeleton and skeletal muscles of the trunk and limbs (Brent and Tabin, 2002; Christ et al., 2007; Christ and Scaal, 2008). Cell fate specification is intimately linked to stereotypic morphological changes resulting in somite compartmentalisation. For example, tracking of GFP-labelled cells showed that the dorsal dermomyotome produces the myotome layer in multiple waves, with the first myocytes specified adjacent to the neural tube (Gros et al., 2004). Live-imaging of cellular rearrangements examined the morphological transformations of somites, from epithelial structures to somites with a mesenchymal sclerotome, located ventrally, and an epaxial myotome abutting the neural tube (McColl et al., 2018). This uncovered differential cell sizes and regions of proliferation as well as a directed movement of dermomyotomal progenitor cells towards the rostro-medial domain of the dermomyotome, where skeletal muscle formation initiates.
To better characterise the regulation of these morphogenetic events and their integration with cell specification and differentiation, we previously used bulk sequencing to assess the dynamic changes of the transcriptome and of chromatin accessibility across presegmented mesoderm and early, maturing and differentiating somites (Mok et al., 2021). Associating differentially accessible chromatin with nearby genes, differentially expressed along the axis, identified candidate cis-regulatory elements (CREs) involved in expression of transcription factors important for somite formation and differentiation. Time-lapse microscopy in accessible chick embryos of fluorescent CRE-reporters revealed their spatio-temporal activity, and mutation analysis uncovered some upstream regulators. Similarly in mice, we examined matched gene expression and open chromatin profiles for newly formed somite pairs across a developmental time series. This provided a high-resolution view of the molecular signatures underlying the conserved maturation programme followed by all somites after segmentation (Ibarra-Soria et al., 2023).
Here we focus on the initial phase of trunk development in chick embryos. This complements recent in vitro organoid models of axis elongation, which are based on the differentiation of mouse or human pluripotent stem cells and use pharmacological activation or inhibition of crucial signalling pathways (Veenvliet and Herrmann, 2021). These protocols generate self-organising structures including gastruloids (Turner et al., 2017; Moris et al., 2020), trunk-like structures (Veenvliet et al., 2020), somitoids (Sanaki-Matsumiya et al., 2022), or axioloids (Yamanaka et al., 2023). These structures often comprise mesoderm, including somites, although the notochord, which is involved in patterning of trunk tissues, is missing. Thus, it is important to reconstruct the molecular profiles and cellular composition in the native tissues.
Here, we use single cell transcriptomics combined with an RNA-tomography based approach, analogous to Tomo-seq (Junker et al., 2014; Kruse et al., 2016) but using a modified G&T-seq approach (Macaulay et al., 2015). This generated a spatio-temporal map of the emerging trunk and identified genes not previously known to be involved in pre-somitic/pre-segmented mesoderm (psm) and somite maturation. Our study complements data in chick embryos, from earlier developmental stages (HH4-HH11) (Vermillion et al., 2018; Williams et al., 2022; Rito et al., 2023), from tailbud (Guillot et al., 2021) and from prospective neural plate, neural plate border and non-neural ectoderm (Trevers et al., 2023). The dataset is relevant for cell type specification during early body formation and may provide insights into the molecular genetics that underlie diseases of the musculoskeletal system.
Results
Single cell profiling of the developing chick embryonic body
To investigate the molecular basis underpinning somitogenesis and axis elongation of the growing chick body, we mapped the transcriptomes of individual cells at embryonic stage HH14 (Hamburger and Hamilton, 1992) (Figure 1A). This stage embryo has 22 somites, including cervical level somites (6–19) and thoracic level somites (20–22). The unsegmented paraxial mesoderm and tailbud comprise prospective somites of the thoracic, lumbar and sacral regions (Weldon and Munsterberg, 2022). Single cell suspensions from the posterior part of five pooled embryos included the extraembryonic region, tailbud, pre-somitic mesoderm and the most recently formed six somites (Figure 1B). Following enzymatic digestion and mechanical dissociation the suspension was processed using the 10X Genomics Chromium. A total of 6158 cells were sequenced with a median of 517 genes and 900 UMIs per cell.
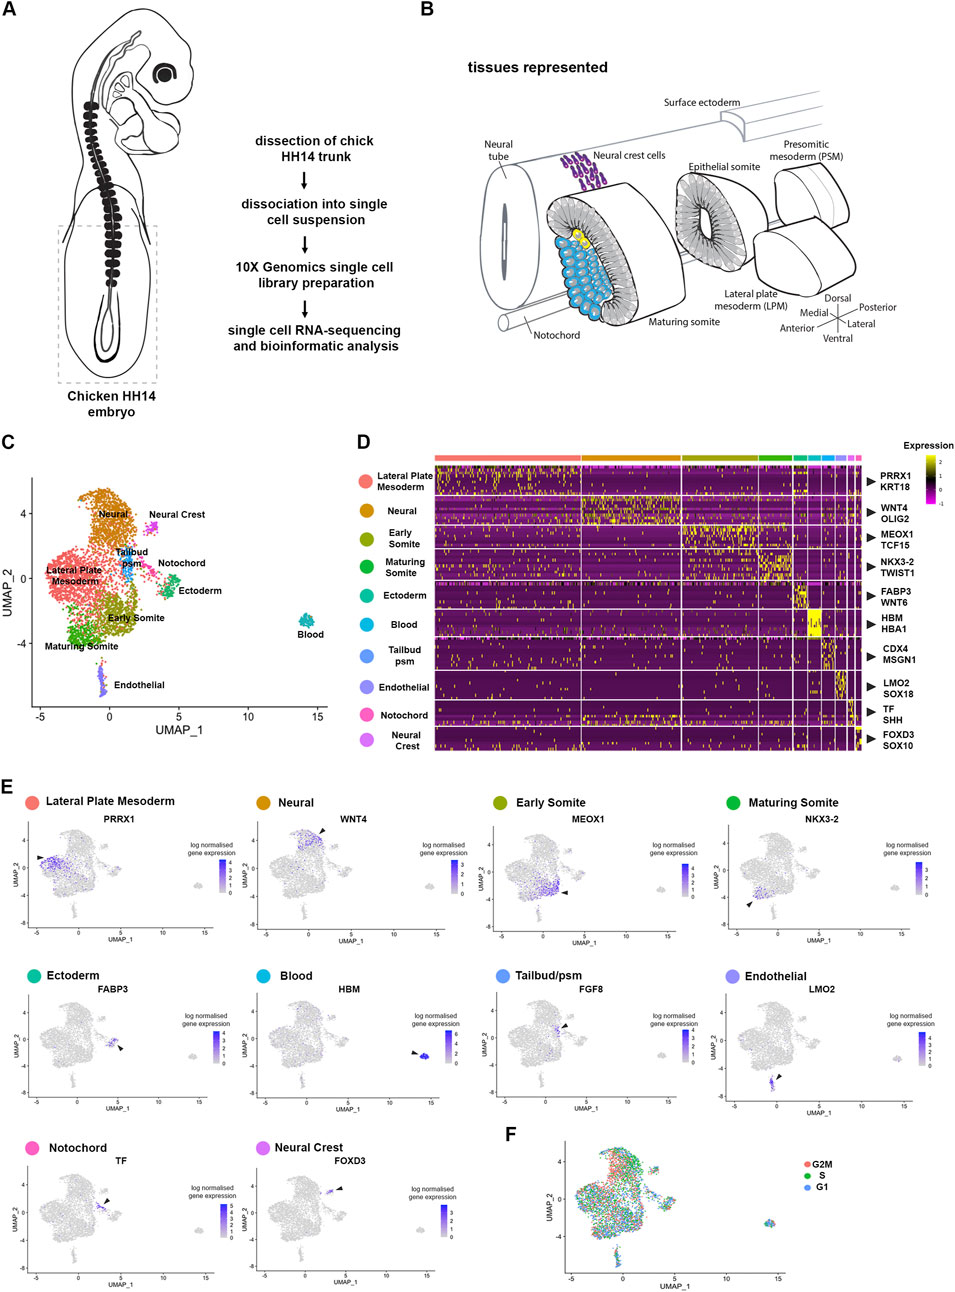
Figure 1. Cell population composition and signatures of the HH14 chicken embryo trunk. (A) Trunk regions, indicated by stippled lines, of five stage HH14 chicken embryos were collected for scRNA-seq using 10X Genomics Chromium. (B) Illustration of developing tissues captured: pre-somitic mesoderm (psm), epithelial somites, maturing somites, lateral plate mesoderm (lpm), surface ectoderm, neural tube and neural crest cells, and notochord. (C) Unsupervised UMAP subdivides cells within the trunk into 10 clusters—lateral plate mesoderm, neural progenitors, early somite, maturing somite, pre-somitic mesoderm, ectoderm, blood progenitors, endothelial progenitors and neural crest. (D) Heatmap of the top 10 genes significantly enriched in each cluster; representative genes are shown. (E) UMAPs show log normalised counts of a representative gene for each cluster. Colour intensity is proportional to expression level of each gene. (F) Distribution of cell cycle phases visualised using Seurat cell cycle scoring.
Unsupervised clustering was used to classify cell populations (Butler et al., 2018). Projection onto UMAP plots revealed 10 separate clusters (Figure 1C). These clusters were characterised by expression of classic marker genes, which assigned cluster identity and tissues. These included for the lateral plate mesoderm (Prrx1 and Krt18) (Bell et al., 2004), for neural cells (Wnt4 and Olig2) (Cauthen et al., 2001; Zhou et al., 2001), for epithelial somites (Meox1 and Tcf15) (Stockdale et al., 2000; Reijntjes et al., 2007; Berti et al., 2015), for maturing somite (Nkx3-2 and Twist1) (Nielsen et al., 2001; Tavares et al., 2001), for ectoderm (Fabp3 and Wnt6) (Schubert et al., 2002), for blood (Hbm and Hba1), for endothelial cells (Lmo2 and Sox18) (Minko et al., 2003; Jaffredo et al., 2005; Javerzat et al., 2009; Anderson et al., 2019), for tailbud/pre-segmented mesoderm (Cdx4 and Msgn1) (Joshi et al., 2019), for notochord (Tf and Shh) (Lobjois et al., 2004; Yanai et al., 2005) and for neural crest cells (FoxD3 and Sox10) (McKeown et al., 2005) (Figures 1C, D). Seurat cell cycle scoring determined cell cycle activity. This showed overall the cell clustering was not due to cell cycle phase, although neural cells were predominantly in S phase and G2M phase (Figure 1F).
RNA-tomography profiling of the developing chick embryonic trunk
Spatial information is lost in single cell sequencing data following tissue dissociation (Griffiths et al., 2018). To address this, we next used RNA-tomography to quantify the transcriptomes of a series of individual cryogenic sections along the HH14 embryonic trunk (Figures 2A, B). This enabled a systematic investigation of spatial RNA profiles along the axis and allowed us to resolve the anterior to posterior dimension. Libraries were generated from 20 micron consecutive cryosections of a HH14 chick embryo. Each section was collected into lysis buffer and mRNA captured and amplified using a modification of the G&T-seq protocol (Macaulay et al., 2015). This method allows separating genomic DNA (G) and full-length mRNA (T) from the same sample. Here, we focussed on sequencing transcriptomes. The resulting cDNA libraries had high complexity and enabled us to confidently determine spatial gene expression along the axis (Figure 2C).
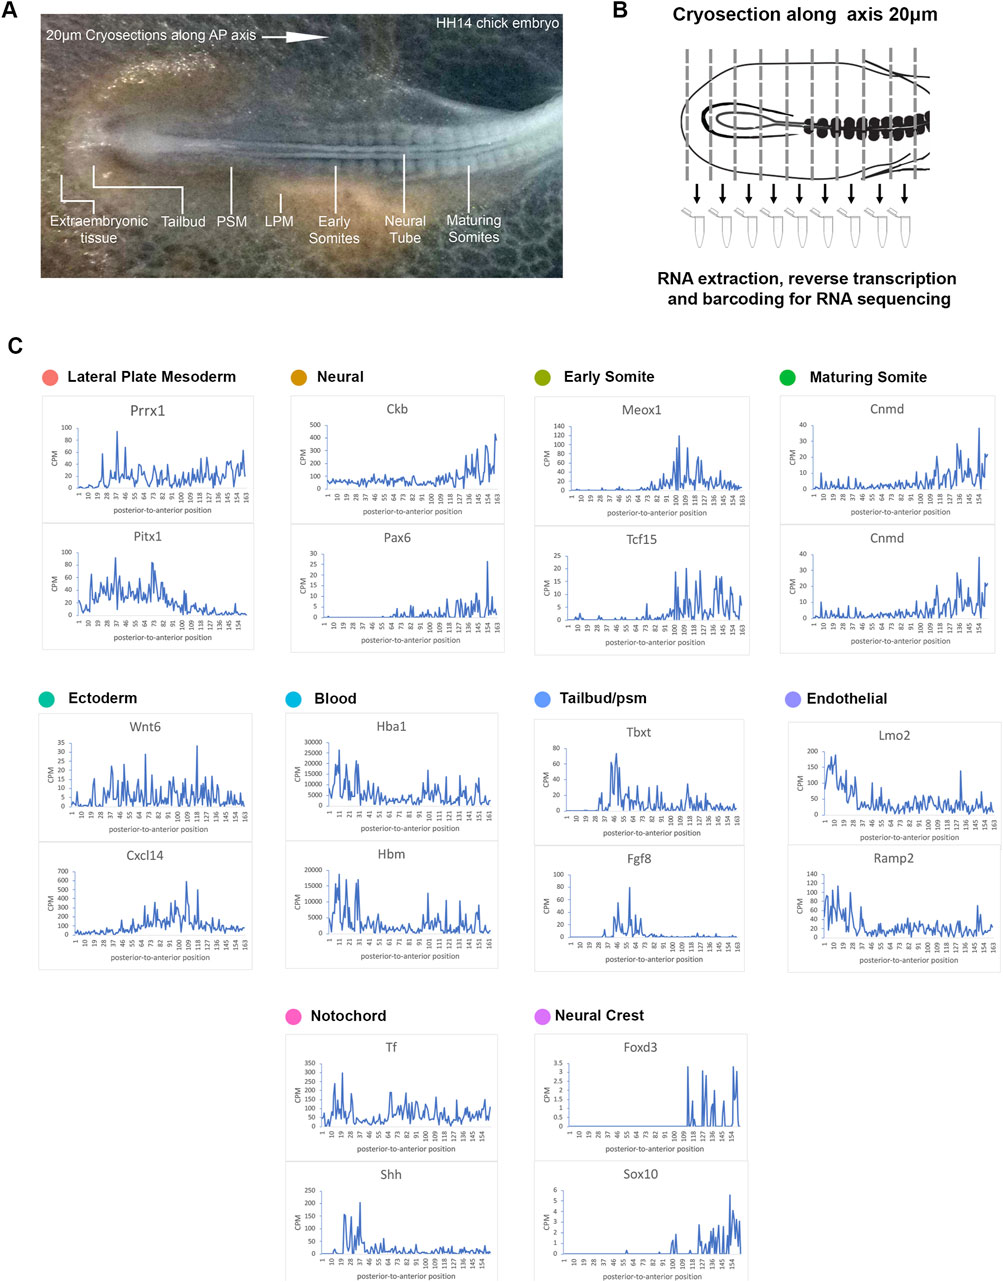
Figure 2. RNA-tomography reveals distinct gene expression profiles along the embryonic axis. (A) Stage HH14 chick embryo trunk was sectioned along the anterior-to-posterior axis, from extraembryonic tissue at the posterior end, through the tailbud and pre-somitic mesoderm towards maturing somites. (B) Individual sections were collected in wells followed by RNA isolation and cDNA preparation using section specific barcodes. After that, samples were pooled for linear amplification and sequence library preparation. (C) Spatial expression traces are shown as line plots, left to right represent the posterior to anterior positions. The representative genes shown correspond to the tissue types identified from the scRNA-seq clustering.
Using the same markers as in the previous scRNA-seq analysis (Figures 1C–E), we identified 10 different clusters and established profiles of the lateral plate mesoderm, neural tissue, early somite, maturing somite, ectoderm, blood, endothelial, tailbud, notochord and neural crest cells (Figure 2C). Line graphs indicate spatial patterns of localised anterior-to-posterior restricted gene expression. These were evident for all tissue types with exception of the ectoderm, suggesting that this tissue has few distinguishing markers along the A-P axis. In the most posterior samples, we identified blood (Hbm, Hba1) and endothelial marker genes (Lmo2 and Ramp2), consistent with this region comprising extra-embryonic tissue (Minko et al., 2003; Jaffredo et al., 2005; Javerzat et al., 2009; Anderson et al., 2019). Subsequent sections showed the onset of tailbud genes [T (=brachyury) and Fgf8] (Dubrulle et al., 2001). Some notochord markers were more highly expressed in posterior sections (Shh), while transferrin (Tf) was expressed along the axis, with lower levels around the tailbud region (Riddle et al., 1993; Yanai et al., 2005). Across neural tissue (Ckb, Pax6) (Bhattacharyya et al., 2004; Roy et al., 2013), early somites (Meox1, Tcf15) (Stockdale et al., 2000; Reijntjes et al., 2007; Berti et al., 2015) and maturing somites (Cnmd, Shisa2) (Filipe et al., 2006; Shukunami et al., 2008), gene expression profiles showed a gradual increase towards the anterior. Neural crest cells are beginning to migrate and become distinguishable in the more anterior sections with discreet profiles detected for FoxD3 and Sox10 (McKeown et al., 2005) (Figure 2C).
RNA-tomography resolves mRNA localisation patterns
To identify gene expression patterns systematically, we clustered the spatial gene expression data based on a self-organising heatmap. This sorted the cumulative gene expression traces along a linear axis of 180 profiles and identified 3 major groups of localised mRNA (Figure 3A). The first group of transcripts localised to the most posterior, the second group displayed an increase in the tailbud region and across the pre-somitic mesoderm, and the third group was most highly expressed in the anterior sections comprising epithelial and maturing somites (Figure 3B). Transcripts enriched posteriorly (e.g., Hbm, Epas1, and Lmo2) (Minko et al., 2003; Ota et al., 2007; Anderson et al., 2019) were related to Gene Ontology (GO) terms such as hematopoiesis, erythrocyte differentiation and myeloid homeostasis, consistent with the presence of extraembryonic blood islands (Figure 3C). The second profile showed genes enriched for GO processes such as anterior-posterior pattern specification, embryo morphogenesis and tissue morphogenesis. This overlaps spatially with tailbud and pre-somitic regions. Markers with enriched expression included Wnt5a, Msgn1, Tbx6, and Fgf8 (Dubrulle et al., 2001; Bell et al., 2004; Sweetman et al., 2008) (Figure 3C). The third profile, which overlaps with the formation of somites but also neural tube development, included genes enriched for pattern specification, neurogenesis and animal organ morphogenesis, such as Meox1, Aldh1a2, and Shisa2 (Filipe et al., 2006; Reijntjes et al., 2007) (Figure 3C). Interestingly, the profiles for somites and neural tube are very similar and genes were clustered together, suggesting these tissues mature at a similar rate along the anterior-posterior dimension examined here. However, GO analysis did separate genes associated with generation and differentiation of neurons (Figure 3C). The genes listed for the GO terms, neurogenesis and pattern specification, in k-means cluster 3 are shown in Supplementary Table S1. They include neural markers, such as Wnt4, Nkx6.2, and paraxial mesoderm markers, such as Meox1, Tcf15, and Nkx3.2.
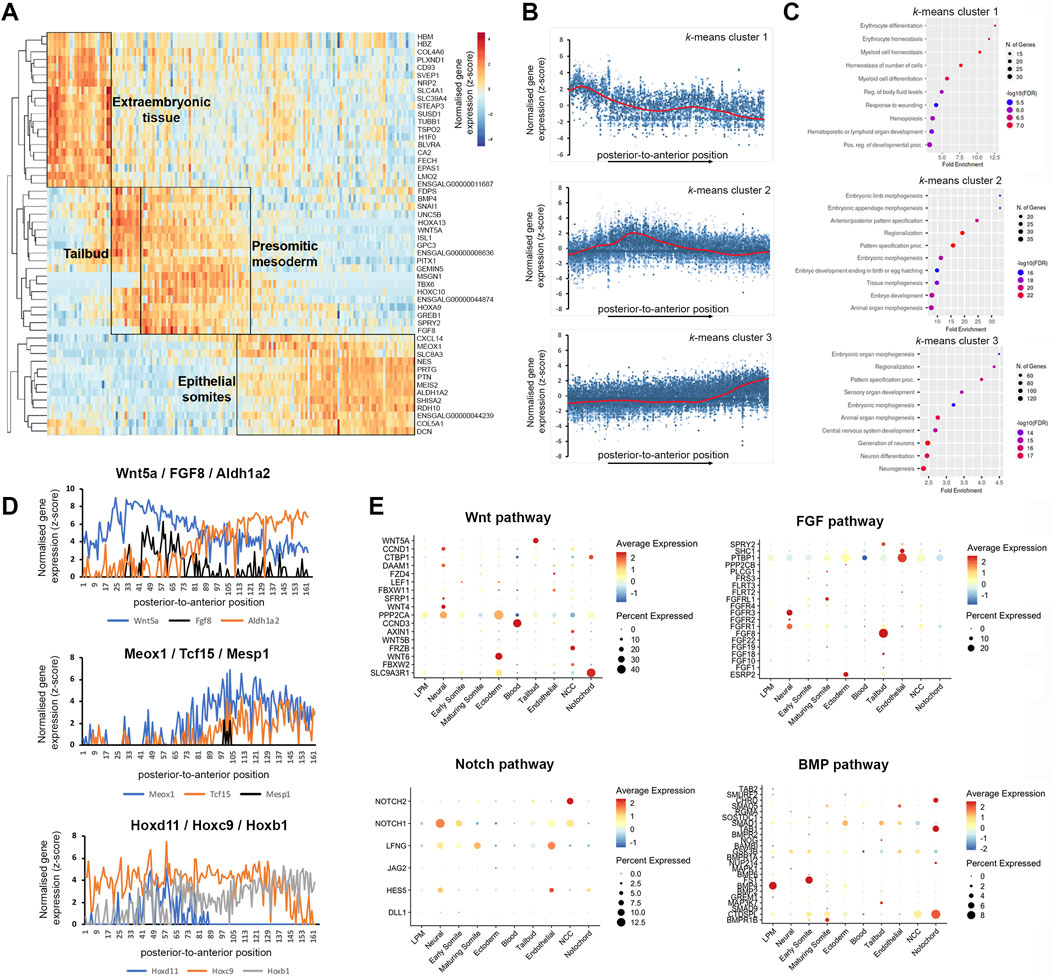
Figure 3. K-means clustering identifies biological components along the posterior-to-anterior axis. (A) Hierarchical cluster analysis of gene expression per section (total 180). Distinct gene expression clusters correspond to different regions along the axis, characterised by extraembryonic tissue, tailbud, pre-somitic mesoderm and epithelial somites—indicated by boxed areas. RNA sequencing reads per gene were normalised against the total read count per section. (B) Spatial expression traces for representative genes in each corresponding cluster, left to right represent the posterior to anterior positions. Cluster 1 represents extraembryonic tissue, cluster 2 tailbud and psm, cluster 3 epithelial somites. (C) Gene ontology on genes enriched in the extraembryonic tissue, tailbud and pre-somitic mesoderm, and epithelial somites and neural tube. (D) Spatial expression traces for signalling pathways associated with anterior-posterior patterning such as WNT (Wnt5A), FGF (Fgf8) and retinoic acid (Aldh1A2), which are expressed in opposing gradients. Spatial expression traces for genes associated with paraxial mesoderm differentiation (Meox1, Tcf15, and Mesp1), with Mesp1 highlighting a discreet region in the psm. Spatial expression traces for Hox genes involved in anterior-posterior patterning (Hoxd11, Hoxc9, and Hoxb1). Expression of Hoxd11 and Hoxc9 displays a clear boundary within the axial region sectioned, while Hoxb1 expression remains high. Line plots for the other Hox genes are in Supplementary Figure S1. (E) Dot plot showing average expression of genes and percentage expressed in each cell cluster associated with the WNT, FGF, NOTCH, and BMP signalling pathways.
RNA-tomography also detected the known opposing gradients across the psm and somites of Wnt5a, FGF8, which are increased posteriorly, versus Aldh1a2, increasing anteriorly and encoding an enzyme involved in retinoid acid synthesis (Olivera-Martinez and Storey, 2007). This is shown in line graph representation of gene expression along the axis (Figure 3D). The transcripts for Meox1 and Tcf15 become upregulated in anterior psm and epithelial somites, whereas Mesp1 transcripts are restricted to an anterior region in the psm, comprising the next but one prospective somite (Figure 3D). Transcripts for Hoxd11, Hoxc9 and Hoxb1 show the expected expression boundaries along the anterior-posterior axis (Figure 3D). Line plots for the members of all four Hox clusters, A–D, show the expected expression cut-off along the axis (Supplementary Figure S1). The expression profiles detected by RNA-tomography for anterior Hox gene expression boundaries and epithelial somite marker genes were in agreement with our previous bulk RNA-seq analysis of paraxial mesoderm tissues (Mok et al., 2021).
Furthermore, the spatial resolution provided by the RNA-tomography overlapped with scRNA-seq expression of components of important signalling pathways (Figure 3E). For example, analysis of WNT and FGF pathways, shows high levels of Wnt5a and Fgf8 in tailbud cells, whilst the receptors, Fgfr1 and Fgfr3, were highly expressed in neural cells (Figure 3E). We detected high levels of Wnt6 in the ectoderm and of Wnt4 in neural cells, consistent with their known expression (Cauthen et al., 2001; Schubert et al., 2002). In addition, the analysis highlighted expression of protein phosphatase, PPP2CA and scaffold protein, SLC9A3R1 in ectodermal cells (Figure 3E). Analysis of NOTCH and BMP pathways confirmed expression of the Notch1 receptor, the glycosyltransferase, Lfng, and the Hes5 transcription factor in neural cells, while neural crest cells expressed Notch1 and Notch2 receptors. The Bmp4 ligand is highly expressed in the lateral plate, while its antagonists follistatin (Fst) and chordin (Chrd) are expressed in early somite and notochord respectively. Expression of the receptor, Bmpr1b increases in maturing somites (Figure 3E).
Correlation of single cell RNA-sequencing with RNA-tomography
Axis patterning is characterized by the progressive differentiation of cell types with anterior-to-posterior identity. To validate genes identified in specific clusters obtained from the single cell RNA-sequencing, we correlated spatial patterns and confirmed gene expression by in situ hybridisation. This provides a visual point of reference for the tomography sections. Expression of Hbm, a haemoglobin gene, is representative for the most posterior group of transcripts, which is enriched for genes involved in hematopoietic differentiation. Consistent with the line graph, we confirm that Hbm transcripts are restricted to blood islands in posterior extraembryonic tissue (Figure 4A). The second spatial cluster values correlate with the tailbud and pre-somitic mesoderm. We validated this data using Wnt5a, which is expressed in the posterior regions at these stages (Baranski et al., 2000) where it regulates cell movement behaviour during axis elongation (Sweetman et al., 2008). In situ hybridisation confirmed that Wnt5a expression was restricted to the tailbud region (Figure 4B), where neuromesodermal progenitor (NMP) cells are located. The third spatial cluster, where gene expression increased towards the anterior, was validated using Tbx22—a key gene for somite boundary formation. Expression of Tbx22 was restricted to caudal somite domains resulting in an in situ signal with periodicity (Figure 4C). All three markers are well characterised (Bell et al., 2004) and help to benchmark the line plots.
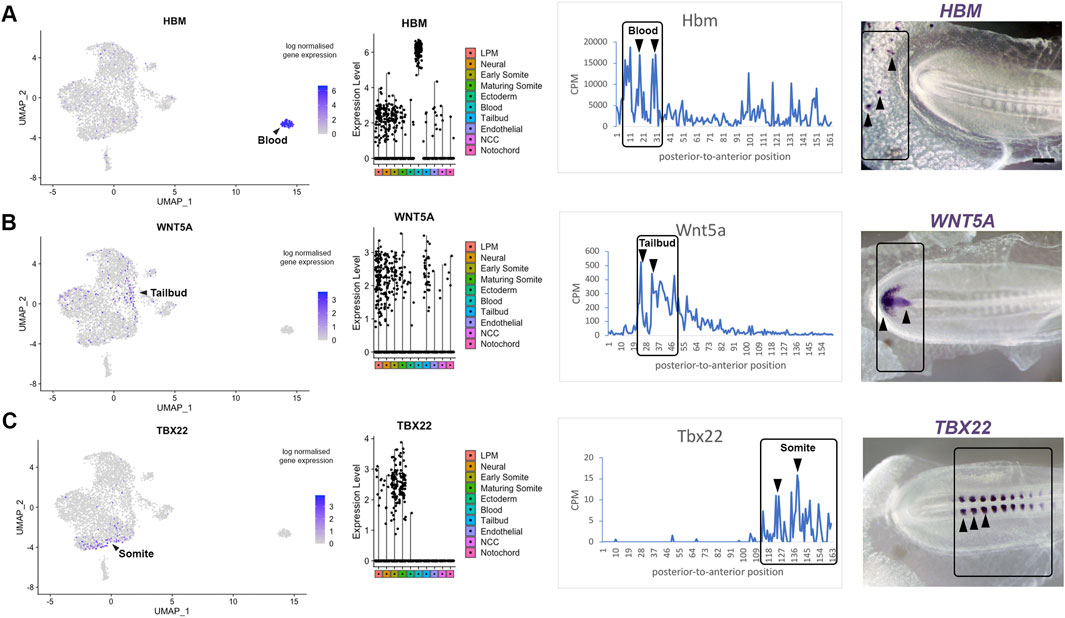
Figure 4. Transcriptome map of the embryonic trunk with high spatial resolution. (A–C) UMAP plot and violin plot of representative genes for different tissues, with comparison to Spatial expression trace along the posterior-to-anterior axis. The colour coding in the violin plots corresponds to the clusters identified in the scRNA-seq. Corresponding in situ hybridisation are shown for (A) Hbm—blood islands, (B) Wnt5A—tailbud, (C) Tbx22—caudal somite halves. This provides a visual point of reference when comparing with the spatial expression along the axis shown by the line plots. See also published gene expression patterns in the data base: http://geisha.arizona.edu/geisha/.
Identification of new genes in paraxial mesoderm and somites
Next, we investigated previously unexplored genes uncovered by our approach. We focused on candidates likely to display restricted expression in the pre-somitic mesoderm and somites. Using the subset feature in Seurat, we profiled three clusters from the scRNA-seq dataset—tailbud, early somite and maturing somite (Figure 5A). We re-ran the clustering, findneighbours and pca tests on this new Seurat object. Classic markers for each cluster were re-plotted on UMAPs, such as Msgn1 for the pre-somitic mesoderm, Meox1 and Tcf15 for early somites and Tbx22 for maturing somites (Figure 5A). Sub-clustering revealed restricted expression of follistatin (Fst), in a group of cells potentially representing myogenic cells located in the dorsal part of epithelial somites (Nimmagadda et al., 2005). We identified three genes for further analysis. UMAP plot of Olfml3 and Foxd1 gene expression suggested they are likely to be expressed in maturing somites, whereas Lrig3 was predicted to be expressed in some pre-somitic mesoderm cells, early somites and less in maturing somites (Figure 5A).
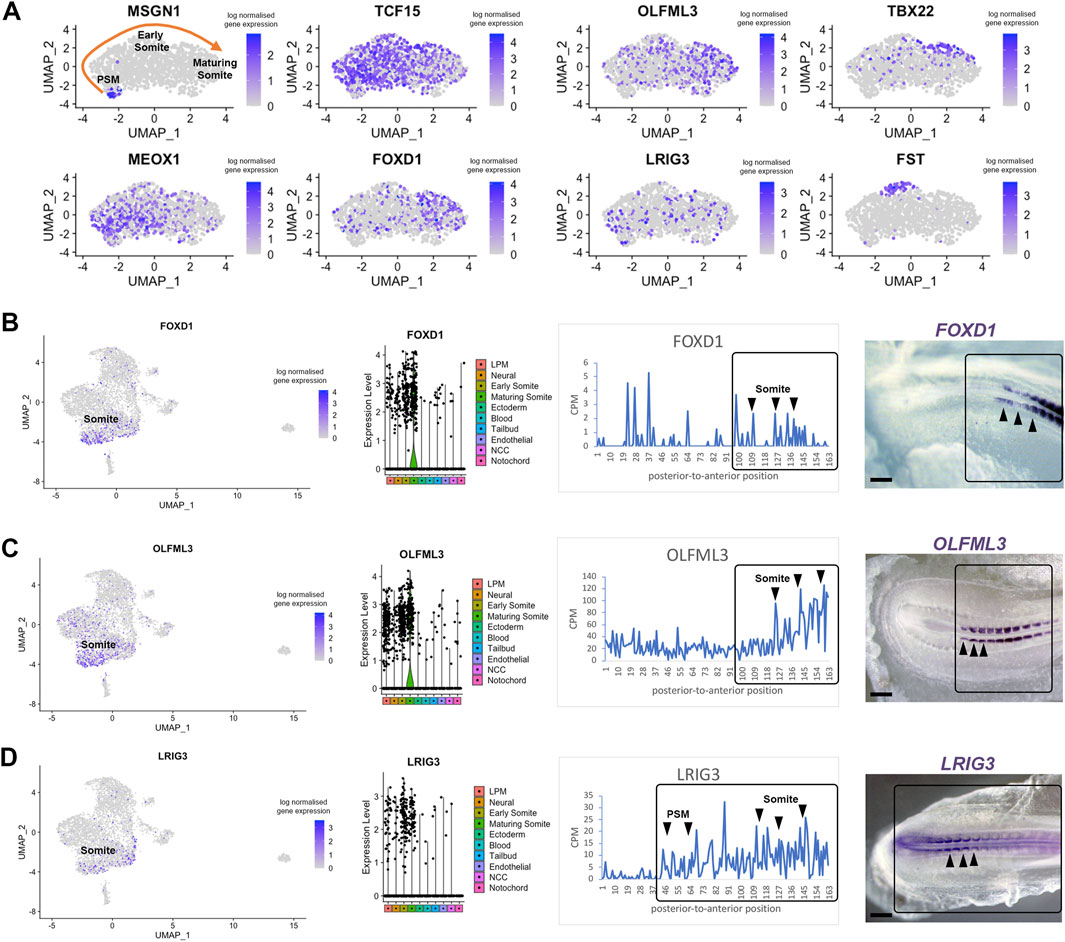
Figure 5. Differentially expressed genes in pre-somitic mesoderm and somites. (A) Sub-clustering identifies specific genes within the psm, early somites and maturing somites. Psm is characterised by MSGN1 expression while Tcf15, Meox1 and Tbx22 markers represent somites. Restricted Fst expression may correlate with epaxial myoblasts. (B–D) UMAP, violin plots and spatial expression traces show expression for Foxd1, Olfml3 and Lrig3, not previously identified in somites. The colour coding in the violin plots corresponds to the clusters identified in the scRNA-seq. Violin plots show higher levels of expression in maturing somites for Foxd1 and Olfml3 and a broader distribution for Lrig3. Whole mount in situ hybridisation confirmed the spatially restricted expression of Foxd1 and Olfml3 in epithelial and maturing somites and of Lrig3 in the psm and somites.
Interrogation of the profiles for these genes in the RNA-tomography data showed that expression of Foxd1 and Olfml3 increased towards the anterior regions, with some Foxd1 expression peaks posteriorly. Foxd1 and Olfml3 were identified in spatial cluster 3 (Figure 3). For Lrig3, the spatial data showed increasing expression from the most posterior to the anterior embryonic regions, suggesting that it is expressed from the tailbud to maturing somites. Spatial validation for all three genes by in situ hybridisation in essence confirmed these observations: Foxd1 and Olfml3 are restricted to somites whilst Lrig3 is expressed in the tailbud, pre-somitic mesoderm and in somites. In epithelial somites, all three genes are restricted medially. In maturing somites Foxd1 is broadly expressed, Olfml3 remains medially restricted and Lrig3 is downregulated (Figures 5B–D). We did not detect any posterior expression of Foxd1 by in situ hybridisation, despite the signal in the line plot.
Discussion
The chick embryo is a classic model for developmental biology studies due to the versatility of in vivo experimental approaches (Stern, 2005; Sauka-Spengler and Barembaum, 2008; Gandhi and Bronner, 2018). For example, it has served to better understand the processes of body axis formation, segmentation/somitogenesis and differentiation (Benazeraf and Pourquie, 2013). Here we use single cell transcriptomics and RNA-tomography spatial transcriptomics to map cells that arise in the emerging trunk as it extends. This adds to the growing body of literature, which includes scRNA-seq data of the chick embryo from primitive streak to neurula stages (Vermillion et al., 2018; Williams et al., 2022). Previous work from other labs characterised the molecular signature of neuromesodermal progenitors (NMP) in detail by micro-dissecting anterior PS in stage HH5 and in 6-somite embryos (HH9-) as well as the tail bud of 35-somite embryos (∼HH18) (Guillot et al., 2021). We did not detect NMPs, which are characterised by co-expression of T-brachyury and Sox2 (Wilson et al., 2009; Henrique et al., 2015; Wymeersch et al., 2021), as a discreet population. This is most likely due to the number of cells sequenced. A recent report examined the anterior most part of the main body axis, including occipital and cervical somites at several stages of development, 4-somites, 7-somites, 10-somites and 13-somites (Rito et al., 2023). This scRNA-seq data identified similar cell populations when the body extends and the cervical-thoracic region forms (HH14, 22-somite embryo) and is in agreement with our data presented here.
Furthermore, we show that a combined analysis of scRNA-seq data with RNA-tomography spatial transcriptomics can reveal novel genes involved in specific aspects of axis extension. As an example, we focused on paraxial mesoderm and discovered the previously unknown relevance of Foxd1, Olfml3 and Lrig3 in developing somites. All three genes showed restricted expression in the medial somite domain suggesting a possible role in early myoblasts, however, this remains to be confirmed with functional approaches, such as gain- and loss-of function experiments. It is noteworthy that Foxd1, a member of the fork-head family of transcription factors, is associated with pluripotency and seems to be required for successful reprogramming (Koga et al., 2014). In addition, Foxd1 protects senescence in human mesenchymal stem cells (hMSC) and is regulated by YAP (Fu et al., 2019). Interestingly, RNA-tomography line graphs indicated Foxd1 expression peaks posteriorly, where progenitors reside. However, this was not confirmed by in situ hybridisation. The reason for this is unclear and could be due to the sensitivity of those different approaches. Not much is known about Olfml3 function in development. It is a secreted glycoprotein of the Olfactomedin-family, which organises the extracellular matrix and has pro-angiogenic properties. Olfml3 deficient mice exhibit abnormalities in the vasculature causing lethality (Imhof et al., 2020). Olfml3 has also been implicated in pre-natal muscle development in pig (Jin and Li, 2019) and in Xenopus it is involved in dorso-ventral patterning by enhancing chordin degradation (Inomata et al., 2008). Finally, Leucine-rich repeats and immunoglobulin-like domains 3 (Lrig3) plays a role in neural crest development (Zhao et al., 2008) in Xenopus. This is consistent with studies in mice, which showed Lrig3 is involved in inner ear morphogenesis by restricting the expression of Ntn1 (Abraira et al., 2008). However, the roles of these genes in developing somites have not yet been investigated.
RNA-tomography is a spatial transcriptomics approach first used in zebrafish embryos (Junker et al., 2014; Kruse et al., 2016). We modified and automated the approach using the G&T-seq protocol (Macaulay et al., 2015) and applied it to the posterior half of a HH14 whole embryo, along the main body axis dimension. As reported previously in the zebrafish heart (Wu et al., 2016; Burkhard and Bakkers, 2018), we obtained high spatial resolution and sensitivity as shown by hierarchical cluster analysis. Known marker genes were expressed in the anticipated spatio-temporal patterns and identified the appropriate regions along the body axis. The extraembryonic tissue was characterized by Hbm, Hbz, Lmo2 and Epas1, the tailbud region by Hoxa13, Wnt5A, the presegemented mesoderm by Msgn1, Tbx6 and epithelial somites by Meox1 and genes involved in retinoic acid (RA) signalling.
This study combines scRNA-seq with spatial information from RNA-tomography improving our understanding and validating the gene expression patterns within the avian elongating body axis and tailbud. While the scRNA-seq provides information on gene expression at the single-cell level, combining it with RNA-tomography bulk sequencing of cryosections allows preservation of the spatial context of gene activity along the anterior-posterior axis. Other technologies are now available for obtaining high-resolution spatial transcriptional profiles of tissues, such as MERFISH, 10X Genomics Visium and Xenium, although these also do not necessarily capture cellular resolution or multiple axial dimensions. Furthermore, all these approaches are more costly to implement, specifically with multiple samples as used here to reveal gene dynamics along the anterior-to-posterior axis. Overall, our results illustrate how combining different approaches can be advantageous when addressing fundamental questions in embryonic development.
Materials and methods
Chicken embryos
Fertilised chicken eggs (Henry Stewart & Co.) were incubated at 37°C with humidity. Embryos were staged according to (Hamburger and Hamilton, 1992). All experiments were performed on chicken embryos younger than two-thirds of gestation and therefore were not regulated by the Animal Scientific Procedures Act 1986.
Preparation of single cells from chicken embryos
The trunk of HH14 embryos were dissected into Ringer’s solution in silicon lined petri dishes and pinned down using the extra-embryonic membranes. Embryonic tissue was transferred into low binding tubes and Ringer’s solution was replaced with Dispase (1.5 mg/mL) in DMEM 10 mM HEPES pH7.5 at 37°C for 7 min prior to treatment with Trypsin (0.05%) at 37°C for 7 min. The reaction was stopped with Ringer’s solution with 0.25% BSA. Cells were spun down and resuspended in Hank’s solution prior to passing through 40 μm cell strainer to obtain single cell suspension.
scRNA-seq library preparation
A suspension of approximately 10,000 single cells was loaded onto the 10X Genomics Single Cell 3′ Chip. cDNA synthesis and library construction were performed according to the manufacturer’s protocol for the Chromium Single Cell 3′ v2 protocol (PN-12033, 10X Genomics). Samples were sequenced on Illumina HiSeq 4,000 100 bp paired-end runs.
scRNA-seq data analysis
Cell Ranger 3.0.2 (10X Genomics) was used to de-multiplex Illumina BCL output, create fastq files and generate single cell feature counts for the library using the Gallus gallus transcriptome (Ensembl release 94) with 82.4% reads mapped to the genome. Subsequent processing was performed using the Seurat v3.1.0 (Butler et al., 2018) package within R (v3.6.1). Cell quality was assessed using simple QC metrics: total number of expressed genes, mitochondrial RNA content and ribosomal RNA content. Identification of chicken mitochondrial RNA content and ribosomal RNA content. Outlier cells were identified if they were above or below three median absolute deviations (MADs) from the median for any metric in the dataset. Data was normalised across all cells using the “LogNormalize” function with a scale factor of 1e4. A set of genes highly variable across the cells was identified using the ‘FindVariableGenes’ function (using “vst” and 2000 features) before being centred and scaled using the “ScaleData” function with default parameters. PCA analysis was performed on scaled data using variant genes and significant principal components were identified by plotting the standard deviation of the top 50 components. The first 2 principal components showed high enrichment for mitochondrial genes and were subsequently regressed and only principal components 3:25 were used to create a Shared Nearest Neighbour (SNN) graph using the “FindNeighbours” function with k.param set to 10. This was used to identify clusters of cells showing similar expression profiles using the FindClusters function with a resolution set to 0.6. The Uniform Manifold Approximation and Projection (UMAP) dimensional reduction technique was used to visualise data from principal components 3:26 in two-dimensional space (“RunUMAP” function). Graphing of the output enabled visualisation of cell cluster identity and marker gene expression. Biomarkers of each cluster were identified using Wilcoxon rank sum tests using Seurat’s “FindAllMarkers” function. It was stipulated that genes must show a logFC of at least 0.01 to be considered for testing. Only positive markers were reported. The expression profile of top markers ranked by average logFC were visualised as heatmaps and dotplots of the scaled data. Cluster identity was determined using visual inspection focussing on the expression of known marker genes. For cells identified in tailbud and somite clusters, the “Subset” function was used to create a new Seurat object which narrowed down to 1,359 cells. Using the “FindNeighbors” feature with dimensions set to 3:20, “FindClusters” resolution of 0.4 and “RunUMAP” set with dimensions 3:16.
RNA sequencing from serial sections—RNA-tomography
Embryos were embedded in Jung tissue freezing medium (Leica), orientated and rapidly frozen on dry ice, and stored at −80°C prior to cryosectioning. Embedded embryos were cryosectioned at 20 μm thickness, collected into 96-well plates (on ice) prior to the addition of 10 μL of RLT plus lysis buffer (Qiagen, Hilden, Germany). All instruments and surfaces were cleaned with 80% v/v ethanol, RNAse-free water and lastly RNAse-out solution after each sample to reduce cross-contamination and RNA degradation. Samples were stored at −80°C until cDNA preparation using the G&T-seq method as previously described (Macaulay et al., 2015) with minor modifications to accommodate the larger volume of lysis buffer. The polyA mRNA capture step of the G&T-seq protocol was used, which enables automated and parallel capture and amplification of RNA from serial sections. The genomic DNA component was not analysed in this study. cDNA was normalised to 0.2 ng/μL before Nextera (Illumina, San Diego, CA, United States) library preparation in a total reaction volume of 4 μL. Libraries were pooled by volume and sequenced on a single lane on the Illumina HiSeq 2,500 (150-bp paired-end reads).
Low-input RNA sequencing analysis
For RNA-seq analysis, we used Refseq version GRCg6a for genome assembly and gene annotation. Reads were trimmed and adapters were removed using tim-galore version 0.4.2. Heatmap based on hierarchical clustering was generated in R-Studio version 1.2.1335 and plotted as a heatmap using the R package DeSeq2 (Love et al., 2014).
Whole mount in situ hybridisation
Whole mount in situ hybridisation using DIG-UTP labelled antisense RNA probes was carried out using standard methods. Probes were generated from amplificons of chicken cDNA using the following primers: Wnt5a (GCAGCACTGTGGACAACAAC/CACCGTCTTGAACTGGTCGT), Olfml3 (GGGAGTTCACGCTCTTCTCG/GATGATCTGGTAGCCGTCGT) Hbm (CATCACACATTGCCACCAG C/GCAGCAATGGTGTCTTTATTGA), Tbx22 (GGATGTTCCCATCGGTCAGG/AGACTTAGCGCTCTT CAGGC), Lrig3 (GTCCTGACGCCTGGGAATTT/AATCTGTGGGACAGGATGCC), Foxd1 (CCCGC ATCTCTAACTGTTAAGGG/ATTAACCCTCACTAAAGGTCCCTCAAGCCTTCTCTGTTC). Briefly, following fixation in 4% PFA embryos were treated with Proteinase K, hybridised with the probe over night at 65°C. After post-hybridisation washed and blocking with BMB (Roche), embryos were treated with anti-DIG antibody coupled to alkaline phosphatase (Merck) and signal developed using NBT/BCIP (Melfords Laboratories).
Data availability statement
The data presented in the study are deposited in the European Nucleotide Archive repository, accession number PRJEB74465 https://www.ebi.ac.uk/ena/browser/view/PRJEB74465.
Ethics statement
The animal study was approved by the AWERB—Animal Welfare and Ethical Review Body. The study was conducted in accordance with the local legislation and institutional requirements.
Author contributions
GM: Conceptualization, Formal Analysis, Investigation, Validation, Visualization, Writing–original draft, Writing–review and editing. ST: Investigation, Writing–review and editing. ES: Investigation, Validation, Writing–review and editing. LM: Investigation, Writing–review and editing. AL: Investigation, Writing–review and editing. JL: Investigation, Writing–review and editing. VU: Data curation, Formal Analysis, Writing–review and editing. WH: Conceptualization, Data curation, Formal Analysis, Funding acquisition, Supervision, Writing–review and editing. IM: Conceptualization, Funding acquisition, Investigation, Supervision, Writing–review and editing. AM: Conceptualization, Funding acquisition, Project administration, Supervision, Writing–original draft, Writing–review and editing.
Funding
The author(s) declare that financial support was received for the research, authorship, and/or publication of this article. The authors acknowledge support from the Biotechnology and Biological Sciences Research Council (BBSRC), part of UK Research and Innovation, BBSRC Core Strategic Programme Grant (Genomes to Food Security) BB/CSP1720/1 and the National Capability BBS/E/T/000PR9816 (NC1—Supporting EI’s ISPs and the UK Community with Genomics and Single Cell Analysis). WH was additionally supported by the BBSRC Grant BBS/E/T/000PR9818. IM was supported by a BBSRC New Investigator Grant BB/P022073/1. ST was supported by the JIC/NRP International Undergraduate Summer School programme. AM acknowledges BBSRC funding (BB/N007034/1) and a NRPDTP studentship for ES.
Conflict of interest
The authors declare that the research was conducted in the absence of any commercial or financial relationships that could be construed as a potential conflict of interest.
The author(s) declared that they were an editorial board member of Frontiers, at the time of submission. This had no impact on the peer review process and the final decision.
Publisher’s note
All claims expressed in this article are solely those of the authors and do not necessarily represent those of their affiliated organizations, or those of the publisher, the editors and the reviewers. Any product that may be evaluated in this article, or claim that may be made by its manufacturer, is not guaranteed or endorsed by the publisher.
Supplementary material
The Supplementary Material for this article can be found online at: https://www.frontiersin.org/articles/10.3389/fcell.2024.1382960/full#supplementary-material
References
Abraira, V. E., Del Rio, T., Tucker, A. F., Slonimsky, J., Keirnes, H. L., and Goodrich, L. V. (2008). Cross-repressive interactions between Lrig3 and netrin 1 shape the architecture of the inner ear. Development 135, 4091–4099. doi:10.1242/dev.029330
Anderson, C., Hill, B., Lu, H. C., Moverley, A., Yang, Y., Oliveira, N. M. M., et al. (2019). A 3D molecular atlas of the chick embryonic heart. Dev. Biol. 456, 40–46. doi:10.1016/j.ydbio.2019.07.003
Baranski, M., Berdougo, E., Sandler, J. S., Darnell, D. K., and Burrus, L. W. (2000). The dynamic expression pattern of frzb-1 suggests multiple roles in chick development. Dev. Biol. 217, 25–41. doi:10.1006/dbio.1999.9516
Bell, G. W., Yatskievych, T. A., and Antin, P. B. (2004). GEISHA, a whole-mount in situ hybridization gene expression screen in chicken embryos. Dev. Dyn. 229, 677–687. doi:10.1002/dvdy.10503
Benazeraf, B., and Pourquie, O. (2013). Formation and segmentation of the vertebrate body axis. Annu. Rev. Cell. Dev. Biol. 29, 1–26. doi:10.1146/annurev-cellbio-101011-155703
Berti, F., Nogueira, J. M., Wohrle, S., Sobreira, D. R., Hawrot, K., and Dietrich, S. (2015). Time course and side-by-side analysis of mesodermal, pre-myogenic, myogenic and differentiated cell markers in the chicken model for skeletal muscle formation. J. Anat. 227, 361–382. doi:10.1111/joa.12353
Bhattacharyya, S., Bailey, A. P., Bronner-Fraser, M., and Streit, A. (2004). Segregation of lens and olfactory precursors from a common territory: cell sorting and reciprocity of Dlx5 and Pax6 expression. Dev. Biol. 271, 403–414. doi:10.1016/j.ydbio.2004.04.010
Brent, A. E., and Tabin, C. J. (2002). Developmental regulation of somite derivatives: muscle, cartilage and tendon. Curr. Opin. Genet. Dev. 12, 548–557. doi:10.1016/s0959-437x(02)00339-8
Burkhard, S. B., and Bakkers, J. (2018). Spatially resolved RNA-sequencing of the embryonic heart identifies a role for Wnt/β-catenin signaling in autonomic control of heart rate. Elife 7, e31515. doi:10.7554/eLife.31515
Butler, A., Hoffman, P., Smibert, P., Papalexi, E., and Satija, R. (2018). Integrating single-cell transcriptomic data across different conditions, technologies, and species. Nat. Biotechnol. 36, 411–420. doi:10.1038/nbt.4096
Cauthen, C. A., Berdougo, E., Sandler, J., and Burrus, L. W. (2001). Comparative analysis of the expression patterns of Wnts and Frizzleds during early myogenesis in chick embryos. Mech. Dev. 104, 133–138. doi:10.1016/s0925-4773(01)00369-0
Christ, B., Huang, R., and Scaal, M. (2007). Amniote somite derivatives. Dev. Dyn. 236, 2382–2396. doi:10.1002/dvdy.21189
Christ, B., and Scaal, M. (2008). Formation and differentiation of avian somite derivatives. Adv. Exp. Med. Biol. 638, 1–41. doi:10.1007/978-0-387-09606-3_1
Dubrulle, J., McGrew, M. J., and Pourquie, O. (2001). FGF signaling controls somite boundary position and regulates segmentation clock control of spatiotemporal Hox gene activation. Cell. 106, 219–232. doi:10.1016/s0092-8674(01)00437-8
Filipe, M., Goncalves, L., Bento, M., Silva, A. C., and Belo, J. A. (2006). Comparative expression of mouse and chicken Shisa homologues during early development. Dev. Dyn. 235, 2567–2573. doi:10.1002/dvdy.20862
Fu, L., Hu, Y., Song, M., Liu, Z., Zhang, W., Yu, F. X., et al. (2019). Up-regulation of FOXD1 by YAP alleviates senescence and osteoarthritis. PLoS Biol. 17, e3000201. doi:10.1371/journal.pbio.3000201
Gandhi, S., and Bronner, M. E. (2018). Insights into neural crest development from studies of avian embryos. Int. J. Dev. Biol. 62, 183–194. doi:10.1387/ijdb.180038sg
Griffiths, J. A., Scialdone, A., and Marioni, J. C. (2018). Using single-cell genomics to understand developmental processes and cell fate decisions. Mol. Syst. Biol. 14, e8046. doi:10.15252/msb.20178046
Gros, J., Scaal, M., and Marcelle, C. (2004). A two-step mechanism for myotome formation in chick. Dev. Cell. 6, 875–882. doi:10.1016/j.devcel.2004.05.006
Guillot, C., Djeffal, Y., Michaut, A., Rabe, B., and Pourquie, O. (2021). Dynamics of primitive streak regression controls the fate of neuromesodermal progenitors in the chicken embryo. Elife 10, e64819. doi:10.7554/eLife.64819
Hamburger, V., and Hamilton, H. L. (1992). A series of normal stages in the development of the chick embryo. 1951. Dev. Dyn. 195, 231–272. doi:10.1002/aja.1001950404
Henrique, D., Abranches, E., Verrier, L., and Storey, K. G. (2015). Neuromesodermal progenitors and the making of the spinal cord. Development 142, 2864–2875. doi:10.1242/dev.119768
Ibarra-Soria, X., Thierion, E., Mok, G. F., Munsterberg, A. E., Odom, D. T., and Marioni, J. C. (2023) A transcriptional and regulatory map of mouse somitogenesis.
Iimura, T., Yang, X., Weijer, C. J., and Pourquie, O. (2007). Dual mode of paraxial mesoderm formation during chick gastrulation. Proc. Natl. Acad. Sci. U. S. A. 104, 2744–2749. doi:10.1073/pnas.0610997104
Imhof, B. A., Ballet, R., Hammel, P., Jemelin, S., Garrido-Urbani, S., Ikeya, M., et al. (2020). Olfactomedin-like 3 promotes PDGF-dependent pericyte proliferation and migration during embryonic blood vessel formation. FASEB J. 34, 15559–15576. doi:10.1096/fj.202000751RR
Inomata, H., Haraguchi, T., and Sasai, Y. (2008). Robust stability of the embryonic axial pattern requires a secreted scaffold for chordin degradation. Cell. 134, 854–865. doi:10.1016/j.cell.2008.07.008
Jaffredo, T., Bollerot, K., Sugiyama, D., Gautier, R., and Drevon, C. (2005). Tracing the hemangioblast during embryogenesis: developmental relationships between endothelial and hematopoietic cells. Int. J. Dev. Biol. 49, 269–277. doi:10.1387/ijdb.041948tj
Javerzat, S., Franco, M., Herbert, J., Platonova, N., Peille, A. L., Pantesco, V., et al. (2009). Correlating global gene regulation to angiogenesis in the developing chick extra-embryonic vascular system. PLoS One 4, e7856. doi:10.1371/journal.pone.0007856
Jin, Y., and Li, J. L. (2019). Olfactomedin-like 3: possible functions in embryonic development and tumorigenesis. Chin. Med. J. Engl. 132, 1733–1738. doi:10.1097/CM9.0000000000000309
Joshi, P., Darr, A. J., and Skromne, I. (2019). CDX4 regulates the progression of neural maturation in the spinal cord. Dev. Biol. 449, 132–142. doi:10.1016/j.ydbio.2019.02.014
Junker, J. P., Noel, E. S., Guryev, V., Peterson, K. A., Shah, G., Huisken, J., et al. (2014). Genome-wide RNA Tomography in the zebrafish embryo. Cell. 159, 662–675. doi:10.1016/j.cell.2014.09.038
Koga, M., Matsuda, M., Kawamura, T., Sogo, T., Shigeno, A., Nishida, E., et al. (2014). Foxd1 is a mediator and indicator of the cell reprogramming process. Nat. Commun. 5, 3197. doi:10.1038/ncomms4197
Kruse, F., Junker, J. P., van Oudenaarden, A., and Bakkers, J. (2016). Tomo-seq: a method to obtain genome-wide expression data with spatial resolution. Methods Cell. Biol. 135, 299–307. doi:10.1016/bs.mcb.2016.01.006
Lobjois, V., Benazeraf, B., Bertrand, N., Medevielle, F., and Pituello, F. (2004). Specific regulation of cyclins D1 and D2 by FGF and Shh signaling coordinates cell cycle progression, patterning, and differentiation during early steps of spinal cord development. Dev. Biol. 273, 195–209. doi:10.1016/j.ydbio.2004.05.031
Macaulay, I. C., Haerty, W., Kumar, P., Li, Y. I., Hu, T. X., Teng, M. J., et al. (2015). G&T-seq: parallel sequencing of single-cell genomes and transcriptomes. Nat. Methods 12, 519–522. doi:10.1038/nmeth.3370
McColl, J., Mok, G. F., Lippert, A. H., Ponjavic, A., Muresan, L., and Munsterberg, A. (2018). 4D imaging reveals stage dependent random and directed cell motion during somite morphogenesis. Sci. Rep. 8, 12644. doi:10.1038/s41598-018-31014-3
McKeown, S. J., Lee, V. M., Bronner-Fraser, M., Newgreen, D. F., and Farlie, P. G. (2005). Sox10 overexpression induces neural crest-like cells from all dorsoventral levels of the neural tube but inhibits differentiation. Dev. Dyn. 233, 430–444. doi:10.1002/dvdy.20341
Minko, K., Bollerot, K., Drevon, C., Hallais, M. F., and Jaffredo, T. (2003). From mesoderm to blood islands: patterns of key molecules during yolk sac erythropoiesis. Gene Expr. Patterns 3, 261–272. doi:10.1016/s1567-133x(03)00053-x
Mok, G. F., Folkes, L., Weldon, S. A., Maniou, E., Martinez-Heredia, V., Godden, A. M., et al. (2021). Characterising open chromatin in chick embryos identifies cis-regulatory elements important for paraxial mesoderm formation and axis extension. Nat. Commun. 12, 1157. doi:10.1038/s41467-021-21426-7
Moris, N., Martinez Arias, A., and Steventon, B. (2020). Experimental embryology of gastrulation: pluripotent stem cells as a new model system. Curr. Opin. Genet. Dev. 64, 78–83. doi:10.1016/j.gde.2020.05.031
Nielsen, C., Murtaugh, L. C., Chyung, J. C., Lassar, A., and Roberts, D. J. (2001). Gizzard formation and the role of Bapx1. Dev. Biol. 231, 164–174. doi:10.1006/dbio.2000.0151
Nimmagadda, S., Geetha Loganathan, P., Huang, R., Scaal, M., Schmidt, C., and Christ, B. (2005). BMP4 and noggin control embryonic blood vessel formation by antagonistic regulation of VEGFR-2 (Quek1) expression. Dev. Biol. 280, 100–110. doi:10.1016/j.ydbio.2005.01.005
Olivera-Martinez, I., and Storey, K. G. (2007). Wnt signals provide a timing mechanism for the FGF-retinoid differentiation switch during vertebrate body axis extension. Development 134, 2125–2135. doi:10.1242/dev.000216
Ota, K., Nagai, H., and Sheng, G. (2007). Expression and hypoxic regulation of hif1alpha and hif2alpha during early blood and endothelial cell differentiation in chick. Gene Expr. Patterns 7, 761–766. doi:10.1016/j.modgep.2007.05.007
Pourquie, O. (2004). The chick embryo: a leading model in somitogenesis studies. Mech. Dev. 121, 1069–1079. doi:10.1016/j.mod.2004.05.002
Psychoyos, D., and Stern, C. D. (1996). Fates and migratory routes of primitive streak cells in the chick embryo. Development 122, 1523–1534. doi:10.1242/dev.122.5.1523
Reijntjes, S., Stricker, S., and Mankoo, B. S. (2007). A comparative analysis of Meox1 and Meox2 in the developing somites and limbs of the chick embryo. Int. J. Dev. Biol. 51, 753–759. doi:10.1387/ijdb.072332sr
Riddle, R. D., Johnson, R. L., Laufer, E., and Tabin, C. (1993). Sonic hedgehog mediates the polarizing activity of the ZPA. Cell. 75, 1401–1416. doi:10.1016/0092-8674(93)90626-2
Rito, T., Libby, A. R. G., Demuth, M., and Briscoe, J. (2023) Notochord and axial progenitor generation by timely BMP and NODAL inhibition during vertebrate trunk formation. USA: bioRxiv.
Roy, P., Kumar, B., Shende, A., Singh, A., Meena, A., Ghosal, R., et al. (2013). A genome-wide screen indicates correlation between differentiation and expression of metabolism related genes. PLoS One 8, e63670. doi:10.1371/journal.pone.0063670
Sanaki-Matsumiya, M., Matsuda, M., Gritti, N., Nakaki, F., Sharpe, J., Trivedi, V., et al. (2022). Periodic formation of epithelial somites from human pluripotent stem cells. Nat. Commun. 13, 2325. doi:10.1038/s41467-022-29967-1
Sauka-Spengler, T., and Barembaum, M. (2008). Gain- and loss-of-function approaches in the chick embryo. Methods Cell. Biol. 87, 237–256. doi:10.1016/S0091-679X(08)00212-4
Schubert, F. R., Mootoosamy, R. C., Walters, E. H., Graham, A., Tumiotto, L., Munsterberg, A. E., et al. (2002). Wnt6 marks sites of epithelial transformations in the chick embryo. Mech. Dev. 114, 143–148. doi:10.1016/s0925-4773(02)00039-4
Shukunami, C., Takimoto, A., Miura, S., Nishizaki, Y., and Hiraki, Y. (2008). Chondromodulin-I and tenomodulin are differentially expressed in the avascular mesenchyme during mouse and chick development. Cell. Tissue Res. 332, 111–122. doi:10.1007/s00441-007-0570-8
Stern, C. D. (2005). The chick; a great model system becomes even greater. Dev. Cell. 8, 9–17. doi:10.1016/j.devcel.2004.11.018
Stockdale, F. E., Nikovits, W., and Christ, B. (2000). Molecular and cellular biology of avian somite development. Dev. Dyn. 219, 304–321. doi:10.1002/1097-0177(2000)9999:9999<::AID-DVDY1057>3.0.CO;2-5
Sweetman, D., Wagstaff, L., Cooper, O., Weijer, C., and Munsterberg, A. (2008). The migration of paraxial and lateral plate mesoderm cells emerging from the late primitive streak is controlled by different Wnt signals. BMC Dev. Biol. 8, 63. doi:10.1186/1471-213X-8-63
Tavares, A. T., Izpisuja-Belmonte, J. C., and Rodriguez-Leon, J. (2001). Developmental expression of chick twist and its regulation during limb patterning. Int. J. Dev. Biol. 45, 707–713.
Trevers, K. E., Lu, H. C., Yang, Y., Thiery, A. P., Strobl, A. C., Anderson, C., et al. (2023). A gene regulatory network for neural induction. Elife 12, e73189. doi:10.7554/eLife.73189
Turner, D. A., Girgin, M., Alonso-Crisostomo, L., Trivedi, V., Baillie-Johnson, P., Glodowski, C. R., et al. (2017). Anteroposterior polarity and elongation in the absence of extra-embryonic tissues and of spatially localised signalling in gastruloids: mammalian embryonic organoids. Development 144, 3894–3906. doi:10.1242/dev.150391
Veenvliet, J. V., Bolondi, A., Kretzmer, H., Haut, L., Scholze-Wittler, M., Schifferl, D., et al. (2020). Mouse embryonic stem cells self-organize into trunk-like structures with neural tube and somites. Science 370, eaba4937. doi:10.1126/science.aba4937
Veenvliet, J. V., and Herrmann, B. G. (2021). Modeling mammalian trunk development in a dish. Dev. Biol. 474, 5–15. doi:10.1016/j.ydbio.2020.12.015
Vermillion, K. L., Bacher, R., Tannenbaum, A. P., Swanson, S., Jiang, P., Chu, L. F., et al. (2018). Spatial patterns of gene expression are unveiled in the chick primitive streak by ordering single-cell transcriptomes. Dev. Biol. 439, 30–41. doi:10.1016/j.ydbio.2018.04.007
Weldon, S. A., and Munsterberg, A. E. (2022). Somite development and regionalisation of the vertebral axial skeleton. Semin. Cell. Dev. Biol. 127, 10–16. doi:10.1016/j.semcdb.2021.10.003
Williams, R. M., Lukoseviciute, M., Sauka-Spengler, T., and Bronner, M. E. (2022). Single-cell atlas of early chick development reveals gradual segregation of neural crest lineage from the neural plate border during neurulation. Elife 11, e74464. doi:10.7554/eLife.74464
Wilson, V., Olivera-Martinez, I., and Storey, K. G. (2009). Stem cells, signals and vertebrate body axis extension. Development 136, 1591–1604. doi:10.1242/dev.021246
Wu, C. C., Kruse, F., Vasudevarao, M. D., Junker, J. P., Zebrowski, D. C., Fischer, K., et al. (2016). Spatially resolved genome-wide transcriptional profiling identifies BMP signaling as essential regulator of zebrafish cardiomyocyte regeneration. Dev. Cell. 36, 36–49. doi:10.1016/j.devcel.2015.12.010
Wymeersch, F. J., Wilson, V., and Tsakiridis, A. (2021). Understanding axial progenitor biology in vivo and in vitro. Development 148, dev180612. doi:10.1242/dev.180612
Xiong, F., Ma, W., Benazeraf, B., Mahadevan, L., and Pourquie, O. (2020). Mechanical coupling coordinates the Co-elongation of axial and paraxial tissues in avian embryos. Dev. Cell. 55, 354–366. doi:10.1016/j.devcel.2020.08.007
Yamanaka, Y., Hamidi, S., Yoshioka-Kobayashi, K., Munira, S., Sunadome, K., Zhang, Y., et al. (2023). Reconstituting human somitogenesis in vitro. Nature 614, 509–520. doi:10.1038/s41586-022-05649-2
Yanai, M., Tatsumi, N., Endo, F., and Yokouchi, Y. (2005). Analysis of gene expression patterns in the developing chick liver. Dev. Dyn. 233, 1116–1122. doi:10.1002/dvdy.20413
Yang, X., Dormann, D., Munsterberg, A. E., and Weijer, C. J. (2002). Cell movement patterns during gastrulation in the chick are controlled by positive and negative chemotaxis mediated by FGF4 and FGF8. Dev. Cell. 3, 425–437. doi:10.1016/s1534-5807(02)00256-3
Zhao, H., Tanegashima, K., Ro, H., and Dawid, I. B. (2008). Lrig3 regulates neural crest formation in Xenopus by modulating Fgf and Wnt signaling pathways. Development 135, 1283–1293. doi:10.1242/dev.015073
Keywords: chick embryo, axis extension, somites, single cell RNA-sequencing, RNA-tomography
Citation: Mok GF, Turner S, Smith EL, Mincarelli L, Lister A, Lipscombe J, Uzun V, Haerty W, Macaulay IC and Münsterberg AE (2024) Single cell RNA-sequencing and RNA-tomography of the avian embryo extending body axis. Front. Cell Dev. Biol. 12:1382960. doi: 10.3389/fcell.2024.1382960
Received: 06 February 2024; Accepted: 29 April 2024;
Published: 28 May 2024.
Edited by:
Aimin Liu, The Pennsylvania State University (PSU), United StatesReviewed by:
Tae Hyun Kim, The Pennsylvania State University (PSU), United StatesPeng-Fei Xu, Zhejiang University, China
Amanda Janesick, 10x Genomics, United States
Copyright © 2024 Mok, Turner, Smith, Mincarelli, Lister, Lipscombe, Uzun, Haerty, Macaulay and Münsterberg. This is an open-access article distributed under the terms of the Creative Commons Attribution License (CC BY). The use, distribution or reproduction in other forums is permitted, provided the original author(s) and the copyright owner(s) are credited and that the original publication in this journal is cited, in accordance with accepted academic practice. No use, distribution or reproduction is permitted which does not comply with these terms.
*Correspondence: G. F. Mok, g.mok@uea.ac.uk; I. C. Macaulay, iain.macaulay@earlham.ac.uk; A. E. Münsterberg, a.munsterberg@uea.ac.uk
†Present addresses: S. Turner, Department of Zoology, University of Cambridge, Cambridge, United Kingdom
L. Mincarelli and V. Uzun, Wellcome Sanger Institute, Wellcome Trust Genome Campus, Saffron Walden, United Kingdom